
Abstract
This paper contributes to research on quality drivers in healthcare settings by examining the relationships between patient volume, teaching mission, and process quality in US hospitals. To develop a model that accurately assesses the impact of patient volume and teaching status on quality, we draw on three related research streams pertaining to the volume–quality relationship, the comparative quality of care in teaching and non‐teaching hospitals, and quality drivers in service institutions. We propose the impact of patient volume on process quality varies across hospitals with different teaching intensities. The test of this proposition uses a large data set that measures process quality for treatments for heart attacks and heart failures in all major US hospitals. Our results suggest that, as hospital teaching intensity increases, greater patient volume is associated with decreased process quality. Never before was such a relationship uncovered. This initial finding has important practical implications. First, the regionalization policy of hospitals should be re‐evaluated in light of their teaching function. Second, the root causes for the lower quality scores of large, high resident‐to‐bed ratio teaching hospitals, compared with smaller versions, must be found.
1. Introduction
All service organizations must recognize critical factors that drive their service quality. In a service context such as hospitals, the importance of such an understanding becomes inescapable, because their services literally involve matters of life and death. The relationship between volume and quality thus has been the subject of extensive study and discussion in healthcare operations management, and multiple empirical studies document links between cumulative experience (e.g., production volume, patient volume) and some measure of operational performance improvement (e.g., cost reduction, better quality) (Lapre et al. 2000, Pisano et al. 2001). In healthcare settings, volume can improve clinical quality across a wide range of procedures and conditions (Gaynor et al. 2005, Hannan 1999, Luft et al. 1990).
In addition, the volume of experience leads to greater learning, which is associated with better performance in many industries (Edmondson et al. 2003, Irwin and Klenow 1994, Jarmin 1994, Lapre et al. 2000, Pisano et al. 2001, Sturm 1999). The higher the volume, the more learning occurs, and the better the performance. However, the relationship may not be straightforward in teaching hospitals, which feature a transient workforce, comprised mainly of residents. Every year, teaching hospitals welcome new first‐year residents, and the most senior residents move on to permanent medical positions. Such constant turnover leads to a significant lack of continuity and may disrupt established teams of doctors and other caregivers within the hospitals (Huckman and Barro 2005), yet no research considers the impact of the transient workforce on the relationship among volume, learning, and performance. To address this impact, we pursue the following research question: Does teaching intensity moderate the relationship between patient volume and process quality in a healthcare setting?
Our question is motivated by anecdotal evidence that shows that the concentration of expertise found in large teaching institutions is not necessarily associated with excellence in all aspects of care. For example, some physicians that we interviewed in the context of this research reported that smaller teaching institutions can better control the scope of variability in the quality of care because of the smaller size of their teams. Thus, we predict that the effect of patient volume on process quality depends on teaching intensity. To test this proposition, we have obtained detailed data on patient volume, process quality, and teaching intensity for more than 2000 hospitals across the United States. This massive data set includes hospitals of varied sizes, ownership, and missions.
The results show that for the two heart diseases we study (heart attack and heart failure), hospitals that served a large patient pool and engaged heavily in teaching activities experienced lower process quality than smaller‐volume teaching hospitals. However, non‐teaching hospitals that treated more patients delivered higher process quality than did smaller, non‐teaching hospitals. Therefore, we establish a link between teaching intensity and patient volume and their joint impact of quality. This link has important practical implications; that is, new doctors must be taught, but when the complexities of large‐scale operations coincide with the added burden of teaching and training functions, teaching hospitals suffer a negative effect on process quality. Thus, policymakers should reevaluate the regionalization policy of their hospitals in light of their teaching function. We also emphasize the need to explore the root causes for these low quality scores produced by large teaching hospitals with high resident‐to‐bed ratios.
Unlike prior literature, we focus on process quality, not associated treatment outcomes. That is, we measure internal activities, such as whether a heart attack patient received aspirin, and thus study how well hospitals adhere to standardized measures endorsed as best practices—that is, the interrelated work activities people use because a body of knowledge demonstrates they will yield good patient outcomes (Tucker et al. 2007)—for the treatment of heart attacks and heart failures (Jha et al. 2005). Unlike outcome‐based measures, the performance of well‐defined practices does not depend on patient characteristics but instead focuses solely on hospital staff and their management. Therefore, process measures give us a unique opportunity to understand hospitals' internal operations. In addition, we combine for the first time two quality drivers in a single healthcare study. Previous studies focus on either the link between hospital volume and quality or the link between hospital teaching intensity and quality; we address the important joint impact of hospital volume and hospital teaching mission on quality.
We organize the remainder of this paper as follows. In section 2, we provide a literature review, define a theoretical framework, and derive our hypotheses. We describe our data sources and present our measures in section 3, followed by the econometric model development in section 4. We estimate the model and report the results in section 5, present a numerical analysis in section 6, and discuss the results in section 7. Finally, section 8 concludes and outlines some further research directions.
2. Literature Review and Hypotheses Development
We depict the connections among patient volume, teaching intensity, and process quality in Figure 1. This simple framework enables us to consider the direct effects of patient volume and teaching intensity on process quality (Links 1 and 2), as well as the moderating effect of teaching intensity on the relationship between patient volume and process quality (Link 3).
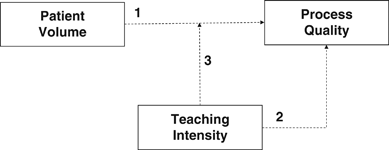
Link 1 refers to the impact of patient volume on process quality; higher patient volume should enhance process quality through the “practice makes perfect” effect (for a comprehensive review, see Luft et al. 1990). According to this effect, quality‐enhancing scale economies and learning‐by‐doing cause large firms to provide better quality. Economies of scale have been widely studied in healthcare, and research advocates the quality benefits of high‐volume hospitals (Gaynor et al. 2005, Ren and Wang 2007). Learning‐by‐doing (or the learning curve) mainly has been studied in manufacturing (Irwin and Klenow 1994, Jarmin 1994, Lapre et al. 2000, Sturm 1999) and healthcare (Edmondson et al. 2003, Pisano et al. 2001) settings as a means to understand the dynamics of production and induce performance progress over time.
However, because organizations that treat large volumes of patients tend to be large institutions, they may be harder to manage than smaller hospitals, especially if they possess bureaucratic or hierarchical cultures that bar quality improvement (Lerner 2007, Pisano et al. 2001, Shortell et al. 1995, Tucker and Edmondson 2003). Large hospitals tend to be organized according to multiple functional medical units; each unit comprises workgroups, and each workgroup has multiple teams. The intensity of the communication and coordination tasks increases dramatically with the size of the organizations, their hierarchies, and their divisions. The challenge of managing such large‐scale operations might deter quality efforts; according to Tucker and Edmondson (2003), large hospitals suffer more errors and service failures due to the complexity of their communication and coordination functions across team members and different functional teams.
Therefore, we combine two conceptual arguments, based on the practice makes perfect hypothesis and the complexity of large‐scale operations, to propose that hospitals that treat smaller volumes of patients benefit significantly from increasing their patient pool. However, hospitals that treat very large patient volumes should experience challenges associated with managing large organizations that outweigh the benefits accrued from large‐scale operations. In this sense, we predict an inverted U‐shaped relationship of volume to process quality.
H1: Hospitals with moderate patient volumes provide better process quality than those with smaller or larger patient volumes.
We also consider the direct impact of hospital teaching intensity on process quality. Teaching institutions foster more concentrated expertise, which should enhance quality (see Ayanian and Weissman 2002, Kupersmith 2005). They also tend to attract talented physicians, because teaching hospitals treat rare diseases, provide specialized services, and conduct biomedical research (Neely and McInturff 1998). Therefore, US News and World Report's listing of America's Best Hospitals (2008) tends to rank major teaching hospitals in the highest positions; of the top 50 hospitals for heart concerns and heart surgery, 36 are major teaching hospitals. Therefore, we expect a positive relationship between a hospital's teaching intensity and its process quality.
H2: Greater involvement in teaching activities is associated with higher process quality for hospitals.
Finally, with Link 3, we illustrate our perspective that the impact of patient volume on process quality depends on hospital teaching intensity, which serves as a moderator. The moderation perspective that we invoke (Venkatraman 1989) implies that no single patient volume policy can be optimal, independent of the hospital organizational context, which is largely dictated by the extent of teaching activities. Instead, quality performance reflects the interaction between patient volume and teaching intensity. Teaching activities shape the hospital work environment, in that they tend to draw the most talented physicians but by design also include many inexperienced practitioners in the form of students (Angst et al. 2010). Thus, teaching hospitals are essential “classrooms” for physicians, nurses, and other health professionals and providers (Stevens 2004). Moreover, as we noted previously, turnover among the residents leads to a significant lack of continuity and a repeated, annual reduction in the average experience of the labor force at teaching hospitals (Huckman and Barro 2005). This loss of accumulated experience (Anderson et al. 1994, Argote and Epple 1990, Heskett et al. 1994, Nelson and Winter 1982) and the need to train newcomers present significant challenges that might mitigate the benefits usually associated with more experience. Thus, we recognize that teaching hospitals could have negative impacts on process quality if they also must manage large‐scale operations and the complexities of a transient workforce.
H3: As hospital teaching intensity increases, an increase in patient volume is associated with a decrease in process quality.
3. Data and Variables
3.1. Data Set Description
The sample for this analysis is a comprehensive data set that we have built by combining three databases that refer to hospitals' performance, characteristics, and demographics. As our main data source, we turn to the hospital quality alliance (HQA), a consortium of public and private groups, which tracks the performance and patient volumes of hospitals nationwide. Led by the American Hospital Association, Federation of American Hospitals, and Association of American Medical Colleges, the HQA attempts to help consumers make informed healthcare decisions and support efforts to improve the quality of US hospitals. The HQA project started as a voluntary public reporting program but grew rapidly after 2003, when the US Congress implemented a financial incentive for participation in its Medicare Modernization Act. As of April 1, 2005, almost all the nation's 4400 major hospitals disclose their quality ratings to the public every quarter. For this study, we used measures that were disclosed in September 2007, and we tracked the performance of 4416 US hospitals during January–December 2006.
Our data set also is cross‐sectional, which implies wide heterogeneity in the hospital characteristics, such as location and ownership type. To control for the potential impact of these attributes on hospital performance, we merge the HQA data set with an external data source, namely, the Historical Inpatient Impact File for Acute Inpatient Prospective Payment System, a database maintained by Centers for Medicare and Medicaid Services to support Medicare payment calculations. The latest Impact File available contains data collected for the 2005 federal fiscal year, including detailed information about hospital capacity and teaching intensity for all Medicare‐certified hospitals.
To control for patient demographics and case complexity, we linked the HQA and Impact File data with the Healthcare Cost and Utilization Project's nationwide inpatient sample (NIS) for 2006. The NIS database, maintained by the Agency for Healthcare Research and Quality (AHRQ), is the largest, all‐payer inpatient care database; it contains discharge‐level data such as patient age, patient discharge status, patient primary diagnosis, and expected primary payer for all inpatient cases at 1045 hospitals in 38 states. For example, this database enabled us to identify patients in each hospital who suffered a heart attack and assess the difficulty of their cases.
We planned to limit our final sample of facilities to those that appeared in all three databases, but merging the databases resulted in a relatively small sample of facilities, mainly because certain states have opted not to provide the hospital identifiers to the NIS database. Therefore, we conducted the study using the merged HQA–Impact File sample (hereafter, HQA–Impact), then validated the model using the sample with all three sources (hereafter, HQA–Impact–NIS). The merger statistics appear in Appendix A.
3.2. Study Variables
Heart attack: (1) aspirin at arrival, (2) aspirin at discharge, (3) β‐blocker at arrival, (4) β‐blocker at discharge, (5) ACE inhibitor or ARB for left ventricular systolic dysfunction, and (6) smoking cessation counseling. Heart failure: (1) left ventricular function assessment, (2) ACE inhibitor for left ventricular systolic dysfunction, (3) smoking cessation counseling, and (4) discharge instructions.
Every hospital reports the number of patient cases eligible for the application of a given measure and the percentage of cases who meet the service criteria (score).
Let N cmh denote the number of patient cases hospital h handles for measure m and condition c, and let S cmh be the associated quality score. For a given condition, the number of patients differs across measures, because there may be a reason a specific patient should not receive a certain treatment. For example, a patient who is allergic to aspirin should not take this medicine, even if suffering from a heart attack. Patients who should not get the recommended care are not included in the sample record and thus excluded from N cmh .
Let m
c
denote the total number of measures pertaining to condition c. It follows that the total number of opportunities, N
ch
, that hospital h had to treat condition c is 
 , for treating condition c in hospital h is
To measure quality, we consider the weighted average quality score per condition for each hospital. Of the N
cmh
patient cases that hospital h handles for condition c, there are  cases that are treated according to best practice. The weighted average quality score for hospital h and condition c is therefore computed as
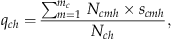
Recent studies (Peterson et al. 2006, Werner and Bradlow 2006) also reveal that process measures can predict hospitals' risk‐adjusted mortality rates, which provides further support for our use of guideline‐based measures to assess hospital quality.
The second specification reflects a continuous measure to assess the number of full‐time residents trained per bed (RESTOBED in the model). The results for both specifications are qualitatively similar, but the continuous measure is conceptually more appealing, because it accurately captures the level of involvement in teaching activities and avoids the loss of information entailed in an ordinal variable. Thus, we adopt the continuous measure.
3.3. Sample Characteristics
The initial sample comprised 4416 hospitals that reported their quality and volume measures in the HQA data set. However, not all hospitals submitted complete data about all the measures, so we could not measure the quality of the hospital accurately for the related condition. Therefore, we dropped hospitals with missing data from our sample. We also excluded hospitals that based their submission on a subset of relevant discharges, which fails to provide information about the total number of patient cases they treated during the study period. Finally, we left out hospitals that reported fewer than 10 patients for a given measure, in that their cases were too few to predict their performance reliably. The HQA sample thus declined to 2819 hospitals for heart attack and 3097 hospitals for heart failure incidents.
The successive merges of the HQA sample with the Impact File and the NIS database further reduced our sample size. The HQA–Impact sample consisted of complete records for 2152 hospitals for heart attack and 2453 hospitals for heart failure; the HQA–Impact–NIS sample included 287 hospitals for heart attack and 300 hospitals for heart failure. The reductions in the HQA–Impact sample size resulted from mismatches in hospital identification numbers between the HQA and Impact File databases. The smaller size of the HQA–Impact–NIS sample reflected the small size of the NIS database and the decision by some states in the NIS database not to provide the hospital identifiers. Therefore, we used the small combined sample only to refine our model with patient demographics and adjust for the complexity of the patient cases.
When we compare the HQA–Impact and HQA–Impact–NIS samples with the total hospital pool, we find the sampled hospitals were reasonably similar to the overall population on several structural dimensions (see Table A2 in Appendix A). The main differences were the lower percentage of small hospitals (19–32% vs. 42%) and higher percentage of major teaching hospitals (7–12% vs. 7%) in the merged samples—probably because we eliminated hospitals with very few cases, which tend to be small, non‐teaching hospitals. In summary, both merged samples appear fairly representative of the total hospital pool.
The descriptive statistics of the study variables for both HQA–Impact and HQA–Impact–NIS samples are in Appendix B. The heart attack treatment has a higher average quality score (93%) than that for heart failure (82%). Standard deviations in quality scores for heart attack are also noticeably lower than those for heart failure. Large variation marks the patient cases and teaching intensities across hospitals, as evidenced by the large standard deviations in volume and resident‐to‐bed ratios. This variance is due to the large size of our sample, which guarantees the inclusion of hospitals of very different sizes and missions. Approximately 35% of hospitals display some level of teaching involvement, with an average of 16 residents for every 100 beds. This average drops to 5–8 residents for every 100 beds, when we consider the total sample, including non‐teaching hospitals.
4. Model Development
The quality scores s
cmh
and the patient cases per measure N
cmh
provided the inputs for computing, for each hospital h and condition c, the total number of cases treated with best practices. Let Y
ch
represent this number, as given by 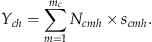
The success pattern of a specific hospital h for a given condition c then depends on the number of successful cases Y
ch
and the total number of eligible cases N
ch
. It would be inappropriate to use the weighted quality score q
ch
as the dependent variable in a classical regression model, because these scores are bound between 0 and 1 and not normally distributed. Instead, we tracked the number of successful cases Y
ch
and modeled the conditional probability p(Y
ch
/N
ch
) of hospital h successfully treating a specific number of cases (Y
ch
) out of the total patient pool (N
ch
). That is, p(Y
ch
/N
ch
) captures the quality of the process; a higher probability of success indicates higher quality. We assumed the success pattern of a hospital h follows a binomial process, so the probability of success p(Y
ch
/N
ch
) of hospital h for condition c is 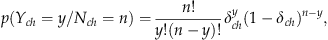
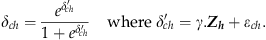
Unlike δ
ch
,  is unbounded and can be interpreted as a raw quality score; the higher
  , the higher is δ
ch
. Moreover,
, the higher is δ
ch
. Moreover,  is driven by a vector of characteristics
5. Model Estimation and Results
We estimated four models using the maximum likelihood estimator, which is an attractive method because it is consistent and asymptotically efficient. Some variables other than teaching intensity and patient volume could affect quality of service too. For example, hospital ownership might influence the organizational structure and the ability to gather qualified resources and thus overall service quality. In estimating our models, we therefore controlled for the following factors:
Location: We use a binary variable (URBAN) to capture possible differences in quality between hospitals in urban areas and those in rural areas. An urban area, as defined by the US Census Bureau (2000), has a core population of at least 2500 and a population density of at least 1000 persons per square mile in its core. In our sample, about 75% of the hospitals are in urban areas. Hospital ownership: We considered three types of hospitals: government‐sponsored, private non‐profit, and for‐profit. We control for potential differences in quality with two binary variables, one for government‐sponsored hospitals (GOVERNMENTAL) and another for private non‐profits (NONPROFIT). The benchmark is for‐profit hospitals. In our sample, 15% of the hospitals are sponsored by the government, 68% are private non‐profits, and 17% are for‐profits. Disease complexity: A hospital that sees only straightforward cases in a specific service line might have better success adhering to the pertinent process guidelines. Therefore, we control for case mix complexity by computing, for each hospital, the average severity of illnesses and average risk of mortality for the patients it treats. Severity of illness refers to the extent to which an organ system loses function; risk of mortality is the likelihood of dying. The four severity and four mortality subclasses, numbered sequentially from 1 to 4, indicate minor, moderate, major, or extreme levels, respectively. In our sample, the average severity of illness and mortality risk both were 2.26, or a little higher than moderate. However, some hospitals treat a very complex patient pool, and their average score indicates major organ system losses or mortality risks. Because the average scores for severity of illness and risk of mortality are highly correlated (i.e., the correlation coefficient for heart attacks=0.790, p<.001; heart failure=0.713, p<.001), we use only one score in each model, that is, the risk of mortality index. The results were similar for both measures. Patient demographics: We controlled for patient age, patient gender, and Medicaid or Medicare as the primary payment source. Gender is a binary variable: 0 for male and 1 for female. The patient age and gender variables become average values at the hospital level. The Medicaid variable provides a proxy for the patient's socioeconomic status, computed as the ratio of Medicaid admissions to total admissions. On average, 6% of hospital admissions are paid for by Medicaid. The Medicare variable similarly is the ratio of Medicare admissions to total admissions; approximately two‐thirds of cardiac patients are Medicare patients.
The correlation coefficients for all variables included in the model are similar for both heart diseases and are given in Appendix D for heart attack. An examination of these coefficients indicates that multicollinearity is not present in our model.
In Tables 1a and 1b, we present the results for the HQA–Impact sample. Then, we refine the models with patient demographics and mortality risk using the HQA–Impact–NIS sample. The latter analysis is not shown for space considerations but the results are similar for both samples and are discussed in sections 5.1 and 5.2.
Volume scaled in hundreds of cases.
denotes statistical significance at the 0.1% level.
Volume scaled in hundreds of cases.
denotes statistical significance at the 0.1% level.
To test the appropriateness of the fitted logistic regression and binomial model, we applied the Pearson χ 2 goodness‐of‐fit test. For all four models and two conditions, small probabilities (<0.001) associated with the χ 2 test indicate the logistic response function and binomial model are appropriate.
5.1. Results
Model 1, the base model, incorporates the linear effects of patient volume and teaching intensity on process quality. Consistent with previous studies, when we model patient volume and teaching intensity independently, both result in higher process quality. Model 2 adds a quadratic volume variable,  , and shows that higher volume is associated primarily with increased adherence to selected guideline recommendations, as evidenced by the positive and significant coefficient estimate of the linear volume variable
  . However, economies of scale produce diminishing returns, as evidenced by the negative and significant estimate of the quadratic volume variable,
  . Model 2 thus provides full support to H1: The relationship between patient volume and process quality takes an inverted U‐shape. In our sample, the hospitals that provide the best quality treat 400–500 annual cases, though the exact optimal volume depends on the condition and the sample. Because of the cross‐sectional nature of our sample, we cannot determine whether a volume expansion beyond the optimal threshold causes a decline in quality directly. However, we pinpoint a negative association between patient volume and process quality when patient volume gets too large. Thus, in addition to learning effects, increased volume might negatively reflect on quality, likely due to the challenges and costs associated with managing an increased workload.
Models 1 and 2 also reveal that for the treatment of heart diseases, teaching hospitals offer higher process quality on average than non‐teaching hospitals, as evidenced by the positive and significant coefficient estimate of the resident‐to‐bed ratio variable, in support of H2. This result mirrors previous studies (Allison et al. 2000, Ayanian et al. 1998, Rosenthal et al. 1997) that show patients with heart attack or heart failure who enter a teaching hospital receive better quality care. Teaching hospitals may provide better care for heart diseases because their cardiac treatment teams tend to be concentrated in one medical unit (Ren and Wang 2007), which enables residents, nurses, and other supporting staff to stay in close touch with medical experts and thus facilitates knowledge transmission. For example, Pisano et al. (2001) provide evidence that for an innovative cardiac surgery, hospitals whose entire teams meet regularly with the head surgeon to discuss and debrief patient cases exhibited a relatively rapid rate of learning the procedure.
Model 3 addresses our core research question: whether teaching intensity moderates the relationship between patient volume and process quality. To this end, it includes an interaction term between the moderator (i.e., teaching intensity) and the predictor (i.e., patient volume). For both heart diseases, a significant interaction between teaching intensity and patient volume indicates the moderating effect of teaching intensity on the relationship between patient volume and process quality. The negative sign of the coefficient for the interaction term indicates that as teaching intensity increases, greater patient volume leads to a decreased process quality, in support of H3 for both heart attack and heart failure. Thus, the potential benefits usually associated with an increased patient volume actually are contingent on a hospital's teaching intensity. For hospitals with a teaching intensity below a given threshold, increased patient volume improves process quality, but the reverse is true for hospitals that operate at high (i.e., above a threshold) teaching intensities. The exact value for this threshold depends on the condition and the sample considered and is derived in Equation (C4) (Appendix C).
Finally, the comprehensive Model 4 characterizes the interdependence of patient volume and teaching intensity. The negative sign of the quadratic volume coefficient (γ
cN, 2) reveals concavity in the success rate with respect to volume and the existence of a (patient volume, teaching intensity) pair that maximizes process quality. If  and
and  denote the optimal values for annual patient volume and teaching intensity, respectively, we can apply the first‐order conditions (with respect to volume) to the success rate, as formulated in Equation (C5) in Appendix C and obtain
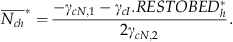
As Equation (7) shows, optimal patient volume and teaching intensity are linearly dependent on each other: The greater the volume treated, the lower the teaching intensity, and vice versa. Note that Model 4 provides the best fit, as evidenced by both the Akaike Information and the Schwarz Bayesian Criteria (i.e., the lower the better).
5.2. Control Variables
Our models also explain alternative characteristics that affect the quality of care. Hospital ownership seems to have a consistent effect on process quality. In all four models and two conditions, non‐profit hospitals perform better than for‐profit private hospitals. It seems that the association of profit making with the supply of medical services produces defects in the system, in line with Arrow's (1963) hypothesis that for‐profit hospitals provide a lower quality of care and Jha et al.'s (2005) finding of significantly higher quality among non‐profit hospitals with regard to the treatment of two heart diseases. In contrast, government‐run hospitals tend to have a lower quality of service than private hospitals, though this finding does not hold for the HQA–Impact–NIS sample.
Our model also shows that hospital setting affects quality; urban hospitals consistently outperform their rural counterparts, especially in treating heart attacks. We also find that larger shares of Medicare patients are associated with higher process quality, but the opposite is true for Medicaid patients. This latter result is consistent with previous studies that find quality lacking in Medicaid managed care. For example, Landon (2007) indicates that patients enrolled in Medicaid managed care plans are less likely to achieve good blood pressure control, receive breast cancer screening, or have timely prenatal care than are similar patients enrolled in commercial plans.
Finally, our four models show that in the treatment of heart failure, more complex cases produced better success with regard to adherence to specific process guidelines. This last result is reassuring; processes are followed more closely when the risk of mortality is higher.
5.3. Robustness Check
The high level of significance across most of the model variables raises the question of whether the results may be an outcome of the larger sample size. In support of the validity of our results, they persist in the refined models that use the smaller HQA–Impact–NIS sample. However, to address this issue, we randomly selected one‐fourth of the HQA–Impact sample and tested the hypotheses again (analysis not shown for space considerations). We have also randomly selected one‐fifth and one‐tenth of the HQA–Impact sample and tested our hypotheses. The consistency of the results across the full HQA–Impact sample, the randomly selected samples, and the HQA–Impact–NIS sample strongly support the validity of our results.
6. Numerical Analysis
We provide a numerical example to illustrate hospital performance at various workloads and different teaching intensities. For each condition, we split our hospital sample into three non‐overlapping subsamples of equal size, according to the average patient volume handled. For example, for heart attacks, each subsample consisted of 717 hospitals. Hospitals in the small volume subsample treated an annual average of 20 patient cases, those in the medium volume subsample treated 70 per year, and those in the large volume subsample treated on average 225 patients per year. We plotted for each volume category the predicted process quality (i.e., predicted quality success rate δ ch of the binomial model) against the teaching intensity (Figure 2), on the basis of Equations (6) and (C3). Our control variables coefficients represent non‐profit, non‐governmental, urban hospitals, which account for more than 50% of our total sample.
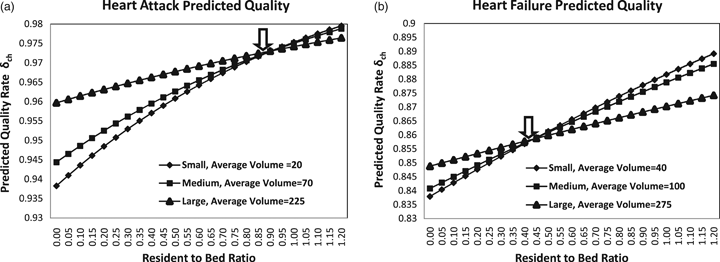
In both Panels a and b of Figure 2, the three quality curves cross, which confirms that large patient volumes are not optimal over the whole range of teaching intensities. For hospitals that maintain a resident‐to‐bed ratio below a certain threshold (0.9 for heart attack, 0.4 for heart failure), the quality of care increases with patient volume, as shown by the relative position of the three curves. The predicted quality rates (δ ch ) of large non‐teaching hospitals are greater than those of small non‐teaching hospitals by 1–2 percentage points. The inverse relationship marks hospitals with high resident‐to‐bed ratios, whose predicted quality rates are greater for small compared with large teaching hospitals by 0.5–1.6 percentage points. The exact values of the predicted quality rates depend on the specific categorization adopted, but the essence of these results remains valid for different categorizations.
We also tried grouping hospitals according to their total number of beds, defining small hospitals as those with fewer than 100 beds, medium ones as those with 100–400 beds, and large hospitals as those with more than 400 beds. For the two heart diseases, the three curves still cross, at the teaching intensity points of 0.8 for heart attack and 0.2 for heart failure.
Next, we simulated the marginal effect of admitting an extra resident per 100 beds on the predicted quality in non‐teaching hospitals, using Equation (C6) (Appendix C) and the estimated coefficients from Model 4 (Tables 1a and 1b).
As we show in Figure 3, Panel a, the marginal effect of an extra resident per 100 beds on the predicted quality success rate  decreases linearly with volume. For hospitals that handle more than 500 patient cases per year, this marginal effect becomes negative, which shows that additional residents have a negative impact on quality in large‐scale operations. To assess the magnitude of this impact, we consider a non‐teaching hospital (RESTOBED=0) and compute its predicted quality rate δ
ch
as a function of its patient volume, based on Equations (6) and (C5) (Appendix C). The control variables coefficients represent non‐profit, non‐governmental, urban hospitals. We thus computed the predicted quality rate δ
ch
as a function of patient volume after the hospital increased its resident‐to‐bed ratio to one resident per 100 beds. In Figure 3, Panel b, we plot the percentage change in predicted quality rates following this increase; non‐teaching hospitals that treat small patient volumes increase their treatment quality by 0.02–0.06 percentage point, but non‐teaching hospitals that treat large patient volumes negatively affect their quality by about 0.01% for every additional resident per 100 beds.
decreases linearly with volume. For hospitals that handle more than 500 patient cases per year, this marginal effect becomes negative, which shows that additional residents have a negative impact on quality in large‐scale operations. To assess the magnitude of this impact, we consider a non‐teaching hospital (RESTOBED=0) and compute its predicted quality rate δ
ch
as a function of its patient volume, based on Equations (6) and (C5) (Appendix C). The control variables coefficients represent non‐profit, non‐governmental, urban hospitals. We thus computed the predicted quality rate δ
ch
as a function of patient volume after the hospital increased its resident‐to‐bed ratio to one resident per 100 beds. In Figure 3, Panel b, we plot the percentage change in predicted quality rates following this increase; non‐teaching hospitals that treat small patient volumes increase their treatment quality by 0.02–0.06 percentage point, but non‐teaching hospitals that treat large patient volumes negatively affect their quality by about 0.01% for every additional resident per 100 beds.

7. Discussion and Implications
Our analysis thus provides evidence that hospitals that serve a large patient pool while also heavily engaging in teaching activities provide lower quality than smaller‐volume teaching hospitals. This finding has several practical implications.
First, the regionalization of hospital services must be reconsidered in light of the teaching intensity of the hospital to which services are being redirected. In the past decade, to reduce medical errors and improve the quality of healthcare, public policy has been to refer patients to high‐volume healthcare providers (US Department of Health and Human Services 2001) in a specific geographic region. For example, the Leapfrog Group, a large consortium that provides health insurance to more than 22 million people, encourages patients undergoing high‐risk procedures to seek care at high‐volume hospitals (Birkmeyer et al. 1999). Yet our findings show that large volume hospitals do not always perform better than smaller ones; policy makers and hospital managers therefore should address the specifics of a hospital environment in their expansion decisions.
Second, in large‐scale operations, more teaching residents can harm process quality. Many hospitals define themselves as teaching hospitals; they cannot scale up or down their teaching intensity as a function of their volume. However, they need to address the root cause of this deterioration. Specifically, what can large hospitals do to maintain high quality while teaching new doctors? Huckman and Barro (2005) show that teaching hospitals with the highest levels of supervision appear able to avoid adverse impacts of resident turnover on mortality rates, which implies the ratio of full‐time attending physicians to residents (i.e., level of supervision) might be an important predictor of quality. From a policy perspective, it would be interesting to assess whether teaching duties suffer if a system optimally reassigned residents to hospitals, on the basis of those hospital's patient volume.
Third, some hospitals in our sample are outliers, in the sense that they have high patient volume and high teaching intensity but still adhere to process quality. We thus wonder whether the trade‐off between patient volume and teaching intensity is relevant for high‐performing hospitals. We split our HQA–Impact sample into three quality categories for each condition: top performers, not so good quality, and trailers. We applied the models to each quality sample separately (analysis not shown for space considerations); none of the substantive relationships were significant for top performing hospitals for heart attack, but they were significant for the trailing sample. That is, the trade‐off between teaching intensity and patient volume is most relevant for trailing hospitals that are struggling to deliver high quality. This result may reflect Hambrick's (1984) observation that high‐performing organizations suggest ideals, each reflecting the essence of an archetypal success pattern, whereas low‐performing organizations capture the essence of common pitfalls. According to Hambrick (1984), pitfalls that result in low performance come from poorly executed mimicries of a high‐performing organization or poor matches of an ideal strategy with the environment. Further research should examine the top performers in greater detail to identify best practices.
8. Conclusions, Limitations, and Next Steps
Our research examines factors associated with the successful implementation of best practices in US hospitals. Drawing on operations management and medical literature, we investigate the underuse problem in US hospitals for two conditions and provide a fuller description of how patient volume and the extent of the teaching mission affect process quality. Our large and unique data set covers all major US hospitals.
Unlike previous studies, we investigate differences in the patient volume effect on quality across sites with disparate teaching missions. Teaching intensity mediates the relationship between patient volume and process quality, which indicates that simply increasing output may not lead to a superior quality position. As teaching intensity increases, an increase in patient volume is associated with a decrease in process quality. Our research thus contributes to the body of knowledge on volume‐quality studies by showing that the environment influences the ability of an organization to absorb the experience it gains through greater volume.
Our results are most relevant for the healthcare delivery context; we cannot assume they readily generalize to other industries. However, our key findings may apply to manufacturing and service settings characterized by high turnover, the need for teamwork, and best practices. These settings might include law and consulting firms that tend to start most of their new employees in late summer or early fall, as well as cohort turnovers that occur between military units in combat or political administrations.
Yet the results also should be interpreted with several limitations in mind. First, the data we use are aggregated and cannot capture detailed characteristics of hospitals, such as their organizational structure, management, and teamwork. With such data, it would be interesting to investigate the root causes of the lower quality scores we observed in large teaching hospitals. Some anecdotal evidence points in the direction of causal factors such as poor communication. For example, in a recent survey (Pear 2008), the director of the AHRQ noted:
Poor communication is a major source of medical errors. If doctors are not listening carefully, patients may not bring up important information. Patients who do not understand discharge instructions are more likely to be readmitted to the hospital or end up in the emergency room.
However, much more in‐depth comparative work is required to draw specific conclusions about the drivers of quality in hospitals.
Second, we prove that optimal patient volume and teaching intensity are interdependent, but we did not model such simultaneity upfront; rather it emerged as a result of this research. That is, our models reveal the optimality of tuning patient volume to teaching intensity or vice versa. It would be helpful to incorporate this dependency into models that address the causal relationships among patient volume, teaching intensity, and process quality. The significant but low correlations between patient volume and teaching intensity (0.274 for heart attack, 0.355 for heart failure, Table D1) also show that hospitals currently do not align these variables, which supports their use as independent variables in our models.
Third, with our data, we cannot control for specialization focus. Smaller teaching hospitals may be more focused on treating a particular disease; therefore, further research should expand our data set and include control variables for specialty hospitals to determine whether our findings hold.
Fourth, our quality scores refer to how well hospitals apply established procedures; they do not involve the final outcome of the treatment. Validated measures of processes of care and clinical outcomes would offer more unified analyses and more compelling evaluations of the quality of care, in that they provide information about specific processes that result in better outcomes. Patient safety measures that track hospital‐acquired infections, injuries due to medical care, or healthcare complications are intrinsic components of a hospital's technical quality. Jointly assessing these process, outcome, and patient safety measures would provide a better understanding of the quality drivers in healthcare settings. The biggest remaining challenge is the ability to gather detailed outcome and operational measures nationwide. However, considering the consequences of hospital care on people's health, this effort would be a worthwhile endeavor.
Footnotes
Appendices
Acknowledgments
The authors would like to thank Janelle Heineke, Michael Shwartz, Joseph Restuccia, as well as the editor, associate editor, and reviewers for their valuable comments and suggestions, which have considerably improved the paper. The second author acknowledges support by the Boston University School of Management Dean's Research Fellow Program.