
Abstract
Bucket brigade order picking is a method for retrieving orders from a storage rack where workers follow a fixed sequence and dynamically adjust to variability in work content along the rack. The method is simple and has been shown to provide superior performance in many applications. In this article, we analyze how the location in which products are stored in the rack affects throughput. We identify conditions where storage decisions have a large impact on throughput (e.g., a 20% increase in productivity) and conditions where the impact is minimal. Conditions associated with high impact are high variation in worker skill, high variation in SKU volume, and a moderate level of walking‐to‐picking work content per pick list.
Introduction
A bucket brigade is a decentralized method for organizing sequential tasks performed by a group of workers. It operates according to the following rule: each worker moves forward completing tasks in sequence until the work is complete or another worker takes over, at which point the worker reverses direction to take over work from the upstream worker, or in the case of the worker in the first position, begins work on the first task of a new job. Bucket brigades are used in a variety of applications, including manufacturing, food preparation, and warehousing.
This article examines a bucket brigade system for order picking in a warehouse. A group of workers is assigned to pick orders from a storage rack. The manner in which products are located in the storage rack is reflected in a storage bay activity profile (e.g., the distribution of products over the storage rack). Pick lists, which list the items to be picked and placed in a tote, are printed at one end of the storage rack, say the left end. The items in a pick list are sorted by location in the storage rack, from left to right. A worker picks items in the list from top to bottom while moving forward (to the right) along the rack, with periodic hand‐offs of partially completed pick lists as dictated by the bucket brigade protocol noted above.
There is growing interest and use of bucket brigades in warehousing. Bartholdi et al. (2001) describe an implementation at Revco Drugs where pick rates improved by more than 30%. Bartholdi and Eisenstein (2005) report similar improvements in a variety of order picking operations (e.g., McGraw‐Hill, MusicLand Group, Harcourt‐Brace, Blockbuster Music). However, a potential weakness of bucket brigades is their susceptibility to blocking. Because workers maintain their relative positions (i.e., do not pass one another) in a bucket brigade, blocking occurs when an upstream worker is forced to wait behind his adjacent downstream worker who is in the midst of picking an item from the rack. Reducing blocking in a bucket brigade increases throughput and provides advantages related to the stability of work performed by each worker. Ordering workers from slowest‐to‐fastest in a bucket brigade helps to minimize blocking and improve stability relative to alternative orderings (Bartholdi and Eisenstein 1996, Bartholdi et al. 1999, 2001).
In practice, two possible conveyor configurations can be used to move orders (i.e., totes) from the start to the end of a pick line. In one configuration, two conveyers—one passive and one active—run along the entire pick line. The passive conveyor is used to hold partially completed orders while the active conveyor is used to transport completed orders away to the end of the line. In this configuration, an order can leave the line as soon as it is completed, without being passed from picker to picker to the end of the line. For example, if an order requires only items in the first few sections of the line, the first worker might be able to complete the order and place it onto the active conveyor to convey it to the end of the line. In another configuration, only one passive conveyor runs along the entire pick line. Every order must be moved along the passive conveyor from picker to picker to the end of the line. As an initial study on storage assignment in a bucket brigade line, we limit the scope to a passive conveyor along a pick line.
In this article, we study how management's storage assignment policy affects the throughput of a bucket brigade order picking system in an order fulfillment warehouse. We refer to the manner in which SKUs are distributed in the storage rack as the storage bay activity profile. For example, a uniform storage bay activity profile means that slow, medium, and fast‐moving SKUs are evenly dispersed throughout the rack. Alternatively, a storage bay activity profile may be skewed with slow movers concentrated at the beginning of the rack and fast movers concentrated at the end of the rack (end‐loaded), or vice versa (front‐loaded). Methods for storing items in a warehouse have been studied extensively under traditional rack‐and‐aisle order picking systems but have not been considered in the bucket brigade literature.
The next section summarizes the related literature. Section 3 presents a deterministic and continuous model of a bucket brigade order picking system. We examine the degree to which throughput is affected by the choice of storage bay activity profile. Section 4 reports the results from simulation experiments designed to test the predictions of the deterministic model in more realistic settings. Section 5 summarizes the managerial implications from our analysis.
Related Literature
Bartholdi and Eisenstein (1996) define and analyze the first formal model of a bucket brigade system. The model, which is motivated by a serial production line, assumes deterministic work requirements at each work station and instantaneous walk times. Bartholdi et al. (1999) analyze the asymptotic behavior of this model for the cases of two and three workers.
Bartholdi et al. (2001) extend the Bartholdi and Eisenstein (1996) deterministic model by introducing random processing times. The task time for each worker at each work station is drawn from an exponential distribution. In the context of order picking in a warehouse, a work station in a production line is analogous to a particular section of a storage rack. The authors show that the dynamics of the stochastic model are similar to that of the deterministic model as long as there is a sufficient number of work stations and workers are ordered from slowest‐to‐fastest.
Bartholdi and Eisenstein (2005) extend their earlier deterministic model (Bartholdi and Eisenstein 1996) to account for walk‐back times and the time required for a hand‐off between two workers. The motivating application comes from a production environment that, relative to the literature, is distinct with respect to the significance of walk‐back and hand‐off times. The authors show that the work content of each worker stabilizes to a fixed set of tasks, which enhances learning. This is a key effect that led to a higher production rate when a firm switched from a craft assembly system with no walk‐back or hand‐off times to a bucket brigade.
The above models assume that relative worker speeds are constant over the production line or storage rack. Armbruster and Gel (2006) study a deterministic model of a bucket brigade production line with two workers. One worker is faster over one part of the line and slower over the other part of the line. They investigate the dynamics of the system to identify conditions under which the work content of each worker stabilizes, and how throughput is affected by various implementation decisions.
Doerr et al. (2002) propose a conceptual model that relates the effects of work‐flow policies and worker attributes on the performance of flow lines. Using their model, they suggest four propositions, which are tested in a series of laboratory experiments reported in Doerr et al. (2004). In their experiments, they use students as workers in a simulated order picking line, with an average difference of 25% between the fastest and slowest pickers. They observe that work sharing increases worker heterogeneity and within‐worker variability during the performance of the tasks. Contrary to popular belief, they find that work sharing did not perform significantly better than fixed work assignments. Given that the heterogeneity among the students is small, their results can only suggest that work sharing is as good as fixed work assignment when worker heterogeneity is small. In an actual workplace where worker heterogeneity is high, work sharing may offer significant advantages over fixed work assignments (Bartholdi and Eisenstein 2006).
A number of researchers have studied methods for assigning products to locations in a warehouse using traditional rack‐and‐aisle order picking systems (see Chen et al. 2010 for a general evaluative framework). Rosenblatt and Eynan (1989) and Eynan and Rosenblatt (1994) develop methods for identifying boundaries of product classes in a warehouse with an automated storage and retrieval system. Products in a class have similar turnover rates. Jarvis and McDowell (1991) study methods for storing items in a warehouse so that the average order picking time is minimized. They assume that there is a wall at the end of the racks (i.e., only one way to each rack) and show that stocking SKUs in decreasing order of volume from the beginning of the rack minimizes in and out travel distance. Each pick list contains a single order. Ruben and Jacobs (1999) propose heuristics for constructing pick lists with multiple orders and evaluate performance over alternative item storage methods from the literature. They find that batching of orders on pick lists can significantly improve throughput. Petersen and Schmenner (1999) investigate procedures for product storage and routing pickers. They find that the right combination of routing and storage procedures can significantly improve picking efficiency. All of these articles focus on methods to reduce distance and, hence, picking time. Our study also considers picking efficiency, but is specific to a bucket brigade order picking protocol.
Deterministic Model and Results
We begin this section with an overview of our model and analysis. We introduce a deterministic and continuous model of a bucket brigade order picking system. A pick line is actually discrete, but we model the line as a smooth continuum. We investigate how the storage bay activity profile affects the throughput, and we model the product line Pareto curve as a power distribution to describe various activity profiles easily. Pick lists are retrieved at the start of the pick line, and completed orders are deposited at the end of the line. Delays due to hand‐offs of an order are ignored. A worker's walking and picking is described by a single velocity function that is finite, smooth, and continuous in the forward direction, and infinite in the backward direction. This velocity function incorporates the unique pick and walk rates for each worker. To estimate the production rate of the pick line, we need to understand the portion of the line each worker picks, since a worker's productivity depends on the density of picks where he is picking. Our model converges to a fixed point, and we analyze how throughput at the fixed point is affected by the activity profile and other factors. In section 4, we test and illuminate the attributes and short‐comings of our deterministic model using a simulation. In section 5, we offer conclusions and managerial guidelines. All proofs are located in the .
Storage Bay Activity Profile
Suppose that the firm's SKUs in the storage rack are sorted from highest‐to‐lowest volume. The corresponding cumulative distribution function (CDF) is the Pareto curve of the SKUs in the storage rack. We assume that the Pareto curve is a power distribution, i.e.,
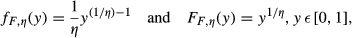
We normalize the length of the storage rack to 1 and we let the function f(y) denote the storage bay activity profile, i.e., f(y) defines relative intensity of picking activity as a function of location y on the storage rack. For example, f(y) = f
F,η
(y) corresponds to a front‐loaded profile where SKUs are stocked in the rack in order of decreasing volume. Reflecting f
F,η
(y) about the vertical axis at y = 0.5, we get
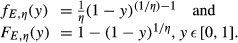
Thus, f(y) = f E,η (y) corresponds to an end‐loaded profile where SKUs are stocked in the rack in order of increasing volume. And f(y) = f U (y) = 1, y ∈ [0, 1] corresponds to a uniform storage bay activity profile, i.e., low‐, middle‐, and high‐volume products are evenly mixed in the rack so the picking intensity by location is constant. For a given degree of volume variation among SKUs in the rack as measured by η, the functions f F,η (y), f E,η (y), and f U (y) represent two extreme profiles and a profile centered between the extremes.
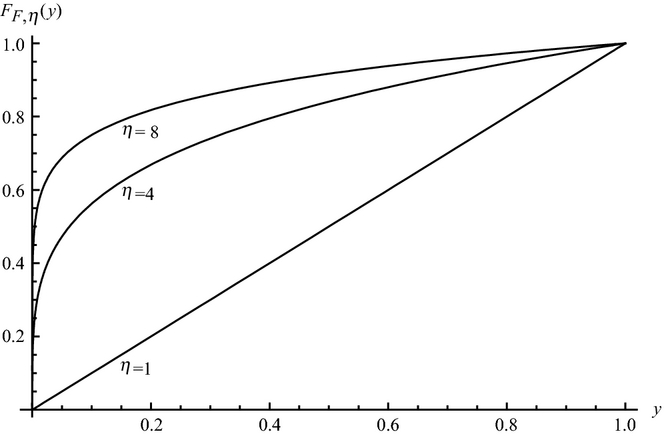
Pareto Curve of the Product Line as a Power Distribution, F F,η (y) = y 1/η , for η ∈ {1, 4, 8}
The velocity function for a worker depends on his walking and picking speeds and the activity profile. We begin by introducing parameters that reflect walking and picking productivity in real‐world discrete pick lines. Then, via a set of modeling assumptions, we explain the role of these parameters in worker velocity functions that are smooth and continuous.
Notation
n number of workers in the bucket brigade team
q average number of SKUs in a pick list
p i pick time per SKU for worker i
w i time required for worker i to walk the length of the storage rack
In addition, we find it useful to define a standard by which to measure against. Any worker can be used as the standard, although we use the average as it is most convenient, i.e.,

From above, it follows that the standard work content per pick list is 1 + w.
Assumptions
The backward walking velocity of all workers is infinite and there is no delay due to hand‐offs (i.e., instantaneous resets). The storage bay activity profile f(y) is continuous on [0, 1]. Furthermore, there exist numbers b and B such that 0 < b < f(y) < B < ∞ for all y ∈ [0, 1].2
Worker i's picking and walking work content per pick list at location y on the storage rack is deterministic and equal to p
i
qf(y) + w
i
. For any pair of workers i and k, the faster picker is not a slower walker, i.e., p
i
> p
j
implies w
i
≥ w
j
. Each worker has a discernibly different pick time per SKU, and workers are ordered (and indexed) in the bucket brigade from slowest‐to‐fastest, i.e., p
1 > p
2 > … > p
n
and w
1 ≥ w
2≥ … ≥ w
n
.
When worker i is not blocked, his forward velocity as a function of location y ∈ [0, 1] is
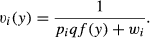
Worker velocity functions are finite, smooth, and continuous in the forward direction, and infinite in the backward direction. The assumption of infinite backward velocity (A1), which is common among bucket brigade models in the literature, is required for analytical tractability of the dynamics of the system. The assumption approximates real‐world settings where backward walking time is small relative to the forward picking and walking time.
Pick list hand‐offs are instantaneous, and workers are ordered in the pick line from slowest‐to‐fastest. When worker n completes a pick list, at the same instant, worker n takes over the pick list of worker n − 1, worker n − 1 takes over the pick list of worker n − 2, …, and worker 1 begins work on a new pick list.
In our model, the locations of hand‐offs over time converge to a unique fixed point. This means that the system converges to a state wherein each worker repeatedly picks over the same unique interval of the pick line. In addition, the clock time invested in each pick list (cycle time) is identical across workers and consequently results in a perfectly balanced line with no idle time.
If A1–A5 hold, then the system converges to a unique fixed point.
In this subsection, we characterize the throughput at the fixed point, and we investigate the relationship between throughput and the storage bay activity profile. We identify conditions under which a profile that maximizes throughput can be identified without numerical search. We then illustrate the impact of alternative profiles and other factors on productivity through numerical examples.
We begin with an expression for clock time as a function of beginning and ending physical locations on the storage rack:
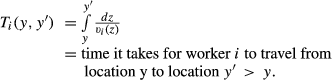
We let


The storage bay activity profile determines the relative intensity of picking to total work content at various locations along the storage rack. The optimal profile solves

If picking is a dominant task, i.e.,


Recall that we assume consistency in task performance differences among workers (see A4), i.e., the faster picker is not a slower walker. This assumption plays a role in assuring that the system converges to a fixed point. Conditions (5) and (6) go a step further by identifying the two possible cases where there is a dominant task that distinguishes the faster worker from the slower worker. In the case of (5), the dominant task is picking (e.g., for any pair of workers, the relative difference in picking speed dominates the relative difference in walking speed). In the case of (6), the dominant task is walking. In settings where (5) or (6) hold, throughput is maximized with a profile that assigns the highest possible intensity of the dominant task to the fastest worker, the second highest possible intensity of the dominant task to the second fastest worker, and so on. An end‐loaded profile maximizes the intensity of picking activity for the fastest worker and is thus optimal under (6), whereas a front‐loaded profile maximizes the intensity of walking activity for the fastest worker and is thus optimal under (6). We note that either (5) or (6) is assured to hold when there are two workers.
It is worth emphasizing the practical importance of the throughput rate expression given in (4). For teams of workers where the problem of identifying the optimal profile is not readily apparent (i.e., neither condition (5) nor (6) holds), the expression can be used by managers to develop a sense of a profile that is likely to work well for a particular worker group (e.g., via trial and error).
We next examine the impact of the profile and other factors on throughput. The throughput can be found from (4), e.g., numerically. The storage bay activity profile influences the allocation of picking and walking tasks among workers, and allows for specialization of labor (e.g., by assigning faster pickers to sections of the rack where there are an above‐average number of picks required). Indeed, if the inequalities in (5) and (6) are replaced with an equal sign (i.e., all workers are identical), then changes in the profile have no impact on the throughput rate. The extent to which specialization of labor can improve throughput is affected by three factors: (i) the degree of skew in the profile as indicated by product volume variation η, (ii) the ratio of walking‐to‐picking work content, and (iii) the variation in worker skill.
We let the number of workers range from two to four. We consider the case where picking is the dominant task (i.e., condition (5) applies) and all workers walk at the same speed, and the case where walking is the dominant task (i.e., condition (6) applies) and all workers pick at the same speed. We compute the percentage increase in throughput when changing from a uniform profile, which maintains constant relative picking and walking intensities over the rack and consequently does not exploit specialization of labor, to the optimal profile (i.e., end‐loaded when picking is the dominant task and front‐loaded when walking is the dominant task).
Figure 2 shows the results for a bucket brigade with three workers where picking is the dominant task. The figure is representative of the results in other settings. In particular, we find that the results with two or four workers are nearly identical to the results with three workers, and the curves are very similar when walking is the dominant task. Figure 2 illustrates that the sensitivity of throughput to changes in profile increases as the variation in worker skill levels increases. If there is no variation in worker skill levels, then changes in the profile will have no impact on throughput. Also, the sensitivity of throughput to changes in profile increases as the degree of volume variation in the product line increases.
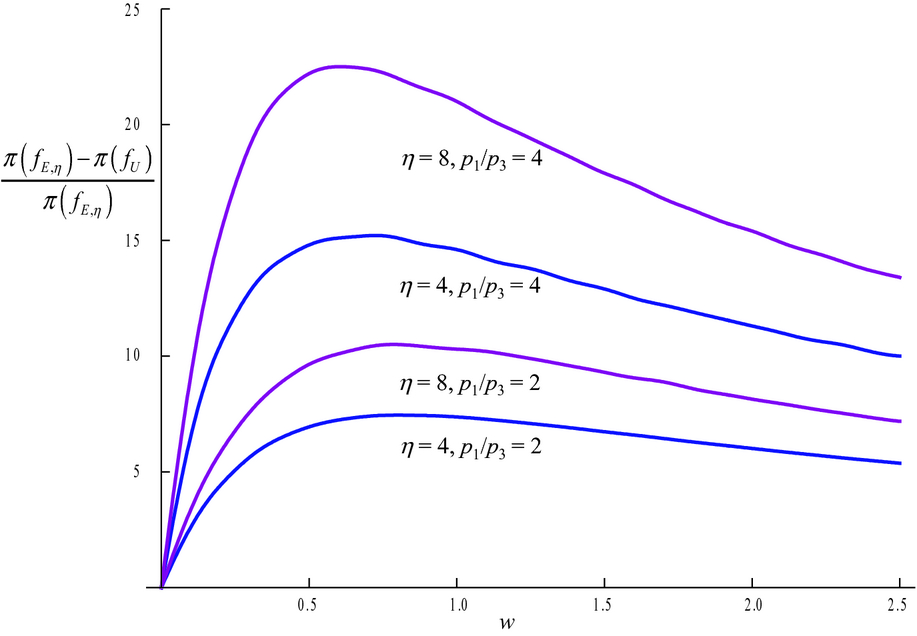
Percentage Increase in Throughput When the Storage Bay Activity Profile Is Changed from Uniform to End‐loaded for Different Degrees of Volume Variation (η = 4, η = 8), Variation in Worker Skill Variation (p 1/p 3 = 2, p 1/p 3 = 4), and the Ratio of Walking‐to‐Picking Work Content (w) in a Three‐Worker Bucket Brigade. Walk Times Are the Same for the Three Workers
Perhaps more interesting is the impact of increasing the walking work content as a fraction of picking work content (indicated by w). If walking‐to‐picking work content is very small, then there is little opportunity to exploit specialization of labor through an end‐loaded profile. Similarly, the impact diminishes as w gets large. For a given set of worker pick times, the degree to which labor specialization is present in a workforce is reflected in the differences in walking and picking times for different workers. At the extremes of no walking work content (w = 0) and no picking work content (w = ∞), there is no opportunity to exploit the differences in walking and picking times, and consequently, changes in the profile have no impact on throughput. The figure shows that the “sweet spot” with respect to the opportunity to exploit specialization of labor through an end‐loaded profile is relatively stable. In particular, the opportunity is greatest when walking work content per pick list is in the neighborhood of 50–70% of picking work content per pick list.
The deterministic bucket brigade model is an idealization of reality. Blocking does not occur and the system converges to a unique fixed point with throughput given by (4). However, in application, blocking can occur because the locations of SKUs in a pick list are discrete and random, e.g., worker i while walking to the next pick location is blocked by worker i + 1 who is in the midst of picking. In general, we can expect incidences of blocking to increase as the number of workers increases. Furthermore, a skewed profile may exacerbate blocking because, relative to a uniform profile, picking tends to be concentrated in a smaller area. In the next section we use simulation to investigate when deterministic model predictions regarding sensitivity of throughput to changes in the profile tend to hold and when they tend to break down.
We developed a discrete event simulation model of a bucket brigade order picking system. Our model consists of a storage rack that is 180 ft long and contains 60 sections. Each section is not meant to represent a physical structure, but rather the amount of space occupied by an individual worker.
Experiments with Random Pick Locations
In this initial set of experiments, the stochastic nature of our simulation model is derived from one source: in forming the pick lists we sample from a discrete version of the appropriate storage bay activity profile to determine the location of each SKU in the storage rack. The number of SKUs in a pick list is held constant as is each worker's pick time/item and walking speed. We assume the standard bucket brigade protocol of preemption and no passing. If a handoff occurs while worker i is engaged in picking, the remaining time to pick the SKU(s) is determined using the prorated picking time of worker i + 1, and worker i immediately walks back to worker i − 1, or in the case of i = 1, to retrieve the next pick list. Further, if worker i arrives at a section of storage rack occupied by worker i + 1, then worker i stands idle until worker i + 1 completes the picking requirements in that section. We assume that the average pick time is a constant 12 seconds/SKU and workers walk at an average rate of 3 ft/seconds. Workers walk at the same speed in the forward and backward directions. The picking and walk times used in the simulation are consistent with empirical observations (Gray et al. 1992).
Recall that our deterministic model assumes infinite backward walking speed to analytically characterize the dynamic behavior. The deterministic throughput computations are based on an average forward walking speed of 1.5 ft/seconds so that work content in both models is identical.
The simulation is initialized in an empty and idle state. Steady state is reached very quickly (typically within the first 20–30 pick lists). The simulation is very efficient, taking approximately 1 second to process 1000 pick lists with a computer running at 1.8 GHz. To be conservative, we fixed the initialization period at 2000 pick lists. After the completion of the initialization period, all performance variables are cleared and the next 5000 pick lists are used to compute the mean throughput in our analysis.
The rack is 180 ft long and workers walk at an average rate of 3 ft/seconds. Consequently, the total walking work content per pick list is the average time required for a worker to walk from the beginning to the end of the rack and back to the beginning, and thus w = 2 × 180 ft ÷ 3 ft/seconds = 120 seconds. We ran the simulation model over the following combinations of parameters: q ∈ {28, 16, 4}, η ∈ {4, 8}, and p i and w i according to Tables 1 and 2. Table 1 corresponds to a scenario where picking is the dominant task and for which an end‐loaded profile is optimal in the deterministic model and Table 2 corresponds to a scenario where walking is the dominant task and for which a front‐loaded profile is optimal in the deterministic model (see Proposition 2). We analyze systems with two to four workers as bucket brigades with two or three workers being common in distribution warehousing (Bartholdi et al. 1999).
Scenario A—Picking Is the Dominant Task
Scenario A—Picking Is the Dominant Task
All workers walk at the same rate (3 ft/second). The values in the table are the ratios of worker pick time to average pick time.
Scenario B—Walking Is the Dominant Task
All workers pick at the same rate (5 SKUs/minute). The values in the table are the ratios of worker walk time to average walk time.
For the values of q ∈ {28, 16, 4}, we have pq ∈ {336, 192, 48}. Selecting the time unit such that pq = 1, we have p ∈ {1/28, 1/16, 1/4} ≈ {0.0357, 0.0625, 0.25} and w ∈ {5/14, 5/8, 5/2} ≈ {0.357, 0.625, 2.5}.
Tables 3 and 4 report the percentage change in throughput according to the simulation and deterministic models when the storage bay activity profile file is changed from uniform to end‐loaded. The correlation between the percentage of direct labor hours spent idle (due to blocking) and the gap between the simulation model and the deterministic model throughput values (Δ) is 99.5%, suggesting that the discrepancy between the deterministic model and the simulation model is due almost solely to blocking.
[π(f
E,4) − π(f
U
)]/π(f
E,4) for Scenario A Where Picking Is the Dominant Task
[π(f E,4) − π(f U )]/π(f E,4) for Scenario A Where Picking Is the Dominant Task
[π(f E,8) − π(f U )]/π(f E,8) for Scenario A Where Picking Is the Dominant Task
Across all experimental cells we find that increasing q tends to increase the amount of blocking as measured by Δ and hence reduces the advantage of a skewed activity profile relative to a uniform profile. This is as expected. A higher q means more picking per pass along the rack which, in turn, results in a higher likelihood of blocking. In addition, the chance of having multiple items to pick from a single location increases, which increases the expected time spent stationary in front of a pick location. However, we often find that the “sweet spot” depicted in Figure 2 more than offsets the impact of blocking. The sweet spot corresponds closely to w = 0.625 (q = 16) in our experimental design. Indeed, the only scenario where this does not occur is when the number of workers and the degree of volume variation are at their maximum and the difference between worker velocities is at its minimum, all conditions that tend to increase blocking. Under this extreme scenario, the firm can reshuffle the SKUs to achieve a more moderate level of skew in the activity profile. For example, stocking products in a rack so that product volumes are approximately consistent with η = 4 results in throughputs that are about 5–6% higher than throughputs under a uniform profile (see the upper right cells of Table 3).
Impact of the Number of Workers, n
Increasing the number of workers will naturally increase throughput. However, as discussed in section 3, the number of workers has a relatively small impact on the expected advantage of implementing a skewed profile. When the degree of volume variation is low, an increase in the number of workers has little impact on blocking and thus little impact on the advantage of a skewed profile. However, when the degree of volume variation is high, work is concentrated in a smaller area and more workers trying to access that area exacerbates blocking significantly. This is an important result as the typical method that managers use to modify throughput to match demand is increasing or decreasing the number of workers on the pick line. Thus, if there is large variability in day‐to‐day demand, a highly skewed profile is not desirable unless it is coupled with a high variation in worker skills as discussed next.
Impact of and Interaction Between Volume Variation, η, and Picking Speed Variation, p 1 /p n
When a high degree of volume variation is coupled with a high degree of skill variation, the expected improvement in throughput of a skewed profile over a uniform profile is at a maximum. This is expected since this combination of conditions maximizes the potential impact of specialization of labor. Furthermore, this combination of factors engenders little blocking (see Table 4) and therefore the bulk of the increase in throughput is retained. Indeed, the simulated throughput improvement associated with changing from a uniform profile to a skewed profile with w = 0.625 hovers around 20% when η = 8 and p 1 /p n = 4. A high degree of variation in pick times either reduces or has no practical effect on blocking across the board as the amount of time spent stationary by the fastest pickers is decreased, which tends to reduce the length of each episode of blocking.
The impact of volume variation is more complicated as it is related to the levels of the other factors. When volume variation is low (e.g., the profile is moderately skewed), work is more spread out, which tends to reduce the incidence of blocking across all factors. Therefore, under these conditions, the deterministic model is a good predictor of throughput. However, the potential gains associated with a higher level of volume variation in the rack and, hence a greater opportunity to exploit specialization of labor, are much higher. When there are two workers, there is little interaction between them and blocking is not a significant factor. However, as management tries to increase throughput by adding more workers, they will find that, under a highly skewed profile, there are diminishing returns associated with each additional worker unless the variation in worker pick times is commensurate with the variation in product volume. The results suggest that a highly skewed profile is more attractive in environments with high worker turnover, which tend to be accompanied by high variation in worker pick times. Turnover is a chronic problem in the warehousing industry (Min 2007). In these environments, there is greater opportunity to exploit specialization of labor through a highly skewed profile as the deleterious effects of blocking tend to be lower.
Experiment Results When Walking Is the Dominant Task (Scenario B)
In this section, we present and discuss results for the scenario where walking is the dominant task (see Table 2 for relative walking speeds). High picking speeds require familiarity with the location of individual SKUs in the rack along with the paperwork associated with picking. In addition, many of these applications use batching of multiple orders, an activity that requires sorting and additional paperwork. Familiarity with these activities is accrued through experience and promotes heterogeneity in picking speeds among the workers. Thus, settings where picking is the dominant task are likely to be more common than settings where walking is the dominant task. However, there may be some scenarios where walking is the dominant task.
Tables 5 and 6 report the percentage change in throughput according to the simulation and deterministic models when the storage bay activity profile file is changed from uniform to front‐loaded. The predictions from the deterministic model are similar to those obtained in Tables 3 and 4. However, blocking tends to increase, in many cases dramatically, over the scenario where picking is the dominant task. The reasons for this are as follows: When work is front‐loaded, there is less of an opportunity for workers to spread out along the line and, hence reduce blocking. Indeed, examination of the detailed results reveals a significant amount of time spent idle in the staging area at the beginning of the line for all but the fastest worker. This condition is exacerbated by variation in walk times as the faster workers return more frequently to take over pick lists.
[π(f
F,4) − π(f
U
)]/π(f
F,4) for Scenario B Where Walking Is the Dominant Task
[π(f F,4) − π(f U )]/π(f F,4) for Scenario B Where Walking Is the Dominant Task
[π(f F,8) − π(f U )]/π(f F,8) for Scenario B Where Walking Is the Dominant Task
Another form of variation that may be encountered in the implementation of bucket brigades is the number of SKUs in each pick list. A common approach to reduce this variation is to combine a number of orders on a single pick list (i.e., batching). Ruben and Jacobs (1999) introduce techniques which produce pick lists with a nearly constant number of SKUs. However, in some instances, orders are physically large enough to preclude batching. In this experiment, the number of items on a pick list is a random variable drawn from a shifted Poisson distribution with mean q ∈ {4, 16, 28}. We shift the distribution by one to avoid empty pick lists while retaining the moments of the distribution. Since picking as the dominant task is more likely in practice, we assume variation in pick times while holding walk time constant As a result, we employ an end‐loaded activity profile.
Comparing Tables 7 and 8 with Tables 3 and 4, we note that the additional source of variability increases blocking and reduces throughput across nearly all experimental factor combinations by a modest amount. The results thus suggest that the conclusions in section 4.1 on conditions under which an end‐loaded profile significantly improves throughput are relatively insensitive to randomness in the number of SKUs per pick list.
[π(f
E,4) − π(f
U
)]/π(f
E,4). The Number of SKUs Per Pick List in the Simulation Is a Poisson Random Variable
[π(f E,4) − π(f U )]/π(f E,4). The Number of SKUs Per Pick List in the Simulation Is a Poisson Random Variable
[π(f E,8) − π(f U )]/π(f E,8). The Number of SKUs Per Pick List in the Simulation Is a Poisson Random Variable
As a final sensitivity analysis we examine the impact of variability in an individual worker's pick time by modeling the time/pick as an exponential random variable with mean values consistent with Table 1. In addition to assessing the impact of within‐worker variability, the experiment allows us to examine the robustness of condition (5). In particular, we can assess the degree to which earlier results change when condition (5) only holds in expectation and there is a non‐zero probability that the condition does not hold in each individual pick list (i.e., picking is not consistently dominant). Comparing Tables 3 and 4 with Tables 9 and 10 indicates that this additional source of variability has virtually no impact on the results.
[π(f
E,4) − π(f
U
)]/π(f
E,4). The Time/Pick in the Simulation Is an Exponential Random Variable
[π(f E,4) − π(f U )]/π(f E,4). The Time/Pick in the Simulation Is an Exponential Random Variable
[π(f E,8) − π(f U )]/π(f E,8). The Time/Pick in the Simulation Is an Exponential Random Variable
We studied the effects of changes in the storage bay activity profile, the size of the workforce, the variation in task times among workers, and the number of items on a pick list on the throughput of a bucket brigade system with workers who are ordered by velocity from slowest‐to‐fastest. Our primary interest is the implications on throughput if a manager changes from a uniform storage bay activity profile to one that is skewed. We began with an analysis of a deterministic and continuous model of the system. The system converges to a fixed point.
According to the deterministic model, if the relative differences in worker picking times dominate the relative differences in worker walking times, then throughput at the fixed point is maximized with products stocked in the rack from lowest‐to‐highest volume, i.e., if picking is the dominant task, then an end‐loaded profile is optimal. On the other hand, if relative differences in walking times dominate relative differences in picking times, then throughput at the fixed point is maximized with products stocked in the rack from highest‐to‐lowest volume, i.e., if walking is the dominant task, then a front‐loaded profile is optimal. In general, the higher the skew in the profile—end‐loaded when picking is dominant and front‐loaded when walking is dominant—the higher the throughput. Task dominance is assured when there are two workers. If there are more than two workers and there is no task dominance, an exhaustive search is required to identify the optimal profile.
We used the deterministic model to study the impact of the profile on the throughput rate. Relative to a uniform profile in which low‐, medium‐, and high‐volume products are evenly dispersed throughout the rack, we found that the percentage increase in throughput due to a skewed profile can be as high as 20% for the parameters that we considered. The result is a consequence of the fact that a skewed profile takes advantage of the variation in worker skill. In addition, the degree to which specialization of labor (i.e., taking advantage of the difference in worker skill via a skewed profile) can increase throughput is affected by the proportion of average walking work content to average picking work content in a pick list. We found that the impact of storage profile on throughput is greatest when the average time taken to walk to the end of the rack and back is in the neighborhood of 50–70% of the average time it takes for a worker to pick the SKUs in a pick list (e.g., 180 ft rack, walking speed of 3 ft/second, average pick time per SKU of 12 seconds, pick lists containing about 16 SKUs).
Our deterministic model ignores the effects of congestion and blocking as the skew of the storage profile increases. We used simulation experiments to test our conclusions in more realistic settings where the locations of each pick are random and discrete. We also considered the effects of introducing variability in the number of items on a pick list and the pick time/SKU.
To provide managers with guidelines on implementing a bucket brigade on a pick line, we conclude by summarizing the main managerial implications of our simulation results below. We focus primarily on the more realistic environments where picking is the dominant task. The conclusions continue to apply in settings where, due to randomness, picking is not consistently the dominant task but is dominant on average. If walking is the dominant task, then a front‐loaded profile, which maximizes throughput when there is no blocking, can significantly exacerbate blocking when compared to the uniform profile. We find that throughput rates for systems with two workers significantly increase (e.g., 5–25%) when shifting to a front‐loaded profile, but the introduction of additional workers with consequent blocking often leads to reductions in throughput. In these settings, a uniform profile is a prudent choice. If picking is the dominant task, then: The rate of increase in throughput when shifting from a uniform to an end‐loaded profile is largest when walking work content per pick list makes up about 50–70% of picking work content. The opportunity to exploit specialization of labor through the end‐loaded profile diminishes as this task ratio moves toward the extremes of very large or very small. Shifting from a uniform profile to a moderately skewed end‐loaded profile (e.g., 80% of the picks in the last 40% of the rack) increases throughput across all experimental cells, and the increase is significant (e.g., 5–15%). Shifting from a moderately skewed end‐loaded profile to a highly skewed end‐loaded profile (e.g., 80% of the picks in the last 20% of the rack) generally increases throughput. Decreases in throughput are more likely to occur as the number of workers increases, the variation in worker skill decreases, and the ratio of walking work content to picking work content per pick list decreases. Building off the previous two conclusions, in scenarios where management finds it necessary to frequently modify the throughput rate by adding or subtracting workers, they will find that a moderately skewed end‐loaded profile is desirable. Relative to a highly skewed profile, a moderately skewed profile creates a greater spread of workers along the pick line and reduces the deleterious effects of blocking as the number of workers is increased. If a highly skewed end‐loaded profile is implemented in this setting, then it must be coupled with a high degree of variation in worker skill to be effective. Managers faced with a large amount of turnover and the necessity of introducing newer and slower workers to the line on a frequent basis will find that a high degree skew in the profile is able to reduce the impact of the slower worker on throughput than otherwise might be expected. This is due to the increase in variation in pick speed among workers in combination with the advantages of specialization of labor that arise in an end‐loaded profile. A higher degree of skill variation tends to make the change from a uniform layout to an end‐loaded profile more advantageous. An increase in the skew of the profile is effective when coupled with a high level of skill variation between workers. As noted above, this tends to occur when either demand is highly variable and/or turnover is high (e.g., workers frequently entering and leaving the pick line).
Footnotes
Appendix
Acknowledgments
We are grateful to the referees and Associate Editor. Their comments and suggestions significantly improved the article. This research was partially supported by the Robert H. Brethen Operations Management Institute at Syracuse University.
1
The power distribution with η = 8 approximates the product line stratification at a firm we are familiar with. The firm has 338 SKUs. There are 25 SKUs per bay and each bay requires about 10 ft. The top 11 SKUs (3.3% of product line) make up 60% of total volume and the top 60 SKUs (17.8% of product line) make up 80% of total volume, e.g., more than 80% of the volume tends to be picked in the first 30 ft of the rack when product is stocked in order of highest‐to‐lowest volume. For comparison, F F,8(3%) = 64.5%, and F F,8(17%) = 80.1%.
2
We note that A2 does not strictly hold for f F,η (y) and f E,η (y) because f F,η (0) = 0 and f E,η (1) = 0. However, A2 does hold after a very slight modification to these functions, e.g., select an infinitesimally small b > 0, and replace f F,η (y) with (f F,η (y) + b)/(1 + b) and replace f E,η (y) with (f E,η (y) + b)/(1 + b).