
Abstract
This paper studies the impact of logistics performance on global bilateral trade. Taking a supply chain perspective, logistics performance refers to cost, time, and complexity in accomplishing import and export activities. We draw on a data set compiled by the World Bank containing specific quantitative metrics of logistics performance in terms of time, cost, and variability in time. Numerous researchers have shown that logistics performance is statistically significantly related to the volume of bilateral trade. Our research calibrates the impact of specific improvements in logistics performance (time, cost, and reliability) on increased trade. Our findings can spur public and private agencies that have direct or indirect influence over logistics performance to focus attention on altering the most relevant aspects of logistics performance to improve their country's ability to compete in today's global economy. Moreover, as our logistics metrics are directly related to operational performance, countries can use these metrics to target actions to improve logistics and monitor their progress.
Introduction
World trade is an important part of the economic development of the global economy. Countries depend on trade to increase sales of their domestic products in global markets, and for emerging economies, trade is an important means for their economic development. Naturally, the volume of trade between two countries depends on the attractiveness of the exporting country and the needs of the importing country. When an importing country has several potential supply sources, the distance and the associated costs of crossing the borders, transporting the goods, and the customs and duties levied are important determinants of the volume of bilateral trade between trading partners.
In this paper, we calibrate the impact of costs and times involved in crossing the border to bring goods from one country to another (i.e., logistics performance) on global trade.
From the importing company's viewpoint, when a company makes sourcing decisions, it often computes the “total landed cost” of the various alternative sources for evaluation. The total landed cost consists of the cost of acquisition, the freight cost, customs and duties, transaction costs, other logistics costs (such as documentation), and inventory holding costs. The inventory holding costs consist of cycle stock, which depends on the frequency of shipments; the pipeline inventory, which depends on the total lead time from source to destination; and the safety stock, which depends on the shipment frequency, the average lead time, and the variability in lead time (or the reliability of shipments). The logistics performance between two countries can be a significant determinant of the total landed cost; thus it can significantly impact the sourcing decision and consequently the level of bilateral trade between trading nations.
From a country's viewpoint, numerous research studies (reviewed below) have shown a high association between improved logistics performance and increased trade. But in almost all cases the metrics used for logistics performance are either indices derived from surveys or more highly aggregated concepts such as “the customs environment.” This research will calibrate logistics performance using fundamental measurable inputs such as the time to complete an export/import transaction (excluding ocean shipping time but including inland transportation time, and all time associated with trade transactions processes); the cost; and a measure of variability in time. One of the authors of this paper, Dr. Uma Subramanian of the World Bank Group developed the conceptual framework and design of the survey for the data used in this research paper. This survey provided the basis for the “Trading Across Borders” indicator of the Doing Business report, World Bank Group that has been producing the data annually since 2006.
The quality and performance of logistics performance differs markedly across countries. In Kazakhstan it takes 81 days to export a 20‐foot full container load (FCL) container of cotton apparel, and in Mauritania 39 days, while in Sweden it takes only 8 days. In Kyrgyz Republic the costs of all trade‐related transactions for importing a 20‐foot FCL container, including inland transport from the ocean vessel to the factory gate, amount to more than $3000, and in Ethiopia to slightly less than $3000 (World Bank Group, 2010). In Germany these costs amount to only $937, and in Sweden to a little more than $700. These variations in time and cost across countries stem from differences in the quality and cost of infrastructure services as well as differences in policies, procedures, and institutions. They have a significant effect on trade competitiveness.
Many empirical studies have examined the effect of logistics performance on trade flows. Limão and Venables (2001) find a robust statistical link between transport costs and international trade flows. They also find a clear link between the quality of infrastructure and transport costs—and thus conclude that infrastructure investments are important for export‐led economic growth.
Other studies find that differences in logistics performance are driven only in part by poor quality of physical infrastructure services such as road, rail, waterways, port services, and interfaces (Subramanian 2001, Subramanian and Arnold 2001). Instead, the inadequacies often are caused by (non‐tariff) policy and institutional constraints—such as procedural red tape, inadequate enforcement of contracts, poor definition and enforcement of rules of engagement, delays in customs, delays at ports and border crossings, pilferage in transit, and highly restrictive protocols on movement of cargo. Consider these differences and their implications for ease of trade: 100% of imports coming into Sri Lanka and nearly 100% coming into Nigeria are subject to comprehensive inspection, while 2% are inspected in Germany and only 1% in Canada. Driven by economic liberalization and technological developments, the decentralization of production, marketing, and distribution activities worldwide offers developing countries tremendous opportunities to participate in world markets. Participating in global supply chains can improve countries’ access to markets and stimulate investment, enhancing employment opportunities. In Bangladesh, for example, the garment sector provides productive employment for more than 1.5 million poor, low‐skilled female workers.
But this decentralized environment also poses strong challenges to developing countries, requiring them to be highly efficient, productive, and capable of providing just‐in‐time services. Effective logistics performance plays an essential role in the worldwide flow of goods and services and in the ability of countries to attract and sustain investment. Inefficiencies in logistics have been highlighted as an important constraint on firms’ productivity and competitiveness in developing countries by earlier studies on investment climate and trade facilitation (“behind the border” issues). Dollar et al. (2004) find that firms in countries with a better investment climate, including better logistics, have a higher probability of exporting to international markets and attracting foreign direct investment. Similarly, Subramanian et al. (2005) find that long customs clearance times have a significant adverse effect on firms’ total factor productivity.
Logistics inefficiencies harm the competitiveness of private firms through their effects on both cost and time. The costs relate not only to the direct costs of transporting products; goods in transit incur indirect costs such as inventory holding costs (see Hausman 2004). The longer the transit time, the higher are the costs. Hummels (2001) finds that shippers are willing to pay a premium for faster delivery, as does Evans and Harrigan (2005).
Other indirect costs are incurred when delivery times and reliability are uncompetitive, severely affecting a country's position in highly competitive international markets demanding just‐in‐time delivery. Product value often declines with time while in transit. For perishable products, spoilage or wastage may increase with transit time. Products with time‐sensitive information, such as newspapers, decline sharply in value as that information becomes obsolete. Seasonal and fashion apparel has similar time sensitivity. These costs can also reflect lost opportunities, as when critical inputs cannot reach manufacturing plants in time or perishable commodities cannot reach markets in time—or when production plants must hold higher‐than‐optimal levels of raw material inventories to cover for logistics delays.
The purpose of this paper is to calibrate the effect of specific logistics metrics (cost, time, and reliability) on bilateral trade patterns. We focus on the time and cost of importing and exporting a typical 20‐foot FCL container with medium‐value products for 80 countries. We also include, for the first time, a more complex dimension of time—variability in time of delivery. Reliable delivery of goods within narrow time windows, with minimal uncertainty, may be even more important than average delivery time to a firm's ability to compete in just‐in‐time regimes.
The paper first analyzes comprehensive survey data for global logistics performance from 80 countries. These data show interesting differences across countries, varying by level of development, extent of liberalization, access to coastal ports, and the like. The global logistics performance measures most critical for supply chain management are then selected for inclusion in an augmented gravity model. The model incorporates the effects of direct trade transactions costs such as charges and fees as well as time and variability in time, all of which lead to significant direct or indirect costs that harm the export competitiveness of countries. This model incorporates more detailed and specific information on logistics time and cost than has been used in earlier studies. Incorporating such detailed time and cost information makes it possible to calibrate how trade competitiveness is affected by changes in time, cost, and reliability.
Literature Review
The Gravity Model
The vast majority of the empirical research literature relating logistics performance to global trade uses the log form of a “Gravity Model.” The gravity Model assumes that trade between two countries is an increasing function of the each country's gross domestic product (GDP) and a decreasing function of the distance between them—hence the name (like the force of gravity between two objects that are some distance apart). These three variables typically explain a high percentage of the variation in global trade. Mathematically, let: S(i,j) = the log of value of bilateral trade from country i to country j; GDP(i) = the log of GDP in country i (or j); d(i,j) = the log of distance from country i to country j.
Then the basic Gravity Model expressed in natural logarithms is:

Normally, researchers add additional explanatory variables to the basic model to see if they add materially to its explanatory power. For theoretical underpinnings of the gravity model see Anderson (1979).
Past Research
Reviewing the literature analyzing the relationship between logistics performance and global trade, Limão and Venables (2001) use a gravity model that explicitly includes transport costs, in addition to distance, in analyzing bilateral trade flows. Their measure of transport costs incorporates an infrastructure index (a composite of transport and communications networks). They find that the quality of infrastructure in the origin and destination countries has significant effects on transport costs.
Hummels (2001) includes the effect of transport time as distinct from cost. Hummels estimates the implicit value of time saved in shipping time. He estimates that each additional day of shipping time reduces the probability of trade by 1% (for all goods) and 1.5% (for manufactured goods).
Clark et al. (2004) show that port efficiency plays a significant part in determining transport costs.
Anderson and van Wincoop (2004) survey the measurement of trade costs (including both freight and time costs, policy barriers, and a variety of related costs of doing business across borders). They also present a thorough discussion of the gravity model and the various assumptions underlying it.
Nordas et al. (2006) analyze the relation between time for exports and imports, logistics services, and international trade. They find that longer times to process exports and imports are associated with reduced trade volumes along a tradelane and that excessive time reduces the probability that certain time‐sensitive products will be traded at all in a potential tradelane. They discuss the importance of time variability as a negative factor but do not use any direct measures of time variability.
Carruthers et al. (2004) study countries in East Asia and draw on both academic studies and also country studies by the World Bank to determine the logistics needs of global manufacturing supply chains (e.g., short transit times and reliable deliveries among other factors) and make a series of policy recommendations to improve trade‐related logistics: domestic integration, encouragement of the private sector's performing various roles often performed by the public sector, and a regulatory environment more attuned to global logistics needs.
Memedovic et al. (2008) review major changes in global logistics in the past 20 years and state that current global supply chains require modern logistics services including innovations in containerization, intermodal transport, and the application of information technology (IT) in physical distribution and materials management. They focus on key underlying factors of logistics capabilities. They propose a new Logistics Capability Index based on a series of “hard” indicators. However, they do not calibrate their new index or collect any data on it, and it is unclear how it would aid in setting priorities for improvement of logistics infrastructure for a particular country or region.
Wilson et al. (2004) use a gravity model applied to trade across 75 countries in 2000–2001 to study the effects of the following four categories of logistics performance: port efficiency, the customs environment, the regulatory environment, and the service sector infrastructure. Their variables for these four trade facilitation measures are formed by taking averages of two indices from other studies (e.g., the Global Competitiveness Report, World Economic Forum; the World Competitive Yearbook; and Kaufmann et al. 2002). For example, port efficiency is calculated as the average of the “Port facilities and inland waterways” index and the “Air transport” index. Their results indicate the ranked importance of the four sectors is as follows: service sector infrastructure is most important (particularly for the exporter); next, port efficiency (again, particularly for the exporter); next, the regulatory environment, followed by the customs environment. But their use of averages of indices makes it difficult to prioritize policy actions and to compare their results with our results, which are based on directly measurable inputs such as time and cost rather than survey responses.
Walkenhorst and Yasui (2005) review recent literature on the importance of trade transactions costs, with specific focus on indirect vs. direct costs; country‐specific differences; and the product being traded (e.g., agro‐food products vs. manufactured products).
Dee and Findlay (2006) survey developments in the literature on trade facilitation (defined broadly as reform of non‐tariff barriers) up to 2005. They summarize papers that examine how infrastructure and transport or logistics services link to trade. Their general findings are that infrastructure quality is associated with significant increases in trade.
Brooks (2008) focuses attention on trade in Asia and discusses the benefits of regional coordination and cooperation.
Djankov et al. (2006) use an enlarged dataset related to that used here but they focus exclusively on the time it takes to move containerized products from the manufacturing site to a ship in the nearest port as their major explanatory variable of interest. They estimate a difference gravity equation for 126 countries whose results imply that each additional day that a product is delayed while awaiting shipment reduces trade more than 1%, with a larger effect on time‐sensitive agricultural goods. Their policy recommendations emphasize various ways of shortening the time to move product from a factory to a ship.
This paper uses a data set that was among the first containing quantitative, country‐level data on important aspects of trade logistics, including inland transport and trade‐related transactions, using concrete metrics of cost and time rather than perception surveys. Thus, it extends previous research by expanding the transport time measure to include time for document processing, customs clearance, and inland transport, and it also includes variability in time in addition to average time. Furthermore, it also includes total cost of imports.
Reviewing all this research for quantitative studies of logistics performance, we find that Limão and Venables (2001) study transport costs via an infrastructure index; Hummels (2001) analyzes transport time; Nordas et al. (2006) also study transport time. Our paper includes specific measures of three directly measurable logistics performance inputs: time, cost, and variability in time.
Data
The data set, compiled by the World Bank Group in 2005, contains detailed country‐level data on the time and cost of moving a typical 20‐foot FCL container from the port of entry to a firm in the most populous or commercially active city in the country—or to the port of exit from a firm in that city. (There are situations in which using the most populous city would be inappropriate; however, the dataset had already been collected when our study commenced.) Similarly, dealing with country pairs that share a border that can be driven across may cause problems in certain instances. The survey excluded ocean freight time and cost, since that would have involved an extremely large number of bilateral trade partners for each country. However, the analysis does include bilateral distance as a surrogate for shipping cost. The use of a disaggregated supply chain framework makes it possible to measure time and cost for such activities as trade document processing, approvals needed for import or export transactions, customs clearance, technical clearances, inland transport, terminal handling, and container security measures. In addition, the data illuminate underlying policy and institutional issues that affect time and cost along the supply chain, such as the percentage of containers inspected, the number of agencies with the power to inspect goods, and whether risk‐based criteria are used for inspections.
The survey instrument used to collect the logistics data was a detailed questionnaire distributed to experienced logistics practitioners (freight forwarders) in 140 countries. The aim was to focus on the detailed policy and institutional issues reflected in actual operational practices faced day to day in a country by private firms and by the freight forwarders serving as their intermediaries. Freight forwarders are in an excellent position to provide information on logistics, since private firms in most countries use the services of freight forwarding companies to ship their products into and out of the country. Panalpina, with a worldwide network of offices and agents, was the primary provider of the data. In some countries other forwarding agencies provided supplementary information. (A potential disadvantage of using employees of a single freight forwarding company to collect the data would be if employees of a single company would provide estimates quite different from those provided by equally knowledgeable employees of other freight forwarders. We know of no reason for such a bias.)
A pilot survey of 17 carefully selected countries representing different regions and income levels was used by the World Bank to refine the questionnaire before its use in the larger set of countries. The survey asked separately about imports and exports. In addition, because landlocked countries face a unique set of difficulties, these were separated from coastal countries. After the pilot survey was completed and the final survey instrument prepared, it was distributed to one experienced logistics professional in each of 140 countries in 2005. Since the cooperation of senior executives of Panalpina had been obtained, they were instrumental in obtaining essentially a 100% response rate; but not all the data was sufficiently complete to be useful. Specifically, the cost data obtained from 60 countries proved unverifiable and were discarded.
This paper uses the results for the remaining 80 of the 140 countries covered by the survey: 17 in Sub‐Saharan Africa, 12 in Central and Eastern Europe, 12 in Latin America and the Caribbean, 11 in East Asia, 8 in the Middle East and North Africa, and 5 in South Asia, as well as 15 major industrial countries (see Appendix A). The countries in the data set range widely across regions, income levels, and extent of economic liberalization, and some face the special challenges of being landlocked and therefore dependent on transit countries’ infrastructure services for access to ports. The sample includes 70 coastal and 10 landlocked countries. Appendix B contains descriptive statistics of important variables.
To ensure that the data reflect the conditions that a typical firm or intermediary would encounter, survey participants were asked to base their responses on the institutions and services faced by the typical medium‐sized firm in a country—not on cases where there might be “special conditions or privileges,” such as for firms located in a special export‐processing zone. In Bangladesh, for example, a garment manufacturer located in an export‐processing zone might be able to clear a container of raw material imports within a day. But for a garment manufacturer located outside the zone, it would take 3 days to clear a similar container through customs alone and another 5 days for port and terminal handling through the Chittagong port. It is this case, indicating conditions in Bangladesh for a typical manufacturer, that the survey was designed to capture. To guide the responses of practitioners to reflect these “on the ground” physical, policy‐related, and institutional conditions, a case study approach with a carefully thought‐through framework was adopted for the questionnaire. The case study included a number of assumptions about the firm, traded goods, and procedures.
Assumptions About the Firm
Survey participants were asked to base their responses on a medium‐sized firm with 200 or more employees. The firm was assumed to be a private, limited liability company, formally registered, and operating under commercial laws and regulations of the country. To control for any special exceptions relating to foreign or joint ownership, the firm was also assumed to be domestically owned, with no foreign ownership.
The firm was assumed to be located in the country's most populous city and to export at least 10% of its products internationally. Its trade with international partners takes place by ocean transport. The port closest to or most used by the most populous city serves as the port of entry and exit.
The logistics system and services serving the most populous city were the focus of the questionnaire in each country. The most populous city was assumed to be among the most commercially active cities in most countries in the data set. Because the survey focused on the most populous city in a country, the data are believed to provide lower bound estimates of the cost, time, and complexity of moving goods across borders. Firms in the hinterland inevitably face longer delays and greater constraints because of both bureaucratic complexity and physical infrastructure services. Subramanian et al. (2005) find that the productivity of firms in Chengdu, China, suffers much more from poor logistics than the productivity of those in the eastern part of coastal China, such as in Shanghai and Tianjin. Similarly, in Brazil firms in the northeast show significantly more impact from poor logistics than those in São Paulo.
Assumptions About Traded Goods
The survey limited the traded goods in the case study to ordinary manufactured products, neither particularly high nor particularly low in value. Some logistics factors, such as customs clearance and technical clearances, depend on the type of industry, the type of product, or both. For example, agricultural and fresh food products would involve greater technical requirements and more agencies than many manufactured products; others might involve special phytosanitary (plant quarantine) or environmental inspection requirements. Similarly, the costs of moving containers would be much higher for frozen products or for goods requiring special security. To control for these factors, the survey asked respondents to focus the case study on a manufactured product that is of medium value; is transportable in a dry‐cargo, 20‐foot FCL container; requires no refrigeration or special environmental conditions; requires no special phytosanitary or environmental standards check; and includes no hazardous material or military equipment.
To produce logistics performance metrics that are robustly comparable across 80 countries ranging from Australia, Norway, and the United States to Burkina Faso, Lithuania, and Nepal, three Standard International Trade Classification (SITC) codes were chosen to specify the type of product being traded: SITC 65: Textile yarn, fabrics, made‐up articles. SITC 84: Articles of apparel and clothing accessories. SITC 07: Coffee, tea, cocoa, spices, and manufactures thereof.
An examination of world trade data confirmed that most countries in the sample trade in these products.
Assumptions About Procedures
A procedure for which the time and cost were measured was defined as any interaction of the firm with external parties (government agencies or officials, inspection agencies or officials, port officials, customs, and the like) related to imports or exports. Intrafirm interactions among employees were excluded. All procedures that are legally or in practice required for trading or shipping a containerized product were recorded, even if they could be avoided in exceptional cases.
An important issue to control for was procedures done in parallel. When two or more procedures are simultaneously performed, the time for the entire transaction (import or export) cannot be obtained by summing the time for the individual procedures. The survey questionnaire asked which of the various specific process steps were done in parallel; this made it possible for World Bank personnel to identify and adjust for procedures performed in parallel to obtain correct estimates of total time. Total processing cost was summed up from the various processing cost components in the questionnaire.
Missing or Inconsistent Responses
The questionnaire was carefully designed to provide consistency checks across responses. Where gaps or discrepancies were noted, follow‐up telephone calls were made to the source to resolve the discrepancy or obtain the missing data. The cost data presented particular difficulties, requiring substantial efforts to follow up with the original source as well as other sources in most countries to complete or correct the data. If several sources had different estimates of time and cost, the median value was used.
Data Sources
The world trade data are taken from the United Nations Statistics Division—UN Commodity Trade Statistics Database, adjusted to international US Dollars for purchasing power parity. The data for GDP are from the World Bank's World Development Indicators database. The data for distance are from Gleditsch and Ward (2001), except for Hong Kong (China), for which the source was
Model Development
We take a supply chain management orientation and focus on three independent variables to measure logistics performance: cost, time, and reliability. Operations Management modelers and practitioners alike will recognize these three variables as arising from basic inventory modeling with its focus on cost, lead time, and uncertainty in either supply or demand (see, e.g., Nahmias 2009).
Time in this context refers to lead time; after an order has been placed, how long does the purchaser have to wait for the goods? Reliability here relates to uncertainty in the lead time.
For cost, we focus on the total landed cost of a product imported from different countries. Other things being equal, an importing company would prefer a source with lower total landed cost. While total landed cost is only one of many important factors in global sourcing decisions by private firms, it is often cited as an important metric (see Pyke 2007). Total landed cost has the following components (note that some definitions exclude the inventory holding cost components that are included here): product cost, transport (shipping) cost, trade‐related costs (processing, customs clearance, port operations, and the like), and inventory holding cost for pipeline (in‐transit) and safety stock inventory.
Safety stock refers to inventory held to cope with unpredictable variations in either demand or supply. Virtually all supply chains face variable (unpredictable) customer demand to some extent, and many supply chains also face variable lead times on the supply side. Logistics operations and sourcing choices affect lead times. Moreover, if a particular tradelane has highly variable processing times for port operations, supply chain managers need to hold additional safety stock to maintain desired customer service levels in the face of increased supply uncertainty.
To model logistics performance, we want to use variables that would reflect or are components of the total landed cost. At a minimum, distance is a proxy for shipping cost and is also an important component of the total lead time (and it also impacts safety stock); processing costs in crossing borders are definitely part of the total landed cost; and the mean and variance of processing times would also be of direct relevance in affecting the lead time and safety stock.
An initial screening of all items in the World Bank questionnaire produced an extensive set of possible logistics performance metrics (Table 1), including selected additional metrics for landlocked countries (Table 2).
Logistics Performance Metrics (Possible Set)
Logistics Performance Metrics (Possible Set)
Source:
World Bank, Global Logistics Indicators Survey, 2005.
Additional Possible Logistics Performance Metrics for Landlocked Countries
Source:
World Bank, Global Logistics Indicators Survey, 2005.
The research initially focused on the following global logistics performance metrics (for both exporter and importer) that theoretically would be important for supply chain management, based on time, cost, uncertainty/reliability, complexity, and risk factors (see Hausman 2004, Lee and Whang 2005): Total time for trade‐related procedures (average and maximum number of days). Total cost for trade‐related procedures, in international dollars (US dollars adjusted for purchasing power parity). Only the costs from the imports section of the questionnaire were used due to data unavailability for the exports side (World Bank researchers attempted to obtain appropriate data on costs relating to exports by follow‐up telephone calls but were unsuccessful). Total time for document processing (days). Total number of documents per trade transaction. Number of signatures per trade transaction. Time to resolve customs appeals (average and maximum number of days). Shutdown of port due to natural disaster and labor dispute (days per year). Vessel turnaround time (days). Percentage of containers inspected.
Several of these global logistics indicators turned out to be highly correlated with one another (see correlation tables in Appendices C and D), so we selected which variable to include to minimize multicollinearity problems. In addition, several had very sparse data (notably the time to resolve customs appeals and the frequency of port shutdown). Based on a preliminary assessment of the indicators, a smaller subset was selected for inclusion in the analysis. In addition, in line with the standard gravity model framework, in which trade between countries is an increasing function of their GDP levels and a decreasing function of distance between the countries (Frankel and Rose 2002), the following indicators were also included: GDP of exporting country, GDP of importing country, and distance between countries (kilometers).
A dummy variable for regional trade agreements or trade blocs is also included, as well as the Corruption Perception Index (from Transparency International) for both the exporting and the importing country; additional variables are described below.
Table 3 contains our gravity model results. The first six variables represent standard gravity model variables and they are all significant, with the expected signs. The next five variables represent our three logistics performance variables: time, cost, and variability. Variability was estimated by using the difference between the maximum time and the average time for all procedures. An estimate of the maximum time for various process steps was requested from each individual completing the questionnaire (one per country). It was not possible to obtain multiple sample values and hence calculate a standard deviation.
Model Results
Model Results
Dependent variable is total bilateral exports (in logs) in 2003 or latest year available. Corruption Perception Index is for 2004, from Transparency International. OLS estimates; constant term not shown.
One noteworthy result: while both the time variable and the variability variable for the exporting country were statistically significant with the expected negative signs, the corresponding variables for the importing country were not. Thus, bilateral trade seems to be strongly affected by the average processing time and reliability of the exporting country's logistics performance but less so by the average processing time and reliability of services in the importing country. One way to interpret these results is that an importing company in a given country has no choice but to tolerate the amount of delays and variability in processing time in its own country's processing steps, while their choice of sourcing enables them to exert influence on the time delay and the amount of variability in the supplying country's processing steps. With that exception, the remaining time, cost, and variability variables are statistically significant and with the expected signs.
The confirmation of the significance of logistics performance variables in determining bilateral trade reinforces the importance of improving the regulatory and policy regime underlying these variables, in addition to the strengthening of the efficiency of the manufacturing sector of an exporting country. For emerging economies, it is not sufficient to improve just the competitiveness inside the country through, for example, improved worker training, skills enhancement, favorable tax treatment for manufacturing, concessions of land for factories, and the infrastructure for developing factory sites. It is also important that they invest in improving specific regulations, policies, and practices affecting logistics performance for cross‐border trade. To do so, it requires a very detailed analysis of the processes involved in cross‐border trade, and then performing process re‐engineering to (i) eliminate unnecessary steps; (ii) use IT to speed up and improve the reliability of some steps; and (iii) re‐sequence or parallel process the steps for greater efficiency. An example of such detailed analysis, based on the China–US tradelane, has been reported in Hausman et al. (2010). In addition, risk‐based approaches at borders and ports and improved legislative frameworks to support simplified processes can enhance logistics performance.
The regression results in Table 3 can be used to evaluate the effectiveness of initiatives to improve logistics and to help guide the allocation of resources to and deployment of such initiatives. This section describes how this can be done, with some illustrative examples.
Government agencies and the private sector in a country can collaborate to improve indicators of logistics performance. Of course, the distance between two countries cannot be changed. But since the distance measure is used as a surrogate for freight costs, improvement in this measure can be interpreted as efforts to reduce the freight rate (such as dollars per kilometer) for bilateral trade. Freight costs could be reduced by, for example, deregulating transportation, expanding ports to increase capacity, and promoting the growth of the third‐party logistics industry to allow more consolidation of cargo flows. Trade‐related processing time and cost can be improved by reengineering processes to eliminate unnecessary steps and streamline others (such as by introducing more parallel processing rather than sequential processing), introducing advanced information technologies (such as electronic customs clearance and documentation flows), using data mining and screening methods to identify only high‐risk containers for security inspections, and adopting advanced scanning technologies to shorten cargo inspection times.
In some countries the development of logistics parks such as Suzhou Park in China has helped improve logistics operations (Chen 2007). Suzhou Park includes free trade zones with special transport routes to ports and streamlined customs processes. Products coming from overseas can arrive at the Shanghai Pudong Airport, but customs clearance can take place in Suzhou, which does not have an airport. This avoids the congestion in Shanghai and therefore reduces the variance of customs clearance times. Products leaving the industrial park can also go through customs clearance electronically, after making a one‐time arrangement with the Suzhou government to set this up. Again, such public and private enterprise collaboration can help reduce time and cost. All these improvements can also help reduce bottlenecks in the process and eliminate unnecessary waiting times and therefore reduce the variation in the processing time.
Calculating Elasticities
Let: S(i,j) = the value of bilateral trade from country i to country j; d(i,j) = the distance from country i to country j; T(i) = the exporter's processing time out of country i; C(i,j) = the total processing cost from country i to country j; σ(i,j) = the maximum time minus average time from country i to country j.
In the remainder of this section, the (i,j) term in the variables is suppressed without loss of generality. From Table 3's result, the natural logarithm of exports from country i to country j can be represented as:

In estimating the coefficients of Equation (2), we have used the difference between the Maximum and the Average of Time from one country to another for the variable σ. This variable can be viewed as a “surrogate” for the variability of processing time (such as the standard deviation). Viewing this as a proxy for variability, we can perform elasticity analysis of the independent variables, where the elasticity of one independent variable is based on the assumption of “all else being equal,” that is, keeping others constant. In reality, when one independent variable changes, it is possible that the others may change too. The elasticity analysis merely shows the impact of the change of one when the others are held constant.
It is easy to derive: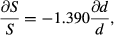
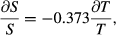
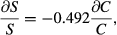
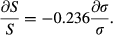
Thus, a 1% reduction in the “distance” measure would be associated with an increase of 1.39% in bilateral trade (since the coefficient in the log‐form of the gravity model represents the elasticity of the variable), and a 1% reduction in exporter's processing time would be associated with an increase of 0.373% in bilateral trade. Similarly, a 1% reduction in the total trade‐related processing cost would be associated with a 0.49% increase in bilateral trade, while a 1% reduction in the variability measure would be associated with a 0.24% increase in bilateral trade.
Our elasticity estimates are summarized in Table 4. Table 4 also contains elasticity estimates of other researchers, to be discussed below.
Elasticity Estimates
Elasticity Estimates
From Table 4, viewing our results, we see the largest elasticity in absolute value (−1.39) is for the so‐called “distance” variable, which as we stated could be interpreted to refer to potential productivity improvements that would reduce shipping costs. The second largest is processing cost (−0.49); the third largest is exporter's processing time (−0.37); and the fourth largest is processing time variability (−0.24).
Several other researchers have obtained sensitivity results related to ours. As stated previously, Hummels (2001) estimates that each additional day of shipping time reduces the probability of trade by 1% (for all goods) and 1.5% (for manufactured goods).
Hummels’ (2001) shipment time was only ocean shipping time, not including the time for trade‐related processing activities pre‐shipment for exports for instance, and at the port that we include. Ocean shipping time ranges from 15 to 25 days. Taking the 15‐day value, a 1% reduction in shipping time would produce an estimated elasticity of (0.01)/(0.067) = −0.15; for the 25‐day value the estimated elasticity would be (0.01)/(0.04) = −0.25 (see Table 4). Hummels notes (p. 12) that he did not have data on variability of shipment times, and that if shipment variability were correlated with shipment length, then his estimate would also include the effects of variability in time as well as average time. Hence, we might expect his result to be larger than ours (as it is) since we separately estimate the impact of variability in shipment time.
Djankov et al. (2006) include both trade transactions time for processing documents as well as inland transport time only from the factory to a ship in their analysis. Their results are similar to Hummels; namely, each day a product is delayed reduces trade by at least 1%. Thus, our comment above relating our analysis to that of Hummels also applies here.
Limão and Venables (2001) include transport costs in their model and obtain an estimate of the elasticity of trade flows w.r.t. transport costs of approximately −2.5. This is higher in absolute magnitude than our estimate of −1.39 for distance (which is the variable corresponding to shipping costs in their model) but of the same order of magnitude. Carriers usually would determine freight costs for shippers based also on their estimate of the variability of the total lead time. For example, a ship waiting for a berth at a port due to port congestion lengthens the lead time, and hence the cost to the carrier. Hence, in a way, the impact of transport costs may partly include the impact of variability in lead time. In our model, we have distance and variability estimated separately, and this also can explain why the elasticity of transport costs in Limão and Venables (2001) was higher than ours.
Nordas et al. (2006) analyze exports in 2004 from 192 countries to Australia, Japan, and the United Kingdom (note this data structure is quite different from the general bilateral trade studies by ourselves and most other researchers). Their estimates of elasticities w.r.t. relative distance range from a high of −2.15 (Australia) to a low of −0.19 (United Kingdom); elasticities w.r.t. relative time range from a high of −1.48 (Australia) to a low of −0.52 (Japan) (see Nordas et al. 2006, tables 4.3 and 4.4). Our estimate of the distance elasticity (−1.39) falls within their reported range, while our estimate of the time elasticity (−0.37) does not. However, in their model estimating the time elasticity, they include only the relative distance variable and no estimate of the variability in delivery time; also no estimate of the effect of processing cost. To the extent that some of these variables are positively correlated, as discussed above, we would expect an analysis including only one of them to have a higher elasticity estimate than in our model where the three variables are included separately.
Thus, our elasticity results are generally consistent with those of previous researchers; but our results do provide separate elasticity estimates for the three variables (average time, processing cost, and variability in time) found to be important from a supply chain viewpoint.
Optimizing Logistics Improvements
All of the second derivatives of Equation (2) are positive; thus the S function is convex in the four logistics friction variables. If d is replaced by d − Δd, C by C − ΔC, T by T − ΔT, and σ by σ − Δσ, where all the deltas represent decision variables on the magnitudes of logistics improvements, the S function is a concave function of the delta variables. Let w
d
, w
C
, w
T
, and w
σ be the respective cost per unit of improvements in d, C, T, and σ. Suppose there is a total budget of B to spend on logistics improvements. Then:
An optimal solution to the well‐defined nonlinear optimization problem of maximizing (2) subject to (7) would produce the optimal allocation of resources across the possible logistics improvements.
Finally, many projects to improve logistics are not specific to a particular bilateral flow. For example, investing in information technologies to improve customs clearance processes for an exporting country can benefit all outbound flows. In that case the evaluation of the impacts of such projects should be based on aggregate bilateral trade flows.
Conclusions
This paper studies the impact of trade‐related transactions (time, cost, and variability in time) on trade. Drawing on a data set developed by the World Bank Group with specific quantitative metrics of logistics performance in terms of time, cost, and variability in time, we show that logistics performance is statistically significantly related to the volume of bilateral trade among 80 countries. Furthermore, we estimate the impact of improvements in logistics performance on increased trade. Our findings can spur public and private agencies that have direct or indirect power over logistics performance to focus attention on those variables most likely to improve their country's ability to compete in today's global economy. Moreover, since the logistics metrics are directly related to operational performance, countries can use these metrics to target actions to improve logistics and monitor their progress.
Footnotes
Countries in Bilateral Trade Analysis
Descriptive Statistics of Important Variables
Logistics Variables and Doing Business Variables Correlation Matrix
Institutional Variables and Doing Business Variables Correlation Matrix
Acknowledgments
The authors graciously acknowledge support provided by The World Bank Group for this research. They also gratefully acknowledge excellent research assistance from Kihoon Lee of the World Bank and Luis Blancas of Stanford University. Paul Roberts (a former faculty member and former director of the Massachusetts Institute of Technology's Center for Transportation and Logistics) and Peter Yee (with Consilium Incorporated) were involved in the team led by one of the authors, Dr. Uma Subramanian, in designing and developing the conceptual framework and data collection questionnaire. An earlier version of this paper was called “Global Logistics Indicators, Supply Chain Metrics, and Bilateral Trade Patterns,” World Bank Working Paper No. 3773, November 2005.