
Abstract
Despite the widely held belief of the importance of innovation, the connection between innovation and firm performance is empirically inconclusive, partially owing to the limitations of existing innovation measures, which tend to ignore the effectiveness of innovation programs. In this study, we use the winning of innovation awards as a proxy for the effective execution of innovation. We conducted event‐study analyses based on data from more than 1000 publicly traded firms that won innovation awards between 1998 and 2003. Our statistical tests provide strong evidence that the performance of award‐winning firms is significantly higher as compared with several sets of control firms. Over an 8‐year period, starting from 4 years before to 3 years after the year of winning the first innovation award, the test sample's mean (median) change in return on assets is nearly 33% (24%) higher than that of a control sample. The evidence also suggests that effective innovation programs can increase firms' revenue, cost efficiency, and market valuation. Over the period, the control‐adjusted mean (median) change in sales, cost per dollar of sales, and Tobin's Q are 39.28% (20.71%), −5.52% (−3.80%), and 23.70% (3.16%), respectively. Panel data regression analysis provides additional insights on the performance impact of effective innovation programs. The results show that award winners are not only financially more successful but also enjoy an indirect benefit through better R&D execution, which increases firm profitability in both the short term and long term.
Keywords
Introduction
Innovation is widely acknowledged as the key for achieving and sustaining a firm's competitive advantage. It is thus not surprising that innovation is often one of the top priorities for many companies, even during economic downturns (Scheck and Glader 2009). In recent global surveys conducted by McKinsey (Barsh et al. 2007) and Boston Consulting Group (Andrew et al. 2007), the majority of responding business leaders representing almost all industries considered innovation important or even critical to their businesses, and they planned to increase future spending on such activities.
Despite the growing importance of innovation to business success, few companies seem to innovate well. It was estimated that the success rate of innovation initiatives across all industries is only about 4.5% (VanGundy 2007). Senior managers are often unsure of the financial return on R&D spending, or whether they are satisfied with the efficacy of their innovation programs as evidenced by the results from the McKinsey and BCG surveys. Although R&D spending continues to rise in a large number of companies, its output often falls short of expectations. As Andrew and Sirkin wrote in their recent book Payback: Reaping the Rewards of Innovation, “most attempts at innovation fail to deliver this return—they do not generate enough payback” (2007, p. 1). They believe that true innovation is not just about new ideas, but more importantly, about the capability to convert the ideas into cash or profit. Similarly, O'Brien argues “Being an effective innovator requires more than just developing new products: it requires getting those products to market” (2003, p. 420).
The high failure rate of innovation initiatives offers a possible explanation of the mixed results of prior research on the link between innovation and performance outcome (Capon et al. 1990, Durand et al. 2008, Li and Atuahene‐Gima 2001). Although useful, existing measures of innovation employed to test this relation often do not adequately capture the notion of innovation effectiveness. For example, input‐based measures, such as R&D expenditures or R&D intensity, only provide information about a firm's innovative efforts, but do not reveal whether or not the firm is good at being innovative. Innovative efforts, however, do not always translate to improved performance. Terwiesch and Ulrich (2009) showed that there is no clear linkage between R&D spending and firm performance (revenue growth) in a variety of industries, such as computers, chemicals, pharmaceuticals, and autos. In their study of 1000 publicly held companies around the world that spent the most on research and development, Jaruzelski et al. (2005) found R&D spending does not affect corporate success in growth, profitability, and shareholder return. Higher R&D expenditures may indicate a higher level of agency costs (Jensen and Meckling 1976) but not necessarily better innovation ability (Kochhar and David 1996). Similarly, the connection between output‐based measures, such as patent counts and innovation effectiveness, is also weak (Griliches 1990). As shown in previous work (Harhoff et al. 1999), the quality and economic value of patents can vary greatly with some patents being extremely valuable while others being worth almost nothing. As such, a simple aggregation of patents does not truly reflect their overall utility.
Innovation can be viewed as a two‐staged process (Edwards and Gordon 1984, MacLaurin 1953). The first is the invention stage where the focus is on basic research (e.g., compound screening for pharmaceutical companies). However, identifying a new compound does not necessarily deliver value to consumers. Before the company is able to introduce a successful drug based on the compound, it has to link the compound's use to a specific customer demand, conduct preclinical and clinical trials, and fulfill strict government requirement (cf. Girotra et al. 2007). Our study focuses on this second stage—commercialization (or development for commercial use). It is important to note that patent counts or patent citations reflect the outcome of mainly the invention part, but indirectly the commercialization part of the innovation process. While most of the studies in the literature have focused on linking patents or patent citations to firm performance, our study provides direct evidence on how innovation through product development and commercialization adds value to firms.
In this study, we seek to justify the returns of an effective innovation program, which we define as an innovation program that can generate high‐impact commercial output and offer substantial value to customers or the market. This focus is theoretically important because although there has been a conceptual account of the general importance of innovation in the field, the empirical evidence remains inconclusive. Furthermore, the underlying mechanisms and value of innovation have not yet been fully elucidated. Among issues that have not been addressed are how innovation matters to firm operations, what the magnitude of these effects is likely to be, and whether these effects endure, to mention just a few. The lack of progress on these fronts is partially owing to the fact that high‐impact innovations are outnumbered by minor, less influential ones. This, when combined with the limitations of the existing innovation measures, obscures the effect of innovation on firms.
Our goal of this study is to fill the gap in the literature. We use the winning of innovation awards as a proxy for the effectiveness of the innovation process. 1 Based on a test sample of 1141 publicly traded firms that won innovation awards during 1998–2003 and their accounting and financial data, we empirically examine the innovation's impact on firm performance. Our results suggest that effective innovation does pay off. As compared with several sets of control firms, the performance of the award‐winning firms examined in this study shows significant improvement.
There are two major reasons for our choice of award winning, instead of traditional innovation measures, such as R&D spending or patent counts, as evidence of effective innovation programs. First, award providers commonly use objective and rigorous evaluation criteria or surveys of consumers in choosing award winners. To maintain reputation and credibility of their awards, providers are strongly motivated to award only those firms that are truly innovative (see Hendricks and Singhal 1996[, 1997b], Klassen and McLaughlin 1996 for similar arguments for quality and environmental awards). For example, the DuPont Award for Innovation in Packaging rewards “innovative products and processes resulting in breakthroughs in sustainable packaging.” The Nova Award administered by the Construction Innovation Forum is established to “recognize innovations that have proven to be significant advances that have had positive, important effects on construction to improve quality and reduce cost.” Computerworld selects its Innovative Technology Award winners based on a three‐stage process, which starts with an industry‐wide customer nomination, continues on with surveys, and finalizes with expert evaluation. During the process, all candidates are fully evaluated based on the innovativeness and originality of their technology, competitive advantage, customer satisfaction, and business impact. Hence, winning an innovation award provides credible, independent external validation about a firm's innovation commitment and ability.
Second, the measure of innovation awards takes into consideration some nuanced, but important, differences between innovation and invention, two interrelated, but conceptually distinct constructs. There is a general consensus among business and economics researchers that an innovation is not merely something new. MacLaurin argued in his early work that “When an invention is introduced commercially as a new or improved product or process, it becomes an innovation” (1953, p. 105). Likewise, Edwards and Gordon claimed that innovation is “a process that begins with an idea, proceeds with the development of an invention, and results in the introduction of a new product, process or service to the marketplace” (1984, p. 1; see also Danneels 2002, Katila and Shane 2005, Thornhill 2006). Therefore, beyond the newness of the idea, commercial application is a defining characteristic of innovation. Award‐giving organizations generally incorporate commercial feasibility as a prerequisite for their award consideration. To illustrate, again we can use the Innovative Technology Award as an example. The award provider, Computerworld, highlights in its evaluation criteria that each qualified candidate should be able to show some evidence of successful commercial use of its technology. 2 Thus, such practice and requirement associated with innovation awards supports the content validity of the instrument.
By focusing on third‐party certified award‐winning innovations, our study provides a benchmark of what can be expected from an effective innovation program. It also helps in resolving the controversy about the magnitude of financial returns from innovation. In addition, by using publically available data on firms' innovation effectiveness and their financial performance, we avoid the potential biases associated with surveying the firms to obtain their self‐reported perceived innovation effectiveness and financial performance.
The next section provides a summary of the relevant literature on innovation. This is followed by a comparison of major existing innovation measures in section 3. Section 4 develops the hypotheses. The sample collection and methodology are then detailed in section 5. Section 6 discusses the results. The closing section discusses the implications and limitations of the study and suggests directions for future research.
Related Literature
The literature on innovation is vast and growing. Among this large body of work, a substantial proportion of the research has focused on why firms differ in their innovation effort and commitment. O'Brien (2003), for example, found that financial slack constitutes a vital complement to the successful execution of innovation programs. Pennings and Harianto (1992) and Goes and Park (1997) showed that social capital, through its impact on knowledge access and diffusion in the market, plays a critical role in a firm's decision to adopt a new product or service. Leiponen (2008) echoed the importance of social relations, but from a different perspective. The author detected that the willingness of a company to make investments on innovation is shaped by its ability to control knowledge output from collaborative relations.
A firm's propensity to innovate also appears to be contingent on its own strategic choices and orientation (Ahuja and Katila 2001, Hitt et al. 1997, Thornhill 2006). Hitt et al. (1997) argued and found evidence that internationally diversified firms are more inclined to fund research and development because the broadness of their business scope allows them to take full advantage of such effort. Ahuja and Katila's (2001) insightful analysis showed that technological acquisition can both broaden firms' knowledge stock and disrupt their operating routines; thus it can affect innovation outcome in such a complicated fashion that its ultimate impact is determined by both the absolute and relative size of the acquired knowledge base.
Still, many other factors matter to innovation output. Among the other factors that have been studied are: executive pay (Balkin et al. 2000), organizational structure (Jansen et al. 2006), manager background (Bantel and Jackson 1989), internal resource exchange (Tsai and Ghoshal 1998), institutional investors (Kochhar and David 1996), market competitiveness and size (Katila and Shane 2005), and industry dynamism (Thornhill 2006).
Given the above findings, firms would naturally differ in their innovation activities. This gives rise to a question of whether the disparity has a performance implication to firms. Through a comprehensive (but not necessarily exhaustive) review of the literature, we identified 26 studies (summarized in Table 1) 3 that have empirically investigated this question. Together, the evidence generally supports the argument that innovation is essential to organizational survival and long‐term success. Innovating firms are characterized by higher stock performance and stronger ability to capture market opportunities (Banbury and Mitchell 1995, Kelm et al. 1995, Lawless and Anderson 1996, Zhao 2009). For example, Zhao (2009) found the level and dynamics of technological innovation is an important predictor of the future value of a firm's stock. Kelm et al. (1995) empirically showed that the capital market tends to positively react to firm announcements of R&D projects. On studying 86 firms in the U.S. implantable cardiac pacemaker industry over a 31‐year period, Banbury and Mitchell (1995) observed that the more active a firm is in pursuing product innovation, the greater the market share it is likely to achieve.
Studies on the Effect of Innovation on Organizational Performance
Studies on the Effect of Innovation on Organizational Performance
Firms that strive to reach and maintain a high level of innovativeness also often exhibit better economic performance than less‐innovative firms. By comparing four groups of Fortune 500 manufacturers, which have different levels of research commitment, Capon et al. (1992) found firms with the highest R&D spending enjoy greater profitability than the others. Roberts's (1999) longitudinal study of pharmaceutical companies reveals that firms possessing the capacity to innovate continuously over time are financially more successful. Yet the available evidence is not always consistent (see, e.g., Durand et al. 2008, Leiponen 2000, Loch et al. 1996, Terwiesch et al. 1998). A recent study by Durand et al. (2008) surprisingly shows that the number of patents a firm owns has a depressing effect on its short‐term performance. Terwiesch and his colleagues (Loch et al. 1996, Terwiesch et al. 1998) found that in the electronics industries, innovation‐related development intensity cuts down firm profitability.
Despite the general observation of the importance of innovation, the specific underlying mechanisms of the innovation process and its impact on operating efficiency are far less understood. It is not clear whether the observed positive performance impact of innovation is caused by a rise of revenue associated with the increased image of the firm in the market, or a reduction in operating costs engendered by improved efficiency, or both. Although there are a handful of studies that do link innovation to sales, the results of these studies are often weak and inconsistent. For example, using a survey of 877 small and medium sized firms in Taiwan, Lin and Chen (2007) found that with the exception of administrative innovations, other forms of innovations do not have an influence on company sales. Freel's (2000) study of new product introductions by 228 small manufacturing firms in England shows that although innovators enjoy higher employment growth and productivity, they do not differ from non‐innovators in terms of sales growth, profitability, or export performance.
The mixed empirical evidence of the effect of innovation on firm performance is possibly due to the inadequacy of the measures adopted by previous studies. In the section below, we briefly review some of the popular measures that have been applied in the literature.
A variety of measures have been proposed and employed for analyzing the notion of innovation, including, among others, R&D spending, patents, and new product introductions (see column 2 in Table 1). Although each of the available measures opens a window for studying innovation, none of them are above criticism. For instance, there are a couple of shortcomings of R&D spending, one of the most commonly used measures in the innovation literature. First, as an input variable in the innovation process, R&D only reflects a firm's effort to carry out research programs, but it does not necessarily indicate the firm's innovation ability and output (Kochhar and David 1996). In fact, firms with the same amount of R&D spending may have substantially different innovation performance given the disparity of their abilities to organize, arrange, and integrate resources for knowledge creation. Second, the requirement for R&D investment may vary markedly from one industry to another. Balkin et al. (2000) empirically showed that high‐technology firms are more likely to provide incentives to induce CEOs to channel resources to R&D projects as compared with their low‐technology counterparts. The authors reasoned that, in segments where knowledge is a key competitive factor and changing rapidly, it is typically difficult, yet important, for firms to maintain a technological edge against rivals. Under this condition, large expenditures in R&D are desirable and conducive to firms. The variation in firm practices and policies associated with the state of market conditions thus makes it hard to meaningfully compare R&D spending across industries.
Given the drawbacks of R&D spending, researchers have turned to using patent data as an alternative approach. Unlike R&D spending, patents manifest some outputs of the innovation process. Although this focus allows the instrument to get around some of the problems inherent in R&D spending, patents also suffer a few limitations. Griliches (1990, p. 1666) explicitly pointed out that “patents differ greatly in their technical and economic significance. Many of them reflect minor improvements of little economic value. Some of them, however, prove extremely valuable.” Harhoff et al.'s (1999) survey confirms this argument and shows that, from the owner's perspective, the value conveyed by patents does diverge considerably. There is also evidence that the quantity of patents a firm owns does not predict well firm value (LeVine 2010). These observations thus question the validity of using simple patent counts as a proper indicator of innovation capacity.
In comparison, patent citations constitute a more sophisticated use of patent data. As a main advantage, this approach offers a clear, objective way to guage and control for the discrepancy in importance of patents by weighting them according to how frequently they are cited by others. However, like other patent‐based measures of innovation, the citation index, too, focuses on innovations at the invention stage, but rarely on the commercialization part of the innovation process. Furthermore, this index rests on the assumption that firms pursue patent protection for all their innovations (Ziedonis 2004). Yet, the assumption of unselective patenting is questionable because patenting is not always necessary or desirable. In practice, firms may decide not to patent their products, services, technologies, processes, or business methods for confidentiality or growth considerations (Heeley et al. 2007, Kumar and Turnbull 2008). Conversely, even if firms do file patent applications, they may choose to do so for different motives. For example, in industries where technology is complex—namely, innovation involves multiple complementary technological components, patenting is commonly used to disrupt or restrict rivals' research agendas, to increase negotiation power, and to create cross‐licensing opportunities (Clark and Konrad 2008, Heeley et al. 2007). In this context, the value of patents is hard to be assessed and compared.
Moreover, recent studies have shown that a patent's citations may stem not only from its technological importance and viability but also from many other sources like “publicity, licensing practices, interconnectedness, or other technological features” (Rysman and Simcoe 2008, p. 1925, also Rosenkopf and Almeida 2003, Singh 2005). In other words, the justification of citations as an effective proxy for patent quality may not be taken for granted.
Two other well‐established measures in the field are new product introductions and survey‐based measures. Proponents of the former approach hold that the rate at which a firm introduces new products as well as the radicalness of the products (i.e., whether they are new to the firm, new to the market, or new to the world) signals the firm's innovative ability. Nevertheless, innovation is not necessarily confined to product development; rather, it could also relate to methods of production, market expansion, sources of supply of raw materials, and organization forms (Bantel and Jackson 1989, Goes and Park 1997, Phene et al. 2006). In this regard, the measurement of new product introductions is narrowly focused. Survey instruments, by contrast, offer a more general way to investigate innovation behaviors. These tools are often flexible to be modified to fit different research settings and foci. They also allow direct data access from innovators and enable collection of detailed information, which is usually not accessible through other means or channels. However, survey measures are self‐reported. The reliance on subjective assessment of organization members may lead to serious problems because what is perceived by the firm as highly innovative may be considered quite differently by the market. In addition, the methodology itself is potentially subject to the problem of common method bias.
Thus far, we have shown that it is difficult, if not impossible, to create a generalizable innovation measurement applicable to all organizations and circumstances. That said, our intention is not to dispute the importance of existing measures, such as those mentioned above; their value and contributions have already been recognized in the literature. From a practical standpoint, all these measures provide reasonable ways to test innovation‐related phenomenon, although each of them reveals only part of the complete picture. Given the richness of the notion of innovation, we contend that a diversity of measurements is necessary and beneficial to the development of the field. For example, innovation awards could represent a useful complement to patents and patent citations, given their properties and selection mechanisms. Although patents and patent citations are reasonable indicators of the output mainly from the invention part of the innovation process, the use of innovation awards can provide a more direct measure of effective innovation because of the clear focus of award givers on the commercial application of new products or services. Table 2 provides a detailed comparison of major innovation measures.
Comparison of Innovation Measurements
Comparison of Innovation Measurements
Award‐winning innovations are non‐trivial ones. They tend to be influential in the sense that their adoption and application can have a significant impact on business trend, customer choice, or the way firms compete in the market. Winning an innovation award reflects a firm's commitment to highly innovative programs, as well as how successfully these programs have been implemented. Although innovation is conducive to firms (Hull and Rothenberg 2008, Roberts 1999, Thornhill 2006), the benefits of undertaking effective innovation programs may be even greater given the quality of the outputs of such programs. Hence, innovation award winners should be able to distinguish themselves financially from peer firms that are not honored by such awards. In keeping with prior research (Cho and Pucik 2005, Roberts 1999), we measure profitability by return on assets (ROA), which is income before extraordinary items
4
divided by total assets, and return on sales (ROS), which is income before extraordinary items divided by net sales. As it is likely that a firm's profitability is affected by its choice of depreciation method, we also use operating income (which is before depreciation) as an alternative measure of profitability. Hypothesis 1. Conducting an effective innovation program will increase a firm's profitability.
It is important to note that although analogous hypotheses have been tested in prior research, Hypothesis 1 is worth studying for its own sake. In fact, most of the past work has focused on R&D spending, new product introduction, and patents, which have limitations as we have noted above. In addition, recent research shows that innovations are dissimilar in terms of their impact and utility (Govindarajan and Kopalle 2006, Phene et al. 2006). Unlike their major counterparts, minor innovations only confer limited benefit to firms, whose value tends to evaporate quickly. 5 Indeed, Roberts and Amit (2003) found that just being the first to adopt an innovation does not naturally bring a competitive advantage to a firm. In this light, a holistic approach of aggregating all innovations may not be ideal as this may obscure the effect of those larger, more influential ones. Despite the conceptual importance of high‐impact innovations (Schumpeter 1934), no empirical study to date has specifically examined how these innovations may contribute to firms and what the magnitude of their impact would be. Innovation awards help weed out low‐impact innovations and thus offer an avenue to fill the void.
Hypothesis 1 establishes a baseline hypothesis, yet the relationship between innovation awards and profitability could be more elaborate and complex than it appears. First‐mover advantage theorists (Lieberman and Montgomery 1988, Song et al. 1999) posit that innovation‐related activities can promote a company's brand image and visibility. As a result, firms that are active in innovation can charge premium prices by influencing the way consumers perceive the value of their products or services. The anticompetition perspective (Roberts 1999) arrives at a similar conclusion from a different angle. Anchored in industry organization economics, this view speculates that innovations can function as a critical means of deterring rival entry. On one hand, participating in innovation can foster knowledge creation, which allows firms to use patents to protect their market positions; on the other hand, such activity can strengthen customer loyalty, making it more costly and less beneficial for other firms to compete in the same market. Together, these arguments suggest that innovation may generate higher revenue for the firm. We expect that the magnitude of this benefit would be more significant and notable for firms with a more effective innovation program. We use net sales to measure revenue. Hypothesis 2. Conducting an effective innovation program will increase a firm's revenue.
An award‐winning innovation program may render a cost benefit as well. According to the competence renewal perspective on innovation (Danneels 2002), innovation could serve as an important vehicle for organizational learning and renewal. This argument is consistent with the theory of dynamic capabilities and the literature on absorptive capacity (Cohen and Levinthal 1990, Teece et al. 1997), both of which posit that firms are evolving systems and can constantly update their knowledge and skills. By definition, innovation implies a deviation from conventional course of behaviors. To be productive in this effort, firms need to question their own assumptions and premise of existing practices. This process forces firms to think about new ways of combining resources and re‐link knowledge components, which creates opportunities for improving operational efficiency. Innovation also puts a demand on coordination among separate units within the firm (Danneels 2002). Hence, an effective award‐winning innovation program could facilitate inter‐unit communication and idea exchange, accelerating knowledge sharing and integration. As a consequence, new technologies or skills may emerge, which can improve product quality, reduce defects, streamline manufacturing process, and lower production costs (Cho and Pucik 2005, Lieberman and Montgomery 1988). We follow Hendricks and Singhal (1997b) to use cost per dollar of sales, defined as the sum of cost of goods sold plus selling, general, and administrative expenses divided by net sales, as a measure of operating cost. Hypothesis 3. Conducting an effective innovation program will reduce a firm's operating costs.
The benefits of effective innovation programs mentioned above should open up to firms with more growth opportunities. Hence, we expect award‐winners to have a higher financial market valuation than other firms. We use Tobin's Q as a measure of a firm's market valuation and growth potential. It is calculated as the ratio of the market value of a firm's debt and equity to the current replacement cost of its assets (Corbett et al. 2005). Hypothesis 4. Conducting an effective innovation program will increase a firm's Tobin's Q.
Methodology
Data Collection
The first step in the data collection process was to obtain a comprehensive list of firms that had won innovation awards between 1998 and 2003. Our primary source for identifying such firms is the Dow Jones Factiva, an online search database containing news sources from Associated Press, Business Wire, Dow Jones News Service, Financial Times, PR Newswire, and the Wall Street Journal. We performed a search using various combinations of key words, such as award, innovation, innovative, design, creative, original, and new product (service). This resulted in over ten thousand press releases or news articles, each of which was read to determine and cross‐verify whether firms had actually won innovation awards and, if so, the timing of the award. Some examples of press releases are given below. “Aspen Technology, Inc., the leading provider of Smart Manufacturing and Supply Chain Management software and services for the process industries, today announced it has received the Industry Week Technology of the Year award.” Business Wire, Dec. 22, 1998. “NMS Communications, a leading supplier of technology for tomorrow's networks, today announced that its Packet Media IP media server development platform has won the Product of the Year award presented by Internet Telephony Magazine.” Business Wire, December 19, 2000. “Jasc Software, Inc. today announced that it received the CNET Editors' Choice award for its Paint Shop Photo Album 4. CNET Editors' Choice winners are recognized as top products in their respective technology categories, and contribute to the standard by which all future products are judged. A key selection requirement is the difference it makes in the lives of its users, whether through innovative features, exceptional value for the price, remarkable ease of use, or a demonstrable boost to users' productivity.” PR Newswire, March 14, 2003.
A total of 6219 distinct award‐winning firms were found from this initial search.
The financial and accounting data for these firms were then retrieved from COMPUSTAT. Among the 6219 firms, 1141 firms were listed on the COMPUSTAT database. These firms represent a wide range of industries in both the manufacturing and service sectors. Table 3a depicts the distribution of the sample firms by year. From 1998 to 2003, the percentage of firms in the sample generally increases from 6.5% to nearly 30%. Table 3b shows the distribution of the sample firms by 2‐digit SIC code. The sample firms are fairly well represented across different industries. The highest concentration is in manufacturing (593 firms, 52%) and services (341 firms, 30%), and the lowest is in construction (5 firms), public administration (5 firms), and mining (9 firms).
Distribution of Sample Firms by Year
Distribution of Sample Firms by Year
Distribution of Sample Firms by 2‐Digit SIC Code
The performance metrics used in this study include operating income, sales, ratio of total cost to sales, Tobin's Q, and return‐based measures, such as ROA and ROS. These variables have been widely used in the strategy and operations management literatures (e.g., Cho and Pucik 2005, Corbett et al. 2005, Hendricks et al. 2007), and reflect different aspects of the outcome of business operations, that is, profitability, revenue, cost efficiency, and market value.
We tracked a firm's performance change over an 8‐year period because the effect of an innovation program may not be able to manifest in a short time, especially for those award winners whose winning products and services are new to the market. Specifically, the evaluation period starts 4 years before and ends 3 years after the year when the firm received its first innovation award. Similar pre‐ and post‐implementation time periods have been used in several other studies, such as Corbett et al. (2005) and Hendricks et al. (2007). To pool observations over time, we translated the calendar year to an event year for each firm, with year 0 being defined as the year the firm received the award, year ±1 as the year after/before the award, year ±2 as the second year after/before the award, and so on.
To examine the benefits of an award‐winning innovation program, it is critical to compare the performance of award‐winning firms with that of a group of carefully chosen control firms. The purposes of using the control group are to provide a benchmark for the performance of the sample firms and to control for potential industry and/or economy‐wide effects on a firm's performance that may have nothing to do with innovation effectiveness. An ideal control firm would be the one that is identical to the sample firm in every aspect of business, except that it has not won an innovation award. Such an ideal firm, however, does not exist. Hence, control firms are commonly selected to match sample firms as closely as possible in several key dimensions, such as industry, size, and pre‐event performance (Corbett et al. 2005, Hendricks et al. 2007). Total assets are often used as a proxy for firm size, whereas the ROA 6 is a preferred measure of performance in choosing control firms (Barber and Lyon 1996, Corbett et al. 2005). In innovation research, the R&D spending or intensity is often found to be an important factor that can influence the innovation outcome and it can vary widely among firms even in the same industry. Barber and Lyon (1996) find that matching by firm size in addition to industry and ROA provides little or no extra benefit. Therefore, we used the R&D intensity (defined as the ratio of R&D spending to sales) instead of the firm size as one of the criteria to identify control firms. Thus, a control firm in our study is the one in the same industry that is closest to the award‐winning firm in ROA and R&D intensity. In addition, although one‐to‐one matching is common in the literature, using a matching portfolio of similar firms often yields more powerful test statistics (Alderson and Betker 2005). Therefore, we considered both one‐to‐one and one‐to‐portfolio matching methods in this study. In all cases, the year proceeding the award year was used as the basis to select control firms.
Following Corbett et al. (2005), we used the following steps to select control firms: Inside the same 2‐digit industry of each sample firm, we identify control firms whose ROA is within 90% and 110% times ROA of the sample firm and whose R&D intensity is within 0.7 and 1.3 times the R&D intensity of the sample firm. In one‐to‐one matching, we first calculate for each firm the z‐scores for ROA and R&D intensity (defined as the ratio of the difference between the ROA [R&D intensity] and the industry mean to the industry standard deviation), and then compute the Euclidean distance in the two‐dimensional space of z‐scores. The matching firm is the one whose Euclidean distance is closest to that of the sample firm. In one‐to‐portfolio matching, all the firms identified in step (1) are chosen as the control firms. If for some sample firms, no control firms could be identified in (1), the industry is relaxed to a one‐digit SIC and then the procedure is repeated.
Abnormal Performance Measure and Analysis
We first employ the event‐study method to assess the abnormal performance of award‐winning firms. Like other studies using the same approach (e.g., Hendricks and Singhal 1997b, Hendricks et al. 2007), we define a sample firm's abnormal performance as the percentage change in the firm's performance minus the percentage change in the control firm's performance. More specifically, we calculate the abnormal performance measure as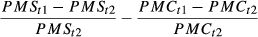
To control for the effect of potential outliers, all abnormal performance measures are trimmed symmetrically at the 2.5% level in each tail. Even with the trimming, the data may still not be symmetric and outliers may still be an issue. For this reason, we report both parametric and non‐parametric testing results. The parametric test is based on the normal t‐test on changes in the mean, and the non‐parametric test we employed is the Wilcoxon signed‐rank (WSR) test. These tests are used to analyze whether the median of the changes is significantly different from zero. It is important to note that because of the matching requirements, the missing of data for calculation, and the data trimming, the sample sizes actually used in the event study analysis vary depending on which performance metric is used and what time interval is considered.
Panel Regression Analysis
Although our choice of the event‐study method is motivated and justified by earlier research with a similar interest in quality awards and certifications (Corbett et al. 2005, Hendricks and Singhal 1997b), firms' R&D activity can vary over time rather than being static as assumed by the event‐study approach.
7
For this reason, we also conducted panel data analysis. Specifically, we used two‐way fixed effects models to control for sources of unobserved heterogeneity. This approach also accounts for possible non‐independence of observations that share the same sources of variance. The basic model form can be written as:
We considered a number of control variables at both the firm and industry levels. The natural logarithm of total sales was included to account for firm size. Strategic alliance formation could affect firm performance one way or another (Stuart 2000, Yu et al. 2011). Thus, we included in the model an alliance variable, which was coded as the total number of alliances formed by a firm in a 5‐year window 8 preceding each observation year. Alliance data were obtained from the Securities Data Company (SDC) database. A Herfindahl index of diversification was used in our analysis to capture the potential diversification effect as predicted by previous research (e.g., Rumelt 1982). In addition, we controlled for financial leverage, plant and equipment (P&E) newness, and capital intensity. Financial leverage was measured as total debt divided by total assets. P&E newness was measured as new P&E divided by gross P&E. Capital intensity was calculated as the ratio of the net value of property, plant, and equipment to net sales.
To control for possible industry effects on firm performance, we further included two industry variables: industry attractiveness and technology opportunity. The industry attractiveness variable was approximated by the mean of the ratio of operating profit to sales in each industry. Technology opportunity was measured by the mean industry R&D intensity. In addition to above firm level and industry level factors, we also included year and firm dummy variables. These dummies were used to account for the unobserved time and firm differences.
All independent variables and control variables were lagged to minimize the possibility of reverse causation. We estimated models using 1‐year lags for all control variables while using either 1‐year lag or 3‐year lag for R&D intensity to test for its short‐term or long‐term effects. The time period chosen for the analysis was from years −1 to +3.
Empirical Results
Results from the Event Study Analysis
We first present results from the event study analysis. Because of the similarity in results between one‐to‐one matching and one‐to‐portfolio matching, we report here only the results from the one‐to‐one matching method. Table 4 shows summary statistics for award‐winning firms and control firms at t−1.
Descriptive Statistics for the Sample Firms and Control Firms Using One‐to‐One Matching by Industry, ROA, and R&D intensity
Descriptive Statistics for the Sample Firms and Control Firms Using One‐to‐One Matching by Industry, ROA, and R&D intensity
For each performance measure, we report two sets of results. The first is the mean and median of the annual difference in the percentage change in performance between the sample and control firms. These results show the year‐to‐year performance change in the award‐winning firms relative to control firms. The second set of results report the mean and median of the percentage difference in performance between the sample and control firms over several longer time intervals, such as between years −1 and +1, −1 and +2, −1 and +3, and −4 and +3 to reflect different patterns of change in performance across firms (see Hendricks and Singhal [1997b] for a discussion on using different time intervals to detect changes of performance over time).
Table 5 reports the mean and median changes on three return/profitability measures when the control firms are selected based on matching on industry, ROA, and R&D intensity. Panel A of the table shows the control adjusted changes on an annual basis over the 8‐year period starting from year −4 and ending in year +3, whereas Panel B gives the results on several longer periods reflecting the changes from 1 year and 4 years before the innovation award to 1, 2 and/or 3 years after the award. Panel A shows that the annual mean and median changes in ROA and ROS are all positive and significant at the 10% level in most years. It also shows that on an annual basis, both the mean and median changes in operating income of the award‐winning firms are positive and significant at the 5% level in the majority of cases. Over the longer time intervals, Panel B shows that the mean changes in ROA, ROS, and operating income are all positive and significant in nearly all cases. For example, from years −4 to +3, the award‐winning firms have, on average, about 32.6% higher ROA, 34.5% higher ROS, and 39.1% higher operating income than the corresponding control firms. The median changes in these measures, although still significant at the 5% or 10% level, have relatively smaller values than the mean changes. Overall, the results provide strong evidence that the returns on investment for the test firms are significantly higher than for the control firms.
Mean and Median Control Adjusted Percentage Changes in ROA, ROS, and Operating Income with Control Firms Selected by Industry, ROA, and R&D Intensity
Table 6 reports the control adjusted changes in sales, total cost/sales, and Tobin's Q over one‐year period (Panel A) and over longer time periods (Panel B) when the control firms are selected by matching on industry, prior performance, and R&D intensity. Panel A shows that on an annual basis, both the mean and median changes in sales of the award‐winning firms are positive and significant (p < 0.05) in almost all intervals. For the ratio of total cost to sales, the mean changes are negative and significant at the 10% level in all years except from year 0 to +1. The median changes are negative and significant at the 10% level only at years −1 to 0 and +2 to +3. The annual mean change in Tobin's Q is positive in all years except from year −4 to −3, but is only highly significant at the 1% level for years from +2 to +3, and significant at the 10% level from years −3 to −2, −2 to −1, and −1 to 0. The annual median change is only significant at the 5% level for years +2 to +3.
Mean and Median Control Adjusted Percentage Changes in Sales, Cost, and Tobin's Q with Control Firms Selected by Industry, ROA, and R&D Intensity
From 1 year before to 1, 2, and 3 years after winning an award, Panel B of Table 6 shows that the mean (median) changes in sales are positive and significant at the 1% (10%) level. For the cost per dollar of sales and Tobin's Q, the mean changes are significant (p < 0.05 or 0.10) for all three time intervals, but the median changes are not. Over the 8‐year period from years −4 to +3, the mean (median) control adjusted change in sales is about 39.3% (20.7%). Over the same period of time, the mean (median) change in cost per dollar of sales of the sample firms is 5.5% (3.8%) lower than that of the control firms. These changes are significant at the 5% level. In addition, the award‐winning firms have about 23.7% (3.2%) higher Tobin's Q than the control firms in control adjusted mean (median) with the difference significant at the 5% (10%) level.
We have also conducted an extensive set of sensitivity analyses based on different groups of control firms selected with different matching criteria. First, our selection of control firms was based on the firm performance and characteristics in the year before the award year. Although this is the standard practice in the literature, the results may be biased because the matching does not consider the temporal change in firm performance. Award‐winning firms may have higher percentage change in performance compared with the control firms before winning the awards, thus carrying that momentum into the future. To rule out this possibility, we ran analyses based on control firms selected with similar percentage changes in ROA and/or R&D intensity from year t−2 to year t−1. The results, as shown in Tables 7 and 8, are quite similar.
Mean and Median Control Adjusted Percentage Changes in ROA, ROS, and Operating Income with Control Firms Selected by Industry, Percentage Change in ROA, and Percentage Change in R&D Intensity
Mean and Median Control Adjusted Percentage Changes in Sales, Cost, and Tobin's Q with Control Firms Selected by Industry, Percentage Change in ROA, and Percentage Change in R&D Intensity
Second, we used the ROA as the measure of performance in choosing control firms. Although matching based on ROA is an accepted approach, we considered other performance measures, such as operating income, ROS, sales, and total costs as the basis for the selection of control firms. The results are largely unchanged from our main results reported earlier and are not reported here due to the similarity.
Third, although we define the abnormal performance measure as the percentage change in financial performance between a sample firm and its control firm at two different time periods, abnormal performance can also be defined as a simple change in the performance of a sample firm relative to that of the control firm. To check the robustness of our results to the different ways to calculate abnormal performance measures, we reran the analyses and found the results do not change qualitatively.
Finally, based on other popular ways of choosing control firms discussed in the literature, we have also run the analysis by selecting control firms by industry, firm size, and ROA, and by industry and ROA without considering the R&D intensity. Results from these additional analyses are again similar to those reported earlier.
An alternative explanation to our findings is that, rather than a signal of effective innovation programs, innovation awards may in themselves create value to firms. In other words, receiving innovation awards may substantially improve customer perception of the firm, leading to a reputational effect. While this mechanism may exist, our finding that award‐winners continuously had better performance even before the announcements of the awards suggests that our results are more likely to be an outcome of well‐designed innovation programs.
Tables 9 and 10 provide the panel regression results. Table 9 shows results from short‐term models with 1‐year lag for R&D intensity, whereas Table 10 shows results of long‐term models with 3‐year lags for R&D intensity. Models 1–6 in both tables report results for each of the six performance measures used as the dependent variable. For all models, we checked the variance inflation factors (VIFs) and found that none of them was greater than 4, indicating that multicollinearity is not a big concern in our study.
Results of Panel Regression Analyses with 1‐Year Lag for R&D Intensity
Results of Panel Regression Analyses with 1‐Year Lag for R&D Intensity
Standard errors are in parentheses.
ROA, return on assets; ROS, return on sales.
† p < 0.10; * p < 0.05; ** p < 0.01; *** p < 0.001.
Results of Panel Regression Analyses with 3‐Year Lag for R&D Intensity
Standard errors are in parentheses.
ROA, return on assets; ROS, return on sales.
† p < 0.10; * p < 0.05; ** p < 0.01; *** p < 0.001.
Results in Table 9 show that in the short term, R&D intensity significantly decreases the firm profitability in ROA and ROS (Models 1 and 2), largely due to its negative effect on cost as shown with Model 5. R&D intensity, however, does not affect operating income, sales, and Tobin's Q in a significant way. On the other hand, award dummy is highly significant (p < 0.001) in all six performance models, suggesting that winning an innovation award does contribute to improved firm performance. The interaction effect between R&D intensity and award winning is positive and highly significant in models on ROA and ROS. This indicates that besides its direct impact, an effective innovation program can also indirectly influence firm performance by streamlining R&D spending.
These findings are robust when we look at the results from the long‐term models reported in Table 10. For example, award dummy is highly significant (p < 0.01) in all performance models except the Model 6 for Tobin's Q. There is a significant positive interaction effect between R&D intensity and award dummy for Models 1 and 2, again showing the higher returns of award‐winning firms. Interestingly, while R&D intensity negatively affects ROA and ROS in the short term, its effect on the financial returns is positive and significant in the longer term models, suggesting the possible lagged effect of R&D expenditures on firm performance.
The coefficients for the control variables are generally consistent with the existing literature. We observe that although larger firms can generate more revenue than smaller firms, there is a negative firm size effect on profitability and market value. This supports the argument that, as firms grow larger, they become more ossified and less adaptive, leading to a lower firm performance (Haveman 1993). We find alliance connections reduce operating costs and increase profitability. This can be explained by the fact that interfirm collaboration allows firms to share cost of new product development and access to complementary assets owned by their partners (Powell 1990). Moreover, P&E newness is negatively related to profitability. This finding can be attributed to increased operating costs.
By analyzing a sample of more than one thousand publicly traded firms that won innovation awards during 1998–2003, this study empirically tests the influence of an effective innovation program on firm performance. We find that over an 8‐year period from 4 years before to 3 years after the year of winning the first innovation award, the test sample's mean (median) change in operating income exceeds that of a control sample by 39.1% (36.2%). Over the same time span, the control‐adjusted mean (median) changes in ROA and ROS are 32.6% (23.5%) and 34.5% (24.1%), respectively. Together, these findings provide strong support to the view that an effective innovation program improves organizational profitability.
Our evidence also suggests that effective innovation programs significantly increase revenue and cost efficiency. From years −4 to +3, the test sample outperforms the control in terms of mean (median) change in sales by 39.3% (20.7%), and the mean (median) change in cost per dollar of sales is −5.5% (−3.8%) when compared with the control group. Furthermore, the test sample has better market valuation; over the period, the control‐adjusted mean (median) change in Tobin's Q is 23.7% (3.16%).
The results from the panel regression analysis are largely consistent. Over our study period, the test firms persistently outperform the sample firms in terms of all six performance criteria. In addition, the results show that besides its direct influence, implementing an effective innovation program can also indirectly contribute to an increase in profitability by improving R&D efficiencies.
This study contributes to knowledge about the value of effective innovation programs. Of interest to note, our event‐study results are based on samples matched for R&D intensity. Thus, the observed difference in performance is not an outcome of the disparity of R&D expenditure, but rather how effectively firms implement their innovation strategies. In this way, our findings advance understanding of the importance of innovation effectiveness, a key aspect of the innovation process that has been largely ignored by previous research. Our results also shed light on the on‐going debate about whether R&D adequately reflects a firm's innovation activity. Proponents have argued that the amount of resources a firm commits to R&D signals its innovation effort and strategic orientation. They claim that R&D is a reasonable indicator of innovation considering the fact that firms' true innovation capabilities are often hard to observe directly. Other researchers, however, stress that R&D is only an input to the innovation process (e.g., Heeley et al. 2007, Kochhar and David 1996), and the utility of this measure is constrained given the pattern of diminishing return of R&D spending (Graves and Langowitz 1993). That is, the more a firm devotes to R&D, the lower its innovation productivity. Our study adds to this debate by showing direct evidence that firms with similar levels of R&D spending may have substantially different quality of innovation outputs. Thus, innovation management scholars should be cautious about the limitations of R&D‐based measures. They might consider applying multiple innovation measures at the same time to capture the richness and various dimensions of the concept.
The findings reported in the study also offer insights to the dynamics of competence construction within organizations. Danneels points out that while “studies consistently showed a positive impact of project‐firm synergy (the extent to which the project can draw on existing in‐house resources and skills) on new product performance … studies have not considered the reverse direction of the product innovation‐competence relation, that is, the effect that new product projects in turn have on the firm's competences and its trajectory of renewal” (2002, p. 1096). Through a field study of five firms in high‐tech sectors, the author detects that the reverse relation does seem to exist (at least is salient in the selected firms for that research). This finding is consistent with the emerging literature on dynamic capabilities, which posits that innovation constitutes a meta‐capability that assists to “integrate, build, and reconfigure” competences for competitive advantages (Teece 2007, Teece et al. 1997, Winter 2003). Whereas the extant dynamic capabilities literature on this focus is mostly concerned with how R&D affects future product development (e.g., Rothaermel and Hess 2007), we concentrate on the impact of innovation on more general firm operations. We find that an effective innovation program is beneficial to firms in terms of nurturing their abilities to generate revenue and sales, to control and reduce operating costs, and to attract additional investment by influencing investors' perception of the firms' future growth opportunities. In doing so, we respond to Danneels's (2002) call for more research on the role of innovation in firm competence development.
Our finding that the award‐winning firms experience significant performance improvement both before and after receiving the award are congruent with that of Roberts (1999), which demonstrates that innovation propensity leads to persistent profitability. Whereas Roberts's study focuses on product innovation in pharmaceutical firms, we are able to show that the association between innovation and sustained performance is more generic in the sense that it is applicable to assorted innovations and holds in a wide range of industry contexts. One possible explanation of the sustained competitive advantages is that engaging in effective innovation programs permits firms to develop skills in rejuvenating themselves. This ability, once learned, in turn offers guidelines for firms to stay at a high level of innovativeness. In this regard, a firm's innovation ability is cumulative and path‐dependent (Roberts and Amit 2003). This accounts for why companies, such as Apple, Google, IBM, and Procter & Gamble have been continuously ranked as the world's “most innovative companies” by Businessweek and other business press. A recent analysis of innovation leaders has revealed that these companies are successful in delivering “significant and sustained growth based on clear strategic ambitions, fast exploitation of new insights and effective collaboration across the innovation arena” (Innovaro 2008). These firms know not only how to innovate but also how to make their innovation processes effective.
There are several limitations with this work. First, not all innovation awards were created equal, with some awards issued by independent agencies while others are offered by a firm to its supplier. This difference could be relevant because the awards vary in their evaluation criteria or standards, and thus could have implied different levels of innovation. Nevertheless, the results show that award winners reap significant financial rewards over control firms, regardless of the award type. Second, we used company‐wide financial data, whereas an award might be given to a product or service that is offered by an unit of a large firm, which may result in an underestimate of the benefits from award‐winning events. However, this is a common practice in similar research due to the difficulty in obtaining unit‐specific financial performance data (see Hendricks and Singhal 1996, 1997b). Third, a firm is likely to win multiple awards from multiple sources. The number of awards as well as the nature of the award may indicate different levels of performance impact. However, only the first award was considered in this study, regardless of the award type. This may not be a major limitation as it only makes our tests more conservative.
There are several research opportunities for future studies. First, our results provoke an important question: What accounts for an effective innovation program? In other words, why do firms differ in their innovation effectiveness? It is possible that the effectiveness of an innovation program depends on the support of other organizational systems. For example, Damanpour and Evan's (1984) study indicates that a balance between technical and social systems is required for optimal innovation outputs. Gibson and Gibbs (2006) show that the presence of a well designed virtual network system can facilitate team cooperation. As such, future research should examine how these systems may affect (or possibly jointly influence) firms' propensity to receive innovation awards. Second, the main focus of the study has been on operational and financial performance. Yet an equally important issue is how an effective innovation program can enhance firms' subsequent innovation performance. In analyses not reported in this study, we regressed patent counts and patent citations on the variables listed in Tables 9 and 10. 9 We find that award winning has significant impact (p < 0.01) on the dependent variables in both 1‐year lag and 3‐year lag models. This suggests that award winning is self‐reinforcing. These results are preliminary and require replication over a longer time period. Thus, future research in this direction is warranted. Third, given our finding of the long‐lasting competitive advantages of effective innovation programs, specifying the underlying mechanisms of such benefits might be a fruitful avenue for future research. Survey research can be conducted to provide an in‐depth examination on how awardees successfully carry out their innovations. Survey data may also be collected from both award winners and control firms to compare their differences in organizational factors and implementation process. In addition, as the winning of innovation awards is not a direct measure of innovation effectiveness, future survey‐based research can help generate additional evidence of the validity of using award winning as a proxy for the effectiveness of an innovation program. Finally, to better understand the role of award characteristics, future research might investigate how the type of award, the time of the award, and the number of awards are related to firm performance.
Footnotes
1
2
We checked a number of other innovation awards (e.g., DuPont Awards for Innovation in Packaging, Innovation Excellence Award, Best of What's New, etc.) and found similar requirement for application.
4
An extraordinary item is a gain or loss in a firm's earnings due to a non‐recurring event that is out of the firm's control.
5
We distinguish between high‐impact‐vs.‐minor innovations and radical‐vs.‐incremental innovations. Whereas the former classification concerns what degree of social impact an innovation has, the latter focuses on the way the innovation is related to previous ones (see Banbury and Mitchell 1995, Jansen et al. ![]() ). A high‐impact innovation can be incremental. For example, Microsoft received the Technical Innovation Award for its Office 2000 VBA in 2000 and the Software Product of the Year Award for its Office v. X exclusively used in Mac operating system in 2001. These products are improved or updated versions of previous offerings.
). A high‐impact innovation can be incremental. For example, Microsoft received the Technical Innovation Award for its Office 2000 VBA in 2000 and the Software Product of the Year Award for its Office v. X exclusively used in Mac operating system in 2001. These products are improved or updated versions of previous offerings.
6
By matching ROA, we provide additional control for the possibility that financially successful firms are more likely to win innovation awards, although financial performance is commonly not a criterion for selection of innovation award winners.
7
We thank an anonymous reviewer for pointing out this issue.
8
We also constructed a 3‐year window alliance variable to take account for the possible variation in alliance duration. The results are qualitatively the same.
9
The results are available from authors.