
Abstract
Customers who face a stockout situation often decide to purchase a different product in the same category. We analyze the resulting dynamic substitution problem in a retail environment, where customers serve themselves from the store shelves, such that the sequence of customer arrivals affects how scarce products are allocated to customers. We consider a setting with constrained shelf space, and we study how a retailer should optimally allocate such space between substitute products. We characterize environments where the sequence of customer arrivals can have a substantial impact on profitability.
Introduction
In most product categories, customers face a wide range of product options due to both multiple brands within a product category and product proliferation within each brand. The days of “one size fits all” are long gone. Product line extensions allow the company to position products for many different customer niches. The family of products can be cost effective by sharing costs of product development, manufacturing resources, logistics networks, and advertising, among many other costs. Similarly, retailers will frequently stock products from multiple manufacturers to meet the needs of the widest possible variety of customers. Importantly for this research, the similarity between different members of an extended product family or different brands allows the products to be at least partially substitutable for each other in the eyes of the customer. A shopper wishing to purchase a particular brand's “whole wheat” bread may likely be willing to purchase another brand's “whole wheat” bread if their first choice product is not available. A customer entering The Gap to purchase a pair of “relaxed fit” khaki pants might purchase a pair of “classic fit” pants when the store is sold out of the “relaxed fit” pants in the customer's size. Empirical studies suggest the fraction of customers who purchase a substitute product when experiencing a stockout lies between 32% (Emmelhainz et al. 1991) and 43% (Gruen et al. 2002).
Product proliferation has, however, made more difficult the stocking decisions facing today's retailers. Companies should take potential substitutability of demand into consideration when they make stocking decisions. In most retail settings, customers arrive over time (on a continuous basis) and decide whether to purchase one or more of the products that are available at the time of their visit. If they are unable to find the product they would most like to purchase, they may be willing to buy a similar product. Such a substitution of demand will result in a sale for the retailer (and the rest of the supply chain), but may have hidden costs associated with it. Because the customers were unable to find the product they had intended to buy, they may choose not to visit the same retailer on future shopping trips. In addition, by purchasing a substitute product, the customer has hastened an out of stock position of the alternative product, which may soon lead to disgruntled customers who come into the store seeking the alternative product as their first choice.
We examine a model of two products, with each product serving as a substitute for the other when its supply is exhausted. In our model, the sequence of customer arrivals is important because we consider a retail setting, where customers serve themselves from the store shelves without revealing their preferred product to the retailer. Although our two‐product model will not completely capture the nuanced substitution behavior exhibited in the presence of a larger set of products, the computational complexity added by considering the sequence of customer arrivals necessitates a focus on two products. We consider the price and cost of each product, as well as the costs of a customer purchasing their non‐preferred product or not purchasing any product. By comparing our results with policies where such customer‐driven product substitution is not considered, we calculate the benefit of more fully modeling the situation facing many of today's retailers.
The phenomenon of customer‐driven product substitution is most prevalent in settings with sizable likelihood of product stockouts. Quelch and Kenny (1994) report that between 1985 and 1992, the number of consumer‐packaged goods SKUs grew 16% each year, whereas retail shelf space expanded at a much slower rate of only 1.5% per year. As a consequence, retail shelf space has become increasingly scarce, and rather than determining individual stocking quantities in isolation, most retailers face a problem of allocating a limited resource between several alternative products. We assume that an exogenously determined amount of shelf space is available for the product category.
While we consider a retail setting where customers arrive sequentially and serve themselves from a limited shelf space, our insights might apply to other environments with a limited number of products, sequential customer arrivals, and immediate substitution decisions based on current product availability. For example, a restaurant owner must purchase seafood for menu specials, with the limited quantity of available meals allocated to diners on a first‐come, first‐serve basis. A Boston‐area newsvendor purchases a limited quantity of both the Boston Globe and the Boston Herald, knowing that customers may be willing to substitute one paper for the other once his stock of a given paper has been completely sold. An airline must equip a plane with first‐class and economy‐class seats, knowing that passengers make purchase decisions based on seat availability they see on web‐based travel sites such as Expedia and Orbitz. Each of these scenarios represents a stocking decision regarding two different products or services that must be made prior to realizing customer demand, with the actual sales and substitution of each product or service dependent on the sequence of customer arrivals. For expositional purposes, we will use the language of a retail setting for the rest of this article despite the fact that our model provides insights into a broad array of scenarios in which substitution is customer‐driven.
Specifically, in this article we address the following research questions: How should a retailer allocate shelf space between two substitute products if customers arrive sequentially and serve themselves from the store shelves? Under what circumstances and for what types of products is considering the sequence of customer arrivals most important?
The remainder of this article is structured as follows. We review the related literature in the following . In , we introduce our modeling framework and establish some structural properties of the problem. In , we numerically study the optimal stocking policy under dynamic customer arrival and compare it to several intuitive benchmarks. We conclude in .
Literature Review
There is a substantial body of research that addresses inventory problems in the context of product substitutability (see Mahajan and van Ryzin 1999 for a review). One stream of this literature considers the problem of manufacturer‐controlled one‐way substitution, where the manufacturer can decide to fill demand for one product type of lower quality with inventory of a higher quality product. For example, a fast computer chip might be used to satisfy demand for a slower chip, or a car rental customer with a reservation for an economy class car might be upgraded to the full size class. The general focus of this literature lies on deriving structural insights, characterizing optimal inventory policies, and providing heuristics or algorithms for determining the optimal stocking levels (e.g., Bassok et al. 1999, Bitran and Dasu 1992, Hsu and Bassok 1999, Pentico 1988, Rao et al. 2004, Shumsky and Zhang 2008). Very similar problems have also been studied in the context of lateral transshipments (e.g., Axsäter 1990, Grahovac and Chakravarty 2001, Lee 1987, Rudi et al. 2001) and in the substantial body of research on component commonality or capacity flexibility, where a general product (or flexible machine) can be used to satisfy more specific requirements (e.g., Baker et al. 1986, Cattani et al. 2003, De Groote 1994, Shumsky 2004, Van Mieghem 2004).
The restrictive assumption of only one‐way or downward substitutability does not seem to match practice in retail settings, where most customers are likely to consider different products in a category. Also, unlike manufacturers in the production process, retailers lack the ability to assign individual products to specific customers. In a manufacturing setting, especially as it has been modeled in most of the literature, orders from various customers are aggregated into a total demand for a period, and only then are products allocated to satisfy the aggregate demand. In a retail setting, on the other hand, customers choose which product to purchase, if any, based on product availability at the moment of demand.
The substantial array of research on problems with two‐way substitutability generally concurs that this problem is analytically not tractable and usually employs numerical analysis or simulation to generate insights (Ernst and Kamrad 2006, Ernst and Kouvelis 1999, McGillivray and Silver 1978, Nagarajan and Rajagopalan 2008, Parlar and Goyal 1984, Pasternack and Drezner 1991, Rajaram and Tang 2001, Yang and Schrage 2007). This set of research also assumes an ex post allocation of products to customers, such that customers with a preference for a certain product will always receive their desired product, when the retailer stocks more than the product's aggregate primary demand—irrespective of the demand for other substitute products. As discussed in the introduction, it might occur that customers with preference for product A do not find their preferred product available and hence start purchasing a less‐liked product B, eventually inducing a shortage of product B. In this article, we consider a more complex and arguably more realistic retail environment, where customers arrive sequentially and make their substitution decisions based on the inventory available at the moment of their arrival, implying that product sales and the retailer's profitability depend on the specific sequence of customer arrivals, rather than only on the aggregate demands for the different products. We explicitly consider these dynamics and demonstrate the important impact of such stockout‐based demand interactions on a retailer's optimal stocking decisions.
There is a limited set of papers that consider dynamic customer arrivals in a setting with customer‐choice based product allocation. Smith and Agrawal (2000) develop a probabilistic demand model for capturing the effects of product substitution and construct a methodology for determining product assortments and inventory levels to maximize expected profit, subject to given resource constraints. Van Ryzin and Mahajan (1999) analyze the same assortment composition and stocking problem using the multinomial logit model to describe the consumer choice process. More restrictive assumptions enable them to derive analytical tractability and structural insights into the trade‐off between inventory costs and variety benefits under product substitution. Although Smith and Agrawal (2000) and Van Ryzin and Mahajan (1999) address the issue of substitution based on consumer choice, in their models consumer choice depends only on the product types that are part of the assortment, and not on the products' inventory levels.
Gaur and Honhon (2006) consider assortment and inventory decisions in a setting where customers dynamically substitute in the event of a stockout, assuming that customer preferences are represented by a locational model. Although they cannot derive optimal solutions to this problem, they derive intuitive bounds based on static and retailer‐controlled substitution, and they use these bounds to suggest heuristics and numerically evaluate their performance. Honhon et al. (2010) consider a more general version of this problem where customer types are represented through their product preference rankings. They provide a dynamic programming algorithm to determine the optimal assortment and inventory levels when the number of customers of each type is a fixed fraction of total demand. For the more complex case where these fractions are random, they numerically show the solutions of their algorithm to be near‐optimal. Rather than deriving efficient heuristics for real‐size problems, our focus lies on evaluating the impact that the sequence of customer arrivals can have on sales and on a retailer's bottom line. We explicitly consider the case where customer types are random fractions of total demand. Hence, although our model is more restrictive than that of Honhon et al. (2010) in some problem aspects, it is more general in that we consider uncertainty in both total demand and individual customer choice.
Mahajan and van Ryzin (2001) study the problem with dynamically arriving customers who choose products that maximize their utility, and substitute in the event of a stockout. Using sample path analysis, they derive some structural properties of the expected profit function and propose a stochastic gradient algorithm. They numerically analyze how product substitutability affects optimal stocking decisions and when considering these effects is most important in terms of expected profits. Hopp and Xu (2008) propose a fluid network approximation for dynamic customer‐driven substitution, and they apply their method to study the effects of competition in price, service, and product assortment.
Although these papers address similar problems, there are several significant differences to our work. For one, we use a different methodology, allowing us to establish quasi‐concavity of the expected profit function and to derive explicit expressions for expected profits, so that we do not need to approximate the solution or to enumerate different possible sample paths. Hence, although our modeling of customer arrivals and choice process is slightly more restrictive, it enables a simpler and more complete analysis of the problem. Another important difference is that we consider a setting with constrained retail shelf space, introducing an additional dimension of interdependence between the optimal stocking levels of the individual products. Relative to the number of stock‐keeping‐units, retail shelf space has become increasingly scarce, and rather than determining individual stocking quantities in isolation, most retailers face a problem of allocating a limited resource between numerous alternative products. Work that takes the shelf space constraint into consideration (e.g., Erlebacher 2000, Cachon 2001, Chong et al. 2001, also see references in Mahajan and van Ryzin 1999) neglects the issues of product substitutability that we discussed above.
Kök and Fisher (2007) consider a retailer's assortment planning and stocking problem subject to a binding shelf‐space constraint. They suggest a procedure for estimating demand and substitution parameters and develop an efficient iterative heuristic to determine near‐optimal assortments. Kök and Fisher (2007) consider inventory‐based substitutions by customers, but their substitution model is based on aggregate demand information and does not consider the sequence of customer arrivals, which is the primary focus of our work.
To the best of our knowledge, there has been no research on stocking decisions of a retailer with limited shelf space facing dynamic arrivals of customers who, if confronted with a stockout of their desired product, may be willing to purchase a substitute product.
Model Formulation and Structural Results
We consider a model with two customer types and two products. Customers of type 1 prefer product 1, and customers of type 2 prefer product 2. Customers from segment i (i = 1, 2) arrive at rate λ i , with customer arrivals following a general interarrival time distribution at rate λ (λ = λ1 + λ2). We assume that an arriving customer is of type i with probability ρ i = λ i /λ, independent of the arrival history. Without loss of generality, we consider a selling period of length 1, so λ i represents the expected number of customers of type i during the selling period. Let c i and r i denote the stocking cost and the sales revenue of product i, regardless of which customer type purchases the product. For expositional simplicity we assume that units left over at the end of the horizon are worthless. In our model, a salvage value z i for leftover units of product i could be captured by using adjusted unit stocking costs of c i ' = c i – z i and adjusted unit revenues of r i ' = r i – z i , so the assumption of zero salvage values is without any loss of generality.
Let α i represent the likelihood that a customer of type i will purchase the alternate product when it is the only product available; 1−α i represents the likelihood a type i customer will choose not to purchase any product despite the availability of the alternate product. When a customer of type i purchases the alternate product, the firm incurs a substitution cost of s i to account for the loss of future profits from the customers who are not able to purchase the product they desire (lost goodwill). Hence, among those customers who substitute, the substitution cost s i measures the strength of customer preferences for the first‐choice product as compared to the second‐choice product. The firm incurs a stockout cost of b i for each customer of type i who does not purchase any product. It is notoriously difficult to estimate the full cost impact of stockouts, which not only reduce immediate sales revenues, but might also reduce customer goodwill and thus negatively affect demand in future periods (e.g., Campo et al. 2000, Emmelhainz et al. 1991, Fitzsimons 2000, Gaur and Park 2007, Gruen et al. 2002, Hall and Porteus 2000). Although estimating the costs associated with stockouts is beyond the scope of this article, useful guidance as to how such costs could be measured can be found in Anderson et al. (2006), who conduct a field study to measure the stockout costs in a catalog company. Although we do not make any assumptions about the ordering of the different penalties associated with stockouts, in most real‐life environments one would expect that b i > s i .
We use “–i” to denote the product different from product i. If a unit of product i is sold to a type i customer, the retailer incurs the stocking cost c
i
, earns sales revenue r
i
, and avoids a stockout cost b
i
, so the effect on profits is r
i
– c
i
+ b
i
. If the unit is sold to a customer who prefers the alternate product, the retailer incurs the same stocking cost c
i
and obtains the same sales revenue r
i
, but avoids a stockout cost of b
‐i
; the retailer also incurs a substitution cost of s
‐i
, as the served customer cannot buy his preferred product. Hence, the impact on profits in this case is r
i
– c
i
+ b
−i
– s
−i
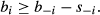
. We assume that an available unit of product i is at least as profitably used to satisfy demand of a type i customer as that of a customer preferring the alternate product, that is, r
i
– c
i
+ b
i
≥ r
i
– c
i
+ b
−i
– s
−i
, or equivalently
The retailer has a fixed shelf space that allows him to stock a total of Q units. We assume all inventory at the store is kept on the shelves and a unit of each product occupies the same amount of shelf space. Consistent with our focus on settings where stockout‐based substitution is a prevalent phenomenon, we assume that shelf space is a binding constraint, that is, the retailer will use all available shelf space; the retailer then must decide how much of the shelf space to allocate to each product. Let q i represent the quantity of product i the retailer has decided to stock. Because q 1 + q 2 = Q, it holds that q 2 = Q – q 1.
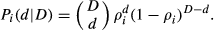
Let P(D) represent the probability that D customers arrive. The probability that a total of D customers will include exactly d type‐i customers then can be expressed as
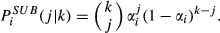
For customer type i, if demand exceeds supply by the amount k≥0, the probability of j≤k customers willing to make a substitution is
Consider the nth arriving customer. This customer might encounter three possible situations: the preferred product is available on the shelf (case A), the preferred product is stocked out, but the alternative product is available (case B), or both products are out of stock (case C).
Let P
i
m
(n,q
1,q
2) denote the probability that the nth arriving customer is of type i and encounters case m = A, B, C, if q
1 units of product 1 and q
2 units of product 2 are stocked. Then for i = 1, 2, we have the following:
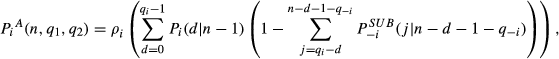
The expression in equation covers the case where the nth arriving customer of type i finds the preferred product on the shelf, so we consider all possible realizations where the total previous demand for this product has been strictly less than the stocked quantity. Specifically, we take all possible realizations of primary demand for the target product (the first sum), and for each realization, we consider the probability that the remaining products have not been bought by customers with preference for the other product, who did not find their preferred product and hence substituted (term in the inner bracket).
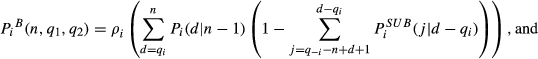
Similarly, the expression in equation covers the realizations where the nth arriving customer of type i finds only the substitute product available. In this case, the previous primary demand for product i must have exceeded the stocked quantity (first sum), and for each realization, the spillover demand from previous type‐i customers must have been strictly less than the available inventory of the substitute product, after having accounted for the demand of customers with preferences for that product.
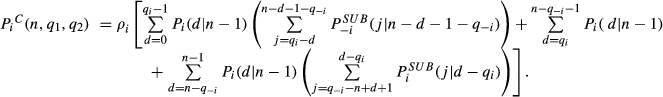
Finally, in equation we consider all possible realizations that lead the nth customer of type i to find neither product available in the store. The three summations over d cover all possible realizations of primary demand for product i. The first summation considers the cases where previous primary demand for product i has been less than the stocked quantity, but where the remaining products have been picked up by customers with preference for product j, after inventory of that product was depleted. The second summation covers the cases where primary demands for both products have been sufficient to deplete all inventory, and the third summation considers the scenarios where prior primary demand for product i has depleted inventory of that product, and where the subsequent substitute demand from customers with preference for product i has depleted the inventory of product j.
Associating these probabilities with their respective profit contributions, the expected contribution of the nth customer can be determined as
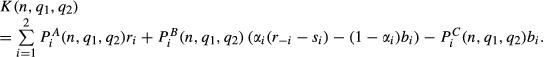
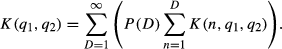
Let K(q
1,q
2) represent the expected benefit of stocking q
1 and q
2 units of product 1 and product 2, respectively, where
The retailer decides how to allocate shelf space between the two products (by choosing q
1 and setting q
2 = Q – q
1) to maximize the expected profit

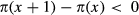
The expected profit function π(q
1) exhibits decreasing differences.
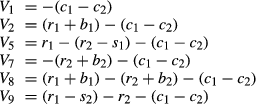
We show that the expected profit function exhibits decreasing differences by considering the impact that stocking one more unit of product 1 (and thus one less unit of product 2) has on expected profitability. Table organizes all possible demand realizations according to sales outcomes for the unit of product 2 that is no longer stocked and for the added unit of product 1. Let V
i
and P
i
denote the profitability impact and the probability of case i, respectively. Exchanging a unit of product 2 for a unit of product 1 can never lead to the outcomes described under cases 3, 4, and 6, so P
3 = P
4 = P
6 = 0. For the remaining cases, exchanging one unit of product 2 for one unit of product 1 has the following effects on profitability:
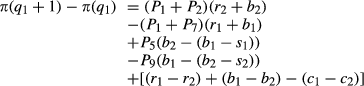
The expected impact of exchanging one unit of product 2 for one unit of product 1 then equals π(q
1 + 1) – π(q
1) = P
1
V
1 + P
2
V
2 + P
5
V
5 + P
7
V
7 + P
8
V
8 + P
9
V
9 or, after some straightforward manipulations, The term in the last bracket is constant. Because r
i
+ b
i
> 0 and b
i
≥ b
−i
– s
−i
by assumption , it is sufficient to show that, as q
1 increases, (1) (P
1 + P
2) decreases, (2) (P
1 + P
7) increases, (3) P
5 decreases (or is non‐increasing), and (4) P
9 increases (or is non‐decreasing). Any sample path where case 5 applies when starting at a higher level of q
1 would have also led to case 5 when starting at a lower level of q
1, so P
5 must be non‐increasing in q
1. Similarly, any sample path where case 9 applies before adding a unit of product 1 would also lead to case 9 after adding that product, so P
9 must be non‐decreasing in q
1. Hence, points (3) and (4) are true. We next show that point (1) is true, that is, (P
1 + P
2) is decreasing in q
1. (We then use a symmetry argument to show that this result implies the result in point (2).) Consider the effect of exchanging one unit of product 2 for one unit of product 1 when starting with q
1 – 1 units of product 1 and q
2 + 1 units of product 2, that is, consider the change from (q
1 – 1, q
2 + 1) to (q
1, q
2). Using D
i to denote the (random) number of arriving type‐i customers, the probability of case 1 can be expressed as P
1 = Prob(D
1 < q
1 AND D
2 < q
2 + 1), and the probability of case 2 is P
2 = Prob(D
1 ≥ q
1 AND D
2 < q
2 + 1 AND D
1 – (q
1 – 1) substitution attempts lead to less than q
2 + 1 – D
2 substitutions). Consider all possible demand realizations with D
2 < q
2 + 1. All these demand realizations lead to cases 1 or 2 with some probability. If D
1 < q
1, case 1 always applies when starting with q
1 – 1 units of product 1. If D
1 ≥ q
1, case 2 applies if and only if the substitution attempts of excess type‐1 customers failed to pick up the q
2 + 1st unit of product 2. Increasing the initial level of q
1 decreases (P
1 + P
2), because all probabilities associated with demand realizations where D
2 = q
2 are no longer part of (P
1 + P
2), and as the probability that the remaining demand realizations (where D
2 < q
2) are still in case 1 or case 2 is non‐increasing. To prove the latter point (that demand realizations with D
2 < q
2 are less likely to be in case 1 or case 2), we distinguish between two scenarios: The realizations with D
1 = q
1 move from case 2 to case 1. However, all these cases already had a 100% probability to belong to case 2 before (because the number of substitution attempts was smaller than the available excess inventory in all these cases), so the probability with which these demand realizations belong to cases 1 or 2 remains the same. The other demand realizations (with D
2 < q
2 and D
1 > q
1) are less likely to still belong to case 2. Consider any demand realization (x
1, x
2) from that set. When starting with q
1 – 1 units of product 1, the probability with which this realization belonged to case 2 was Prob(x
1 – (q
1 – 1) substitution attempts lead to less than q
2 + 1 – x
2 substitutions). When starting with one more unit of q
1, the probability with which the same demand realization still forms part of case 2 is Prob(x
1 – q
1 substitution attempts lead to less than q
2 – x
2 substitutions). Whenever x
1 – q
1 attempts lead to less than q
2 – x
2 substitutions, x
1 – (q
1 – 1) attempts must lead to less than q
2 + 1 – x
2 substitutions, so the probability of the first event cannot be smaller. Because the labeling of the products is arbitrary, the fact that the probability (P
1 + P
2) is decreasing in q
1 implies that the probability (P
1 + P
7) is decreasing in q
2, and thus increasing in q
1, which completes the proof.
One of the following three cases holds:
For some integer


Proposition and Corollary indicate that the profit function exhibits quasi‐concave properties that allow one to identify the optimal stocking level of each product given a fixed total shelf space. Analyzing the structure of the difference function also provides insight into the effect of certain parameters on the optimal stocking levels, as indicated in Proposition .
For given shelf space Q, the optimal stocking level of product 1 (q
1*) weakly increases (decreases) with an increase in the following:
r
1
(r
2
), the unit revenue of product 1 (product 2)
b
1
(b
2
), the stockout cost of product 1 (product 2)
s
1
(s
2
), the substitution cost of product 1 (product 2)
c
2
(c
1
), the cost of product 2 (product 1)
From Corollary , q
1* increases (weakly) when the difference in expected profits π(q
1 + 1) – π(q
1) is increased for all values of q
1. Likewise, q
1* decreases (weakly) when the difference declines for all values of q
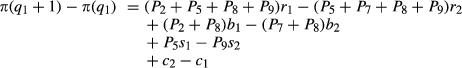
1. Slight rearrangements of the difference function in gives the following:
The results given in Proposition then follow directly from inspection. □
Consistent with intuition, Proposition shows that, other things equal, more shelf space should be allocated to the product with higher profitability (higher unit revenue r i and/or lower stocking cost c i ), higher stockout cost (b i ), and higher substitution cost (s i ). In the following section, we conduct a numerical study to gain further insights into the optimal stocking policy.
In this section, we numerically characterize the optimal allocation of shelf space across mutually substitutive products when considering the sequence of customer arrivals who themselves make substitution decisions. We evaluate how the sequence of customer arrivals at the retailer affects both optimal stocking quantities and expected profit, and we attempt to characterize settings where the impact of considering the customer arrival sequence is significant.
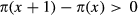
Throughout this numerical study we only consider scenarios where

Under this assumption, the profit gained from giving customers their preferred product is always higher than the profit that can be expected from offering them the substitute, which they might purchase or not. In situations that do not satisfy this assumption, a retailer would always profit from following a bait‐and‐switch strategy, offering one type of product to all customers.
To derive insights into the value of considering the sequence of customer arrivals, we compare the optimal policy to three benchmarks.
As a first benchmark, we use the well‐known solution to the resource‐constrained newsvendor problem (e.g., Erlebacher 2000). Specifically, under this benchmark, the order quantities are set to maximize the following profit function.

Because substitution is not considered in this model, the solution will generally be suboptimal, especially when substitution effects are substantial. We will use the shorthand CONNV for this benchmark. Clearly, this model without substitution does not consider the arrival sequence of customers.
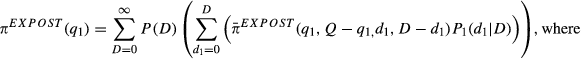
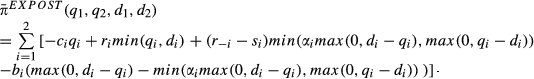
As a second benchmark, we assume a setting where demand accumulates over the stocking period and products are then allocated to customers at the end of the period (we will use the shorthand EXPOST for this approach). This is the predominant approach for modeling substitution in the extant literature (see literature review in ), certainly in part because of the more accessible mathematics. The EXPOST scenario describes a situation where a retailer can observe total demand over the selling season and then allocate products to the different customers to maximize profitability. Although the retailer knows the proportion of each customer segment that is willing to substitute (or alternatively, the probability with which each customer substitutes), the retailer cannot distinguish between those individual customers who substitute and those who do not. Under assumptions and , it is always optimal for the retailer to allocate products to customers who prefer that product. Then the retailer can use leftover units of one product to meet the excess demand of customers with preference for the alternate product, if this product is out of stock. Following this allocation rule, the retailer chooses stocking quantities under the EXPOST policy to maximize the following profit function:
Although substitution effects are considered, the sequence of customer arrivals is irrelevant in this scenario. Assuming that products can be allocated after all demand is observed, this policy might underestimate the number of substitutions that occur when customers arrive sequentially and substitute when their preferred product is out of stock. To illustrate the difference between the two representations of substitution, imagine a retailer who stocks one unit of product 1 and one unit of product 2, and faces demand for the two products occurring in the sequence 2‐2‐1. Under the assumption of ex post demand allocation (as under the EXPOST benchmark), the retailer could allocate the available product 1 to the last customer, who prefers this product. However, under customer‐driven substitution, the retailer has no control over substitutions and the unit of product 1 could be purchased by the second customer, who may substitute product 1 for his preferred product. Rather than having two satisfied customers and one customer who leaves empty handed, we now have only one fully satisfied customer, one customer who has accepted a second‐choice product, and one empty‐handed customer. If customers have strong brand preferences, this substitution might decrease customer goodwill, with potential negative implications on future sales. (In the absence of stockout and substitution penalty costs, the sequence of customer arrivals is irrelevant and the EXPOST benchmark is equivalent to the optimal policy.)
Finally, as a third benchmark, we consider the naïve yet intuitive policy (shorthand NAÏVE) where shelf space is allocated to each product according to its average fraction of total demand (ρ i ), that is, we set q 1 = ρ 1 Q, rounded to the next integer.
Table compares the different benchmarks and the optimal policy in terms of the dimensions which they consider in determining the stocking quantities.
Possible Sales Outcomes for the Exchanged Products
Possible Sales Outcomes for the Exchanged Products
Dimensions Considered by the Different Benchmarks and the Optimal Policy
Although the decisions representative of the different heuristics are determined based on the above descriptions, note that the actual performance associated with these decisions and the implications of the resulting allocations on the retailer's profitability are evaluated using the exact formulation in equation .
Because substitution effects are clearly less of a problem in settings where shelf space is ample, we set λ = 15 and vary Q ∈ {6, 8, 10, 12, 14}. We let c i = 0, r 1, r 2 ∈ {30, 40}, and b 1, b 2 ∈ {20, 40} to represent the profitability of the two products. We vary ρ 1 ∈ {0.1, 0.3, 0.5, 0.7, 0.9} (with ρ 2 = 1 − ρ 1) and s 1, s 2 ∈ {0, 10, 20}. We let α 1, α 2 ∈ {0.2, 0.5, 0.8} to describe the customers' willingness to substitute in the event of a stockout. Throughout the numerical analysis, we assume that customer arrivals come from a Poisson process.
Varying the parameters in a full‐factorial fashion leads to 32,400 different scenarios, of which 21,600 satisfy the assumptions given in equations and . We determine the stocking decisions for the different (non‐NAÏVE) scenarios based on search over q 1. Note that we use equation to directly evaluate the implications of the different stocking decisions on the retailer's expected profits, so we do not need to resort to simulation.
For the numerical study, we truncate the infinite sum in equation at the smallest demand value 
For the numerical study, we truncate the infinite sum in equation at the smallest demand value 

Average Loss of Expected Profit Under the Benchmark Policies—Sensitivity to Shelf Space (Q)
Average Loss of Expected Profit under the Benchmark Policies—Sensitivity to Unit Revenue (r i ) and Stockout Penalty (b i )
Average Loss of Expected Profit under the Benchmark Policies—Sensitivity to Substitution Cost (s i ) and Likelihood (α i )
Average Loss of Expected Profit under the Benchmark Policies—The Interaction between Substitution Cost (s i ) and Shelf Space (Q)
We see that, on average, the benchmark policies that take substitution (EXPOST) or the relative profitability (CONNV) into consideration perform relatively well, with just 1.0% and 2.2% reductions in expected profits compared to the optimal policy, respectively. Because the NAÏVE policy takes neither differences in profitability nor differences in substitutability into consideration, it is not surprising that it exhibits the worst performance, with an average penalty of 4.9%.
Recall that we analyze scenarios where shelf space is a severe constraint. As expected, we see that the suboptimality of the three benchmark policies quickly declines as shelf space becomes less of a concern. If shelf space is ample, all policies perform reasonably well, as substitution is less likely. When shelf space is severely restricted—making product substitution more prevalent—significant increases in profits can be achieved by considering the sequence of customer arrivals (i.e., by employing the optimal policy).
Table provides insights into how the value of considering the customer arrival sequence is affected by the products' profitability, that is, unit revenue r i and stockout penalty cost b i . In the following, for each parameter we consider the symmetric cases where both products have the same value (e.g., in the first row we have r 1 = r 2 = 30), as well as the asymmetric cases (asym), where the two products differ in the parameter in question (e.g., for the unit revenue we have the cases with r i = 30 and r −i = 40). In either case all other parameters are varied in their respective ranges.
We see that the three benchmarks perform relatively better when both products have a similar unit revenue (r i ) and worse when one product has a higher revenue than the other. When the two products have different unit revenues, the CONNV policy performs poorly compared to the optimal policy, as it does not consider possible substitutions that might mitigate the impact of such differences. The EXPOST benchmark considers substitution at least partially and thus shows a less pronounced decline in performance.
The performance of EXPOST is highly sensitive to asymmetries in the stockout penalty cost (b i ). Assuming that products can be allocated at the end of the period, the EXPOST benchmark severely underestimates actual substitution effects and therefore understocks the product with high stockout penalty. It appears that the performance of the CONNV policy and of the NAÏVE policy is largely insensitive with respect to the unit stockout penalty, even if the two products differ in this dimension. Asymmetric stockout penalties present one of the few scenarios when the performance of EXPOST drops below that of the CONNV benchmark policy, which gives priority to stocking high‐penalty products. We conclude that considering stockout‐based substitution in setting inventory levels has value if the two products differ in terms of their profitability. Also considering the sequence of customer arrivals is especially important when stockouts for the two products lead to different penalty costs.
Table relates the performance of the three benchmarks to the customers' attitude toward substitution, measured both in loss of goodwill s i and likelihood of substitution α i .
The EXPOST policy, which considers substitution effects, but does not consider the sequence of customer arrivals, tends to perform worse when customers have relatively strong preferences for their first choice products (high s i ). Interestingly, the performance of the other two benchmarks (CONNV and NAÏVE) improves as the associated switching costs s i increase. These two policies do not consider substitution effects, and as substitution becomes more costly, the optimal policy selects inventory levels that are more similar to the levels chosen when substitution is ignored.
The relative performance of all three benchmarks declines as the substitution likelihood (α i ) increases. Thus, setting optimal inventory levels is especially valuable with high α i ; the EXPOST policy understocks the product customers are willing to switch from, resulting in an excessive amount of substitution, whereas the CONNV and NAÏVE policies overstock the product and fail to take advantage of the hedging enabled by a high substitution likelihood. Only the optimal policy appropriately balances the costs and benefits of substitution.
Although it seems that asymmetries in substitution costs do not highly affect the average performance of the benchmark, this might not be true for specific cases. Consider the following example where substitution probabilities are high (α 1 = α 2 = 0.8) and where the two products are identical in terms of profitability and demand (r 1 = r 2 = 30, b 1 = b 2 = 30, and ρ 1 = 0.5). Figure illustrates the effect of asymmetries in substitution cost for this scenario, with Q = 8, s 2 = 0, and s 1 varying between 0 and 20.
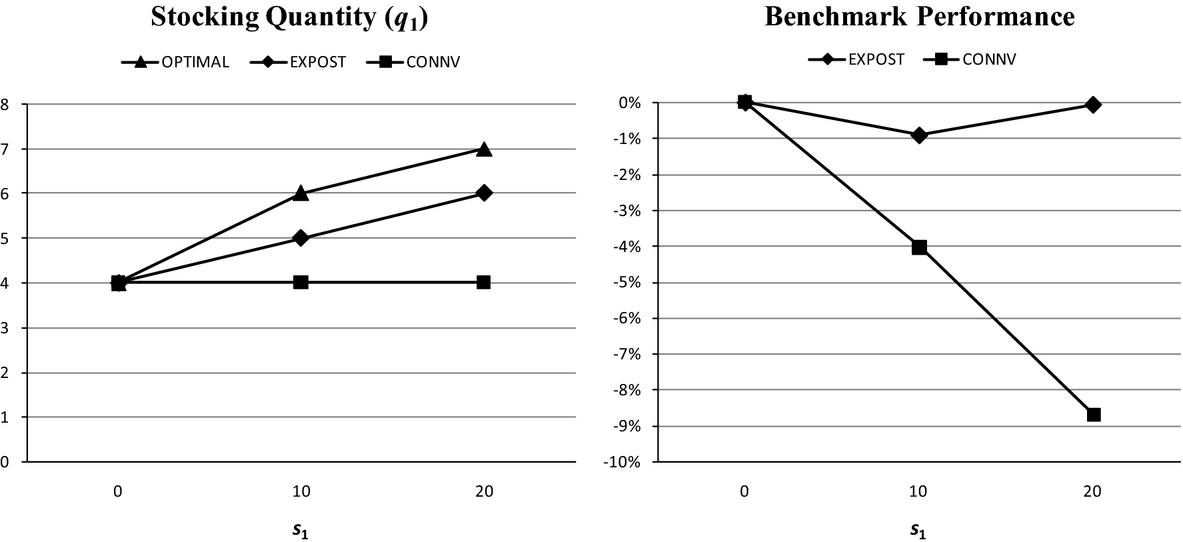
The Impact of Substitution Cost (s i ) on Stocking Quantity and Expected Profitability
Customers for product 2 are very willing to substitute. For s 1 = 0, the two products are fully identical in terms of their characteristics and all policies perform equally, splitting the shelf space evenly between the two products. As customers for product 1 become less enthusiastic about buying the substitute (i.e., as s 1 increases), it becomes optimal to stock more units of product 1 to reduce the loss in customer goodwill caused by substitution. Although the EXPOST benchmark underestimates this dynamic substitution pattern and hence understocks product 1, the CONNV policy completely ignores substitution and continues to stock the two products equally, incurring a penalty of up to 8.7%, which seems substantial considering the fact that the two products are otherwise identical.
To derive further insights into such interactions on the performance of the different heuristics and thus the importance of considering the sequence of customer arrivals in allocating shelf space, we also considered second‐order effects between the different parameters. We found that these effects are consistent with the observations derived from the study of the first‐order effects in Tables 3-5. For example, it seems generally true that considering the sequence of customer arrivals is more important when the substitute products are very different in terms of their cost and revenue implications. Given the large number of factors, we refrain from reporting all those observations in detail. In Table , we provide some results regarding the interactions between the substitution costs and the available shelf space, as these parameters seem to best reflect our focus on substitution effects under shelf‐space limitations.
Consistent with our observations when studying the impact of the shelf‐space constraint on the performance of the different benchmarks (cf. Table ), we see that their performance gets worse when shelf space is severely constrained. As expected, the impact of the shelf space constraint on the performance of the EXPOST benchmark is strongest if substitution costs are higher, whereas the impact of the shelf‐space scarcity on the other two benchmarks (CONNV and NAÏVE) is strongest when these costs are lower (cf. discussion of Table ). The EXPOST policy considers substitutions, but as it does not consider the sequence of customer arrivals and wrongly assumes that products can be allocated to customers with primary demand for those products, it underestimates the amount of substitution, which harms its performance when substituting customers associate a high disutility with not receiving their preferred product. The other two benchmarks (CONNV and NAÏVE) do not take substitutions into account at all, and thus perform very poorly when shelf space is constrained and substitutions are more likely. However, because it would be optimal to avoid substitutions when customers have strong preferences for their primary products (high substitution costs), the recommendations of these benchmarks are especially poor when shelf space is constrained and these costs are lower.
We conclude that the EXPOST policy clearly outperforms the other two benchmarks, underlining the importance of considering stock‐out based substitutions in setting inventory levels. However, when shelf space is severely constrained and customers serve themselves from available inventory, the EXPOST benchmark tends to underestimate actual substitutions, and considering the sequence of customer arrivals can lead to a substantial improvement in profitability.
We study the dynamic substitution problem arising in a retail environment when customers arrive sequentially and serve themselves from the inventory available on the store shelves. We consider a product category with a fixed amount of shelf space that has to be allocated between two products. Customers with preference for one product might purchase the other product when their first choice product is stocked out, so the sequence of customer arrivals affects how product is allocated to customers.
We derive an explicit analytical expression for expected retailer profits, and we establish that this profit function exhibits decreasing differences in the stocking quantity of either product. We show that, other things equal, more shelf space should be allocated to the product with higher profitability (higher unit revenue r i or lower stocking cost c i ), higher stockout cost (b i ), and higher substitution cost (s i ). We then conduct an extensive numerical study to gain further insights regarding the optimal allocation of shelf space under dynamic substitution (Research Question 1) and to characterize settings where considering the sequence of customer arrivals can have a strong impact on a retailer's profitability (Research Question 2).
Concerning the performance of the benchmark policies, we find that two non‐naïve benchmarks that consider substitution (EXPOST) or the shelf space constraint (CONNV) perform pretty well, with only 1.0% and 2.2% average loss in expected profits vis‐à‐vis the optimal policy, respectively. This suggests that in many settings, considering the sequence of customer arrivals might provide only marginal improvements in profitability. (As expected, the naïve policy that allocates shelf space to the two products proportionally to their demands performs much worse, with an average reduction in expected profits of 4.9%, compared to the optimal policy.) However, we then study the sensitivity of the benchmarks' performance with respect to different parameters and identify several scenarios where considering the sequence of customer arrivals can have a substantial impact on expected profits. Overall, we find that using the benchmark policies as heuristics can lead to much worse performance in settings where shelf space is severely constrained, where substitution effects are pronounced (high α i ), and where products within a category differ substantially in terms of their unit profitability (as measured in unit revenue r i and stockout penalty cost b i ). The performance of the EXPOST policy is especially sensitive with respect to cross‐product differences in the unit stockout penalty. Although it performs near‐optimally for products with similar penalties, its performance declines significantly when customers for the two products differ in their reaction to a stockout. Assuming that products can be allocated at the end of the period, the EXPOST benchmark severely underestimates actual substitution effects and the resulting stockouts for customers who arrive later and do not find their preferred product in stock. The EXPOST policy also tends to perform poorly when customers have relatively strong preferences for their first choice products (high s i ), but nonetheless tend to substitute in the event of a stockout (high α i ). This is because customer‐driven substitution causes the actual substitution cost to be much higher than anticipated under this policy.
Footnotes
1
2
According to Kök and Fisher (![]() ), most grocery retailers replenish all products in a category according to the same delivery schedule and lead time, and orders are typically delivered directly to the shelves. However, if the retailer disposes of additional inventory in the backroom of the store, our model can be used by defining the selling period as the time between shelf replenishments.
), most grocery retailers replenish all products in a category according to the same delivery schedule and lead time, and orders are typically delivered directly to the shelves. However, if the retailer disposes of additional inventory in the backroom of the store, our model can be used by defining the selling period as the time between shelf replenishments.
3
Define P i (d \ D) = 0 for d < 0 or d > D.
4
Define P i SUB (j \ k) = 0 for k < 0 or j > k.
5
The search for the optimal stocking quantity is simplified by using the result in Proposition . The stocking decision under CONNV can be easily determined using the simple solution procedure in Erlebacher (![]() ). However, for EXPOST, we are not aware of any results that ensure that the expected profit function is well‐behaved in the presence of penalty costs, so we conducted exhaustive search to determine the stocking decisions for that benchmark.
). However, for EXPOST, we are not aware of any results that ensure that the expected profit function is well‐behaved in the presence of penalty costs, so we conducted exhaustive search to determine the stocking decisions for that benchmark.
6
All policies perform optimally when the two products are perfectly symmetric in terms of their parameters, including the demand split (ρ 1). However, more than 99% of the considered scenarios are not perfectly symmetric, so the results given here are not driven by the symmetric scenarios.