Abstract

The 2010 UK general election resulted in a significant shake-up of the House of Commons. Of the 631 seats up for grabs Labour won 258 (down 90 on its 2005 performance), the Conservatives took 307 (up 97) and the Liberal Democrats 57 (down 5). Not only did this produce a new Con—Lib coalition but it also transformed the electoral map of the UK.
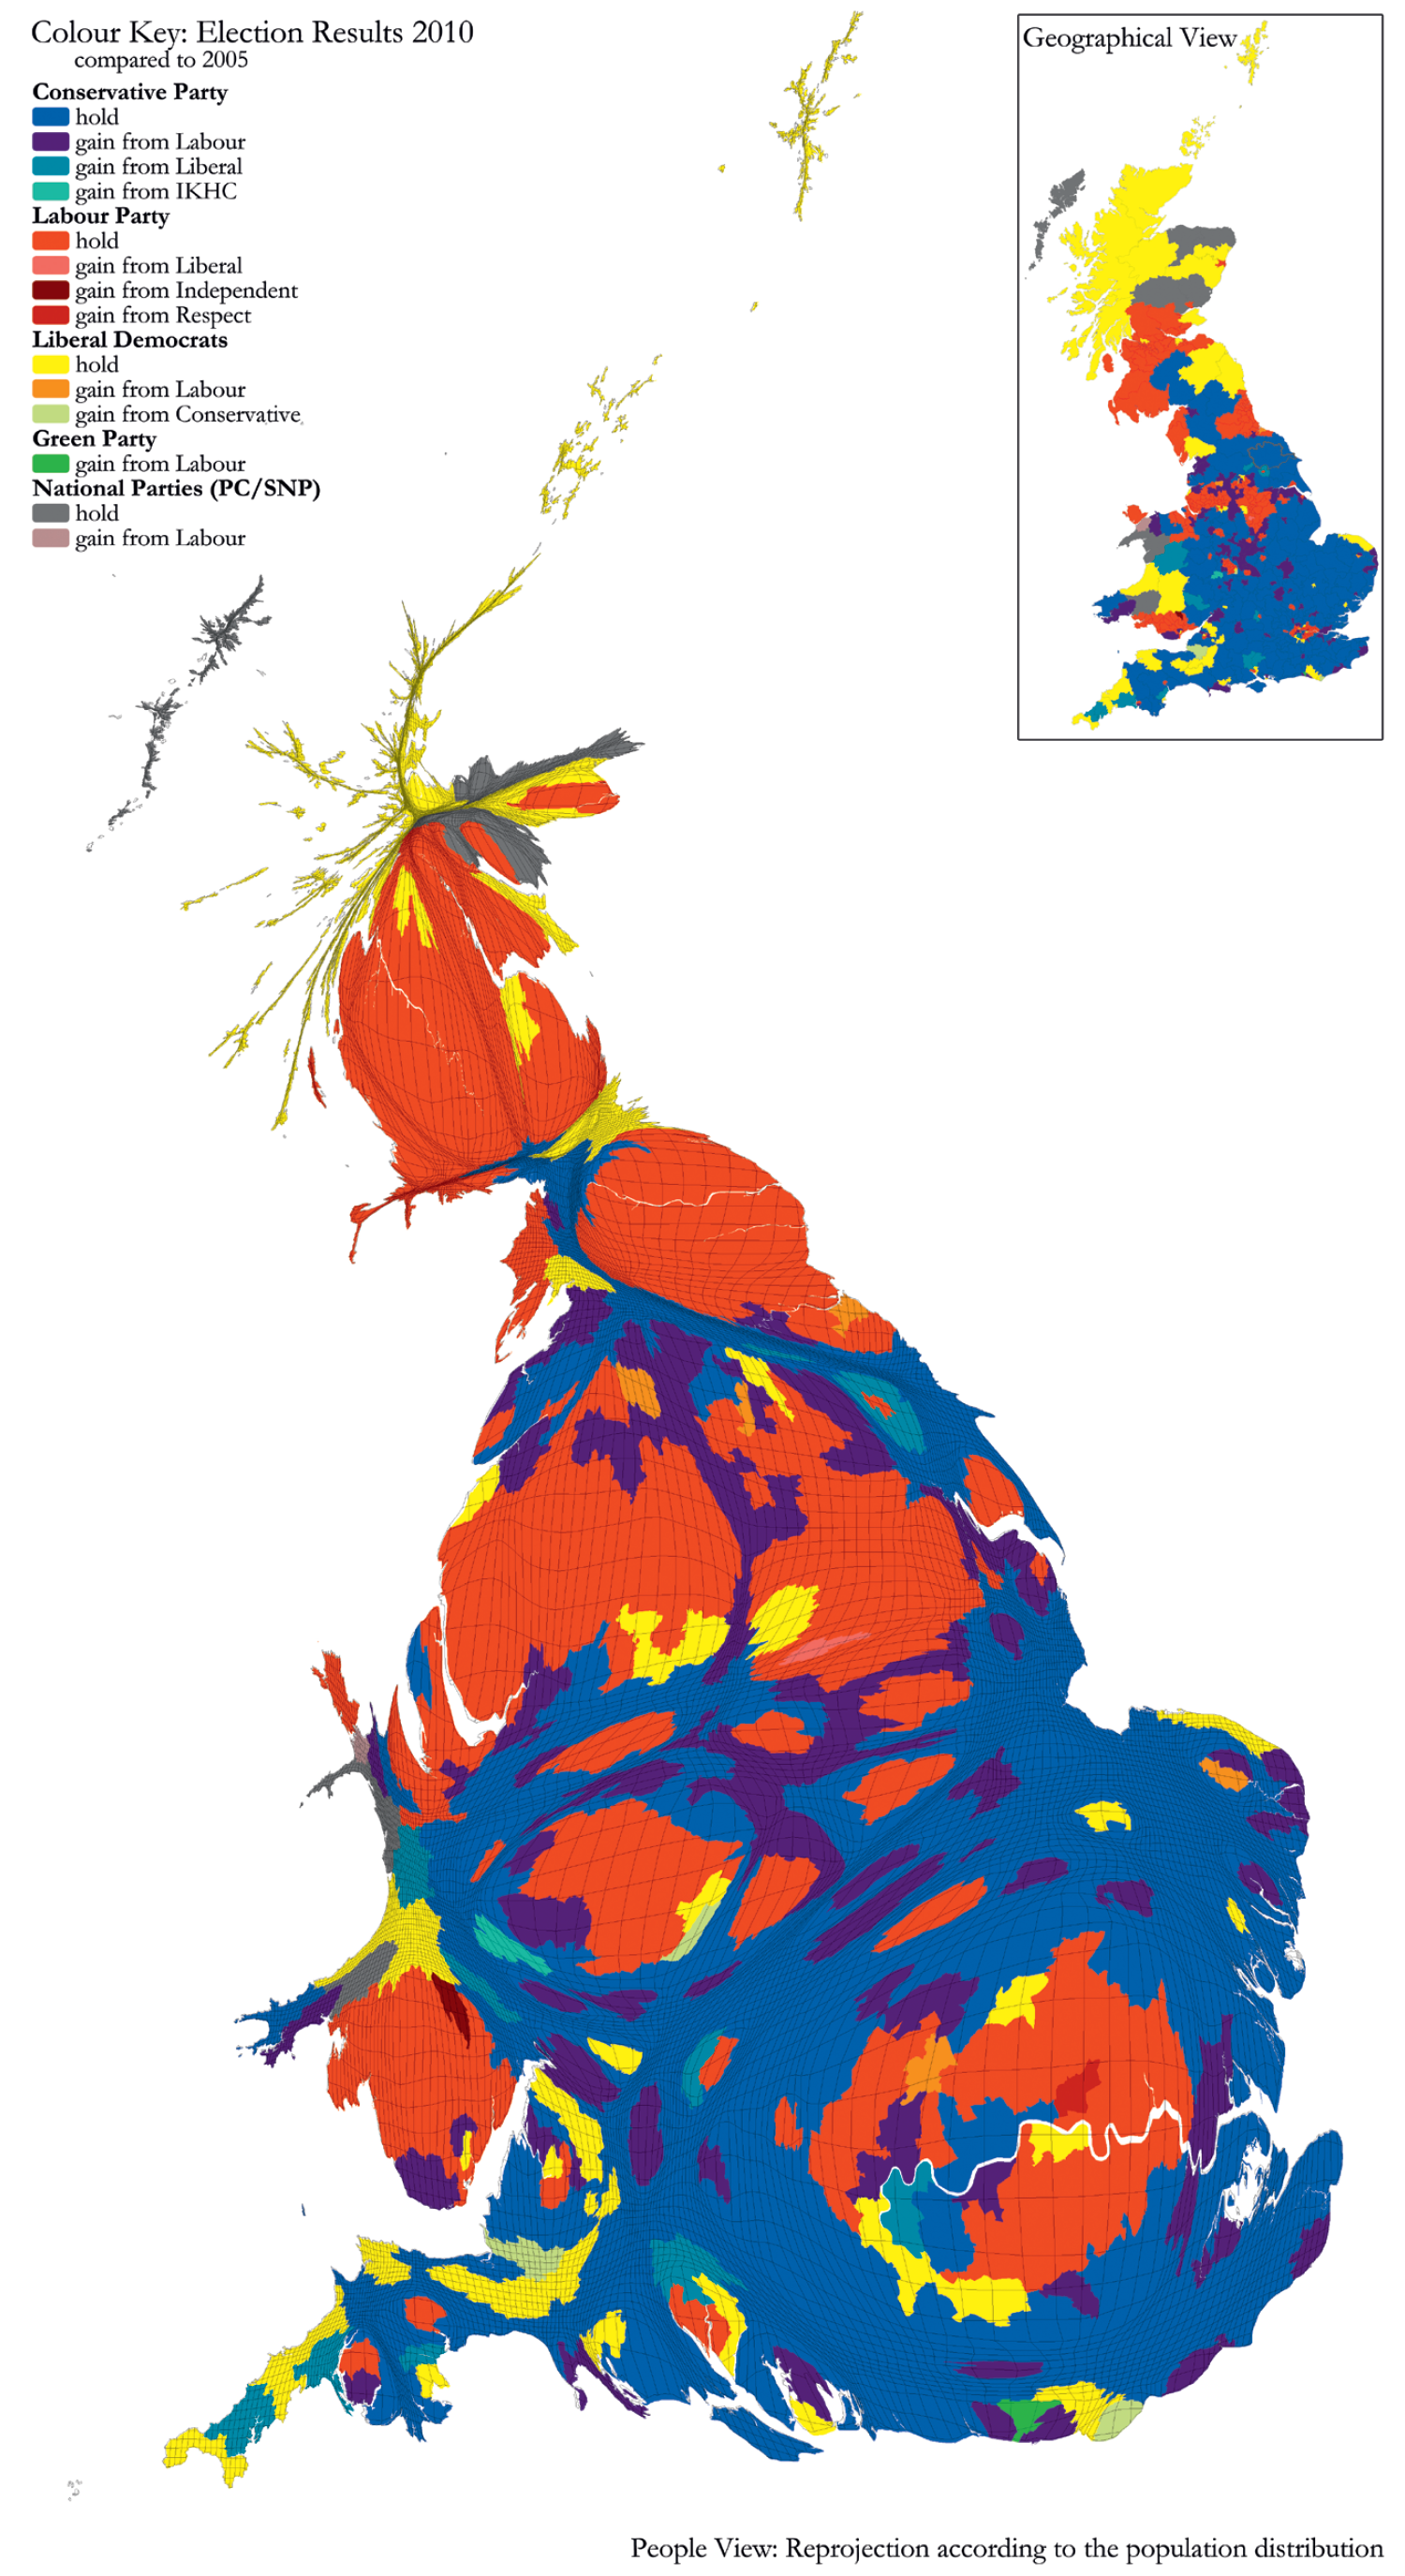
Drawing a single map to depict the election's result is no easy task. This map has to show which parties won and lost, and which areas changed allegiance to produce the final outcome.
The map opposite is a population cartogram: each area is proportional to its total population. Some 631 constituencies are shown (Northern Ireland's 19 seats are excluded; they were all won by parties local to the region). In every case the party winning the most votes in each constituency is shown and the party that won the most votes in 2005, taking into account boundary changes, is also given. From this it is possible to see where every change in representation occurred.
To win an outright majority a party needs 326 seats: the Conservatives were 19 short of this total. The map shows clearly that Tory gains were mainly made on the more affluent fringes of cities, in a ring around Birmingham and Coventry and across a wide scattering of commuter towns in the South East.
What the map cannot reveal is where the votes swung most in the seats that did not change hands. In general, the further north you travelled and the poorer an area was the lower the swing towards the Conservatives. In many areas the swing was, in fact, in the opposite direction. An extra six to seven voters in every 100 voted Labour in 2010 as compared to 2005 in the combined constituencies of Renfrewshire, Glasgow and Fife. The next largest swings, of between four and five extra voters per 100 moving towards Labour, were recorded in the counties of Dunbartonshire; Kirkcudbright & Wigtown; Edinburgh; and Caithness & Sutherland.
The geographical opposite is seen in the seats that saw the most voters desert Labour. Just over an extra 10 voters in every 100 did not vote Labour in Northamptonshire; Staffordshire; Kent; Worcestershire; Suffolk; and Hertfordshire. And the next 10 counties seeing the largest swings away from Labour were: City of Bristol; Cambridgeshire; Lincolnshire; Gwynedd; Buckinghamshire; Wiltshire; Essex; Warwickshire; Rutland; and Norfolk. With one exception all are in southern England, and it these swings that contributed most to Labour losing power after 13 years in office.
In Focus was complied by Danny Dorling and Benjamin Hennig, University of Sheffield.