
Abstract
Solving word problems is a common area of struggle for students with learning disabilities (LD). In order for instruction to be effective, we first need to have a clear understanding of the specific errors exhibited by students with LD during problem solving. Error analysis has proven to be an effective tool in other areas of math but has had little application to errors in word problems. Using an error analysis approach, this study aimed to investigate in depth the various types and frequency of errors made by students with LD and their AA peers during math problem solving. The resulting similarities and differences between the two groups of students are discussed with insight into underlying cognitive processes, and implications for future research.
Introduction
Students with learning disabilities (LD) often struggle in math (Bryant, Bryant, & Hammill, 2000). As math is a critical component of our core curriculum and also vital to success in the workplace and daily living (Hudson & Miller, 2006), it is important to understand the specific difficulties experienced by students with LD. The literature shows several dimensions of mathematical cognitive knowledge, such as base ten notation, calculation, basic math facts, and problem solving, as pitfalls for students with LD (Raghubar et al., 2009; Russell & Ginsburg, 1984). Compared to the other areas of difficulty, problem–solving proficiency requires substantially more conceptual and procedural knowledge. As such, focused problem–solving instruction is often relegated to higher grades where these foundational concepts have been mastered. Problem solving, however, actually enters into the curriculum as early as kindergarten (Common Core State Standards Initiative, 2010) and remains a targeted skill through high school. The Common Core State Standards (CCSS) focus on having students solve applied math problems, and success in this area is directly related to solving word problems. Further, the CCSS identifies eight standards for mathematical practice, of which six are explicitly linked to math problem solving (Common Core State Standards Initiative, 2010). It is also noted as an area of concern by the National Council of Teachers of Mathematics (NCTM; Cai & Lester, 2010). As math problem solving plays such a critical role in the curriculum, it is imperative that students gain mastery of this complex process.
Problem Solving
The construct of problem solving itself has proven to be ambiguous (Lai, Griffin, Mak, Wu, & Dulhunty, 2001). Although many definitions exist, a general consensus is that math word problems: require both interpretation and analysis (Cawley & Miller, 1986), can contain single or multiple steps (Fuchs, Fuchs, & Prentice, 2004), require identification of the necessary computational operation(s) (Carpenter, Ansell, Franke, Fennema, & Weisbeck, 1993), and may contain irrelevant or distracting information (Passolunghi, Marzocchi, & Fiorillo, 2005). According to Mayer's (1985) model of the problem–solving process, problem solving involves the four main phases of problem translation, problem integration, solution planning, and solution execution. The problem translation phase involves a learner taking the statements within the word problem and transforming them into an internally represented model of the problem. The problem integration phase involves combining the models created by the learner in a logical way, to prepare for the solving process. The solution–planning phase involves the creation of a plan to solve the problem, including the outlining of discrete solving steps. The final phase, solution execution, is the culmination of the process and involves the execution of the developed plan based on the previous three steps. Given the fact that the steps in the process build on one another, it is vital that the learner has a firm grasp of the components in each phase in order to successfully reach the desired endpoint: the correct solution.
As it stands, Mayer's model provides a clear depiction of the processes underlying math problem solving, but not the requisite skills necessary to carry out those processes. The model does, however, link specific types of knowledge to each phase. Thus, discrete and measureable subskills within each of Mayer's four phases can be identified by operationalizing the knowledge types. The translation phase is related to linguistic and factual knowledge and requires the skill of number selection to solve a word problem. The integration and planning phases, related to knowledge of schematic representation and strategic planning, are foundational to determining the operations to use and the number of steps required. The execution phase, related to algorithmic knowledge, is strongly tied to overall computation skills. Figure 1 shows the components of Mayer's model and the subskills which link to the type of knowledge within each phase. It is important to note that the problem–solving process is an iterative one; that is, though one moves sequentially through the phases, self–monitoring and self–corrections may take one back to previous phases as the solution plan is modified. Thus, the problem–solving process is sequential but not always linear in nature.
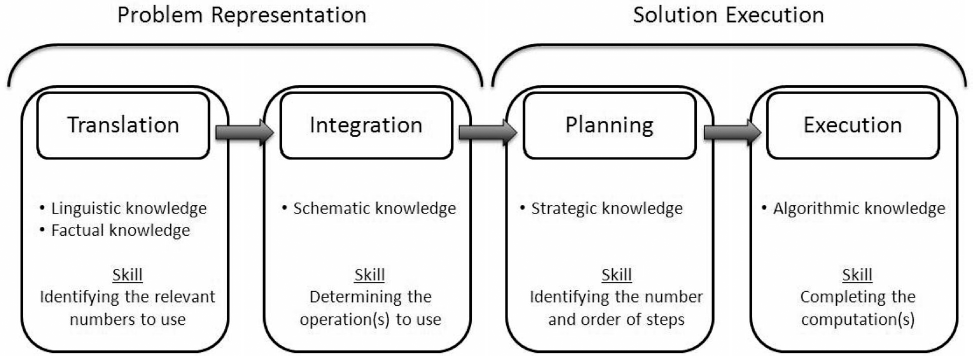
Mayer's (1985) model of the problem–solving process.
As evident in the figure above, the act of problem solving requires a much more complex process than other mathematical tasks; though varied in complexity, typical math tasks require students to solve an equation through computation (i.e., solely the execution phase of Mayer's model). Problem solving, on the other hand, demands accurate number selection, operation selection, and step identification, all prior to the process of computation. Thus, if we are interested in determining why students with LD struggle with math problem solving, we must examine those subskills that are critical to overall problem–solving success.
Mathematical Learning and Students with LD
Students with LD who exhibit mathematical learning difficulties struggle with several mathematical domains. There is a large body of research dedicated to identifying the types of math difficulties of students with LD. Geary (2004) noted that arithmetic and counting knowledge are problem areas that result in frequent procedural errors. Research over the last 30 years has consistently showed that, compared to their same–age peers, students with LD perform more poorly on skills such as enumeration with large numbers, calculation, basic addition, and practical problem solving (Russell & Ginsberg, 1984; Vukovic & Siegel, 2010). They make the types of errors reflective of younger students who lack the necessary conceptual knowledge to complete the given task.
Not surprisingly, they also struggle with word problems as they increase in complexity, as discussed in a synthesis by Powell (2011). Problem complexity increases with the addition of steps (and thus operations) as well as the addition of irrelevant information in the problems, ultimately translating into issues of problem type and missing information (Powell, Fuchs, Fuchs, Cirino, & Fletcher, 2008). These multistep problems and the increasingly intricate language of math only add to the confusion of such learners (Bryant, Bryant, & Hammill, 2000).
The struggles of students with LD on these mathematical skills associated with solving word problems have long been reflected in their performance on standardized achievement tests; however, such tests typically assess broad skill sets and rarely look at the breakdown of component skills or student processing (Cirino & Berch, 2010). Thus, the information obtained from these types of measures may show general areas of weakness but not specific skill difficulties. An important additional way of probing general areas of weakness is through error analysis, a process which looks systematically at student errors in a specific domain to make conclusions about difficulty based on misunderstandings of procedures or processes (Ashlock, 1990).
Error Analysis
Error analysis is an assessment tool used to determine areas of instructional need (Fleishchner & Manheimer, 1997). Error analysis has been used to take a more in–depth look at mistakes made during a task. It yields information beyond a score of correct or incorrect, resulting in insight into the subskills, and possibly processes, which brought about the inaccuracy. The math literature has demonstrated error analysis to be a valuable method.
Despite its use, the conceptual basis of error analysis has its opponents. Smith, diSessa, and Roschelle (1993) have raised points against its use. They have argued that analyzing small units of the solving process (i.e., errors or misconceptions) discounts the complex knowledge system held by the learner. Students and teachers may take different routes to arrive at the solution to a problem; these identified misconceptions found along the way may not be misconceptions, but rather different conceptions, or (mis)applications of prior knowledge. Additionally, targeting student instruction based primarily on error patterns can overlook the comprehensive picture of a student's repertoire of mathematical knowledge. Basic error identification and replacement strategies which support the misguided use of error analysis discussed by Smith and colleagues is, as the authors point out, present in research and practice, but they fail to acknowledge that a broader use of the tool has also surfaced. Error analysis has been used as a starting point for better understanding the student's system of learning with the goal of further developing students’ understanding in math. While the applications have been mostly procedural in nature, qualitative analysis has supported conceptual investigation.
For example, Seng (2010) used error analysis in a study which looked at performance on algebraic equations of 265 seventh grade students, categorized as high, medium, or low ability. They investigated twelve types of errors in the algebraic process. Frequency counts were collected on the errors for analysis. Additionally, 30 students were interviewed to gain qualitative insight into their problem solving processes and procedures. The information from the interviews resulted in the creation of four primary reasons for making the most commonly occurring errors. Exponent error appeared to be the most prevalent error, with the possible cause of this error being the interference of newly taught mathematical processes. Seng's error analysis tool focusing on algebraic equations proved useful not only in the scoring of errors, but also in the basis for the qualitative research, and revealed important gaps in students’ algebraic conceptions. Finally, the author's use of frequency counts determined how often students were making the errors, which provided critical information on the severity of the various misconceptions.
Raghubar et al. (2009) conducted a study looking at the multidigit errors in arithmetic made by students with and without learning difficulties. In the study, they investigated the arithmetic performance of third and fourth grade students with varying levels of math and reading ability across four groups: (1) Coexisting math and reading difficulties, (2) math difficulties, (3) reading difficulties, and (4) no learning differences. The error analysis employed involved coding errors as math fact, procedural –bugs and slips, visual spatial/visual monitoring (e.g., number misalignment, overcrowding, miswriting), and/or switch (of operation). They concluded that certain error types aligned with specific areas of difficulty. For example, math fact errors had a more positive relationship with math difficulty, while visually based errors were most correlated with reading difficulties. The frequency of operation switch errors did not vary greatly between the four groups of students. Had the authors only examined rate of accuracy, the subtle differences among students with different areas of difficulty would have been invisible. Thus, the use of the error analysis tool in this study provided a much richer basis for comparison among the student groups of varying abilities. Further, the findings suggest that the math teachers of students with reading difficulties should pay considerably more attention to the structure and set–up of equations, whereas students with math difficulties should receive instruction geared to improving basic math facts.
Luneta and Makonye (2010) conducted an error analysis of calculus errors made by grade twelve learners, providing insight into how dissecting error types can lead to a better understanding of why errors are occurring. In their case, the errors were related mostly to basic skills. Their study provided real merit for using error analysis in more complex operations in order to see the underlying issues. Ultimately, however, the qualitative methods of the study proved more useful for future research than did the conclusions of the study.
Overall, error analysis has shown to be effective in providing more detailed information about learner errors in a number of mathematical areas, including basic skills such as subtraction and complex ones such as calculus. Likewise, it has provided information on students’ misconceptions of procedural skills as well as more complex, underlying conceptual misunderstandings. Yet despite its established use, error analysis has not been utilized to provide information about the errors made in the process of solving word problems. Because of the complexity of math problem solving, a student's incorrect answer may be due to a number of reasons, as indicated by Mayer's (1985) model (Figure 1); scoring that answer as simply incorrect would provide no specific information to guide instruction or intervention. An analysis of errors, however, may point to specific and repeated misunderstandings that, when explicitly addressed through intervention, can result in improved performance. Additionally, it is known that learners with LD are deficient in areas of mathematical knowledge and application, especially in comparison to their AA peers. What is currently missing in the literature is how these areas of difficulty manifest during the act of math problem solving. Looking to error analysis, which has proved a successful assessment tool in other related areas, may provide a foundation upon which effective instruction is developed.
Purpose of the Study
The purpose of this study was to investigate in depth the various types and frequency of errors made by students with LD and their AA peers during math problem solving. Our goal was to develop a more complex picture of students’ difficulties in problem–solving concepts and skills in order to identify differences between the mathematical cognitive processes of students with and without LD. As such, the research question investigated in this study was: What types of errors were made during mathematical word problem solving by students with LD as compared to the types and frequency of errors made by AA students? Based on the available literature (i.e., Russell & Ginsberg, 1984; Vukovic & Siegel, 2010), we anticipated that the errors of students with LD would be more basic in nature and be related to increasing problem complexity (i.e., addition of multiple steps).
Method
Participants and Setting
The data used in this study were collected over the course of 2 years (2008–2009 and 2009–2010). Students from the first year were eighth graders and students from the second year were seventh graders. Eligibility criteria and procedures, as outlined below, were the same for both years. Participants were drawn from a larger intervention study. The purpose of the larger study was to investigate the effectiveness of a math problem–solving intervention based on cognitive strategy instruction for middle school students with and without LD. Forty middle schools in a large, urban, diverse school district in the southeastern Unites States were initially recruited. The district is the fourth largest in the nation serving approximately 340,000 students of diverse ethnicity and socio–economic status (i.e., 9 percent white, 30 percent African American, 59 percent Hispanic, and 2 percent other; 60 percent district–wide qualify for the free/reduced lunch program). Consented students (n = 779) from the participating schools were then identified as average achieving (no identified disabilities according to district data and a state math assessment [Florida Comprehensive Assessment Test; FCAT] level of 3 or 4 of a possible 5), low achieving (no identified disabilities according to district data and a FCAT level of 1 or 2), or having LD (district–identified based on an IQ–achievement discrepancy of at least 1.5 standard deviations and an FCAT level of 1 or 2). All participating students were in general education, inclusive math classrooms.
All students were given a curriculum–based measure (CBM) of math problem solving prior to the intervention and then six additional times over the course of the school year (for a full description, see Montague, Enders, & Dietz, 2011). The present study focuses on the errors made by students with LD and their average–achieving peers during the first (i.e., pretest) CBM. An analysis of written errors requires, by definition, written work; thus, we had to make some decisions regarding inclusionary criteria. During the administration of the measure, students were prompted to show their work; unsurprisingly, not all students complied. In order to have substantive data to analyze, we decided a priori to limit the sample to those students who showed work on at least 80 percent of the problems they got incorrect (correct problems were not a part of the analysis). Of the 94 students with LD and 362 AA students who completed the pretest CBM across the 2 years, less than half (40 percent) of the students with LD and only 28 percent of the AA students showed written work for most (i.e., at least 80 percent) of their incorrect answers. From this sample, we included all students with LD across the 2 years (n = 38) and randomly selected a corresponding 38 from the pool of 101 AA students who showed written work on at least 80 percent of their incorrect responses. Table 1 provides demographic information on the final sample (n = 76).
Student Demographic Data
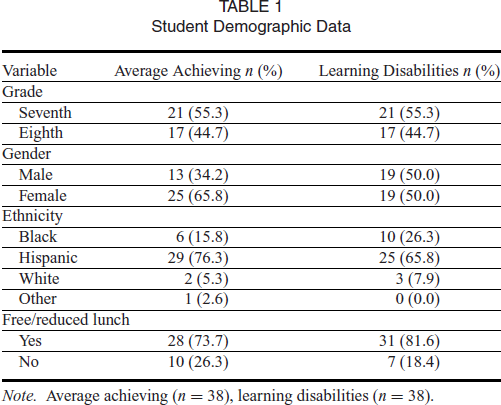
Average achieving (n = 38), learning disabilities (n = 38).
Measure
Students’ proficiency in math problem solving and the frequency and type of errors made while solving was analyzed through the math problem–solving CBM (Montague, Penfield, Enders, & Huang, 2010). In the larger study, six parallel forms of the CBM were used to measure progress over time. Composed of 10 word problems using any combination of the four operations, each CBM contained two one–step, four two–step, and four three–step word problems. All forms were equated based on difficulty, with internal consistency ranging from 0.67 to 0.80. Details on the statistical equating methodology used in the CBM equating study are available in Montague, Penfield, Enders, and Huang (2010). The following is an example of a typical CBM problem:
Mr. Sanchez has 40 students in the first period, 30 in his second period, 35 in his third period, 27 in his fourth period, and 32 in his fifth period. What is the total number of students?
Coding: Error Types
Six codes were identified for analysis. Four were determined a priori based on Mayer's (1985) model: Number selection error (across categories of: Relevant, irrelevant, missing), operation error, missing step error, and computation error. The two additional codes of random error (includes categories of: Decimal, transcription, wrong without justification), and omission error (question left blank) emerged during analysis.
Number selection errors spanned three categories: Relevant, irrelevant, and missing. A relevant number error was defined as the student putting the numbers in the wrong order, or using the correct numbers in the wrong step during problem solving. An irrelevant number error was defined as the student using a number in the problem–solving process that was irrelevant to the solution. A missing number error was defined as the student leaving out a relevant number during the problem–solving process. For analyses, all number selection errors were aggregated; subcategories were used to examine patterns within and between ability groups. Operation errors were defined as the student selecting the wrong operation (addition, subtraction, multiplication, division) when beginning to solve the word problem. Because some problems could be approached using multiple operations (e.g., adding instead of multiplying, subtracting during the first or second step), operations were considered correct if they could potentially lead to the correct solution. Efficiency was not a factor (i.e., a student who subtracted four times instead of dividing by four was not penalized). A missing step error was defined as the student completing fewer steps than required to solve the problem. By definition, errors in this category were limited to multiple–step problems. A computation error was defined as a calculation mistake (as evidenced in the work shown) in one of the four operations. Random errors spanned three categories: Decimal, transcription, and wrong without justification. A decimal error was defined as a decimal being in the wrong place (or absent) in the solving process or the presented solution. A transcription error was defined as the student copying a number from the word problem incorrectly in their problem–solving work. Wrong without justification was defined as the student putting an incorrect answer down that did not include any work for analysis. Finally, an omission error was defined as the problem being left blank. See Appendix A for examples of each error type.
Procedures
Cbm Administration
The CBM was administered to all participants in the larger study in October, prior to the intervention. Classroom teachers distributed the assessment to students with the following directions: “You will solve 10 math word problems. For each: Read the problem. Think about the problem. Then solve the problem, using the problem–solving strategies you were taught. Show all your work while solving the problems. You may begin.” Teachers could read problems for students if needed but could not provide any feedback or additional support. Graduate research assistants scored all items as correct or incorrect, resulting in a score out of 10 for each student.
Scoring
After the sample was selected for the present analysis, the two authors discussed the rubric (with the six errors listed by problem using the definitions above) and scored five protocols independently. See Appendix B for the rubric. Again, correct problems were not subject to analysis. Initial interscorer reliability, determined by the number of agreements divided by the number of total errors, was 81.5 percent. Each disagreement was discussed and resolved; the first five protocols were returned to the pool. The first author then scored all protocols and the second author scored 20 percent of them. Final interscorer reliability was 91.0 percent. After scoring was completed, data were entered into a SPSS database.
Analysis
Because of the parameters set for inclusion of participants in this study, it was important to ensure that our sample reflected that of the larger study sample. Thus, several preliminary analyses were conducted. First, we conducted chi–square goodness of fit tests and one–way analyses of variance (ANOVAs) to determine that our final sample was reflective of the larger sample from which it was drawn for each of the two ability groups, as well as to determine whether the 38 randomly selected AA students had similar problem–solving performance to the total 101 AA students who showed work on at least 80 percent of the problems they got wrong. Next, we conducted a series of chi–square analyses on student gender, ethnicity, and SES to determine the equivalency of the ability groups (i.e., average achieving and LD) on demographic characteristics.
To determine whether the two groups differed on specific errors made during problem solving, we conducted a multivariate analysis of variance (MANOVA) with the six error types (i.e., selection, operation, missing, computation, random, and omission) as the dependent variables. All assumptions of MANOVA (i.e., normality, linearity, homogeneity of variance–covariance matrices, and the absence of outliers) were satisfied. We calculated effect sizes for the results using Hedges g and interpreted them using Cohen's (1988) convention (i.e., 0.2 = small, 0.5 = medium, 0.8 = large).
Results
Preliminary Analyses
Chi–square tests of goodness–of–fit showed that no significant differences existed between the larger study sample and our study sample in either the LD or the AA group related to gender, ethnicity, or SES (ps ranged from. 126 to. 981); further, ANOVA results showed no differences between the larger study sample and our sample on solution accuracy when broken down by ability group (ps =. 330 and. 149, respectively). The ANOVA comparing AA students in the larger study sample who showed work on at least 80 percent of their incorrect answers and our study sample of AA students on the dependent variable of overall solution accuracy resulted in no significant differences (p =. 430).
Results of the chi–square analyses showed no statistically significant differences between students with LD and AA students on gender or SES (all ps >. 05). Student ethnicity, however, was significantly different between the two ability groups, where the LD group had significantly more Black (and less Hispanic) students, χ2 (3) = 2632.18, p <. 001. Because data show that Hispanic and Black students have similar math achievement (U.S. Department of Education, 2011), we conducted a chi–square analysis on ethnicity using two levels: White and non–White. Results of the analysis showed no significant differences between the AA and LD groups when ethnicity was categorized in this way (p >. 05); therefore, we concluded that no covariates were necessary as ability groups were statistically equivalent on all demographic variables.
Ability and Error Types
In order to determine whether differences in errors existed between ability groups, a one–way MANOVA was performed on the six error types with the two levels of ability as the fixed factor. Results indicated statistically significant differences between ability groups [Wilks’ Lambda = 0.66, F(6, 69) = 6.06, p <. 001]. Table 2 displays the means and standard deviations by ability group for each of the six error types. Significant univariate effects were found for the following variables: number selection errors, operation errors, missing step errors, and random errors. The observed power for these variables ranged from 0.60 to 0.98 and effect sizes ranged from medium to large (ds 0.51 to 1.09). The computation errors variable was marginally significant, p =. 055 with an observed power of. 49. The omission errors variable was nonsignificant, but because this variable was mostly controlled through the design (i.e., we limited inclusion to those who attempted at least 8 of the 10 problems); the nonsignificant finding was not surprising. Across the six error types, all differences were in the expected direction, where students with LD made more errors than AA students. See Table 2 for the summary statistics of the univariate effects.
Means and Standard Deviations: Problem–Solving Errors
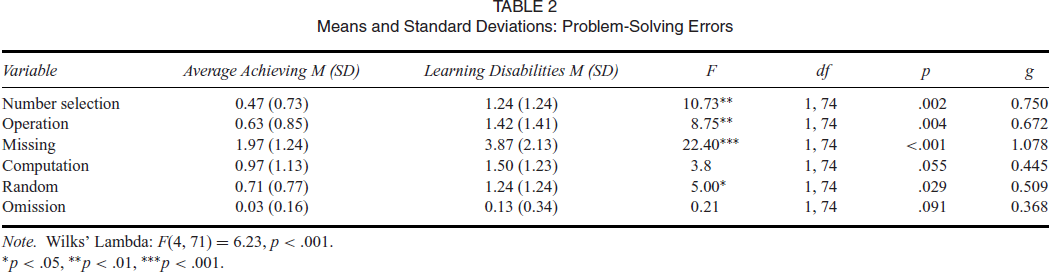
Wilks’ Lambda: F(4, 71) = 6.23, p <. 001.
*p <. 05, **p <. 01, ***p <. 001.
Discussion
This study examined the types of problem–solving errors made by students with LD and AA students. The research question that guided the study compared the type and frequency of errors of students with LD to those of their AA peers in order to highlight potential misconceptions specific to students’ ability status. The following section describes the results of the research question in light of other research, followed by a discussion of the qualitative findings that emerged when three of the error types were further broken down. Finally, limitations of the present study and implications of the results for practice are discussed.
First, the use of Mayer's (1985) model to frame the types of errors made by students during the problem–solving process appeared effective in identifying critical differences between ability groups. As described in the methods, only four of the six error types included in analysis were theoretically tied to Mayer's model; the other two, random error and omission error, emerged during analysis. After examining the relationships among errors and their role in the solving process, it appears that random error and omission error represent, respectively, self–monitoring and motivation, both of which are critical to students’ persisting during problem solving. Thus, metacognitive knowledge and motivation could be added to Mayer's model as critical elements that overlay the whole problem–solving process, as they are important to success within each of the four phases.
Because we controlled for the number of problems students omitted prior to analysis, the omission error variable did not show differences between groups; the random error variable, on the other hand, was significantly higher for students with LD as compared to the AA students. According to Rosenzweig, Krawec, and Montague (2011), the relationship between metacognitive skill and ability is a complex one that must consider task difficulty. They examined students’ online metacognitive activity during problem solving and found that as problems increased in difficulty, average–achieving students increased their productive metacognitive activity (i.e., statements that led to progression toward solving the problem) while students with LD increased their nonproductive metacognitive activity (i.e., statements that did not support progress, such as “I wish I had a calculator”). Thus, the findings of the present study, which showed that students with LD made more random errors than their AA peers, may reflect the former group's lack of effective (i.e., productive) metacognitive strategies. The use of these statements may also be linked to their present but less–developed levels of self–management, as demonstrated by an ability to recognize their difficulties but lacking the skills to address these difficulties themselves.
Students with LD and Problem–Solving Difficulties
In examining the univariate results of our analysis, it is clear that they align with the findings of previous research examining differences in ability between learners with and without LD (Bryant, Bryant, & Hammill, 2000; Raghubar et al., 2009; Russell & Ginsburg, 1984). Specifically, the study's findings showed that students with LD made significantly more errors related to number selection, operation selection, inclusion of all relevant information, and random slips attributed to a lack of self–monitoring. Interestingly, computational errors were only marginally significant. This finding is particularly important when considered in light of perceived differences between ability groups. It has been documented that students with LD consistently perform more poorly than typically achieving students on fact retrieval (Woodward & Montague, 2002), timed and untimed multiplication and division problems (Calhoon, Emerson, Flores, & Houchins, 2007), and even fraction equivalence problems (Butler, Miller, Crehan, Babbitt, & Pierce, 2003); clearly, all of these skills are based in computational proficiency. Even Raghubar et al.'s (2009) error analysis cited basic facts as students’ primary area of difficulty. However, the results of this study show that, of all the errors made by students with LD and AA students, frequency of computation errors is only marginally different between the two groups. This finding does not fully contradict the previously cited research, as the marginally significant difference is in the expected direction; but more importantly, it highlights the substantial difficulties of students with LD related to conceptually based errors related to the phases of the problem–solving process which precede computation; that is to say, while there are likely computational skills differences between groups, there are more significant discrepancies among other more conceptual problem–solving skills. For students with LD, these deficient skills may benefit from focused instruction. Research by Montague and Applegate (2000) corroborates this finding, where students with LD showed difficulties in problem representation and problem planning, including setting–up the problem with appropriate numbers and operations.
Qualitative Differences between Ability Groups
In order to provide more detail as to the nature of the specific errors made by each group of students and to investigate additional differences, we conducted further analysis of the subgroups within the number selection, operation error, and random error categories (see Table 3). In the error category of number selection, the students in both AA and the LD groups made the majority of their errors (i.e., 61 percent and 66 percent, respectively) with the relevant problem information; that is, they struggled more with including the correct problem information than they did with parsing out the misinformation in the word problems. It appears that strategies were applied to determine the important information in the word problems, but that a breakdown occurred when determining what information to use where (for multistep problems).
Frequency of Errors by Ability Group
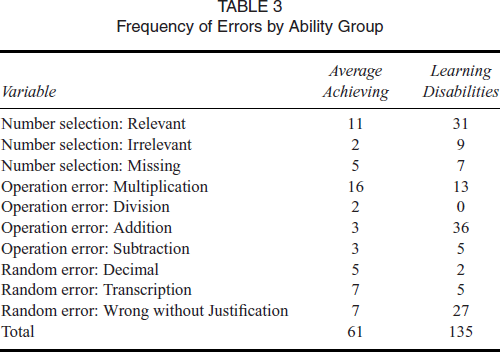
In the operation error category, the students in the LD group made the majority of their errors in selecting the addition operation incorrectly. This is in contrast to the students in the AA group who most often selected the multiplication operation incorrectly. These data outline addition and multiplication as the go–to operations for the LD and AA groups, respectively. As addition is a more developmentally simplistic skill than multiplication, this finding appears related to that of Russell and Ginsberg's (1984) determination that the errors made by students with LD are more immature in nature.
In the random error category, students with LD made significantly more errors than AA students. The majority of those errors made by students with LD fell into the “wrong without justification” category (i.e., a solution was provided but no written data were included to determine why). Students in the AA group also had a large number of their random errors in this category; however, AA students demonstrated a much more even distribution of random errors across the three categories (decimal, transcription, wrong without justification) than did LD students. While errors in the wrong without justification category provide us with little information for further analysis, it does allow for speculation on a problem–solving strategy of students with LD: guessing. Since errors scored as wrong without justification were often the results of answers being written without any work shown, it can be hypothesized that such answers were guesses. However, their application of guessing may also be aligned with the aforementioned studies and conclusions on deficient metacognitive strategies, self–monitoring, and motivation. Further research might be beneficial to determine the link to what is often characterized as guessing.
Limitations
Although the findings of the present study are in line with previous research and also contribute unique information to the literature on the problem–solving characteristics of students with LD, some limitations must be noted. First, only participants who showed written work during problem solving were included in this study. Although efforts were made to ensure that the sample selected was representative of the participants in the larger study, the possibility remains that students who show their work are qualitatively different in their problem–solving processes than those who do not; thus, generalizing findings to all students with LD must be done with caution. In future research, we may consider conducting clinical interviews with the students who did not show their work. Second, we did not interview students after they completed the test in order to elicit their thoughts during solving as time constraints did not permit it; therefore, we must note that our interpretation of student errors was not corroborated by student input.
Implications for Practice
It is clear that students with LD struggle through the process of math problem solving. Particularly, they have more difficulty than their average–achieving peers with selecting the relevant numbers, selecting the appropriate operation(s), and including all appropriate steps in the problem. These findings suggest that instruction that focuses particularly on these areas of difficulty may improve the problem–solving proficiency of students with LD. It is clear that problem–solving proficiency, as emphasized in the CCSS and by the NCTM, is critical to math competence; this emphasis translates to a need for effective instruction on word problem–solving skills. The results of this study can serve to inform the development of such practices by identifying exactly where student understanding is weak. Because the errors identified above highlight both conceptual and procedural difficulties, teachers may remediate skills that cross math content strands and improve students’ general math ability. However, teachers must first know how to translate student errors into remedial instruction, and previous research suggests that they may require explicit instruction to do so. For example, Riccomini (2005) taught educators to identify errors in basic subtraction problems made by learners in order to provide instruction in accordance with the identified errors; however, explicit instruction in providing corrective instruction for students was not provided. Riccomini found that teachers consistently struggled to provide appropriate instruction to remediate those identified errors despite effectiveness in identifying patterns in student errors. This study highlights a critical issue; that is, while error analysis appears to provide critical information to guide instruction, teachers may require additional training to proceed from an analysis of errors to corrective instruction that effectively remediates those misconceptions. Future research should thus consider how teachers can effectively connect identified errors to corrective instruction.