
Abstract
The targeted reading intervention (TRI) is a professional development program for rural kindergarten and first grade classroom teachers to help them provide effective reading strategies with struggling readers. In two randomized controlled trials, the TRI was delivered two ways: (1) literacy coaches provided support for classroom teachers through face–to–face classroom meetings or (2) coaches provided support to classroom teachers through live webcam technology. The purpose this study was to examine how face–to–face versus webcam coaching was related to teacher and struggling reader outcomes. Regression results suggested greater benefits with webcam literacy coaching for teacher fidelity and efficacy. Both struggling reader groups made equivalent gains across literacy measures, although there were greater gains on one child literacy measure in the webcam group.
Introduction
In recent years, the use of technology as a tool for providing professional development and training to in–service and pre–service classroom teachers has increased dramatically (Downer, Kraft–Sayre, & Pianta, 2009; Gentry, Denton, & Kurtz, 2008; Kao & Tsai, 2009; Kinzie et al., 2006; Russell, Kleiman, Carey, & Douglas, 2009). Using technology, such as webinars, online discussion boards, and video feedback strategies, rather than in–person face–to–face professional development, can save time and money for school systems looking for cost–effective ways to deliver professional development to classroom teachers (Gentry et al., 2008; Russell et al., 2009; Won Hur & Brush, 2009). Cost–saving technology strategies are particularly important because many classroom teachers are being asked to identify and serve struggling students in their classroom as more and more schools adopt a response to intervention (RTI) framework (Fuchs & Fuchs, 2006). The RTI framework requires teachers to identify children who are not profiting from effective classroom instruction and provide these struggling students with individualized instruction (Haager, Klingner, & Vaughn, 2007). However, little research has focused on the advantages or disadvantages of different means of delivering professional development, especially with respect to teacher outcomes (e.g., self–efficacy and implementation fidelity) and child outcomes (e.g., academic performance). Given this limitation in the literature, the current investigation explored whether professional development for early elementary classroom teachers in the form of ongoing literacy coaching delivered in–person face–to–face versus remotely via live webcam technology might help classroom teachers provide higher implementation fidelity for their struggling readers, lead to higher teacher perceptions of teaching efficacy, and/or lead to greater gains in reading for struggling readers.
Specialized Instruction for Struggling Readers
A well–documented corpus of research has demonstrated that although most children learn to read during early elementary school through a variety of effective reading instructional programs delivered by the classroom teacher, some children do not seem to profit from teacher–delivered instruction (Alexander & Entwisle, 1988; Foorman & Torgesen, 2001; Juel, 1988; Snow, Burns, & Griffin, 1998). For children who struggle with reading, several early intervention programs developed over the last 30 years have proven to be successful. These programs have been characterized by specific direct instruction delivered by a specialized teacher inside or outside the general education classroom (Denton, Fletcher, Anthony, & Francis, 2006; Hurry & Sylva, 2007; Mathes et al., 2005; Torgesen et al., 2001, 2006). Using the RTI framework, most of these programs have been considered Tier 2 programs for students who have not progressed quickly in reading with effective classroom instruction but who are not so far behind that they need to be referred for special education services (Haager et al., 2007). Although some Tier 2 programs for struggling readers employ specialized teachers who work with children in small groups or individually outside of the general education classroom, schools are increasingly helping classroom teachers become more effective instructors for struggling readers by using a variety of face–to–face and technology–mediated professional development strategies.
Literacy Coaching of Classroom Teachers and Child Reading Gains
Because the classroom teacher has assumed increasing accountability to promote literacy success for all children in the classroom, regardless of children's incoming literacy skills (Vaughn, Wanzek, & Fletcher, 2007), the RTI approach has led to redoubled efforts to provide professional development for classroom teachers to improve and expand their differentiated literacy instructional skills and promote their efficacy and knowledge in teaching. Although professional development workshops and webinars have helped classroom teachers gain knowledge of recommended evidence–based instructional practices, enhanced teacher knowledge has not always translated into student gains (Garet et al., 2008). One particularly effective approach beyond workshops and webinars has been the provision of literacy coaches who work with classroom teachers to help them enhance both whole–group and supplemental instruction by differentiating instruction and implementing recommended literacy practices for all children (Carlisle & Berebitsky, 2011; Powell, Diamond, Burchinal, & Koehler, 2010; Vernon–Feagans et al., 2012).
The majority of empirical work examining literacy coaching for classroom teachers has focused on face–to–face coaching (Carlisle & Berebitsky, 2011; Elish–Piper & L'Allier, 2011; Garet et al., 2008; Hindman & Wasik, 2012; Porche, Pallante, & Snow, 2012). For example, Carlisle and Berebitsky (2011) conducted a quasi–experimental study in which all teachers were given extensive training on providing evidence–based reading instruction in the classroom. One group of teachers received ongoing face–to–face coaching over the year and the other group did not. Findings suggested that classroom teachers who received coaching both improved their instructional practices and improved student reading in comparison to teachers who did not receive coaching. Other studies that have employed onsite literacy coaches to work with classroom teachers have also found that coaching led to improved teacher practices and higher child reading gains (Biancarosa, Bryk, & Dexter; 2010; Matsumura, Garnier, & Spybrook, 2013), though not all evidence has conclusively found benefits of coaching. For example, a large–scale evaluation of Reading First, a federally–funded reading program that provided literacy coaches for teachers, found positive impacts for teaching practices but not child reading gains (Gamse et al., 2008).
The Use of Technology for Literacy Coaching in Helping Children in Early Literacy
Recent studies have examined how coaching delivered through online technology might help classroom teachers become more effective in early literacy instruction (Mashburn, Downer, Hamre, Justice, & Pianta, 2010; Powell et al., 2010). In studies examining the effectiveness of MyTeachingPartner (MTP), prekindergarten teachers were asked to video themselves using MTP literacy and language activities and then send the DVDs to coaches. Within two weeks, coaches provided feedback to teachers remotely via the MTP website and teachers and coaches used videoconferencing to discuss teachers’ teaching practices. Teachers who had access to an MTP video library, remote coaching via the MTP website, and videoconferencing improved their teaching practices (Pianta, Mashburn, Downer, Hamre, & Justice, 2008) and children's vocabulary skills compared to teachers who only had access to the video library (Mashburn et al., 2010). These studies suggested that remote literacy coaching in addition to Internet resources promoted better instruction.
Unfortunately, only one known study with young children has compared face–to–face coaching with technology–mediated literacy coaching. Powell and colleagues (2010) trained rural and urban prekindergarten teachers in instructional practices of phonological awareness, letter–sound knowledge, and writing. Teachers either received onsite coaching (coaches provided immediate feedback and teachers had limited access to online modules) or remote coaching (like MTP, coaches provided delayed feedback after reviewing videos and teachers had unlimited access to online modules). Although teachers who received onsite coaching had greater gains in code–focused instructional practices, children whose teachers received remote coaching had higher gains in receptive language and sound matching. Overall, however, both onsite and remote coaching produced large gains for teachers and students compared to the control condition.
Literacy Coaching and Implementation Fidelity in Programs for Struggling Readers
No matter who delivers the intervention or where the intervention takes place, recent emphasis has been placed on the need to measure the fidelity of the implementation of programs in RTI studies (e.g., how often and how well Tier 2 interventions are delivered to students; Hill, King, Lemons, & Partanen, 2012). Understanding fidelity of implementation within face–to–face versus remote webcam coaching models is important because mode of coaching may influence the way in which the intervention is delivered (e.g., length of session, type of feedback, impact on student outcomes). By extension, mode of coaching may likewise be associated with teachers’ ability to implement the recommended number of sessions at a high level of quality. When measuring fidelity, some studies have only reported that teachers were well–trained (Torgesen, Wagner, Rashotte, Herron, Lindamood, 2010), while other studies have collected formal implementation fidelity data, such as intervention exposure, adherence to the elements of the program, and/or observations or ratings of the quality of implementation (Fuchs, Compton, Fuchs, Bryant, & Davis, 2008; Mathes et al., 2005; O'Donnell, 2008).
The quality of implementation within coaching interventions has been measured through literacy coach ratings, direct observations of teaching, or video records of teachers (Carlisle & Berebitsky, 2011; Hulleman & Cordray, 2009; Mashburn et al., 2010; Powell et al., 2010). Other recent studies have developed more refined measures of implementation fidelity that yielded variability among teachers in their implementation of the target program, showing that the amount of time literacy coaches worked directly with teachers was related to student reading gains (Elish–Piper & L'Allier, 2011). Most related to the current study, Powell and Diamond (2013) explored coaching implementation fidelity for Head Start teachers receiving onsite and remote coaching. While onsite coaches provided more immediate feedback on instructional practices designed to meet individual children's needs, coaches who provided feedback via videos were more likely to expand on previously–provided feedback. Teachers who received onsite coaching received longer coaching sessions, but the authors speculated that more was not necessarily better, as teachers may have had limited ability to absorb the feedback during longer sessions. Powell and Diamond (2013), however, did not explore how teachers’ implementation fidelity was impacted by mode of coaching delivery, which is explored by the current study.
Classroom Teacher Efficacy in Delivering Literacy Interventions and Instruction
In addition to teacher fidelity of implementation, other teacher–related beliefs and experiences have been found to be important for better outcomes for children (Torgesen, 1998). A host of articles have shown that teacher perceptions of self–efficacy about their teaching is related to better teaching and student outcomes, although the direction of effects is not entirely clear. That is, does better self–efficacy lead to better teaching or does better teaching lead to better self–efficacy? Some studies argue that teachers who believe they are responsible for student learning can bring about positive changes and growth in student achievement (Cantrell & Callaway, 2008; Guo, Connor, Yang, Roehrig, & Morrison, 2012; Guo, Piasta, Justice, & Kaderavek, 2010; Justice, Mashburn, Hamre, & Pianta, 2008; National Institute of Child Health and Human Development Early Child Care Research Network, 2002; Tschannen–Moran & McMaster, 2009). For example, Cantrell and Hughes (2008) found that in a year–long coaching professional development intervention, middle school teachers who had higher self–efficacy were more likely to implement the literacy strategies.
Other studies have argued that teachers’ experience with effective instruction produces student gains in literacy, which is what leads to higher teacher efficacy (Guskey & Passaro, 1994). In a one–year literacy intervention to help first grade teachers gain knowledge in phonological awareness and code concepts, literacy coaching was paired with more traditional professional development workshops. Teachers who received the coaching intervention rated themselves as more efficacious as reading instructors at the end of the year (Brady et al., 2009). Henson (2001) found in a year–long study that participation in collaborative teaching was related to growth in both general and personal teaching efficacies from pre– to post–test. Based on these studies, teacher efficacy may be improved by interventions that enhance teachers’ instructional abilities. What remains unclear is whether face–to–face or webcam coaching might differentially improve teacher efficacy. On the one hand, longer onsite coaching sessions that occur in face–to–face coaching might produce greater gains in teacher self–efficacy compared to shorter webcam coaching sessions. With more contact and time spent with each other, coaches and teachers may develop a better relationship and the coach may have more time to work with teachers on instruction in the classroom setting. On the other hand, face–to–face coaching may result in lower self–efficacy than webcam coaching because teachers are unable to assimilate large amounts of feedback in these longer sessions, which may also interfere with overall classroom instruction (Powell & Diamond, 2013). With this shortcoming in the literature, understanding whether face–to–face coaching or remote webcam coaching might improve classroom teacher self–efficacy is important.
Rationale for and Description of the Targeted Reading Intervention
The Targeted Reading Intervention (TRI) was developed to help classroom teachers in high–poverty rural schools provide better instruction for their struggling readers. Rural schools, especially those serving large populations of children receiving free and reduced–price lunch, often lack the resources to provide classroom teachers and students with reading specialists, school psychologists, teaching assistants, or even special education teachers. Thus, the classroom teacher is often the primary source of effective reading instruction for struggling readers. Providing classroom teachers with ongoing real–time coaching support to specifically help improve their instruction for struggling readers appears to be a practical strategy that might save money and be sustainable after the literacy intervention is complete. That is, the TRI classroom teacher is hypothesized to retain the information and instructional strategies for future struggling readers without the need for specialized teachers, support staff, or computer software (Vernon–Feagans, 2009; Vernon–Feagans, Gallagher, & Kainz, 2010).
The TRI was developed as a one–year Tier 2 professional development program (see Figure 1) that provided classroom teachers with reading instructional strategies to rapidly advance the reading skills of struggling readers in kindergarten and first grade, using trained literacy coaches who met with classroom teachers every other week (Amendum et al., 2011; Vernon–Feagans et al., 2010, 2012, 2013). The TRI was built upon the tenets of successful literacy instruction for children with reading difficulties articulated by Foorman and Moats (2004) and validated by a number of other researchers (e.g., Foorman & Torgesen, 2001; Morrison, Bachman, & Connor, 2005; Snow et al., 1998). Validated practices included using direct instruction in phonics, engaging in one–on–one instruction, scaffolding teacher strategies, promoting teacher/child relationships, and helping teachers match their instruction to the skill level of the child. The TRI incorporated these instructional practices into the professional development protocol for classroom teachers who participated for one year. Through either every other week face–to–face coaching (years 1 or 2) or webcam technology coaching (years 3 or 4), the coach gave feedback and scaffolded the instruction of the classroom teacher in the use of diagnostic and efficient reading strategies as the teacher worked one–on–one with a struggling reader in the general education classroom. The classroom teacher worked with one struggling reader at a time until the child made rapid progress in the one–on–one 15–min instructional sessions three or more times per week for six to eight weeks (five struggling readers across the course of one year). Teachers also met every other week with grade–level teams to refine their practice, engage in problem solving about particular children, and report number of completed teacher–student TRI sessions. In addition, teachers across both modes of coaching delivery had access to the TRI website that contained training videos of all the TRI strategies and downloadable materials.
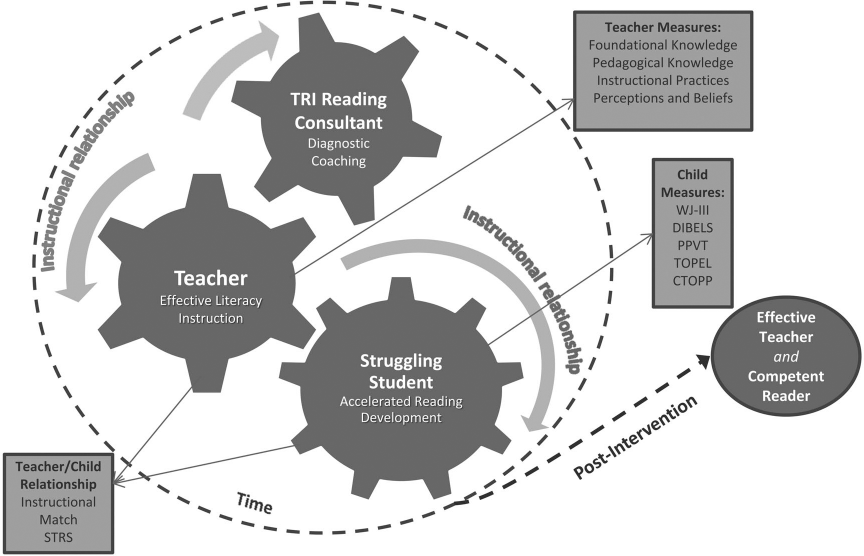
Targeted reading intervention overview.
TRI strategies were always taught in the context of the word or text in order to facilitate efficient reading comprehension and to ground the strategies in the authentic world of reading. Teachers were trained to allow the child to do most of the work during a 15–min session, even if they struggled. During a 15–min one–on–one session, the classroom teacher led a student through the three components of a TRI lesson: Re–Reading for Fluency (about 2 min), Word Work (about 6 min), and Guided Oral Reading (about 7 min). Each 15–min session typically included the following:
The results from a series of TRI randomized controlled trials (RCTs) with kindergarten and first grade teachers revealed significant gains in literacy by struggling readers in the schools that implemented the TRI coaching of classroom teachers compared to gains in literacy for struggling readers in control schools, with medium to large effect sizes ranging from 0.4 to 1.0 for 6 to 8 weeks of intervention by the classroom teacher (Amendum et al., 2011; Vernon–Feagans et al., 2010, 2012, 2013). For the first two years of the project, TRI used face–to–face coaching with different schools used each year; for the second two years of the project, TRI employed webcam technology coaching, again with new schools participating each year. Both modes of coaching delivery and implementation were effective in producing significant gains for struggling readers in TRI experimental schools versus struggling readers in control schools. However, the TRI design, beginning with face–to–face support in the first two years and then shifting to webcam technology–mediated support in the final two years, offers a unique opportunity to descriptively examine possible differential associations of face–to–face coaching versus webcam coaching of classroom teachers.
The Purpose of this Study
The current study utilized the data from the two previous TRI RCTs and focused exclusively on the teachers in the experimental schools who received professional development through face–to–face literacy coaching sessions or through webcam–technology literacy coaching sessions. The following research questions guided this study: (1) Was the mode of coaching delivery (face–to–face or remote webcam coaching) related to teachers’ fidelity of implementation (exposure, quality) of the TRI? (2) Was the mode of coaching delivery related to teachers’ beliefs about their efficacy in their instruction in the classroom? (3) Was the mode of coaching delivery related to struggling readers’ gains in reading skills?
Method
Participants
Rural schools were pair matched within districts on participation in Reading First, free and reduced–price lunch, school size, and minority enrollment. Within each pair, one school was randomly assigned to the TRI condition and the other to the control condition. Schools whose teachers received face–to–face coaching (years 1 or 2) were located in rural North Carolina while schools whose teachers received webcam coaching were located in rural North Carolina, Texas, New Mexico, and Nebraska (years 3 or 4). As previously stated, this study only examined the schools, teachers, and children in the TRI experimental schools. The current study used data from two RCTs measuring the effectiveness of the TRI in kindergarten and first grade but only included the experimental classroom teachers who received TRI literacy coaching in years one through four in nine different schools. The TRI recruited Title 1 rural schools and randomized at the school level. Different schools participated in each of the four years of the study; thus, teachers and students in both face–to–face and remote webcam groups only participated for one year in the study. The TRI content was the same across all four years. Fifty–eight teachers participated in this study, with 14 teachers receiving onsite face–to–face coaching (8 in year 1, 6 in year 2) and 44 teachers receiving remote webcam coaching (26 in year 3, 18 in year 4). Children were included in the current study if they were randomly assigned to an intervention school and participated in the fall assessment (n = 271). Eighty–one of these children (29.89 percent) were in the face–to–face coaching group while 190 of these children (70.11 percent) were in the webcam–coaching group.
Procedure
Struggling readers were pretested on a battery of language and literacy measures in the fall before the TRI was implemented and then again in late spring at the end of the school year. Classroom teacher efficacy was collected through a teacher questionnaire collected from teachers in the fall and the spring of each year. Teacher implementation exposure was reported by teachers during bi–weekly grade–level team meetings with their coach. Teacher implementation quality was rated by coaches after completion of the intervention with each individual struggling reader. Teacher and child demographics were obtained in the fall through teacher and parent questionnaires.
Measures
Face–to–Face versus Webcam Coaching
The major difference between the face–to–face and webcam coaching study was the mode of coaching delivery. The face–to–face TRI coaching sessions lasted one to two hours every other week and were conducted in the general education classroom at the time the teacher was delivering the TRI to a struggling reader. These coaching classroom visits every other week lasted longer than expected because the teacher and coach often talked about non–intervention–related classroom issues. In addition to interacting with selected struggling readers, coaches also interacted with other children in the classroom during these face–to–face visits. In contrast, the webcam coaching sessions were much shorter, lasting 20–30 min every other week. These sessions were much more efficient but did not include as much coach–teacher interaction. As noted above, coach training was consistent across both groups of intervention delivery. In the current study, mode of coaching delivery was coded as 0 = face–to–face coaching and 1 = remote webcam coaching.
Teacher Implementation Fidelity
Unlike many other studies, fidelity of implementation to the TRI was measured at the student level rather than the teacher level. That is, implementation fidelity was captured for each individual struggling reader who received the TRI from their classroom teacher. As described below, we included two measures of fidelity as teacher outcomes: Number of TRI sessions per struggling reader (implementation exposure) and how well the teacher implemented the TRI with each struggling reader (implementation quality).
Implementation Exposure
Implementation exposure was measured as the number of weeks each struggling reader received TRI–specific literacy practices. Implementation exposure was reported by the teacher to the literacy coach in the grade level meetings every other week, with 1 = 0 sessions; 2 = 1–3 sessions; 3 = 4–9 sessions; 4 = 9–18 sessions; and 5 = 19+ sessions. Although grade–level team meetings were ideally scheduled every other week, due to disruptions (e.g., school holidays, weather) teachers sometimes reported this information once a month, which is why we allowed them to report a range of teacher–student TRI sessions. The final implementation exposure variable was the mean range of sessions across all struggling readers for each teacher.
Implementation Quality
Implementation quality was rated by TRI coaches for each teacher–child pair on a five–point scale. These ratings were based on coach observations of the teacher implementing the TRI with each individual child and the written notes that the coach was required to take during each TRI session. Thus, as the teacher ended TRI sessions with a particular child (usually after 6–8 weeks), the coach rated the quality of the TRI implementation for that child, which was based on the teachers’ use of TRI strategies. Implementation quality was coded as 1 = little or no instruction akin to the TRI; 2 = instruction that was part of the TRI was used at least once a week and with at least one component of the TRI (fluency, word work, or guided oral reading); 3 = instruction that was part of the TRI was used at least twice a week and with least two of three TRI components, with teachers using some of the diagnostic tools available in the TRI; 4 = instruction that was part of the TRI was used three times a week with nearly consistent use of all three components, including the diagnostic tools; and 5 = high quality TRI instruction was used at least four times a week, including all three major components and consistent use of TRI diagnostic tools. The final implementation quality variable was the mean rating of quality across all struggling readers for each teacher who participated in the study in years 1, 2, and 3. Implementation quality was not measured in year 4 due to study oversight.
Teacher Perceptions of Efficacy
A rating of teacher efficacy was used as an additional teacher outcome. In the fall and spring of each year, teachers completed the Teacher Efficacy in Teaching Questionnaire (Tschannen–Moran & Hoy, 2001), which measured teacher perceptions of their effectiveness in the classroom. The questionnaire included 12 items (e.g., To what extent can you provide an alternative explanation or example when students are confused? How much can you do to control disruptive behavior in the classroom? How much can you do to motivate students who show low interest in schoolwork?), which were scored on a 9–point scale, with 1 = Nothing and 9 = A Great Deal. Teachers who received face–to–face coaching completed paper forms, while the teachers who received webcam coaching completed online questionnaires. A total score on this measure was used. In the fall, internal consistency estimates on this measure was α =. 92 and in the spring, α =. 94.
Child Language and Literacy Outcomes
Three subtests of the Woodcock Johnson Tests of Achievement (WJ–III; Woodcock, Mather, & Schrank, 2004) were used to assess students’ fall and spring reading performance: Letter–Word Identification, Word Attack, and Spelling of Sounds. Letter–Word Identification measured the child's word identification skills and has been shown to have a median reliability of. 91 in the 5–19 age range. Word Attack measured a student's skill in applying phonic and structural analysis skills to the pronunciation of unfamiliar printed sounds and words and has been shown to have a median reliability of. 87 in the 5–19 age range. Spelling of Sounds measured the child's spelling ability, with an emphasis on phonological and orthographical coding skills, and has been shown to have a median reliability of. 74 in the 6–19 age range (Woodcock et al., 2004). In addition, the Peabody Picture Vocabulary Test Third Edition (PPVT–III; Dunn & Dunn, 1997) was used to assess receptive vocabulary knowledge. Children were asked to choose the picture that best represents the meaning of the stimulus word from among four black–and–white illustrations presented orally by the examiner. Test–retest reliability has been shown to range from. 91 to. 94 (Dunn & Dunn, 1997).
Control Variables
Each fall, teachers completed questionnaires that solicited information about personal and classroom demographics. In models predicting to teachers’ perceptions of efficacy in the spring (post–intervention), control variables included fall pre–intervention teacher efficacy ratings, teacher race (0 = African American or other, 1 = White), grade (0 = kindergarten, 1 = first grade), grade–level teaching experience (years), and number of reading methods courses (as an education variable proximally related to the intervention). The same control variables, excepting fall scores, were used in models predicting to teachers’ implementation exposure and quality.
For student outcomes, parental consents returned by struggling readers each fall solicited information related to child and family demographics. For all spring child outcomes (post–intervention), control variables included fall pre–intervention test scores, child gender (0 = female, 1 = male), child race (0 = African American, Asian, or other; 1 = White), grade (0 = kindergarten, 1 = first grade), and maternal education.
Data Analysis Plan
Because missing data existed among independent variables (missingness 0–8 percent) and dependent variables (missingness 0–9 percent), 20 datasets with complete information were created via multiple imputation in SAS 9.2. This was done to avoid imprecision in the regression estimates due to missing data. Multiple imputation procedures use an iterative method to estimate the multivariate relations among study variables for cases with available data. These observed relations among study variables are then used to estimate plausible values for missing data. Creating multiple datasets with plausible values for missing data and aggregating solutions from analyses using multiple datasets provides the best approximation of relations among variables given no missing data (Graham, Olchowski, & Gilreath, 2007; Shafer & Graham, 2002). Consequently, models presented below were run on each of 20 imputed datasets and model parameters were aggregated across the datasets using the PROC MIANALYZE function in SAS. For teacher and child outcomes, the imputation model included all variables in the analysis models as well as auxiliary variables in order to help with imputation precision.
Teacher outcomes tested in analyses were implementation quality, implementation exposure, and teacher efficacy. Because only nine schools participated in the intervention, two–level ANCOVA models (accounting for teachers nested within schools) failed to provide reliable estimates. Therefore, hierarchical multiple linear regression models predicted teacher outcomes as a function of a set of covariates: fall efficacy scores (for efficacy outcome), race (White), grade (first grade), grade–level experience (years), and number of reading methods courses. Model variables were mean–centered prior to regression analyses and entered in a blockwise fashion. Covariates were entered in step one and the variable of interest, mode of coaching delivery, was entered in step two. Note that implementation quality was only measured during years 1, 2, and 3, so year 4 was excluded prior to multiple imputation and regression analyses, with the variable of interest, mode of coaching delivery, applicable to 14 teachers who experienced face–to–face coaching and 26 teachers who experienced remote webcam coaching.
Child outcomes tested in analysis were Letter–Word Identification, Word Attack, Spelling of Sounds, and the Peabody Picture Vocabulary Test. Again, with a limited number of schools participating in the intervention, three–level ANCOVA models (accounting for students nested within classrooms within schools) failed to provide reliable estimates. Therefore, two–level ANCOVA models (accounting for students nested within classrooms) predicted spring scores as a function of fall pre–test scores as a fixed effect at level one and a set of level–one fixed effects used as covariates: gender (male), race (White), grade (first grade), and maternal education. The variable of interest, mode of coaching delivery, was entered into the model during the same step as the covariates. Model variables, including the pre–tests, were mean–centered prior to analyses. Note that Spelling of Sounds was only measured during years two through four, so year one was excluded prior to multiple imputation and ANCOVA analyses, with the variable of interest, mode of coaching delivery, applicable to 43 students whose teachers had face–to–face coaching and 190 students whose teachers had remote webcam coaching. For all significant associations, effect sizes were calculated using Cohen's d (Cohen, 1988).
Results
Descriptive Findings
Teacher demographic characteristics are presented by mode of coaching delivery (face–to–face versus webcam coaching) in Table 1 and child demographic characteristics are likewise presented by mode of coaching delivery in Table 2. Most teachers were female and White. As seen in Table 1, t–test differences showed that teachers in the face–to–face versus webcam coaching groups had significantly different scores on implementation quality and fall and spring teacher–reported efficacy. The struggling readers in the study came from diverse ethnic backgrounds. In the face–to–face coaching group, 77 percent of children were children of color (66 percent African American, 10 percent other). In the remote webcam coaching group, 49 percent were children of color (24 percent American Indian, 1 percent Asian, and 24 percent other). Most children were from families where the mother had completed high school but few that had completed a four–year degree. As seen in Table 2, t–test differences showed that children in the two groups varied significantly by race, maternal education, and the standardized pre– and post–outcome measures.
Demographic and Outcome Information for Intervention Teachers Experiencing Face–to–Face (n = 14) versus Remote Webcam (n = 44) Coaching
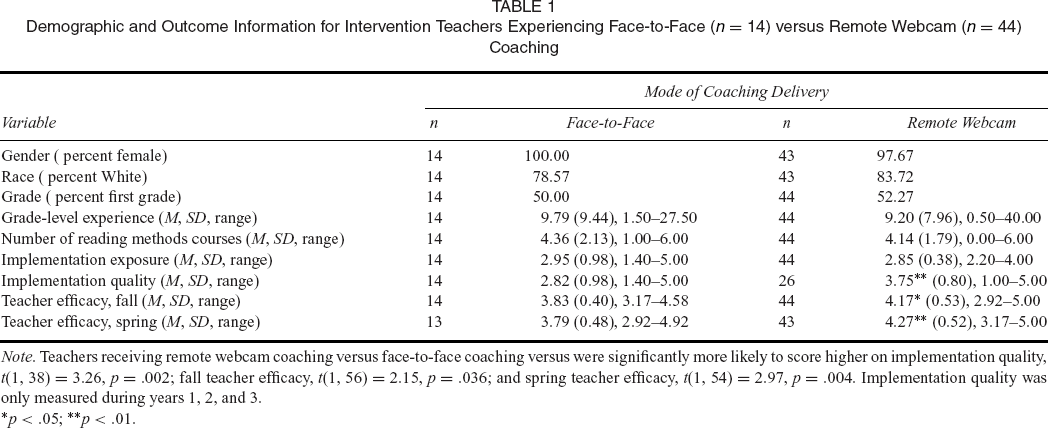
Teachers receiving remote webcam coaching versus face–to–face coaching versus were significantly more likely to score higher on implementation quality, t(1, 38) = 3.26, p =. 002; fall teacher efficacy, t(1, 56) = 2.15, p =. 036; and spring teacher efficacy, t(1, 54) = 2.97, p =. 004. Implementation quality was only measured during years 1, 2, and 3.
*p <. 05; **p <. 01.
Demographic Information for Struggling Readers with Teachers Experiencing Face–to–Face (n = 81) versus Remote Webcam (n = 190) Coaching
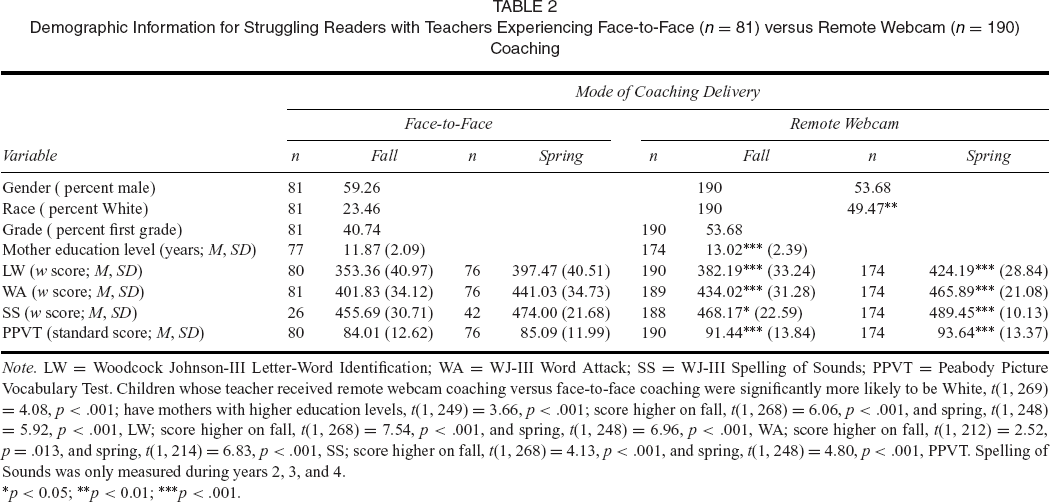
LW = Woodcock Johnson–III Letter–Word Identification; WA = WJ–III Word Attack; SS = WJ–III Spelling of Sounds; PPVT = Peabody Picture Vocabulary Test. Children whose teacher received remote webcam coaching versus face–to–face coaching were significantly more likely to be White, t(1, 269) = 4.08, p <. 001; have mothers with higher education levels, t(1, 249) = 3.66, p <. 001; score higher on fall, t(1, 268) = 6.06, p <. 001, and spring, t(1, 248) = 5.92, p <. 001, LW; score higher on fall, t(1, 268) = 7.54, p <. 001, and spring, t(1, 248) = 6.96, p <. 001, WA; score higher on fall, t(1, 212) = 2.52, p =. 013, and spring, t(1, 214) = 6.83, p <. 001, SS; score higher on fall, t(1, 268) = 4.13, p <. 001, and spring, t(1, 248) = 4.80, p <. 001, PPVT. Spelling of Sounds was only measured during years 2, 3, and 4.
*p < 0.05; **p < 0.01; ***p <. 001.
Teacher Outcomes
Implementation Exposure
Mode of coaching delivery did not account for significant variation in teachers’ implementation exposure. Covariates were added in Step 1, with grade (first grade; B = −0.39, p =. 007) significantly associated with implementation exposure, R2 = 0.17, F(4,53) = 2.61, p =. 04. In Step 2, grade was still significant (B = –0.39, p =. 008) but mode of coaching delivery (webcam coaching, B = −0.08, p =. 65) did not account for additional variance, R2 = 0.17, F(1,56) = −0.46, p =. 65.
Implementation Quality
As seen in Table 3, mode of coaching delivery accounted for significant variation in teachers’ implementation quality. In Step 1, teacher race (White; B = 1.03, p =. 03) was significant, R2 = 0.15, F(4,53) = 1.51, p = 0.20. In Step 2, teacher race was no longer significant (B = 0.78, p =. 08) but mode of coaching delivery (webcam coaching, B = 0.90, p =. 002) accounted for an additional 20 percent of the variance in implementation quality, R2 = 0.35, F(1,56) = 10.09, p =. 002, with an effect size of d = 0.95.
Regression Results for Fidelity Outcomes of Intervention Teachers Experiencing Face–to–Face (n = 14) versus Remote Webcam (n = 44) Coaching
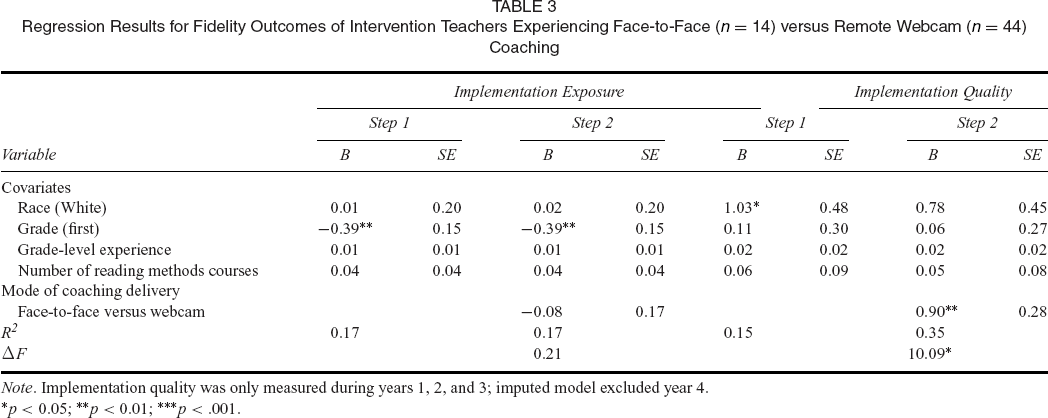
Implementation quality was only measured during years 1, 2, and 3; imputed model excluded year 4.
*p < 0.05; **p < 0.01; ***p <. 001.
Regression Results for Teacher Efficacy Outcome of Intervention Teachers Experiencing Face–to–Face (n = 14) versus Remote Webcam (n = 44) Coaching
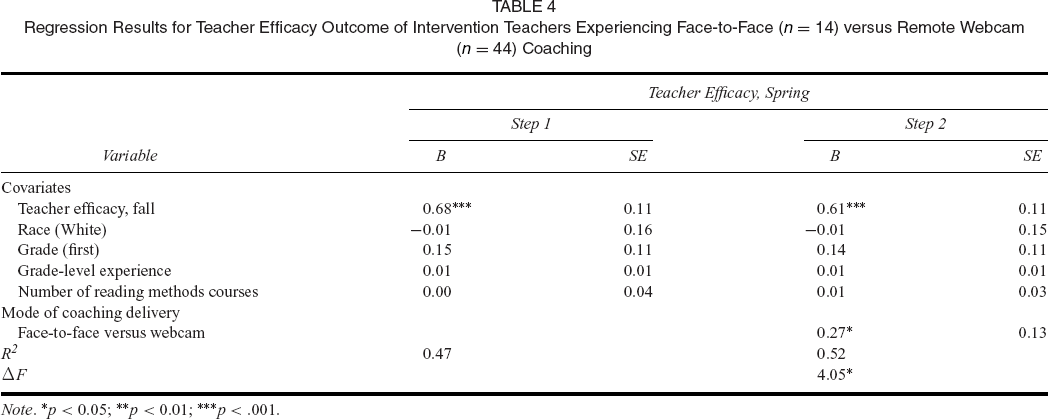
*p < 0.05; **p < 0.01; ***p <. 001.
HLM Results for Standardized Reading Scores of Struggling Readers Whose Teachers Experienced Face–to–Face (n = 81) versus Remote Webcam (n = 190) Coaching
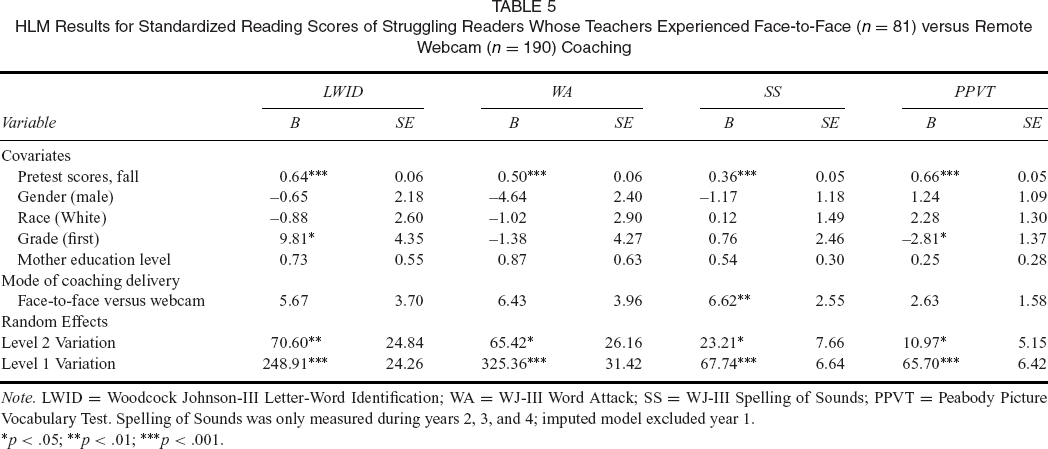
LWID = Woodcock Johnson–III Letter–Word Identification; WA = WJ–III Word Attack; SS = WJ–III Spelling of Sounds; PPVT = Peabody Picture Vocabulary Test. Spelling of Sounds was only measured during years 2, 3, and 4; imputed model excluded year 1.
*p <. 05; **p <. 01; ***p <. 001.
Teacher Efficacy
Mode of coaching delivery accounted for significant variation in teachers’ spring ratings of teacher efficacy. In Step 1, only fall efficacy scores (B = 0.68, p <. 001) were positively associated with spring efficacy scores, R2 = 0.47, F(5,52) = 8.99, p <. 001. In Step 2, mode of coaching delivery (webcam coaching, B = 0.29, p =. 04) accounted for an additional 5 percent variance in teacher efficacy, R2 = 0.52, F(1,56) = 4.05, p =. 04, with an effect size of d = 0.50.
Child Outcomes
Child Literacy and Language Outcomes
Controlling for differences in pre–test scores, mode of coaching delivery (webcam coaching, B = 5.67, p =. 13) was not significantly associated with spring Letter–Word Identification scores, although being in first grade was associated with higher spring scores (B = 9.81, p =. 02). Likewise, mode of coaching delivery (webcam coaching, B = 6.43, p =. 09) was not associated with spring Word Attack scores. However, mode of coaching delivery (webcam coaching, B = 6.62, p =. 009) was positively associated with spring Spelling of Sounds scores, with an effect size of d = 0.46. Mode of coaching delivery (B = 2.63, p =. 10) was not significantly associated with spring Peabody Picture Vocabulary Test scores, although being in kindergarten was associated with higher spring scores (B = –2.71, p =. 04).
Discussion and Implications for Intervention
Findings from the current study have important implications for the use of webcam coaching technology in: 1) helping rural classroom teachers gain cost–effective access to professional development in literacy, 2) promoting enhanced teacher instructional skills and teacher efficacy relative to their struggling readers, and 3) improving the early reading skills for struggling readers. This study suggested that webcam coaching (as compared to face–to–face coaching) was significantly associated with classroom teachers’ quality of implementation of the TRI for individual struggling readers as well as teachers’ perceptions of self–efficacy. In addition, limited evidence emerged with respect to struggling readers’ literacy outcomes. For one of four outcomes, spring Spelling of Sounds, webcam coaching had a positive association. Furthermore, the advantages for webcam coaching were impressive, with medium to large effect sizes ranging from. 46 to. 95. No differences were found between webcam coaching and face–to–face coaching on the number of weeks the TRI was implemented or on child achievement measures of Letter–Word Identification, Word Attack, or the Peabody Picture Vocabulary Test.
One explanation for these descriptive findings regarding potential advantages of webcam coaching may be the efficient and focused nature of webcam coaching as compared to face–to–face coaching. On the one hand, even though the face–to–face coaches spent more time in TRI classrooms (one to two hours for face–to–face vs. 20–30 min for webcam), when coaches were onsite in classrooms, they often found themselves pulled into non–coaching roles or interrupted by children and/or unrelated classroom demands. On the other hand, using remote webcam technology, the TRI literacy coach was virtually brought into the classroom at a time convenient for the teacher, allowing the teacher–coach interactions to become more focused. The webcam essentially provided a lens through which both the teacher and coach could focus on the instructional task at hand with a struggling reader. In the TRI, that task was an important one: The teacher working individually with one struggling reader. Via webcam, coaches generally could only see, hear, and interact with these two people. Thus, while the teacher delivered the intervention to the struggling reader, the coach provided real–time feedback to help the teacher instruct that one struggling reader. The qualities of the remote webcam coaching experience may have contributed to the association between webcam coaching and implementation quality. The narrowed focus on intervention implementation and the specific time limitations (20–30 min) via webcam may have helped teachers prepare beforehand for the shorter webcam sessions, thus delivering more efficient, better–quality instruction to individual struggling readers.
In addition, webcam sessions were able to be arranged at the convenience of the teacher when she was ready for the coaching session. Teachers and coaches had more flexibility about the dates and times throughout the day that were most optimal for coaching. For example, when coaching remotely via webcam, TRI coaches who worked hundreds of miles away were able to schedule meetings in the late afternoon or before school with teachers in different time zones or who had schools with different hours of operation. In contrast, in the face–to–face coaching portion of the study, plans for the coaching visit needed to be made weeks in advance. Once at the school, the coach and the teachers had little flexibility in the timing of seeing individual teachers and struggling readers in classrooms. The added flexibility of webcam sessions may have allowed teachers to choose a time when they could focus more of their energies on the instruction of the struggling reader in comparison to face–to–face coaching, which may not have always been a good time for coach input during a TRI session.
These ideas of increased efficiency, flexibility, and focus also provide the context for interpreting the findings on teacher ratings of efficacy in the classroom. Teachers in the remote webcam coaching group reported higher ratings of efficacy with regard to instructional strategies and student engagement. Arguably, technology–mediated coaching delivered via remote webcams offered a more focused forum for teachers and coaches to engage in collaborative discourse and provided opportunities for teachers to practice the effective evidence–based instructional strategies. Thus, webcam coaching may be an important mechanism for providing teachers with pedagogical knowledge and support, which then leads to changes in teacher instruction and beliefs (Guskey, 2003; Guskey & Passaro, 1994). Indeed, the TRI framework strongly emphasized teachers’ use of instructional strategies that were matched to the child's skill level. Face–to–face coaching studies support the connection between professional development practices, coaching, and teachers’ ratings of self–efficacy (Tschannen–Moran & McMaster, 2009). Furthermore, Powell and Diamond (2013) hypothesized that higher amounts of coaching (which occurred during their study as well as the current study during onsite face–to–face coaching) was not necessarily better for teachers, who may have had limited capacity to adapt an excess of feedback into their instructional practices in comparison to the focused feedback during remote coaching sessions. The current study provides additional support that remote webcam coaching may be an even more efficacious way to support teachers as they implement strong instructional practices.
The one previous study that examined modes of coaching delivery between face–to–face and technology–mediated coaching found limited differences between groups (Powell et al., 2010). Across that study and TRI studies (Vernon–Feagans et al., 2013), students made gains regardless of the mode of coaching delivery. These positive results for teachers and/or students across studies are in fact encouraging. Technology–mediated coaching (through video feedback, videoconferencing, and webcams) is far more cost effective than face–to–face coaching because it eliminates the transportation costs of traveling to schools, the actual time in transit, and scheduling hassles, all of which are easily solved by webcam coaching (Vernon–Feagans et al., 2013). Findings from the current study may be particularly important because, although there has been a dramatic increase in the use of technology for professional development in recent years, few studies have compared professional development delivered via face–to–face versus technology (Cheung & Slavin, 2013; Slavin, Lake, Davis, & Madden, 2011). For instance, in a review of technology approaches for struggling readers in elementary school, researchers found that the effect sizes for the technology interventions were very small, with an average effect size of. 09 across all the studies. In this review, studies mostly used technology such as webinars, email, and Smart Boards (Slavin et al., 2011). Thus, the finding that webcam coaching was particularly successful compared to face–to–face coaching, with medium to large effect sizes, may suggest that webcam coaching is an innovative use of technology that may be more beneficial for teachers than other forms of technology.
Limitations
Despite the promising potential for remote webcam coaching as compared to face–to–face coaching, the current study has a number of limitations. This study was only able to provide a descriptive comparison between modes of coaching delivery, as treatment teachers implementing the TRI were not randomly assigned to face–to–face or remote webcam coaching conditions. As with most studies, including RCTs, the TRI experienced minor refinements over the course of the four years and two modes of coaching delivery. Although the coaches were different across the types of coaching, the intervention director was with the project across all four years and she may have improved in her ability to train coaches and teachers. Furthermore, baseline scores for both teacher and student outcomes differed in the fall of the year, suggesting that the groups were not readily comparable. Face–to–face coaching was implemented in North Carolina while the webcam coaching was implemented in North Carolina and a number of different states. We know from the descriptive statistics that the students in North Carolina were more likely to be African American and have mothers with lower education levels. To mitigate these child and teacher differences, we controlled for child and teacher demographic variables and baseline child scores, but we recognize that the non–comparability of the groups, especially the two groups of children, may have biased our results.
Regarding outcome measures, coaches were not required to become reliable for the one of the outcomes, implementation quality, although the intervention director and coach did have to reach consensus on the ratings of quality after discussing together the teacher implementation with each individual child. In addition, baseline scores for implementation variables were not available. The positive association between webcam coaching and spring Spelling of Sounds may be important because of the size of the effect but it needs to be interpreted with caution because the other three literacy measures were non–significant. Finally, future work may want to experimentally test in a randomized controlled trial whether webcam coaching or face–to–face coaching is more effective for classroom teachers in order to determine causal differences in teacher and student outcomes due to mode of coaching delivery.
Conclusion
Although the current study did not allow for any causal links to be made between mode of coaching delivery and the teacher and child outcomes (quality of TRI sessions, teacher perceptions of efficacy, and child literacy gains), the findings suggested the potential benefits for early elementary classroom teachers of receiving intensive professional development and coaching via web–based platforms. This is one of the only studies in the field to descriptively compare onsite face–to–face and technology–mediated remote webcam coaching. The findings highlight the interesting notion that webcam coaching provided teachers with a better context for implementing higher–quality TRI sessions with struggling readers, led to higher teacher ratings of efficacy, and showed some promise for better student gains in early reading.
Acknowledgments
This research was conducted with support provided by an IES Grant for the National Research Center for Rural Education Support awarded to Tom Farmer and Lynne Vernon–Feagans, IES Grant R305A040056.