
Abstract
This article quantitatively summarizes experimental and quasi–experimental studies on teaching students with mathematics difficulties (MD) published between 2000 and 2014, research that was available following earlier syntheses. It reports the analysis of effect sizes of 25 intervention studies on participant characteristics, intervention parameters, domains of mathematics interventions, and instructional approaches and components. Results indicate that several participant characteristics (e.g., grade level and level of mathematics difficulties) and intervention parameters (e.g., methodological soundness, intervention agent, and grouping) mediated the treatment effects. In addition, different types of instructional approaches and several instructional components contributed to the improvements in mathematics performance in students with MD.
Introduction
Quantitative literacy, the ability to think mathematically, has become an essential skill in an increasingly technologically advanced and data–driven world (Agustin, Agustin, Brunkow, & Thomas, 2012). However, the recent mathematics assessment results on the Trends in International Mathematics and Science Study (TIMSS; Mullis, Martin, & Arora, 2012) showed that only 47 percent of American fourth graders and 30 percent of eighth graders scored at or above the high benchmark, compared to 78–80 percent of the same age children who scored at the same level in the top three scoring countries. Similarly, a recent study reported that only 26 percent of high school seniors scored at or above the proficient level in mathematics on the 2013 National Assessment of Educational Progress (NAEP; National Center for Education Statistics, 2014). Results like these and the societal goal of promoting participation in science, technology, engineering, and mathematics (STEM) careers provide the impetus for research into mathematics instruction to improve educational outcomes for all students, in particular for students who have difficulty learning mathematics or are at risk of academic failure.
Students who are low performing in mathematics or at risk for math failure (hereafter referred to as students with mathematics difficulties, or students with mathematics difficulties [MD]) are those who have difficulty in learning mathematics and can have deficits on several mathematics cognitive tasks including processing number sets, counting knowledge, and basic fact retrieval (Geary, Hoard, & Bailey, 2012). However, research has shown that with appropriate and specific mathematics intervention, many students with MD are likely to achieve age–appropriate levels of achievement (Geary, Hoard, Nugent, & Bailey, 2010; Re, Pedron, Tressoldi, & Lucangeli, 2014).
Students with MD are commonly identified through the use of cutoff criteria on their mathematics achievement scores (Geary, Hoard, Byrd–Craven, Nugent, & Numtee, 2007). This approach is also largely consistent with how Tier 2 (and in some cases Tier 3) students are described in the multitier system of supports (MTSS; e.g., Gersten et al. 2009a; Hilt–Panahon, Shapiro, Clemens, & Gischlar, 2011). Given the growing acceptance and implementation of the MTSS in school systems throughout the United States, an increasing number of low–achieving students are receiving Tier 2 intervention (Gersten et al. 2009a). Therefore, the importance of providing quality instruction for students with MD is clear. A synthesis of intervention studies addressing the needs of students with MD can be important in that the results can offer insights on developing more effective Tier 2 mathematics interventions for improving student learning, an ongoing challenge associated with MTSS implementation (Fuchs & Fuchs, 2015).
To our knowledge, only two quantitative syntheses included experimental instructional literature on students with MD, and both took place more than a decade ago. Baker, Gersten, and Lee (2002) synthesized mathematics intervention studies on students with MD from 1971 to 1999. They included only 15 studies that met their inclusionary criteria in their analysis, and they reported the effect sizes (ESs) based on four general intervention approaches: (1) providing data and feedback on students’ mathematics performance to teachers or students, (2) peer–assisted learning, (3) parental support, and (4) explicit or contextualized teacher–facilitated instruction. Peer–assisted learning had the largest effect (ES = 0.66) among the four major categories, followed by explicit instruction (ES = 0.58), and providing students with data and feedback (ES = 0.57). By contrast, contextualized teacher–facilitated instruction had an overall ES near to zero (ES = 0.01). Although Baker et al. identified intervention approaches that led to improved mathematics performance of students with MD, they did not identify specific instructional components (i.e., the constituent parts of an intervention, such as the use of teacher think–aloud or task analysis as a component within an intervention approach) that affected the magnitude of the ESs of the instructional approaches. Specifying underlying instructional components related to effective intervention can greatly enhance the development of effective intervention, because it will allow for more efficient and precise use of those instructional components shown to be effective (Swanson, Hoskyn, & Lee, 1999).
Kroesbergen and Van Luit (2003) synthesized mathematics interventions targeting elementary–level students with MD as well as students who had identified disabilities, including students with attention deficit hyperactivity disorder, intellectual disability, and learning disabilities. They included 58 intervention studies from 1985 to 2000 in the synthesis, and the effects of intervention in preparatory mathematics, basic skills, and problem–solving strategies were summarized. The findings suggested that the interventions in the area of basic skills were the most effective. Furthermore, in agreement with Baker et al. (2002), Kroesbergen and Van Luit also concluded that explicit instruction was an effective intervention approach (ES = 0.91). However, contrary to Baker et al., Kroesbergen and Van Luit's analysis suggested that interventions using peer–assisted learning were less effective (ES = 0.87 for peer–assisted learning vs. ES = 0.96 for other interventions). Although Kroesbergen and Van Luit identified effective intervention approaches and intervention parameters that affected the effectiveness of the program, Gersten et al. (2009b) criticized their synthesis for including both single–subject and group design studies in their analysis, which may have resulted in inflated effect sizes. In addition, Kroesbergen and Van Luit did not disaggregate the effects of the intervention for students with disabilities from the overall effect size, so it was uncertain whether their findings held true if the synthesis excluded studies involving students with official disability diagnoses.
The purpose of the present synthesis was to extend the earlier work in the following ways. First, we quantitatively summarized the findings of empirical group design studies published between 2000 and 2014 on teaching students with MD, a body of experimental and quasi–experimental research that was available following earlier syntheses. These recently available intervention studies represented the most recent attempt at addressing the needs of students with MD.
Second, we identified the participant characteristics (e.g., grade level and level of mathematics performance) and intervention parameters (e.g., duration of intervention, interventionists, grouping, and mathematics domains of intervention) that may have moderated the effects of interventions. Prior syntheses did not take into consideration the effectiveness of interventions related to important participant characteristics and intervention parameters. Given the heterogeneous nature of students with MD, variations in specific participant characteristics and intervention parameters can play important roles in the intervention outcomes.
Third, we examined the possible influence of methodological quality on the intervention outcomes. Evidence suggested that research design and methodological issues could influence the effects of the intervention (Gersten et al. 2009b; Swanson et al., 1999). We used the quality indicators for experimental and quasi–experimental studies outlined by Gersten et al. (2005) as our guidelines to evaluate the methodological quality of the studies included in this synthesis. We chose Gersten et al. (2005) quality indicators to determine the methodological quality of studies because they offered very specific guidelines in determining the quality of participant description, quality of intervention implementation, quality for outcome measurers, and quality for data analysis. They also offered clear definition on “acceptable” and “high” quality research, with which the methodological quality of research can be evaluated. Because criteria to discern the level of research methodological quality were clearly delineated in the quality indicators, several syntheses have used Gersten et al. (2005) quality indicators to evaluate methodological soundness of intervention studies (e.g., Jitendra et al., 2015).
Fourth, we drew on previous syntheses by coding and reporting on instructional approaches highlighted in Baker et al.'s (2002) review: (1) providing data and feedback on students’ mathematics performance to teachers or students: intervention was coded to use this approach if the students and/or teachers in the intervention received data on students’ mathematics performance, including the types of problems and how many problems the students correctly completed; (2) peer–assisted learning: a study was coded as peer–assisted learning if the intervention used a peer–tutoring program; (3) parental support: a study that utilized parent's role as supporter or motivator was coded for this approach; (4) explicit teacher facilitated instruction: a study that used direct instruction features was coded to be this approach; and (5) computer–assisted instruction: the intervention was coded to use this approach if only computer program was used to deliver the instruction. We chose to code the studies based on these five specific instructional approaches for the following reasons: (1) the targeted population (i.e., students with MD) in synthesis is most similar to that in Baker et al.'s (2002) synthesis, and (2) because a relatively smaller body of research was included in their synthesis, Baker et al. (2002) indicated that a firm conclusion on the effectiveness of the approaches was difficult to draw. Therefore, we sought to extend their work to determine whether similar findings can be drawn from the current study.
Finally, we followed earlier work (Swanson et al., 1999; Swanson & Sachse–Lee, 2000; Zheng, Flynn, & Swanson, 2013) to identify instructional components underlying the effective interventions for students with learning disabilities. A total of 18 instructional components were obtained: advance organizers, attributions, control difficulty or processing demands of tasks, elaboration, explicit practice, large–group learning, novelty, one–on–one instruction, peer modeling, questioning, reinforcement, sequencing, skill modeling, small–group instruction, strategy cues statements in the treatment description, supplement to teacher involvement, task reduction, and technology (refer to Zheng et al., 2013 for the detailed description of each instructional component). We examined whether these instructional components also contributed to the effects of the interventions for students with MD.
This present synthesis addresses the following research questions:
Research Question 1: What is the overall effectiveness of mathematics intervention approaches for students with MD? Research Question 2: Do effect sizes in mathematics interventions for students with MD vary as a function of specific participant characteristics? Research Question 3: Do specific intervention parameters moderate the effect sizes of mathematics interventions for students with MD? Research Question 4: Does methodological quality of the intervention studies affect the effect sizes in mathematics intervention for students with MD? Research Question 5: Do effect sizes in mathematics interventions for students with MD vary as a function of mathematics domains of intervention? Research Question 6: Do effect sizes in mathematics intervention vary as a function of specific instructional approaches identified in Baker et al. (2002)? Research Question 7: Which specific instructional components can best predict effect sizes in mathematics intervention?
Method
Data Collection
Studies published from 2000 to 2014 on mathematics intervention for school–age students with MD were included in the synthesis. We first conducted a computer search using the following terms or combinations of terms: mathematics, mathematics intervention, mathematics instruction, mathematics achievement, treatment, training, remediation, Tier 2 intervention, low performing, low achieving, at risk, mathematics difficulties, and underachievement. We systematically scanned the ERIC, PsycINFO, and SSCI online databases to locate mathematics intervention studies for students with MD. We also manually searched the tables of contents of the following journals: Exceptional Children, Journal of Individual Differences, Journal of Learning Disabilities, Journal of Special Education, Learning Disabilities Research and Practice, Learning Disability Quarterly, Remedial and Special Education, and The Elementary School Journal. The computer search and manual search resulted in the identification of 1,229 articles. We further reviewed this pool of relevant literature based on the title, key words, and abstracts. This procedure narrowed the search to 135 articles.
Inclusion Criteria
All authors read the method section of the 135 articles and evaluated the articles as a team. Studies were included if they met the following inclusion criteria:
The study provided instruction, intervention, or treatment that addressed academic mathematics skills. The study had at least one mathematics outcome measure such as computation measure, problem solving measure, etc. The recipients of the intervention were school–age students and were identified by the authors to have MD with a clear definition of MD (e.g., below the 25th percentile on a mathematics screening test). The study used experimental or quasi–experimental group–design methods with a control group. The study provided information to allow for the calculation of effect sizes. For example, the study reported means and standard deviations of the dependent measures for the experimental and comparison conditions, or from the tests of the significance of the differences in performance between the experimental conditions (e.g., t or F tests). Studies were published in peer–reviewed journals and were written in English.
Studies were excluded if they:
Examined the effects of intervention promoting positive academic behavior (e.g., on–task behavior, note–taking skills, or test–taking strategies, etc.). Included both students with MD and students receiving special education services, but the outcome measure was not reported separately for students with MD and students receiving special education services.
Coding Procedure and Inter–Coder Agreement
We included a total of 25 studies that met the inclusionary criteria for coding. The first author developed the coding sheets based on the following categories, each of which included a set of variables:
Participant characteristics: participants’ age/grade levels and information on how students with MD were identified and coded. Intervention parameters: The variables we coded in this category were instructional grouping (i.e., one on one, small group with 2–5 students, and large group; Zheng et al., 2013), intervention agent (i.e., teacher, researcher, and computer program), and duration of the intervention (i.e., 1–7 sessions as short, 8–28 sessions as intermediate, and more than 28 sessions as long; Xin & Jitendra, 1999). Quality of research methodology: The variables coded in this category came from Gersten et al.'s (2005) proposed 10 essential quality indicators and eight desirable quality indicators. We coded “1” if the quality indicator was met and “0” if it was not met. Following Gersten et al.'s (2005) definition on “acceptable” and “high” quality research, we categorized studies into three quality categories: high quality (meet at least nine essential quality indicators and at least four desirable quality indicators), medium quality (meet at least nine essential quality indicators and at least one desirable quality indicators), and low quality (meet less than nine essential quality indicators). A more detailed description of essential quality indicators and desirable quality indicators can be found in Gersten et al. (2005). Domain of intervention: We coded the names of the dependent measures used in each intervention study and the mathematics domain each measure assessed. We separated the dependent measures into the following categories of mathematics domains: early numeracy, basic fact, computation, problem solving, fraction, algebra, and general mathematics proficiency. A measure was coded as general mathematics proficiency when it covers a range of mathematics domains. Intervention approaches: Intervention approaches were coded based on the orientation of each intervention approach following Baker et al.'s (2002) intervention approach categories (i.e., providing data and feedback on students’ mathematics performance to teachers or students, peer assisted learning, parental support, explicit or contextualized teacher facilitated instruction, and computer–assisted instruction). Intervention components: We coded instructional components based on the work by Swanson and colleagues (Swanson et al., 1999; Swanson & Sachse–Lee, 2000; Zheng et al., 2013). A total of 18 instructional components were obtained and dummy coded.
To ensure accurate and consistent coding of the studies, we first independently coded four studies, compared codes for each variable, and discussed how to code the variables if a discrepancy occurred. We then divided up the remaining studies amongst the authors to code independently. About 60 percent of the total articles were independently coded by two coders. These double–coded articles were used for inter–coder agreement calculation. We calculated inter–coder agreement as the number of agreements divided by the number of agreements plus disagreements, multiplied by 100. The inter–coder agreement on coding items related to intervention parameters; participant information was above 99 percent (range 98–100 percent), the agreement quality of research methodology was 96 percent (range 93–100 percent), and the intervention approaches and intervention components had agreement about 92 percent (range 84–100 percent). The first author and two other coders resolved the inconsistent items for the final analysis.
Effect Size Calculation
Hedges’ g (Hedges, 1981), adjusting for pretest performance, was the primary index of ES. We chose Hedges’ g because it allows pooling standard deviations when treatment and control groups are dissimilar in size (Hedges, 1981). The ES was calculated as the difference between the experimental and comparison condition means divided by the pooled weighted standard deviation:
Effect Size Aggregation
We calculated ESs on all dependent variables within each study. Because the majority of the studies used more than one dependent measure to evaluate student performance, each study could yield multiple ESs. We averaged the ESs within a study to yield a composite ES for each study. Although averaging stochastically dependent ESs within a study implies an increased type 1 error rate of the homogeneity of effect size test, the procedure is considered a reasonable approximation of the ES estimate when the unbiased ES estimate is unobtainable due to a lack of correlational information in the original studies (Gersten et al., 2009b; Swanson et al., 1999).
Data Analysis
We first calculated the main effect across studies. The unit of analysis we used in the calculation was the composite ES from each study. Using the composite ES as the unit of analysis is appropriate in this case, because each study only contributes to one ES proportionately to its sample size. However, treating separate ESs obtained from multiple interventions or multiple outcomes as independent when analyzing the main effect and the effect of moderator is problematic, because studies that reported more outcome measures will receive more weight, which will lead to an improper estimate of the main effect (Borenstein, Hedges, Higgins, & Rothstein, 2009; Gleser & Olkin, 1994).
Second, we analyzed the influence of participant characteristics, intervention parameters, and the quality of the research methodology using moderator analysis. Moderator analysis (i.e., categorical model testing) was conducted to determine the precision of ES difference by the subgroups of moderator variables. We used Q test to partition the variance of ESs and test the between–subgroups portion of the variance within the moderator variable to determine the contribution of each subgroup to ES (Borenstein et al., 2009).
Third, we analyzed the ESs in relation to the domain of instruction (e.g., early numeracy, fact retrieval, computation, fractions and decimals, problem solving, algebra, and general mathematics proficiency). The primary unit of this analysis was the ES derived from each outcome measure. Because almost all studies used more than one measure to assess student performance and each measure had its specific construct, using ES derived from each outcome measure rather than the averaged ESs of each study for this analysis can better represent the unique construct of the outcome measures.
Fourth, we calculated ESs relevant to broader instructional approaches including providing data and feedback on students’ mathematics performance to teachers or students, peer assisted learning, parental support, explicit teacher facilitated instruction, and computer–assisted instruction. Because multiple comparisons were common for the studies included in the synthesis, we carried out orthogonal contrasts (Rothensal, Rosnow, & Rubin, 1999) based on major research questions of each study to determine the independent contributions of the contrasts to the total effect. We used ES calculated using orthogonal contrast as the unit of analysis for the aggregate ES for each broader instructional approach.
Finally, we assessed which of the 18 instructional components played a significant role in best predicting ESs. A meta–regression model (Borenstein et al., 2009) was performed to assess the unique contribution of each instructional component on the overall ESs. Meta–regression is analogous to the multiple regression analysis; however, in meta–regression, the unit of analysis, ES, was weighted according to its respective precision and then the weighted regression was conducted. The weighted sum of squares due to the regression is the statistic we used to evaluate the model fit. The R2 of meta–regression (calculated using the unbiased estimates of τ2) was used to specify the proportion of variance explained by the regression models comprised by the instructional components. We then used a Type III sum of squares to determine the independent contribution of the instructional components to the regression model.
Results
Study Summary and Main Effect across Studies
Table 1 reports the adjusted ESs and a summary of the studies included in this synthesis. The majority of the intervention studies were for students at the elementary level, with few studies done at the kindergarten level; none of the studies included in the synthesis involved secondary–level students. Small group (two to five students per group) and one–to–one instruction were the most frequently used intervention delivery modes; only three studies provided the intervention to a larger group of students (Clarke et al., 2011; Fuchs et al., 2003; Fuchs, Fuchs, & Prentice, 2004). The intervention length ranged from 45 to 5,400 min with an average of 1,226.38 min. Although all studies provided operational definitions of MD, there was no consensus on how to identify students with MD. The majority of the studies relied on the mathematics screening measure to identify students with MD; however, they used different benchmark cut–off scores. Leh and Jitendra (2013) used a more liberal 50th percentile rank (PR) as the cut–off score to catch more students for the intervention; Fuchs, Fuchs, & Karns (2001) and Re, Pedron, Tressoldi, and Lucangeli (2014) used the most stringent criteria for MD identification for which they used the cut–off score of 1.5 SD below the mean on standardized tests (equivalent to <6th PR). The 25th PR was the most frequently used cut–off point for MD identification (10 studies), followed by the 40th PR (five studies). Several studies used other means to identify students with MD, including use of professional judgment.
Summary of Studies Included in the Analysis
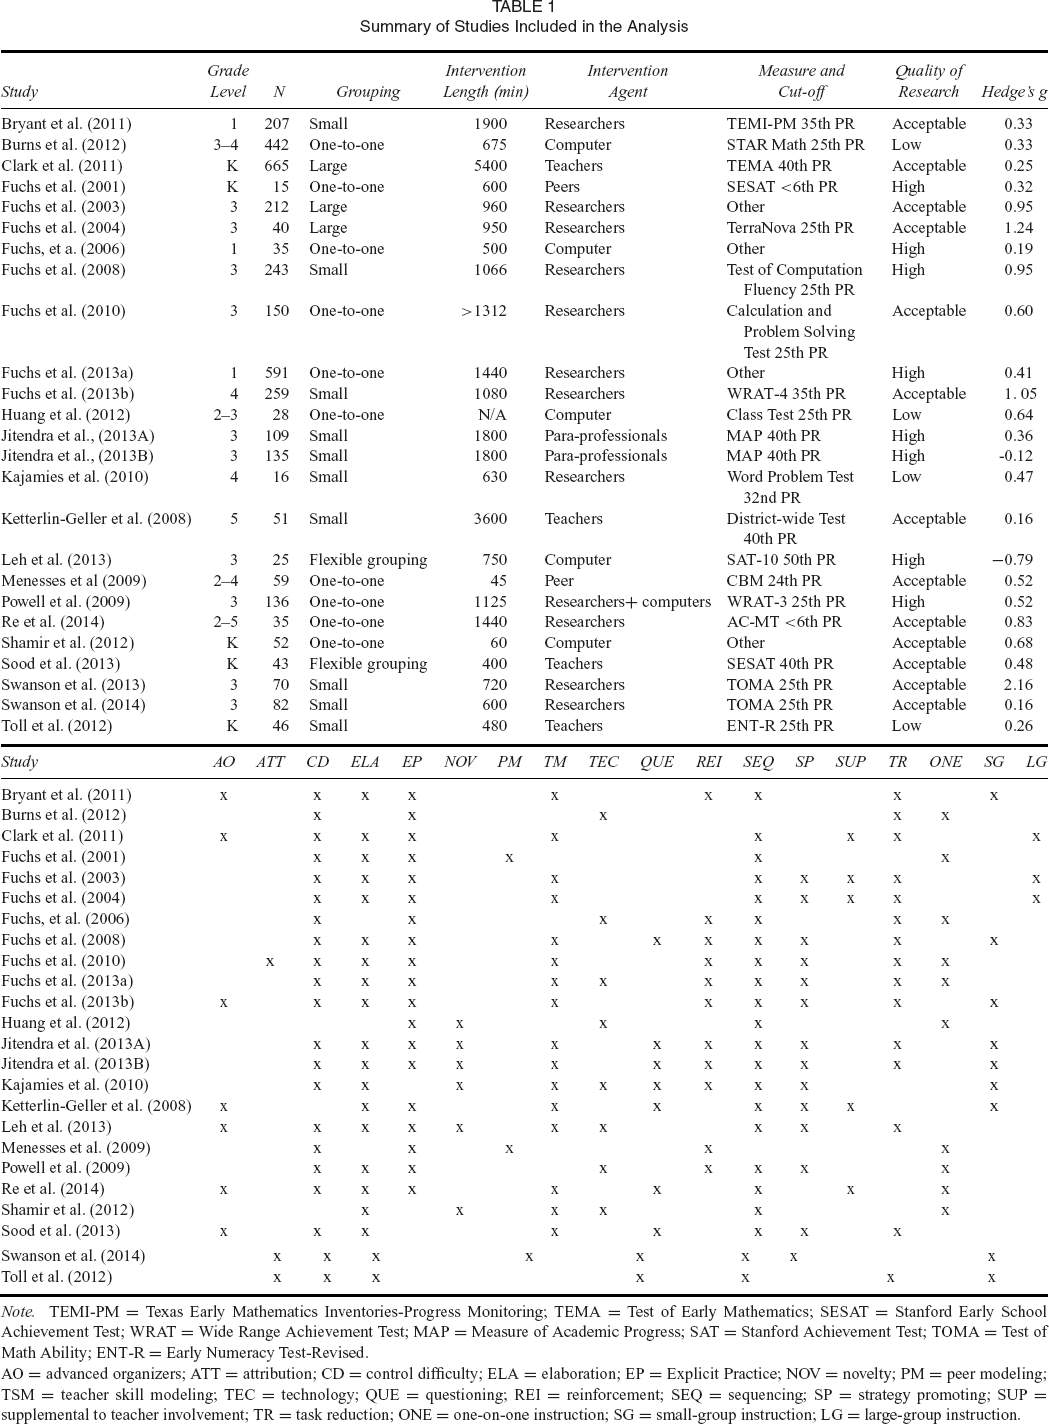
TEMI–PM = Texas Early Mathematics Inventories–Progress Monitoring; TEMA = Test of Early Mathematics; SESAT = Stanford Early School Achievement Test; WRAT = Wide Range Achievement Test; MAP = Measure of Academic Progress; SAT = Stanford Achievement Test; TOMA = Test of Math Ability; ENT–R = Early Numeracy Test–Revised.
AO = advanced organizers; ATT = attribution; CD = control difficulty; ELA = elaboration; EP = Explicit Practice; NOV = novelty; PM = peer modeling; TSM = teacher skill modeling; TEC = technology; QUE = questioning; REI = reinforcement; SEQ = sequencing; SP = strategy promoting; SUP = supplemental to teacher involvement; TR = task reduction; ONE = one–on–one instruction; SG = small–group instruction; LG = large–group instruction.
The mean adjusted ES was 0.53 across all studies, with the 95 percent confidence interval ranging between 0.36 and 1.07. The homogeneity test showed that the individual ESs were heterogeneous across studies (Q = 117.45, p <. 001). The heterogeneity of the ESs suggests that further moderator analyses are needed.
Moderator Analysis
A summary of the results of the moderator analysis is in Table 2. The significant effects that emerged suggested that several participant characteristics influenced the effects of interventions. The first significant finding was that participants’ grade levels (elementary vs. kindergarten) affected the effects of the intervention: studies conducted at the elementary level had significantly higher ES than those conducted at the kindergarten level (Qb = 9.163, p <. 01). In addition, the level of mathematics performance of students with MD also influenced the effects of the intervention. Studies used students whose mathematics performance was at or lower than the 35th PR at the time of identification had overall higher ES. It appears that intervention studies that included students who were more homogeneous and who had greater difficulties in mathematics yielded better intervention outcomes.
Main Effects for Studies as a Function of Participant Characteristics, Intervention Parameters, and Quality of Research Methodology
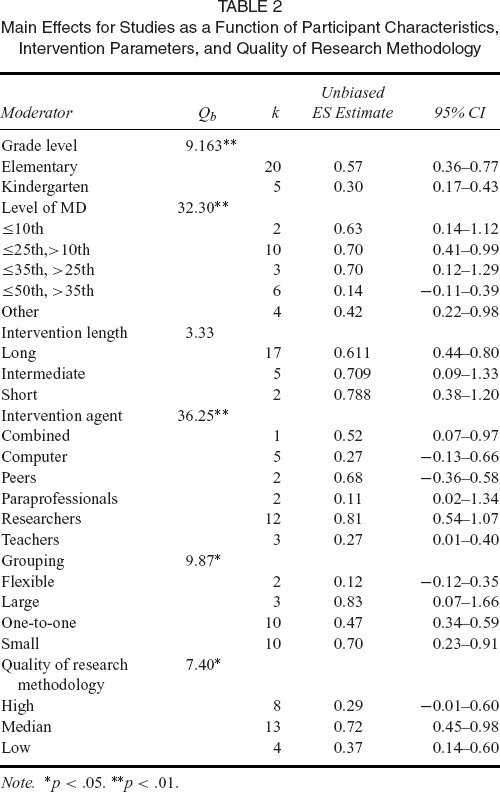
*p <. 05. **p <. 01.
Intervention parameters also played a role in the effects of the interventions. The first finding was that intervention agents mediated the effects of the intervention (Qb = 36.25, p <. 01). Interventions provided by researchers or researcher–trained graduate assistants yielded higher ES; peer–mediated intervention followed. Interventions provided by computers, paraprofessionals, and teachers had an overall smaller ES. We also compared the effects of different groupings on the effects of intervention. The results indicated that larger group instruction overall produced greater ES than one–to–one or small group instruction. Interventions using flexible groups yielded lower ES. To compare the effects of one–to–one instruction and small group instruction, we carried out an ad–hoc comparison. There was no significant difference between small group instruction and one–to–one instruction (Qb = 1.932). Finally, the methodological features of the study played a role in the effects of the intervention. The results show that studies with medium methodological quality had a higher overall ES estimate than studies that scored either low or high on the composite methodology scores. The lowest ES estimate occurred for those studies with higher composite methodology scores.
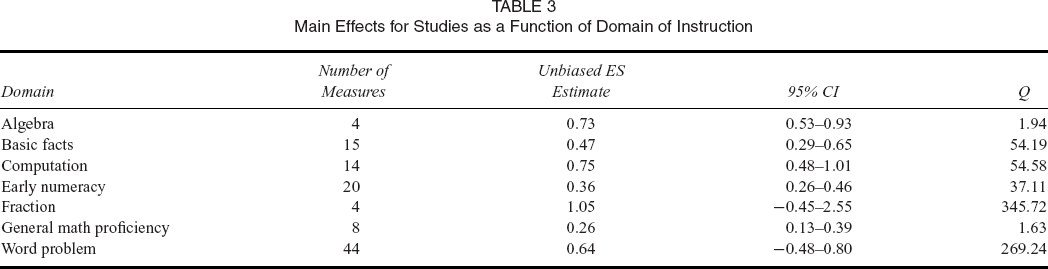
Domains of Instruction
Table 3 summarizes the overall ES for each domain of instruction across studies. The most frequent dependent measures across the various studies were the measures of problem solving; both fraction and algebra were measured by only 4 dependent measures. The domain of fraction yielded the largest effect (ES = 1.05, k = 4, p =. 171), followed by algebra (ES = 0.73, k = 4, p <. 01) and computation (ES = 0.75, k = 14, p <. 01).
Main Effects for Studies as a Function of Domain of Instruction
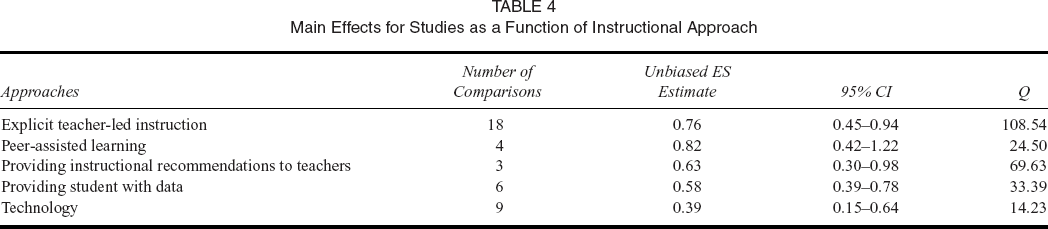
Instructional Approaches
A summary of aggregate ESs for instructional approaches categorized by Baker et al. (2002) is in Table 4. As shown, studies that used peer–assisted learning produced the largest ES (ES = 0.82, k = 4, p <. 01), followed by intervention using explicit teacher–led instruction (ES = 0.76, k = 18, p <. 01). Providing instructional recommendations to teachers (ES = 0.63, k = 3, p <. 01) and providing students with data (ES = 0.58, k = 6, p <. 05) had smaller effects. Interventions using technology (e.g., use of computer programs, tablets, etc.) produced the weakest effect (ES = 0.39, k = 9, p <. 05). Although providing feedback to parents was one instructional approach identified in Baker et al.'s synthesis, it does not appear in Table 4, because no study included in this synthesis delivered concrete feedback to parents.
Main Effects for Studies as a Function of Instructional Approach
Intervention Components
We used a meta–regression model to determine which of the instructional components best predicted ESs. As shown in Table 5, several instructional components positively predicted ES estimates (
Results of Meta–regression Analysis and Independent Influence of Isolated Instructional Components
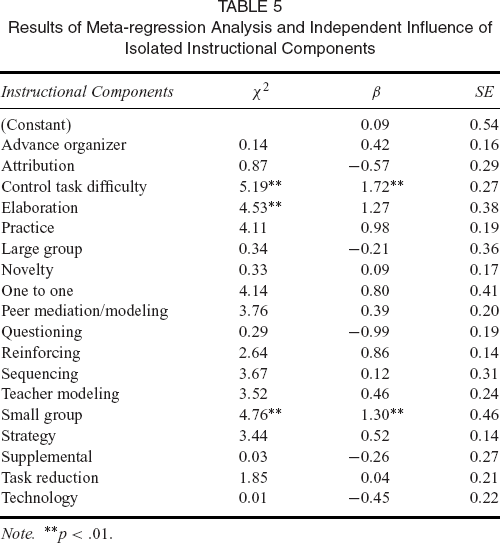
**p <. 01.
Finally, a type III sum of square was used to identify the independent contribution of the instructional components in the model. We used χ2 tests to determine the significance of the independent contribution of each instructional component. As shown in Table 5, the χ2 tests on significant independent contribution by individual instructional components showed that control task difficulty, elaboration, and small group instruction significantly contribute to ESs.
Discussion
The purpose of this study was to extend earlier work by synthesizing the effects of experimental and quasi–experimental studies published between 2000 and 2014 on students with MD. This study also extended prior work by analyzing the influence of student characteristics and study characteristics on the intervention effects. In addition, we identified the instructional components underlying effective interventions for students with MD. The following section presents a discussion of each research question raised in this study.
What is the Overall Effectiveness of Mathematics Intervention Approaches for Students with MD?
The overall mean adjusted ES was 0.53 across all studies, suggesting that mathematics interventions had an overall positive impact on mathematics performance of students with MD. Because the studies varied in terms of instructional approaches, instructional design, intervention domain, and methodological soundness, it is more meaningful to examine how the magnitude of the ESs related to the different aspects of the intervention studies. We address the impacts of different aspects of the intervention studies on the magnitude of the ESs below.
Do Effect Sizes in Mathematics Interventions for Students with MD Vary as a Function of Specific Participant Characteristics?
We examined two variables related to participant characteristics. The first variable we included in the analysis was participants’ grade level. The results of the analysis showed that participants’ grade level moderated the magnitude of ESs, and that studies conducted at the kindergarten level yielded significantly weaker effects than studies conducted at the elementary level. The unbiased ES estimate for interventions at the kindergarten level was smaller than that for interventions at the elementary level, which suggested that kindergarteners benefited less from the interventions. Although kindergarten attendance was not required by the majority of the states in the United States (Institute of Education Science, 2016), this finding is somewhat concerning given the importance of early intervention and prevention. Another finding related to participants’ grade level was that none of the studies included in the analysis took place at the secondary level. Given that students’ mathematics performance was progressively weaker with grade level increase (Mullis et al. 2012), more mathematics interventions are needed at the secondary level.
The second variable included in the analysis was the level of mathematics performance with which students with MD were identified. The results suggested that studies provided for students who had low math performance (at or below 35th PR) at the time of identification yielded stronger intervention effects. However, studies that were provided for students who had mathematics performance at or below the 40th or 50th PR at the time they were identified produced much weaker intervention effects. This finding, interestingly, was somewhat consistent with the finding from a recent evaluation of the effect of Tier 2 reading intervention (Balu et al., 2015), in which students who were likely to be considered false–positive for reading difficulty benefited less from the Tier 2 intervention (i.e., there was a negative intervention effect). It seems that studies comprising students who had mathematics performance at or below the 40th or 50th PR at the time of identification inevitably included a group of students who were likely to be false–positive for MD and therefore may have mitigated the treatment effects.
Do Specific Intervention Parameters Moderate the Effect Sizes of Mathematics Interventions for Students with MD?
The results of our analysis indicated that intervention parameters, including intervention agent and instructional grouping, mediated the effects of interventions. The results for intervention agent showed that the interventions were much more effective when they were provided by the researchers or researcher–trained graduate assistants. However, interventions provided by teachers or paraprofessionals produced much weaker intervention effects. Although the results needed to be interpreted with caution because of the small number of effect sizes (e.g., only three studies used teachers as the intervention agents, and two studies used paraprofessionals), the findings, to some extent, suggested the challenges of the scaling–up process (Klinger, Boardman, & McMaster, 2013) and call for more scale–up research.
Our analysis also seemed to indicate that instructional grouping influenced the effects of the interventions. Although the results for instructional grouping showed that studies using large instructional groups yielded the largest effects, the finding needed cautious interpretation, because only three studies used large instructional groups and the same research team conducted two of them (Fuchs et al., 2003, 2004). In addition, the stronger ES of larger instructional groups does not necessary suggest their superiority over other instructional groupings. Because in this synthesis the studies coded as large instructional groups were those that provided interventions in whole class settings, our finding suggested the importance of core instruction in the whole class settings (i.e., Tier 1 instruction), as a strong core instruction can boost the math performance of students struggling at learning math.
For studies using smaller instructional groups, the ad hoc comparison showed that there was no significant difference between small group instruction and one–to–one instruction. These findings suggested that both types of small group instruction were effective, and these findings were consistent with earlier work in the area of reading, which found no significant difference in students’ performance when they were in either one–to–one groups or groups of two to three (Iversen, Tunmer, & Chapman, 2005; Vaughn et al. 2003).
Do Methodological Features of the Intervention Studies Affect the Effect Sizes in Mathematics Intervention for Students with MD?
Two findings related to this research question are worth noting. First, the majority of the studies included in our synthesis were of high or median quality (k = 21), and only four studies were of low quality. Because per Gersten et al. (2005), the studies coded as median quality have acceptable research quality, this finding is welcome, given the recent emphasis on increasing rigorous and scientific research in education (National Research Council, 2002). Second, our analysis showed that the studies achieving higher methodological quality had the lowest ES estimate; studies rated as having medium quality had the highest ES estimate. Earlier reviews have also found the association between low ES estimate and high methodological quality studies (Swanson et al., 1999). However, unlike the findings by Swanson et al., in which studies with lowest methodological quality yield the highest ES estimate, our analysis showed that studies with medium methodological quality, rather than those with low methodological quality, had the highest ES estimate. Although unreliable implementation of studies may increase the chance of attenuating ES estimates, we kept all studies in our synthesis, even studies with low methodological quality, because the present synthesis attempted to provide a comprehensive review of literature in interventions for students with MD. Our approach was similar to earlier work in which all intervention studies, regardless of the quality of the methodology, were included in the synthesis (Swanson et al., 1999; Swanson & Sachse–Lee, 2000). However, compared to the syntheses by Swanson et al. (1999) and Swanson and Sachse–Lee (2000), treatment effects as reported in our synthesis are considered more valid and reliable, because our synthesis included studies with better experimental control.
Do Effect Sizes in Mathematics Interventions for Students with MD Vary as a Function of Mathematics Domains of Intervention?
Based on the dependent measures used in each study, we arranged the dependent measures into seven categories of mathematics domains: early numeracy, basic fact, computation, problem solving, fraction, algebra, and general mathematics proficiency. The most measured domain was problem solving, whereas the least researched domains were algebra and fractions. Unsurprisingly, the results of our analysis showed that the magnitudes of ES estimates were greater in some mathematics domains than in others. The larger magnitude of ES estimates of mathematics domains, with the exception of general math proficiency and early numeracy, suggested that students with MD benefited from interventions targeted in these mathematics domains. However, the strong effects in the domains of algebra and fraction needed cautious interpretation, because only two studies used algebra and fraction as the outcome measures (Fuchs et al., 2013b, 2010 used fraction and algebra measure, respectively), and for each domain only four comparisons were included in the ES calculation.
Do Effect Sizes in Mathematics Intervention Vary as a Function of Instructional Approaches?
To answer this research question, we followed Baker et al.'s (2002) categorization of five instructional approaches, and our findings showed that not all instructional approaches were equally effective. The largest ES estimate came from the interventions using peer–assisted learning. This finding, combined with earlier work (Baker et al., 2002), suggested that peer–assisted learning could benefit students with MD. However, the effect of peer–assisted learning may be limited to specific early numeracy concepts such as number combinations, number identification, and number comparisons, because these were the only dependent measures used in studies utilizing the peer–assisted learning approach.
Explicit teacher–led instruction was the next most effective approach for students with MD. Our finding suggested that interventions including explicit teacher–led instruction components produced moderate effects on the mathematics performance of students with MD. Explicit instruction has been proven to be an effective instructional approach for students with mathematics learning disabilities (e.g., Swanson et al., 1999). Our finding showed that students with MD also benefited from such instructional approaches.
Interventions, including providing data to teachers and students, also produced positive effects, although the effects were lower than those of teacher–led instruction. In our synthesis, only three comparisons were conducted for providing data to teachers, and six comparisons for providing data to students. All the ESs from the comparisons were reasonably consistent.
In contrast, interventions including the use of technology were the least effective in improving the mathematics performance of students with MD. In the present synthesis, using technology entailed instruction presented using computer software programs or e–books. The weaker effects of intervention using technology was consistent with earlier findings that computer–based instruction failed to produce large effect sizes for all students in general (Kulik & Kulik, 1991) and for students with learning disabilities (Seo & Bryant, 2009).
Which Instructional Components Can Best Predict Effect Sizes in Mathematics Intervention?
In the final research question, we attempted to identify the instructional components that predicted the treatment effect, and to isolate the independent contribution of the instructional components on the ES estimates. Following earlier work (Swanson et al., 1999; Swanson & Sachse–Lee, 2000; Zheng et al., 2013), we coded 18 instructional components for our analysis. The instructional components that significantly and positively predicted ES estimates were control task difficulty and small group instruction. In addition, control task difficulty, elaboration (consisting of activities such as providing explicit explanations and use of think aloud modeling) and small group instruction significantly contributed to ES estimates independently. Because about 16 percent of the variance related to the interventions containing the task difficulty, elaboration, and small group instructional components, our finding suggested an association between treatments including these instructional components and high intervention effects.
Therefore, our findings suggested that interventions incorporating instructional design such as sequencing tasks from easy to difficult, task analysis, combining with teachers providing explicit explanation of concepts and procedures, were more likely to benefit students with MD. Moreover, we found that intervention delivered in a form of small–group instruction was a more effective and efficient instructional delivery mode for this group of students. These findings were somewhat consistent with the findings of Swanson et al. (1999), in that controlling task difficulty stood out as an instructional component that significantly and positively predicted ES estimates of studies for students with LD. Our findings combined with findings from Swanson et al.'s synthesis suggested that controlling task difficulty is an important instructional component for students with different levels of severity and pervasiveness in mathematics learning difficulties.
Limitations
Our synthesis was subject to several limitations. First, our selection criteria eliminated studies that were not peer–reviewed journal articles. The restriction of range in our study selection may result in publication bias. Second, our study included only a small number of studies in the synthesis. The effect of the small number of studies was more apparent in the results of moderator analysis in which we analyzed the ES estimates of subsets of treatments and outcome measures. Several ES estimates need cautious interpretation because the results reflected the treatment effects of an intervention or a domain of intervention from a particular research team or from a single study. Finally, we only included group design experimental and quasi–experimental studies in our synthesis. Based on our selection criteria, we excluded a sizable number of single–subject studies using scientific methodology to examine the effectiveness of interventions for students with MD. Therefore, we did not analyze the effects of interventions on a broader array of math domains using single subject design (e.g., Everett, Harsy, Hupp, & Jewell, 2014; Mayfield & Glenn, 2008; Zhang, Stecker, Huckabee, & Miller, 2014; Zhang & Xin, 2013), although the findings of such studies contributed to the improvement of mathematics performance of students with MD.
Implications and Future Research
Our synthesis offers several implications and future research suggestions. First, studies conducted at the kindergarten level yield weaker effects than studies conducted at the elementary level. One possible explanation for the weaker intervention effects in kindergartens may be because the wider range of skills addressed in the intervention programs than those in the interventions at the elementary level. For example, studies conducted at the kindergarten level mainly addressed early numeracy skills, which covered a wide range of skill sets, possibly including number concepts, operations, measurement, and geometry, whereas interventions at the elementary level mainly focused on narrower skill sets (e.g., problem solving, computation, etc.), with an exception of one study conducted in first grade in which a broader skill set was addressed (e.g., Bryant et al. 2011). Future research may consider interventions that address a smaller range of skill sets for kindergartners. In addition, a finding relevant to the grade level variable is that none of the studies included in the present synthesis occurred at the secondary level. Given that many students at the secondary level scored below proficient level in mathematics (NAEP, 2014), more studies are needed to address mathematics–related difficulty in middle–school and high–school students.
Second, our findings suggest that methodological quality moderated ESs. Although the majority of the studies included in the synthesis had at least median methodological quality, which means meeting at least nine essential quality indicators and at least one desirable quality indicators per Gersten et al. (2005), studies with high methodological quality (meeting at least nine essential quality indicators and at least four desirable quality indicators per Gersten et al.) were found to have the lowest ES estimate. Because methodological quality can affect how we make inferences about the effective approaches, more high–quality methodological studies can offer a better picture on effective approaches and instructional components for students with MD.
Third, we found that intervention studies included in our synthesis addressed seven mathematics domains including higher–level domains such as problem solving, fraction, and algebra; however, we only found two intervention studies in this synthesis that addressed the domains of algebra and fraction. Because fraction and algebra are common areas of difficulty for many students, especially those with a history of mathematics–related difficulties (Chazan & Yerushalmy, 2003; Hecht & Vagi, 2010), more research is needed for these two important mathematics domains. In addition, we found no intervention studies that addressed other mathematics domains such as geometry, measurement, and data analysis and probability. Interventions for students with MD should also focus on these areas, because these areas are too considered essential mathematics skills (e.g., Common Core State Standards, 2010; National Council of Teachers of Mathematics, 2000).
Finally, there are some common instructional components used in interventions that produced higher intervention effects including controlling task difficulty, elaboration, and small group instruction. Our finding suggests that mathematics intervention programs for students with MD should encompass these instructional components to have a better chance of improving the mathematics performance of students who struggling in learning mathematics.