
Abstract
The use of data for adaptive, tailor–made education can be beneficial for students with learning difficulties. While evaluating the effects of a data–based decision–making (DBDM) intervention on student outcomes, considerable variation between intervention effects, ranging from high–intervention effects to small or even negative intervention effects, across schools was found. The main purpose of this study was to investigate whether educator and school organizational characteristics are related to the effects of a DBDM intervention on student achievement growth by comparing 10 primary schools with strong intervention effects with 10 primary schools with no intervention effects on student achievement. Supportive and hindering factors were studied by means of surveys and interviews with school management teams, and by examining school reports from the project trainers. Results indicate that schools with strong intervention effects differed from schools with no intervention effects with regard to their teachers’ teaching quality, staff's attitude toward DBDM, and the school data culture.
Queen Beatrix Elementary and Lake View Elementary 1 are two primary (K–6) schools, belonging to the same school board in a suburban area in the Netherlands. These are 2 of 101 schools that participated in the same 2–year large–scale intervention study to implement and sustain data–based decision making (DBDM) in their schools with the aim of improving student performance. After 2 years, the staff of Queen Beatrix Elementary was quite enthusiastic and saw the added value of working in a data–based way as student performance had significantly improved compared to the period before the intervention. However, in Lake View Elementary, the results were not that promising; the intervention did not affect student performance at all. Teachers in this school perceived DBDM as time consuming and involving a lot of paperwork, and it failed to support their educational practice.
Why was the same DBDM intervention effective in Queen Beatrix Elementary, but not in Lake View Elementary? In the evaluation of the 2–year DBDM intervention in 101 schools, we found evidence of a positive average intervention effect on student outcomes (Keuning & Van Geel, 2016; Van Geel, Keuning, Visscher, & Fox, 2016). However, we also found considerable variation between intervention effects across schools. In this article, we study what educator and school organizational factors are associated with these differences in intervention effects. To do so, of the 101 participating schools the 10 schools with the strongest intervention effects were compared with the 10 schools with the smallest intervention effects.
Dbdm and Improved Student Outcomes
Just like in other countries (Ferguson, 2008; Roy, Guay, & Valois, 2013), there is a trend toward full inclusion in Dutch education. This leads to more diversity in general education classrooms, requiring teachers to adapt their instruction to more and larger differences between both advanced and weaker learners. Many researchers argue that the use of data can be beneficial for adapting instruction to students’ needs (Deno, 2003). For example, Stecker, Fuchs, and Fuchs (2005) found that the use of data is beneficial for students with learning difficulties, provided that data is used both for identifying students with learning difficulties and for modifying instruction timely. DBDM can be decomposed into four components: (1) analyzing and evaluating data, (2) setting SMART (Specific, Measurable, Attainable, Relevant, Time–bound) and challenging goals based on the analysis of student progress data, (3) choosing strategies to accomplish the goals set, and (4) executing the chosen strategies (see Figure 1).
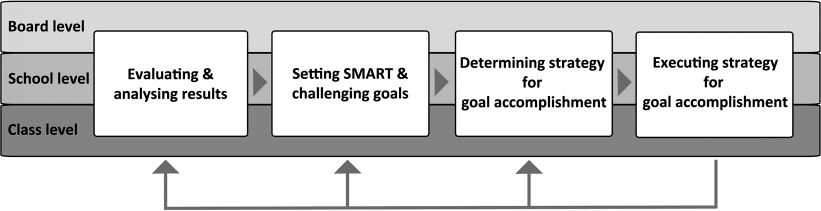
Schematic overview of DBDM.
In a number of studies, DBDM influenced student outcomes positively (Carlson, Borman, & Robinson, 2011; Konstantopoulos, Miller, & van der Ploeg, 2013; Van Geel et al., 2016). However, researchers also argue that there is still much work to do in terms of investigating precisely how data use can reach its full potential (Kaufman, Graham, Picciano, Popham, & Wiley, 2014). In other words, more insight into the conditions under which DBDM works is needed.
Factors Influencing Successful (Implementation of) DBDM
In the international DBDM literature, a broad range of features that might explain differences in DBDM effects are mentioned. These features can be found at the level of the data, the educators, and the school organization (e.g., Ikemoto & Marsh, 2007; Mandinach, 2012; Schildkamp & Poortman, 2015). The vast majority of the Dutch primary schools use standardized student–monitoring tests and register the results of these tests in their student monitoring system, a system that provides graphs and tables representing various aspects of student performance. Therefore, although we acknowledge the importance of having access to high–quality data and the availability of technological tools to make the data accessible and interpretable, in our context, data features were not a concern. For the purpose of this study, we focused on educator and school organizational features.
Educator Features: Knowledge and Skills
Educators’ knowledge and skills regarding DBDM are important for successful DBDM. First, knowledge and skills regarding analyzing and interpreting data, also called “data literacy,” are essential. Educators need to know how to transform raw data into actionable knowledge; therefore, skills such as collecting and organizing data, analyzing and summarizing data, and synthesizing and prioritizing data are needed (Bennett, 2011; Mandinach, Honey, & Light, 2006). Next, based on DBDM data analyses, users should know how to set SMART and challenging goals (Locke & Latham, 2002), and they need to be able to choose effective strategies to meet these goals. Finally, users (more specifically, teachers) need to execute the chosen strategies in daily classroom practice (Anderson, Leithwood, & Strauss, 2010; Visscher & Ehren, 2011). In this matter, teaching quality comes into play. Next to the basic, more general dimensions of teaching quality (e.g., creating a safe classroom climate, efficient classroom management, and providing clear instruction; Fauth, Decristan, Rieser, Klieme, & Büttner, 2014), two other teaching skills that are important for DBDM should be mentioned here, challenging students and teaching them in a goal–oriented way.
Educator Features: Attitudes toward DBDM
A positive attitude toward DBDM of all team members is regarded as important for successful DBDM (Schildkamp & Ehren, 2013; Schildkamp, Karbautzki, & Vanhoof, 2014). A negative DBDM attitude of all or part of the school team can severely hinder DBDM (Reeves & Burt, 2006). A negative attitude of teachers toward testing was one of the major challenges principals faced when implementing DBDM in their schools because teachers who did not see the value of testing did not use test results effectively (Reeves & Burt, 2006).
School Organization Features: Leadership for DBDM
The school leader is considered to have a key role in the successful implementation of DBDM in multiple ways (Ikemoto & Marsh, 2007; Levin & Datnow, 2012; Schildkamp & Lai, 2013). First, the school leader can play an important role for the practical preconditions for DBDM, such as the selection of a proper student monitoring system and providing teachers with time for DBDM activities and collaboration (Datnow, 2011; Ikemoto & Marsh, 2007; Schildkamp & Lai, 2013). Second, by promoting and facilitating data use, a school leader can influence teachers’ attitudes toward DBDM (Wayman, Cho, Jimerson, & Spikes, 2012). Finally, by promoting a strong DBDM vision and by having clear rules and norms for data use, the data culture of the school can be positively influenced by the school leader (Marsh, 2012).
School Organization Features: Data Culture
A culture that fosters data use and is achievement oriented is regarded essential for implementing and sustaining DBDM (Mandinach, 2012). According to Lai and Schildkamp (2013), DBDM is best implemented in schools in which team members feel the need to critically look at data, reflect on their own functioning, and, are open to changing their practice when data reveals a need to do so. However, it is not always easy to reflect on one's own functioning when feeling threatened (Marsh, 2012). A climate of trust is therefore essential in establishing a data culture within schools (Ikemoto & Marsh, 2007; Marsh, 2012; Visscher & Ehren, 2011). In such a culture, data are not used to judge but to support improvement. Moreover, an explicit vision on data use, which is clearly communicated by the school leader, is an essential part of a data culture. Such a vision is characterized by “a group's appreciation for the importance and power that data can bring to the decision–making process” (Hamilton et al., 2009, p. 46).
School Organization Features: Collaboration
Strong collaboration patterns can also support DBDM within a school (Schildkamp & Lai, 2013; Schildkamp & Poortman, 2015). In highly collaborative teams, teachers have more access to knowledge and skills for analyzing data and also have more opportunities to discuss performance goals and share effective strategies for goal accomplishment. Strong collaboration thus enhances a teams’ capacity to work in a data–based way (Farley–Ripple & Buttram, 2015; Jimerson & Wayman, 2015).
In sum, the DBDM literature presents a variety of factors that possibly influence the successful implementation of DBDM. However, there is still limited empirical evidence that these features affect student performance via DBDM.
Research Questions
As we noted in the introduction, the DBDM intervention worked in Queen Beatrix Elementary but not in Lake View Elementary. Differences in effects could have been caused by a number of factors. We studied those factors in two ways, first the school leaders of the 20 selected schools were interviewed and reports from the project trainers were examined. This allowed us to answer the following research question: Which educator and school organizational factors, as perceived by trainers and school leaders, promoted and/or hindered DBDM implementation in their schools?
Second, based on the theoretical framework for this study the educator characteristics and school organizational characteristics of schools with strong intervention effects were compared with those of the schools without intervention effects. Here, the underlying research question was: What differentiates schools that benefit from the DBDM intervention from those that do not benefit from the intervention?
To our knowledge, this is the first study to relate promoting and hindering DBDM factors to student achievement growth. It was expected that staff in schools with strong intervention effects (“strong–effect schools”) had more DBDM knowledge and DBDM skills at the end of the intervention compared to the group of schools with no intervention effects (reflected by higher data literacy, and higher teaching quality). Furthermore, their attitude toward DBDM during the intervention was expected to be more positive than the schools without intervention effects. Regarding school organizational characteristics, it was expected that in strong–effect schools, school leaders would be perceived as more achievement oriented, that the data–culture in such schools would be stronger, and that teachers in strong–effect schools would collaborate more on DBDM topics such as the discussion of student achievement, achievement goals, and appropriate instructional strategies.
Methods
A total of 101 primary schools (53 schools in Focus II and 48 schools in Focus III) participated in a 2–year DBDM intervention. Based on their calculated intervention effect on student mathematics achievement, expressed in terms of improved student achievement growth as described in Van Geel et al. (2016), schools in each cohort were ranked from the lowest (or no) intervention effect to the highest intervention effects. From the 2011 to 2012 cohort, one outlier school was excluded, as this was a very small school with unusual high levels of student achievement at the start of the intervention.
Next, from each of the two cohorts, the upper and lower five schools were selected. This resulted in a sample of 20 schools, of which the characteristics are presented in Table 1. For the purpose of this article, the strong–effect schools are coded SE1 to SE10 and the no–effect schools are coded NE11 to NE20. As can be found in Table 1, the no–effect schools and the strong–effect schools differed from each other on a number of school characteristics. In Van Geel et al. (2016), we already noted a significant interaction effect of school socio–economic status (SES), also presented in Table 1, showing that the majority of schools have a medium–SES population, whereas a majority of no–effect schools have a medium–SES population. Additionally, Table 1 shows that strong–effect and no–effect schools differed from each other in school size, urbanization, and intervention trajectory. The latter refers to the subjects the schools started with, and the subjects they added to their trajectory throughout the intervention period. Apparently, schools that chose to focus on mathematics for both years reached the highest intervention effects for mathematics while the schools that chose to add a new subject in the second intervention year had no student achievement effects at all. Although, the impact of the context factors (school–SES and intervention trajectory) is important, the current study was especially meant to clarify which educator and school organizational features explain differences in the impact of the intervention between schools.
School Context Characteristics
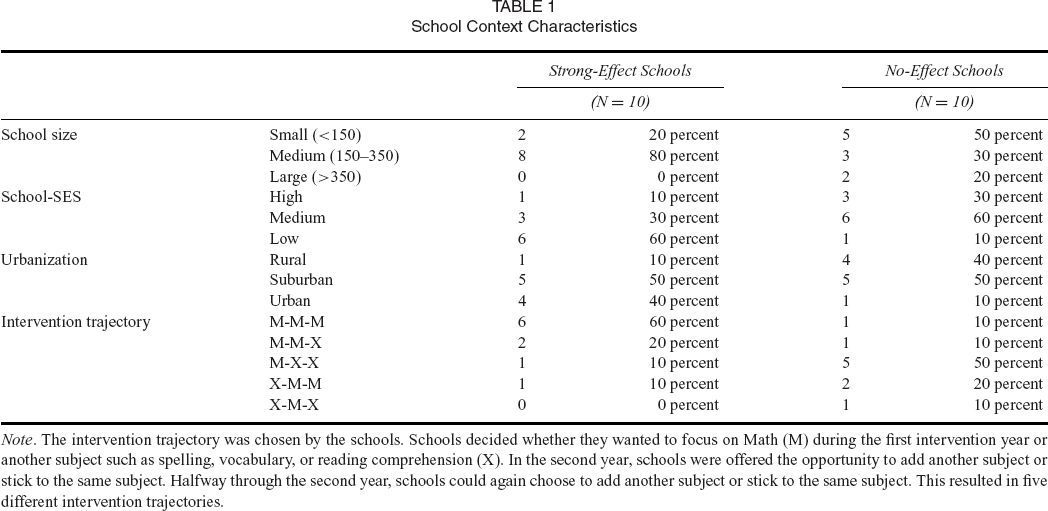
Note. The intervention trajectory was chosen by the schools. Schools decided whether they wanted to focus on Math (M) during the first intervention year or another subject such as spelling, vocabulary, or reading comprehension (X). In the second year, schools were offered the opportunity to add another subject or stick to the same subject. Halfway through the second year, schools could again choose to add another subject or stick to the same subject. This resulted in five different intervention trajectories.
Instruments and Data Collection
Multiple instruments were used to gather data about the factors potentially influencing DBDM implementation. Data collection took place at the start of the intervention (T1), the end of the first intervention year (T2a), the start of the second intervention year (T2b), and at the end of the second intervention year (T3).
Qualitative Data
To answer research question 1 and gain insight into school leaders’ experiences regarding the factors contributing to and hindering the implementation of the DBDM intervention, interviews with school leaders were held using the storyline–method (Beijaard, Driel van, & Verloop, 1999; Huizinga, Handelzalts, Nieveen, & Voogt, 2015). This method offered school leaders the opportunity to reflect on their DBDM implementation process experiences during the entire intervention period. First, the trainer explained the storyline method to the school leader and, in some cases, the academic coach or other members of the school management team. School leaders were provided with an empty graph. Time (in months) was displayed on the x–axis and the y–axis ranged from 1 to 10. School leaders were asked: “How would you rate the process of implementing DBDM in your school during the Focus–project?” They could rate the process with a score between 1 and 10. School leaders answered this question by plotting a storyline in the empty graph, starting at “now” (thus, at the end of the project), and then, while thinking back to the start of the project, rating the various time points of the process by giving grades between 1 and 10.
After they had plotted the storyline, school leaders were asked to which factors had caused the peaks and valleys in the storyline they had drawn (e.g., the acquisition of data–analysis competences caused enthusiasm versus an intervention meeting of which the content was considered to be too repetitive by participants). Additionally, the interviewer asked which of the more general factors had promoted or hindered DBDM implementation (e.g., general collaboration within a school team vs. poor teaching quality). The interviewer made notes during the interview and summarized the outcomes for each school. All schools received a summary to which they could respond in case information was missing or incorrect. These notes and summaries were used for our study.
In addition, prior to their interviews with a school leader, trainers wrote down their own experiences per school in a report using the same storyline method. In this report they, answered the same questions as the school leaders.
Quantitative Survey Data
Quantitative data were collected about teaching quality, school leadership, data culture, collaboration, and staff members’ attitude toward DBDM. In Table 3, an overview of data collection activities and the features of the data collected is presented.
An Intervention for Improving DBDM
Since DBDM is still not common practice in education (Farley–Ripple & Buttram, 2015; Means, Padilla, & Gallagher, 2010), the University of Twente developed a 2–year team training, called “The Focus–intervention” with the aim to implement and to sustain DBDM within the whole school organization. In Table 2, an overview of intervention meetings is provided. In the first year, the basic knowledge and skills for DBDM were covered in seven team meetings. Note that in meeting 2, the emphasis was on diagnosing individual students’ learning needs. Teachers, for example, learned how to conduct a student interview in order to identify misconceptions within the zone of proximal development. As a result, teachers learned how to select an instructional strategy to meet students’ needs.
Overview of the Intervention Meetings

The second year included five team meetings in which schools chose to broaden their scope to a new subject, or to deepen DBDM for the subject they had already worked on throughout the first year. In addition to the team meetings, the project trainer discussed the schools’ progress with the school leaders and, if applicable, the academic coach twice a year. In these meetings, the importance of fulfilling the practical preconditions for DBDM was stressed; schools’ progress regarding DBDM was discussed and school leaders were supported in preparing the team meetings during which the results of students in the various grades, as well as the effectiveness of educational strategies to improve student learning and achievement were evaluated.
In August 2011, the first cohort of 53 primary schools began the intervention (Focus II), after which in August 2012, a second cohort of 43 primary schools began the intervention (Focus III). In both cohorts, the same content was taught to the participants and the training included the same sequence of meetings. Nevertheless, the two cohorts differed slightly on the subject they focused on during the first year; for example, in Focus II all schools started the intervention focusing on “mathematics.” In the second year, Focus II schools had the possibility to broaden their scope to “spelling.” In contrast, Focus III schools could choose the subject they wanted to start with in the first year: mathematics, spelling, reading comprehension or vocabulary. In the second year, Focus III schools could broaden their scope to a second subject. Additionally, in Focus III, an extra observation round was included in the second year, instead of a meeting (as in Focus II).
Cohorts received trainings from different project trainers, however, all trainers had been appointed by the University of Twente for this project. Furthermore, the implementation of the training was supervised by the first two authors of this article, who themselves were not directly involved in working with the schools.
To ascertain that the DBDM training was as consistent as possible across schools and trainers, each meeting had a central topic that was the same for every participating school. The content of these meetings was fixed for all schools, the same PowerPoint slides were used and the same exercises were conducted. Prior to each meeting, the trainers discussed the content for that specific meeting intensively to assure that each of them would present the information in the same way. The time a trainer spent on a specific topic within a meeting varied somewhat between schools, as school teams’ prior knowledge, team members’ needs, and the subject chosen by a school varied.
Data Analysis
The researcher used Atlas.ti to code trainer reports and the summaries of the interviews with the school leader. Table 3 presents, for each of the quantitative sources used for this study, the analyses that were conducted for computing the values used. In most cases, the analyses were performed for all schools that participated in the DBDM intervention. As can be seen in Table 3, the quantitative measures of teaching quality, data literacy and teachers’ attitude were measures using multivariate multilevel pre–post–post item response theory (IRT), a detailed description of these analyses can be found in Keuning and Van Geel (2016). The items in all scales had acceptable discrimination and difficulty parameters.
Overview of Quantitative Data Collection, Data Analysis, and Software Used

Results
To answer our first research question, about the factors that school leaders and/or trainers perceived as having promoted or hindered DBDM implementation the results from the interviews with school leaders and trainer reports are presented for each factor studied. Next, in order to answer the second research question, concerning the differences between “no–effect schools” and “strong–effect schools,” the results from the questionnaires are presented. The results on the educator characteristics are presented first, followed by the results on the school organizational characteristics. Two factors, not included in our theoretical framework but considered important by the school leader and/or the trainer, are presented at the end of this section.
Educator Characteristics
Educators’ Knowledge (Data Literacy)
Based on the school leaders’ storylines, we found that the first four meetings of the intervention resulted in a peak in the implementation process. Sixteen of 20 schools reported that these meetings, in which the basic knowledge and skills for DBDM were acquired, were very beneficial for DBDM implementation in their school. No differences were found between strong–effect and no–effect schools based on qualitative data. For example, the school leader of NE20 said:
After meeting 1.1 there was a peak, we had no idea what the possibilities of our student monitoring system were, and teachers were very enthusiastic when they found out they could for example graph their students’ achievement growth.
Based on the findings from the data literacy test, no differences were found between no–effect schools and strong–effect schools in terms of their data literacy growth. As can be seen in Figure 2, in both groups data literacy strongly improved during the intervention.
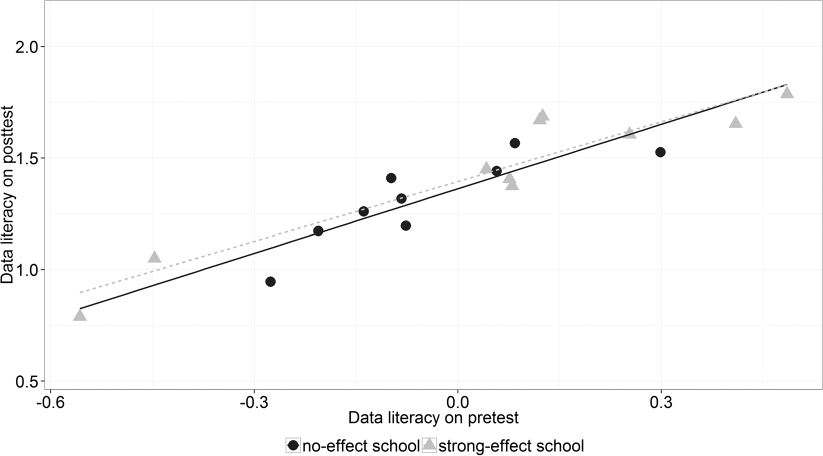
Schools’ data literacy scores on the pretest plotted against posttest scores.
Teaching Quality
Based on trainer reports, it appeared that teaching quality was an important factor for successful DBDM implementation. Moreover, the trainers mentioned clear differences between no–effect and strong–effect schools. Trainers reported that in seven of 10 strong–effect schools, overall teaching quality was “sufficient” to “excellent.”
Moreover, in the Focus III second lesson observation round, most teachers had improved compared to the first lesson observation round. The trainer of school SE1 noted:
Compared to the first round of lesson observations, the teachers in this school really improved their teaching practice. They have used the feedback to resolve issues that deserved attention, which I now regard as qualities.
In contrast, in three of 10 no–effect schools, trainers reported teaching quality as sufficient. In one school, the trainer could observe too few lessons to judge teaching quality. Moreover, trainers reported weak to moderate lessons in two no–effect schools, for example, in school NE17:
The lessons I observed were not in line with the instructional plans the teachers had written. Overall, lesson quality was not that bad, but there was considerable room for improvement. First of all, classroom climate, classroom management, and providing clear instruction should be up to standard, before teachers try to implement the more complex instructional strategies they described in their plans.
In four schools, trainers observed considerable variation in teaching quality between teachers, which they reported as a hindering factor for implementing DBDM.
Quantitative teaching quality measures, which were only available for the Focus III schools, confirmed trainers’ observations. As can be seen in Table 4, at pretest, students in the strong–effect schools rated their teacher, on average, more positively on all five teaching scales than did students in the no–effect schools. At posttest, teachers in the no–effects schools, in the eyes of their students, improved considerably on classroom management, challenging students, and goal–oriented teaching. However, teachers in the strong–effects schools still outperformed teachers in the no–effect schools. As presented in Table 4, the difference between strong–effect schools and no–effect schools was largest for the “challenging students” and “goal–oriented teaching” teaching scales, which are especially important for DBDM. As judged by students, the majority of teachers improved their teaching skills with regard to these DBDM skills; however, teachers in the strong–effect schools showed more improvement compared to teachers in no–effect schools. Moreover, especially for the factor goal–oriented teaching prior to the intervention, the majority of teachers in the no–effect schools scored below the population average of zero.
Means and Standard Deviations per Teaching Quality Scale in Strong–Effect Schools (N = 32) and No–Effect Schools (N = 21) for Focus III Schools

Attitude
In seven strong–effect schools and in four no–effect schools, trainers identified positive team attitudes as a promoting factor. A positive attitude was characterized by a highly motivated team, one eager to learn and change their practice based on the feedback they received from the trainer. These teams recognized the usefulness of the intervention. Because trainers reported such a positive attitude in both groups of schools, a positive attitude did not seem to be a cause of differential intervention effects. However, a negative attitude toward DBDM implementation did seem to cause differences between strong–effect and no–effect schools. Trainers reported negative attitudes toward the intervention or toward DBDM as a hindrance to implementation. In the no–effect schools, teachers were more often critical toward DBDM compared to teachers in strong–effect schools. In seven of 10 no–effect schools, the project trainers reported that, at some point during the intervention, they experienced a negative attitude and resistance toward DBDM. In contrast, trainers reported negative attitudes in three of 10 strong–effect schools. Reports from the trainer revealed that this negative attitude toward DBDM in the no–effect schools had multiple reasons. Some schools had a negative attitude at the start of the intervention, which was mostly caused by a lack of agreement within the team to participate in the DBDM intervention. For example, the school leader at school NE14 stated:
Participation in the intervention was demanded by the school board, therefore, the school team was initially unmotivated.
Other schools started as motivated, but became demotivated in the second intervention year. For example on school NE17, the trainer reported:
During the first year, the teachers were very dedicated and enthusiastic. They were critical but motivated, and worked hard on implementing DBDM. During the second year, there was a lot of discussion but no decisions were made. A lack of leadership and clear agreements led to diversity in, for example, the instructional plans and the depth of data–analysis, and eventually to a stagnation in DBDM implementation.
Furthermore, in some schools a negative attitude toward DBDM and the DBDM intervention was mentioned as a result of “confusion” within the team. This, for example, applies to school NE11, in which the information presented in the first meetings was not in line with how the school already worked in terms of DBDM.
Although not all members in the no–effects schools had a negative attitude toward DBDM project, trainers reported that if a team displayed a negative attitude, DBDM implementation within the whole school could be delayed. For instance, the trainer of school NE20 stated:
All teachers attended all meetings, but only the teachers in the higher grades participated actively in the meetings. Kindergarten teachers were not motivated and were just there because they felt they had to. I think the intervention therefore had an effect on individual teachers, but not on the school as a whole.
In contrast, in those strong–effect schools (three of 10) in which negative attitudes were mentioned, trainers only experienced this at the start of the intervention, for example, in school SE07:
During the first four meetings, the team was not motivated and teachers were afraid DBDM would only imply a lot of paperwork. However, after meeting 1.5 in which student achievement was discussed for the first time, they became aware of the benefits of DBDM.
Our quantitative data supplement the findings from the trainer reports. Four scales were used to measure attitude. The first scale concerned participants’ general attitude toward DBDM. As can be seen in Figure 3A, large variation between the 20 schools was found. On average, team members in the no–effect schools started with a less positive attitude toward DBDM. Additionally, the average attitude toward DBDM decreased in the no–effect schools, while the attitude remained positive in strong–effect schools.
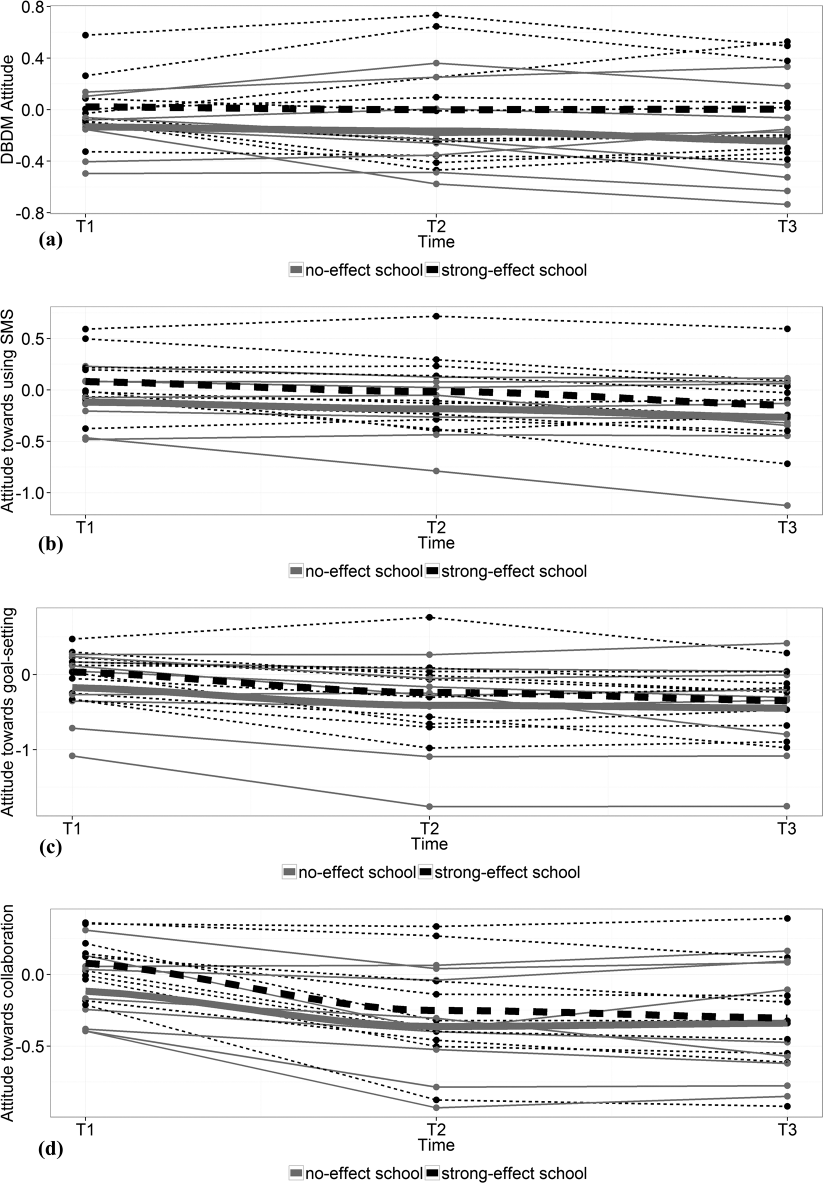
Schools’ attitudes toward (a) DBDM in general; (b) analyzing student achievement data with the student monitoring system; (c) setting goals based on data; and (d) collaboration during the DBDM process. The bold dotted line represents the average strong–effect school attitude; the bold solid line represents the average no–effect school attitude.
Aside from the general attitude scale (Figure 3A), the attitude toward specific DBDM components (analyzing student achievement data with the student monitoring system; setting goals based on data; and collaboration during the DBDM process) was measured. Figures 3B–D, show that for all three scales the same trend was found as in the general attitude scale, great variability between schools and, in general, a more positive attitude in strong–effect schools. As can be seen in Figure 3, in both groups of schools the attitude slightly declined over time. Remarkably this decrease was stronger for the strong–effect schools.
School Organizational Characteristics
Educational Leadership for DBDM
In both groups of schools, project trainers reported that the school leader was either a promoting or hindering factor during the implementation of DBDM. A school leader who was not involved in the innovation process was regarded as a hindering factor. In most of these cases the school leaders delegated the responsibility of leading the DBDM process to their academic coach. For example, in school SE5, the trainer reported:
In this school, the academic coach was key to the entire process of change. The school leader and deputy school leader showed a lack of knowledge with regards to the student monitoring system, and expected the academic coach to analyze and interpret data at the school level.
Other reasons for mentioning the school leader as a hindering factor for DBDM implementation were (1) weak communication within the management team or (2) a school leader without authority. Finally, trainers felt that overprotective school leaders delayed the implementation of DBDM, by skipping, or postponing intervention parts because of fear that staff members were too busy to work on all DBDM components.
Trainers described school leaders who promoted the implementation of DBDM were as “involved,” knowledgeable about the needs of their team members, and communicative about the added value of DBDM. According to the trainers, such school leaders were particularly important during the meetings in which the school leader presented the student achievement results of the school followed by discussion with the whole team. A trainer at school SE10 stated:
This school really celebrated success. The school leader brought a cake to celebrate the raise in student achievement and complimented teachers for the good job they had done. He made sure he attributed the success to the teachers and the way they implemented DBDM.
Furthermore, during these meetings strong school leaders made clear agreements with their team members and ensured that these agreements were met.
Quantitative data revealed no meaningful differences between school leaders in strong–effect schools compared to school leaders in no–effect schools. School leaders’ background characteristics were similar. In both groups, there were six male school leaders and four females, the majority of them in the age group 51–60. Most school leaders had a Master's degree. In all schools selected for this study, the same person fulfilled the formal role of school leader during the entire intervention.
Table 5 presents the assigned school leader classes for T1, T2, and T3, where classes of leadership for DBDM are ordered from the least DBDM oriented (SL1) to the most DBDM oriented school leader (SL5). No remarkable differences with regards to assigned school leadership class were found between strong–effect and no–effect schools. Additionally, in the strong–effect schools, four school leaders were assigned to the same leadership class at the start. Four school leaders moved to a higher class at the end of the intervention, and one school leader moved to a lower class. In the no–effect schools, three schools were assigned the same leadership class, while six school leaders moved to a higher class, and one to a lower class.
Assigned School Leader Classes and Assigned Data Culture Classes for T1, T2, and T3
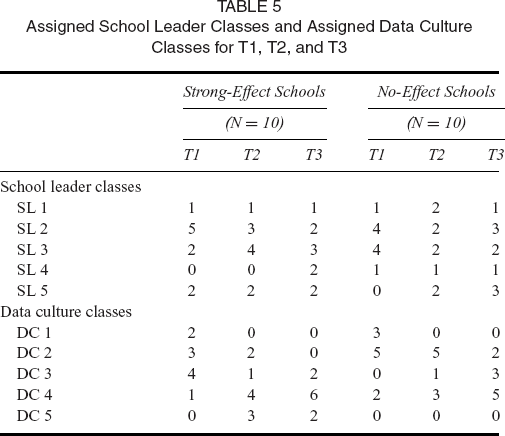
Data Culture
In the interviews with the school leaders and in the trainer reports, “data culture” was not often mentioned as a promoting or hindering factor. A possible explanation might be that the term “data culture” is a more scientific concept and not commonly used by educators. As was mentioned in the previous, educators’ DBDM attitude was often reported as a hindering or promoting factor for DBDM, and this attitude is often related to “data culture.”
In Table 5, the number of schools per assigned data culture class is presented for each time point. Data culture class 1 (DC1) represents a weak data–oriented culture, whereas data culture class 5 (DC5) represents a strong data–oriented school culture. At T1, the majority of no–effect schools were assigned a low data culture class, while the strong–effect–schools were more often assigned as higher data culture classes. For all strong–effect schools, and six no–effect schools, a higher data culture class was assigned at the end of the intervention rather than at the beginning of the intervention. For the other four no–effect schools, data culture class remained the same before and after the intervention.
Collaboration
In the interviews with school leaders, in both strong–effect and in no–effect schools, “collaboration” was mentioned as a factor promoting DBDM implementation. Such collaboration included discussing student performances in upper, middle, and lower grades, and in parallel classes (including searching for explanations for high or low student outcomes), sharing experiences and best practices, and discussing instructional plans with each other. Furthermore, openness, trust, and reflection skills as perceived by school leaders were prerequisites for quality collaboration. School leaders reported that, as a result of the DBDM intervention, collaboration among their staff increased. However, schools also struggled with providing time for collaboration, for example, the trainer of school NE20 noted:
There proves to be more collaboration between teachers, especially after meeting 1.6. The younger teachers share their instructional plans with the rest of the team and help other teachers. Due to illness however, the school leader and the academic coach have not yet been able to accomplish teacher peer coaching in classrooms.
To quantitatively study collaboration, schools’ social networks were studied. The “achievement network,” the “goal–network,” and the “instructional strategies network” were examined based on the matched data set, meaning that only those respondents who were present at T1, T2, and T3 were included in the network analyses. The density (the concentration of relationships in a social network), reciprocity (the extent to which relationships in a network are reciprocal), and centralization (the degree to which a network is centralized around one or more popular actors) of these three network types were calculated for the three time points. This resulted in nine outcome variables per time point (density, reciprocity, and centralization at T1, T2, and T3). For two schools (one in the strong–effect group and one in the no–effect group), network measures were not available because such measures would be too severely influenced by the small number of respondents (fewer than five) in these schools. Additionally, for one school (NE19), no network measures were available at T2, so this school was also removed.
Findings showed strong variation between schools for the three network measures. At the start of the intervention, on average 15 percent of all possible relationships in the “achievement network” actually existed (density) in the strong–effect schools whereas the density was 20 percent in the no–effect schools. At the end of the intervention, density remained comparable in the no–effect schools (20 percent) and had, on average, slightly increased in strong–effect schools (19 percent).
No differences were found at the start of the intervention regarding the extent to which relationships in the achievement network were reciprocal. At the end of the intervention, a small average difference in favor of the strong–effect schools was found. In these schools, 62 percent of all relationships in the achievement–network were reciprocal versus 56 percent in the no–effect schools. Similarly, no clear differences were found for centralization, the degree to which a network was centralized around one or more “popular” actors.
Results for the achievement network were very similar to the findings for the goal network and the instructional strategies network with no significant differences between strong–effect and no–effect schools.
Two Additional Factors Mentioned by School Leaders and Trainers
In addition to the factors that were identified as influential to the implementation of DBDM in literature, school leaders and trainers also indicated two additional factors that they perceived as influential. These factors consisted of the presence of a supportive academic coach and pressure from the inspectorate of education.
The Academic Coach
In both no–effect (five of 10) and strong–effect schools (seven of 10), trainers felt DBDM implementation benefitted from a supportive academic coach. Such an academic coach was characterized by the trainers as a person knowledgeable regarding DBDM and dedicated to its implementation. Supportive academic coaches were also critical toward the intervention, making sure it would be consistent with the school's procedures. According to the trainers, such academic coaches were even greater driving forces of DBDM implementation than school leaders.
The trainers of five of 10 no–effect schools reported issues with the academic coach hindering DBDM implementation. In these schools academic coaches did not have enough time to fulfill their role, lacked the required knowledge and skills to support colleagues in the DBDM process. One school lacked an academic coach. In strong–effect schools, no problems with the academic coaches were reported.
Inspectorate
Three of 10 strong–effect schools had been reported as a “weak school” by the Dutch inspectorate of education. In these schools, the pressure from the inspectorate was mentioned as both hindering and promoting. On the one hand, this pressure increased motivation for improvement. On the other hand, the work pressure was high and overly stressful. None of the no–effect schools reported pressure from the inspectorate as promoting or hindering for DBDM implementation.
Discussion
The main purpose of this study was to explore why identical DBDM interventions led to improved student achievement in some schools, while not in other schools. Previous research (Van Geel et al, 2016) into the impact of the focus intervention has revealed that school–SES and schools’ intervention trajectories partly explain intervention effect differences. In the current study, we examined whether other factors influenced the differences in intervention effects between schools. Findings showed that factors we consider most relevant based on the DBDM literature (e.g., educators’ knowledge and skills, their attitudes toward DBDM, school leadership, data culture, and school internal collaboration) were also mentioned by our school leaders and trainers as important factors with regard to explaining intervention effects. The schools and project trainers mentioned two additional factors: the role of the academic coach and the pressure from the inspectorate of education. Some school leaders reported this pressure as motivational, whereas others indicated that it caused high pressure and stress for their staff members.
To answer our second research question (What differentiates schools that benefit from the DBDM intervention from those that do not benefit from the intervention?), survey data were examined. Three factors proved to be directly associated with strong intervention effects on student achievement growth: educators’ DBDM attitudes, a school's data culture, and teachers’ teaching quality.
Factors Explaining Differences between Strong–Effect and No–Effect Schools
This study confirmed our expectation that strong–effect schools, in comparison with no–effect schools, would be characterized by teachers with higher teaching quality, by staff who are more positive toward DBDM, and by a school culture that is more data oriented and achievement oriented. Findings from the exploration of the survey data showed that, prior to the intervention, schools already differed in terms of the quality of their teachers, their DBDM attitude, and data culture. At the start of the intervention educators’ attitudes toward DBDM were higher, the culture was more achievement oriented, and teachers on average were rated higher by their students on all teaching scales in strong–effect schools when compared to no–effect schools.
During the intervention, educators’ attitudes either remained stable or became a little less positive in both groups of schools. Moreover, although a more achievement oriented data culture developed during the course of the intervention in both groups, the initial difference between schools with regards to data culture still existed at the end of the intervention. A similar trend was found for teaching quality. Although teachers in the no–effect schools showed improvement on all teaching quality scales, except for clear instruction, they did not reach the starting levels of the teachers in the strong–effect schools.
These findings from the survey data were confirmed by the trainer reports. Trainers also reported stronger teaching quality behavior in strong–effect schools compared to no–effect schools. Moreover, they more often faced a negative attitude from staff members in no–effect schools. Data culture was not mentioned in trainer reports or school leader interviews, probably because educators infrequently use this theoretical construct.
Factors Not Explaining Differences between Both School Groups
Our expectations with regard to the impact of staff data literacy, school leadership, and collaboration on DBDM implementation, were not confirmed in this study. School leaders did mention improved knowledge and skills as a valuable result of the intervention. However, data literacy improved to the same extent in both groups of schools; therefore, it does not explain differences in intervention effects between schools. A possible explanation of the fact that educators’ data literacy considerably increased but did not explain differences between schools may be that data literacy is a necessary precondition rather than a sufficient precondition for successful DBDM implementation. Teachers may be perfectly capable of interpreting and analyzing data, but improved student outcomes are not likely to occur if they do not know how to change classroom practice based on the analyses.
Second, trainers reported the school leader to be important for the DBDM process within the school, however, trainers in both strong–effect schools and in no–effect schools reported stronger and weaker school leaders. Moreover, our findings from the teacher questionnaire did not confirm differences in school leadership classes between strong–effect and no–effect schools. In a previous study (Keuning & Van Geel, 2016), we found that a strong data culture and DBDM–oriented school leadership were positively associated. Seemingly, the impact of a school's data culture on DBDM–effects is stronger than that of school leadership, perhaps other staff (e.g., the academic coach) also contributed to the data culture.
Third, in the interviews, school leaders of both strong– and no–effect schools indicated that strong collaboration, characterized by discussing student achievement data, sharing experiences and best practices, promotes the DBDM–implementation process. However, schools’ social network measures varied from each other regardless of the school group and did not allow for clear conclusions on the explanatory power of the school internal collaboration factor.
Future Research and Recommendations for Practice
The design of this exploratory study has a number of limitations. First, 20 schools included were 10 schools with the strongest intervention effects and 10 with the weakest intervention effects of 101 schools participating in the intervention. By doing so, we focused on the outliers in the original sample. In particular, the comparison of the strong–effect schools with the Dutch national primary school population revealed that these schools were not representative, as these schools were more frequently located in (sub)urban areas, and low–SES schools were overrepresented. Thus, our selection procedure limits the generalizability of our findings. The sample was also quite small. This sample size was chosen to be able to conduct an in depth, exploratory study of those factors that differentiate between strong–effect schools and no–effect schools. We acknowledge that a large–scale follow–up study, with a larger and more representative sample is needed for more generalizable conclusions.
Moreover, schools were selected based on their “intervention–effect,” which was calculated by comparing student achievement growth during the two intervention years with student achievement growth during the 2 years before the intervention. It should be noted that the no–effect schools were not, by definition, low–achieving schools. Some of them were stable, high–achieving schools with stable performance during the DBDM intervention. In contrast, the majority of strong–effect schools were initially low–achieving schools and thus more growth was possible in these schools. It could be that no–effect schools already performed well and that it was more difficult for them to further improve their performance. In order to gain more insight into the effects of DBDM, future research aimed at examining differences between schools in which DBDM was implemented successfully versus unsuccessfully should use a DBDM–measure, rather than the product of DBDM for selecting the schools to be studied. For example, Van Geel, Teunis, and Visscher (2015) used trainers’ overall grade (ranging from 1 to 10), representing the degree to which DBDM had been embedded in a school. This way it was possible to rank schools.
Finally, the project trainers, all with their own professional opinion, conducted the interviews with the school leader. This may have led to bias in the interpretation of the interview data. By sending summaries to the schools as a member check, we addressed this problem. The first two authors supervised the intervention. They were not directly involved in working with the schools and did not conduct the interviews with the school leaders but they did decode the summaries of the trainers. It could be that researchers’ involvement in the project resulted in bias as prior knowledge about the intervention and the implementation process may have influenced their judgments. Therefore, in future research we would recommend using independent interviewers and independent decoders.
This article started by arguing that DBDM can be especially beneficial for students with learning difficulties since DBDM enables the early identification of students’ needs and consequently the early adaption of instructional strategies (Stecker et al., 2005). The DBDM intervention studied was aimed at implementing DBDM in the entire school organization; therefore, the focus of the analysis was at the school level. We recommend that follow–up research into factors influencing DBDM implementation incorporate not only the school level, but also the individual student level. It could be, for example, that students with learning difficulties benefit even more from a teacher with strong teaching skills than their classmates (see Espin et al., this issue).
As this study was aimed at “unpacking the package” of promoting and hindering DBDM factors, factors were assumed to separately influence DBDM–implementation. For each variable, a separate comparison was made between no–effect schools and strong–effect schools. However, as schools are complex organizations, in which variables often are intertwined with each other, it is plausible that the way in which various variables interplay with each other causes differences in DBDM–implementation. It also may be that some factors compensate for others; for example, a school leader who is not very achievement oriented may not be a problem in a school in which the academic coach is the driving force for DBDM. Therefore, in future studies the investigation of clusters of variables by means of cluster analysis is recommended.
Based on our survey findings, we argue that the success of DBDM implementation is very dependent on the quality of the last component of the DBDM cycle. This entails that teachers are required to be able to differentiate their instruction in accordance with variation in student progress and student needs (Visscher, 2015). Providing differentiated instruction is something many teachers experience difficulty with. According to the Dutch inspectorate of Education, teachers in about half of all Dutch elementary schools do not differentiate instruction well enough to meet the needs of all students (Inspectie van het Onderwijs, 2014).
Our survey data did not provide information about teachers’ abilities to set SMART and challenging goals (the second DBDM component) or their ability to determine strategies for goal accomplishment (the third DBDM component). In future studies, information about these two components should also be collected. We expect that the third component is especially important for the execution of DBDM in the classroom. Improved student outcomes are likely when teachers are able to deliberately select the strategy that meets students’ needs.
Currently DBDM initiatives are often focused on skills that teachers need to master outside the classroom, such as the knowledge and skills for analyzing data (Mandinach, 2012; Marsh, 2012). The assumption is that, as a result of developing these skills outside the classroom, changes in teachers’ classroom behavior will follow (Desimone, 2009). Our study clearly shows the importance of teaching skills for DBDM. Therefore, when developing DBDM school reform, we recommend that sufficient attention is paid to improving these teaching skills within the classroom.
Footnotes
1
School names are pseudonyms.