
Abstract
For infectious diseases like tuberculosis and HIV, treatment adherence plays an important role in treatment effectiveness and epidemic control. Studies of some infectious diseases indicate that patients who live closer to their health facilities maintain higher adherence; however, most models ignore the heterogeneity of patients' adherence. Clinics must balance knowledge about adherence with epidemic growth when creating successful treatment programs. We develop an optimization model that integrates a clinic's capacity decisions with population health outcomes. We find that incorporating adherence into clinic planning models can lead to decisions that significantly improve outcomes. For example, in a realistic case study of the HIV epidemic in Zambia, we find that decision makers who ignore decreasing adherence make suboptimal decisions and overestimate the effectiveness of their treatment programs by as much as 94%. Our model is a first step toward understanding the relationship between adherence and health delivery.
Keywords
Background and Motivation
Complex treatment regimens have been developed for people living with HIV, tuberculosis (TB), and other infectious diseases. However, in order for the benefits of treatment to be realized, patients must be adherent to their regimens. Studies of HIV have demonstrated that high levels of treatment adherence correspond to virologic suppression (Paterson et al. 2000), higher survival rates (de Olalla et al. 2002), slowed progression to AIDS (Bangsberg et al. 2001), and higher quality of life (Mannheimer et al. 2005). Patients who complete treatment for latent TB infection can reduce progression into TB disease by 90% (HHS and CDC 2005). Adherence is so essential for TB treatment that directly observed therapy is a key component of the World Health Organization's Global Plan to Stop TB (WHO 2011a). Similarly, researchers have observed that hepatitis C patients who follow the 80/80/80 rule by taking 80% of each of two treatment drugs 80% of the time have better health outcomes (McHutchison et al. 2002). Treatment benefits both the individual and the community through diminished likelihood of drug resistance and reduced transmission (e.g., TB [WHO 2011b] and HIV [Gupta et al. 2012]). This latter consequence is particularly important for designing effective treatment programs; if resources are used to treat people who are adherent, then societal benefits—such as reduced disease transmission—are maximized.
While adherence is a critical tool in the fight against infectious diseases, numerous barriers to adherence are introduced by the health delivery supply chain. For example, in resource‐limited regions, the procurement and distribution of medicines and vaccines is often inefficient and inadequate (Kraiselburd and Yadav 2013). In addition, physical access to treatment facilities is a major challenge (Howe and Richards 1984, Porter 2002, Tuller et al. 2009). Studies of TB, HIV, and diarrhea indicate that patients who live closer to their health facilities maintain higher adherence (Jaiswal et al. 2003, Mishra et al. 2005, Munro et al. 2007, Rahaman et al. 1982, Shargie and Lindtjørn 2007, Taiwo et al. 2010, van der Werf et al. 1990). While clinicians cannot predict a patient's adherence a priori (Paterson et al. 2000), these studies and others have found that long residence‐to‐clinic distances are correlated with poor adherence.
Even though the health delivery supply chain itself can impede adherence, many researchers either ignore the impact of adherence or assume that adherence is constant for all patients when modeling the effects of treatment programs on the spread of disease in a community. One exception is a facility location model developed by Carr and Jallah (2008), in which the authors propose new HIV treatment clinics in a region to maximize adherence; they model patient adherence as a decreasing linear function of the patient's residence‐to‐clinic distance.
Understanding the impact that treatment has on the growth of an epidemic is important in quantifying treatment effectiveness. To that end, many researchers have modeled disease spread as well as the ability of different interventions to mitigate that spread. For example, ReVelle et al. (1969) developed models to determine optimal disease controls for TB. Meredith (1977) and Lemaire (1979) identified useful measures such as genetic counseling and the eradication of malaria in their models of sickle cell anemia. Larson (2007) used models of an influenza pandemic to quantify the efficacy of interventions such as social distancing. Zaric et al. (2000) found that expanding methadone programs was cost‐effective in reducing HIV incidence. Long et al. (2008) developed a co‐epidemic model to understand the interactions between TB and HIV epidemics.
Researchers have also used models to improve funding allocation in health care settings. Recognizing the budgetary constraints that public health officials face, Duintjer Tebbens and Thompson (2009) tested various vaccination policies using a dynamic transmission model to identify cost‐effective approaches. Behrens et al. (2000) modeled the trade‐offs between funding prevention and treatment programs for cocaine users. Spiliotopoulou et al. (2011) compared the supply costs of carrying a larger variety of drugs with the health costs of carrying a smaller variety of drugs (e.g., resistant strains of disease) to calculate the socially optimal drug assortment for malaria. Zaric and Brandeau (2001) studied the optimal portfolio of HIV prevention programs.
We build on these streams of literature by combining a capacity decision model with a simple model of disease transmission and population evolution in order to understand the consequences of providing funding and treatment capacity “now” versus “later.” In particular, due to our interest in the health delivery supply chain, we emphasize the link between residence‐to‐clinic distances and treatment adherence and model this link endogenously to a clinic's capacity decision. Because low‐income regions do not have the resources to enroll all eligible patients in treatment programs, policy makers must make informed decisions in order to use scarce funds wisely. Our model can provide more realistic support for decision makers by including adherence endogenously. To our knowledge, our model is the first to consider the role that adherence plays in the determination of the best funding strategies to reduce disease incidence in patient communities. In the following section, we explain our modeling assumptions. We present our general model in section 3 and results for specific scenarios in sections 4 and 5. Numerical analysis provides additional insights in section 6. All proofs are given in Appendix C
Model Assumptions
We consider the capacity decisions of a single clinic that has a total budget B to allocate over T periods. Because budgets for health programs are reliant on funding and political cycles, and because available treatments and related costs may be changing rapidly, our model is intended for horizons on the order of 2–5 years. The decision in each period t is the number of new patients to enroll in that period,

We assume that when the clinic decides to treat a patient, it creates a treatment spot for that patient by setting aside enough of the budget to treat the patient for all remaining periods. That is, a treatment spot created in period 2 of a five‐period problem costs four units of the budget, whereas a treatment spot created in period 5 of the same five‐period problem only costs one unit of the budget. Further, we define a discount rate of ρ (ρ ≥ 0) to represent the monetary or political benefit of delaying expenditure (e.g., pushing future costs to the next administration).
The changes in the size of the infected population from period to period are affected by the epidemic growth, population adherence, and the number of patients enrolled previously.
Epidemic Growth Rate
In each period, an infected patient may transmit infection to susceptible individuals in the population. We define the epidemic growth rate γ > 0 as the average number of new infections caused by a single infected person during one period. Hence, the number of new infections only depends on the number of infected individuals in the population; implicitly, we assume that there are many susceptible individuals in the community. This is a good first‐order approximation of the differential equations typically used to model epidemics (Hethcote 2000, Keeling and Rohani 2008). Our epidemic growth rate is similar to the basic reproductive rate

The epidemic growth rate depends on several disease and population factors, such as the probability of transmission per contact, the average number of contacts during a period, the average amount of time that an infected person is infectious, the type and level of mixing within the population, etc. Treatment for some diseases drastically reduces patient infectivity. For example, researchers have found that HIV patients who are adherent to antiretroviral therapy (ART) transmit infection at 10%–20% of their original transmission rates (Castilla et al. 2005, Quinn et al. 2000, Wawer et al. 1999). New regimens may be even more effective; patients who were on ART in a more recent trial reduced their risk of transmitting infection to their partners by 96.3% (Cohen et al. 2011). Based on this evidence, we assume that patients who are adherent to their treatment are not infectious. For diseases where infectivity remains a challenge, we could incorporate infectivity reduction by including a multiplier in our adherence function; such an inclusion does not change our results.
Adherence
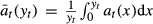
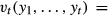
We define


To capture the diminishing adherence of subsequently enrolled patients, we assume that the adherence function is nonincreasing in the number of patients treated:


Population Dynamics
We model the size of the treatment‐eligible infected population as a function of the treatment capacity decision, epidemic growth rate, population adherence, and a stochastic term that incorporates random fluctuations in the population due to migration, death, etc. By “treatment‐eligible,” we simply mean the subset of the infected population that meets the criteria for treatment. For some diseases, all infected people are eligible for treatment, but for other diseases a patient must meet additional criteria before being considered eligible for treatment. For example, HIV patients' CD4 count decreases as their disease progresses, and WHO guidelines specify that only patients with a CD4 count below a certain threshold are eligible for treatment (WHO 2011b). That is, for HIV, many newly infected patients may not be immediately eligible for enrollment in treatment programs. Hence, the stochastic term also captures the net changes in the infected population size due to patients becoming sick enough to be eligible for treatment. We model a case where the budget is limited and hence insufficient to meet all demand for treatment. We use a formulation with additive uncertainty, where the size of the infected population in period t is split into deterministic and stochastic components. Additive uncertainty has been widely used in several fields; (see, e.g., Karlin and Carr 1962, Talluri and van Ryzin 2005).
Let


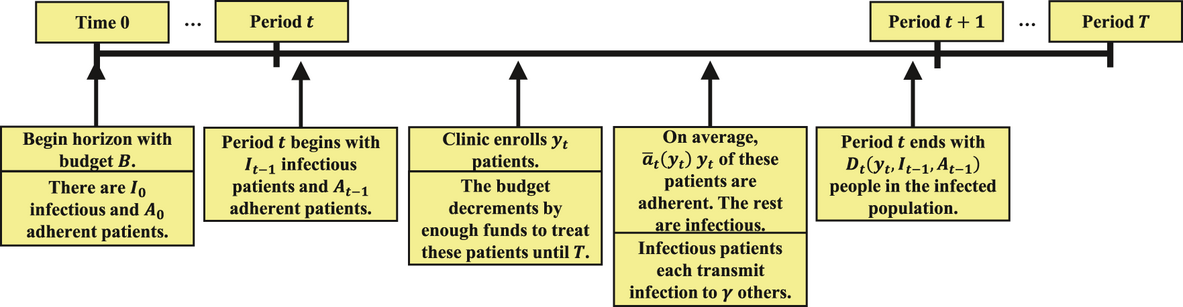
Event Sequence Showing Clinic's Decision Point and Illustrating Disease Model
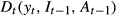
Each infected subpopulation evolves recursively as a function of


We model the stochastic changes in the size of the infected population with


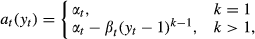
While numerous researchers have observed correlation between residence‐to‐clinic distance and adherence, the explicit relationship between the two varies based on the local population density, roads, and access to transportation. We introduce the following adherence function to capture constant (k = 1) and decreasing (k > 1) adherence:


We now mention a few technical conditions that must hold for our model and its results to be applicable. We note that the size of the total infected population is increasing in the sum of the two subsets of the infected population


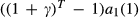
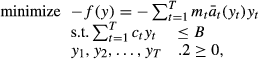
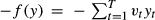
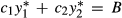
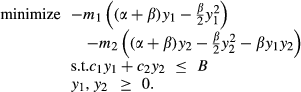
Suppose that the clinic seeks to minimize the expected size of the infected population over the next few years (until period T). We can formulate its funding decision problem as
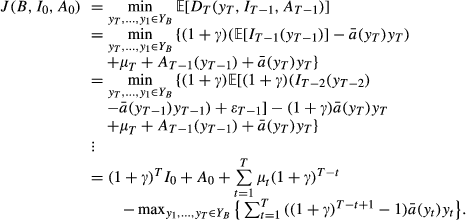
We have defined the set of feasible y as


The final term in Equation 2 is the impact that the clinic has on the size of the infected population through averted infections. To calculate the number of infections averted in period t, suppose that period 1 begins with a single infectious person in the susceptible population. Without treatment, that person will go on to infect γ others by the end of the period. At the end of period T, there will be


We note that when ρ = 0, these simplify to the total number of infections averted (
For any k ≥ 1, (P) is a convex program with continuously differentiable objective and constraint functions. Therefore, the Karush–Kuhn–Tucker (KKT) conditions are both necessary and sufficient (for more details, see Boyd and Vandenberghe 2004). For k = 1,2, the problem is analytically tractable. However, it is difficult to solve (P) for general k, and solutions for k > 2 contain complicated ratios and intervals that provide no apparent intuition. These two cases of the general adherence function in Equation 1 seem plausible in practice, especially given that available data on adherence are rather coarse; for example, Taiwo et al. (2010) were only able to show that patients who lived within 20 km of a clinic had higher adherence than patients who lived more than 100 km from a clinic. Thus, a clinic with very little data about its patients' adherence might assume that adherence is constant among patients in its catchment area. A better approach reflects the possibility that adherence decreases as more people are treated (i.e., that adherence is endogenous to the decision process), due to increasing residence‐to‐clinic distances and other barriers. Linearly declining demands for service have been assumed in facility location models, including models of clinic attendance (Carr and Jallah 2008, Holmes et al. 1972, ReVelle 1986). Since clinic attendance is a necessary precursor to adherence, a linear model seems reasonable here. We now provide results for constant (k = 1) and linearly decreasing (k = 2) adherence functions.
If policy makers consider adherence at all, they commonly assume a fixed population adherence estimate that is unrelated to local policies or decisions (k = 1); the majority of the studies referenced in this article provide only a point estimate of adherence for an entire population of patients. In this section, we discuss the implications of assuming

Let


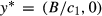
To minimize the size of the infected population at the end of T periods using (P) with k = 1, the clinic should allocate its entire budget to enrolling patients in period t if and only if Solution to (P) for k = 1 and T Periods.


(P) is a straightforward knapsack problem, where the scarce resource of the clinic's budget is allocated across periods in a planning horizon in the most efficient way possible. The form of its solution, in which all resources are allocated to the period with the lowest cost–value ratio, is well known. If


The nuance here regards when during the horizon the solution occurs. If it is less expensive to avert infections in one period versus another, then intuitively the solution is to create treatment spots in the less expensive period. Proposition 1 demonstrates that the most cost‐effective period is the first period of the planning horizon. Allocating the entire budget to the first period corresponds to treating

Due to the heterogeneity of patient characteristics and behaviors, constant adherence is arguably not the most accurate adherence function to apply to a real patient population. In the next section, we present results for a decreasing adherence function.
Decreasing Population Adherence Using a Linear Model: k = 2
Suppose instead that adherence decreases linearly as more people enter treatment (k = 2), where

By allowing α and β to vary from period to period, our model can capture changes in population adherence from the first period to the second period. However, at the beginning of the planning horizon, it may be challenging to estimate adherence parameters for both periods. We identify two cases of population evolution that simplify the parameter estimation. First, we assume that the periods are long enough to allow significant mixing of newly infected people due to the random effects of infection, diagnosis and treatment eligibility, and patient relocation. We assume that the newly eligible population is dispersed in such a way that it contains patients with a spectrum of adherence behaviors, including some who are likely to be adherent. In such a dynamic case, the adherence function may be different in each period to capture changes in adherence behavior over time. One possible scenario is


Alternatively, we also consider the case where adherence depends on the cumulative number of patients that have been enrolled over the entire multi‐year horizon (“aggregate” adherence). In this case, we assume that there is no change in the population evolution of eligible patients over time, despite any random effects of disease spread or population movement. Thus the adherence of patients in period 2 is a function of the total number of patients treated in periods 1 and 2 (


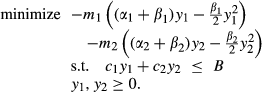
These two cases provide bounds on population evolution in period 2 after treating a group of patients in the population in period 1. Note that the adherence of the patient population in the first period does not depend on the population evolution assumption used. In the second period, the adherence function is


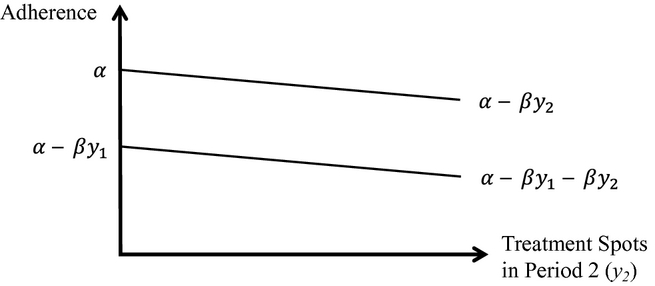
Linear Adherence: Period Adherence (Upper Line) and Aggregate Adherence (Lower Line) for Period 2
We begin by examining the case where population dynamics within a planning period bring a new set of eligible, adherent patients into the catchment area each period. That is, the first person enrolled in every period has adherence α, the second person enrolled has adherence α − β, and so on.
Each successive patient enrolled in treatment is less adherent than previous patients, so fewer infections are averted per patient as more patients are enrolled (thus increasing the cost of averting new infections). Because population adherence is endogenous to the decision‐making process, the value of enrolling eligible infected patients is now a function of the size of the treatment program, and so we re‐define


A restrictive budget implies that we will exhaust treatment resources during the horizon. Thus, in the results that follow, we use the relationship
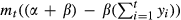
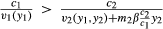
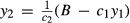
To minimize the size of the infected population at the end of two periods using allocate the entire budget to the first period if allocate the entire budget to the second period if otherwise, split the budget between the periods. There exists a unique Solution to


Just as in Proposition 1, the clinic allocates its funds to minimize the cost per infection averted. When modeling adherence as a decreasing linear function of the patients enrolled, in some cases the cost per infection averted is always lower in the first period for all feasible allocations. For example, in Figure 3a, we see that the solid line representing the cost per infection averted in the first period is less than the dashed line representing the cost per infection averted in the second period over the range of feasible

On the other hand, in some cases there is an allocation that achieves the same cost per infection averted in both periods. In Figure 3b, the lines representing the cost–value ratios in the first and second periods intersect over the range of feasible

Under period adherence, if No Value in Waiting.

Even when it is not optimal to defer all expenditure, it may still be optimal to hold some funds until the second period (as prescribed by Case (iii)). This is a direct result of period adherence: when enrolling patients in the first period, the clinic may find that more infections will be averted in total if it withholds some of the budget to start new patients on treatment in the second period because the first patients enrolled in the second period will be more adherent than the last few patients who would have been enrolled in the first period. Infected patients who are newly eligible for treatment in the second period may live closer to the clinic (and hence be predisposed to have higher adherence) than the patients living far from the clinic during the first period. This balance between treating less adherent patients now versus allocating funds to treat more adherent patients in the future is captured by the cost–value ratios in Proposition 2.
Given the relevant planning periods (years), our model with period adherence captures the cases where eligible‐patient adherence in subsequent periods is the same as in the first period. For short planning periods, this assumption may overestimate the movement of infected or newly eligible individuals. In the next section, we present results for a more pessimistic population evolution assumption.
Aggregate Adherence
If instead there are no new eligible, adherent patients in each period and adherence depends only on the cumulative number of patients enrolled, the first patient treated in period 2 is as adherent as patient


As above, we consider a two‐period problem and reformulate

The value of enrolling the


To minimize the size of the infected population at the end of two periods using allocate the entire budget to the first period if allocate the entire budget to the second period if otherwise, split the budget between the periods. There exists a unique


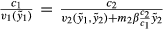


The ratio


Illustrating the Two Cases of Proposition 2 That Are Feasible When the Costs and Benefits Are as Defined in Equation 4, Assuming Period Adherence (See Corollary 1)
Under aggregate adherence, if

This result contrasts directly with Corollary 1. In that case, it was still beneficial to withhold some of the initial budget to enroll patients in the second period, because the first patients enrolled in treatment in the second period were more adherent than the patients that would have been treated with the same funds in the first period. Here, the first patients treated in the second period are exactly as adherent as those that would have been treated with remaining funds in the first period, so there is no longer any incentive to wait, and hence the clinic should not defer any expenditure.
Intuitively, decreasing adherence more realistically represents the adherence of a patient population. Next, we quantify how much a clinic misestimates its impact by assuming constant adherence when in fact adherence decreases linearly as more people are treated.
Value of Decreasing Adherence
As we saw in section 4, a clinic that ignores adherence or uses only a point estimate of adherence may likely allocate its entire budget to the first period, enrolling as many patients as possible while guaranteeing that those patients will be treated for the remainder of the planning horizon. Our results from this section indicate that such a heuristic strategy can fail in many situations. Furthermore, a clinic that also overestimates the adherence of its patients may misestimate the impact of its treatment program (Figure 4). Overestimating adherence parameters will make investment in the treatment program seem far better than it is, creating disappointment in end results. The inflation of program efficacy could lead decision makers to allocate more funding to the treatment program at the expense of other health priorities.
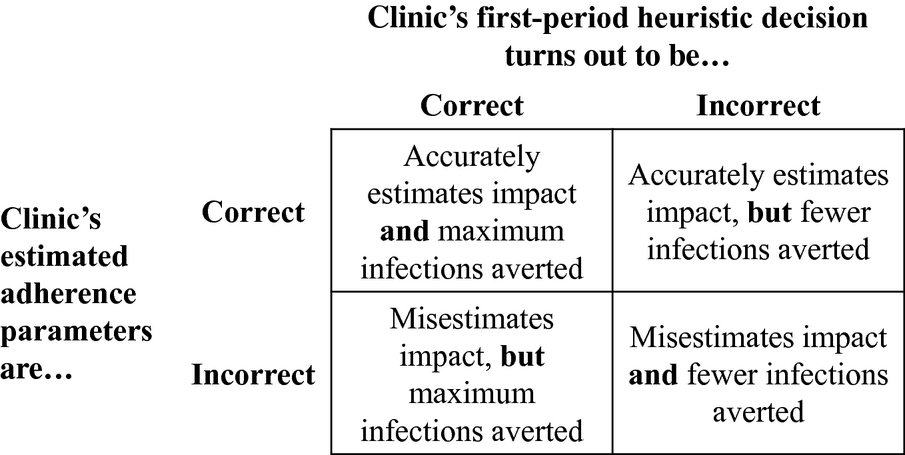
Possible Scenarios when the Clinic's Heuristic Decision and/or Estimated Adherence Parameters May Be Incorrect
A clinic that correctly estimates the adherence of its patients but makes an incorrect funding decision will achieve less benefit due to the gap in optimality (the upper right box in Figure 4). A clinic that instead mistakenly assumes incorrect adherence parameters will misestimate the impact of its treatment program if its heuristic treatment approach is correct. If the clinic's decision is incorrect, it will achieve less benefit and may misestimate its impact. If benefit is measured as infections averted, the clinic will avert fewer infections and may misestimate the number of infections averted.
We now quantify the importance of incorporating decreasing adherence into a funding strategy. Suppose that the clinic follows the heuristic approach


If the clinic believes that adherence in the patient population is a constant


Results are similar under aggregate adherence.
The severity of the overestimation depends on the adherence parameters as well as the initial budget; the percent error is increasing in both β and the initial budget B and is decreasing in α for all cases. For example, consider Figure 5, which is constructed using data relevant to areas such as rural Zambia (for more details on this data and case study, see section 6). In Figure 5a, the hypothetical Zambian clinic correctly estimates baseline adherence (


Percent Error as a Function of β
Suppose that baseline adherence is α = 0.90 (dashed lines in Figure 5), as is typical in resource‐limited regions (Table 1), and that β = 0.0035. If the clinic assumes that the treatment population is perfectly adherent, then it will overestimate the number of infections that its treatment program averts by 34.5%. Even if the clinic correctly estimates baseline adherence, it will still overestimate its impact by 21.1%: the baseline adherence parameter alone cannot capture the linear effects observed in the population. These results indicate that treatment programs in areas such as rural Zambia may have inflated success rates if adherence is not taken into account by planners.
Parameter Settings for Sensitivity Analysis
The Initial Budget B was Held at 175.
The results are more pronounced when the underlying baseline adherence is α = 0.70 (solid lines in Figure 5), as is typical in developed regions. These examples demonstrate that overestimation is problematic when decreasing linear adherence is approximated with a constant; for adherence functions with even steeper descent (e.g., Equation 1 with k > 2), the overestimation would be even more severe.
In the next section, we provide numerical results that reinforce the importance of modeling adherence as endogenous to treatment program planning.
In this section, we present a numerical study with parameters based on a real epidemic to quantify the impact of the adherence function on a clinic's optimal decision and the resulting population outcome over a 2‐year period. Through this sensitivity analysis, we are able to identify circumstances under which a clinic should defer expenditure to the second year.
We motivate our parameter settings with an example from the HIV epidemic of rural Zambia. As of 2009, 860,000 adult Zambians (aged 15–49) were infected with HIV and 385,000 of those patients were eligible for HIV treatment (UNAIDS 2010). An estimated 59,000 new HIV infections occurred among adults in Zambia in 2009, corresponding to roughly 0.07 new infections caused by each infected adult. We assume that these proportions hold across Zambia.
Two‐thirds of Zambians live in rural areas (Central Statistical Office of Zambia 2011), where primary care is available at rural health centers. For example, consider Katapazi Rural Health Center (RHC) in the Southern Province of Zambia. 8 It lies about an hour from the nearest paved road and is difficult to reach during the rainy season. The catchment area for Katapazi RHC includes 7000 people over a 50‐km radius from the clinic. We use the above data to estimate that, of those 7000 people, 440 are adults infected with HIV, of which almost half are eligible for treatment. For simplicity we assume that these eligible adults reside throughout the catchment area, so that each lives a different distance from the clinic and correspondingly will have different adherence. We solve for the optimal 2‐year treatment program with initial budget B = 175.
Since detailed data on some model parameters are not available, we use these data from Zambia as a starting point and propose reasonable ranges based on evidence from a collection of studies (Table 1). We note that the HIV epidemic in sub‐Saharan Africa predominantly affects the heterosexual population, so data on that population are most relevant to our model here. For example, Gray et al. (2001) provided estimates for the probability of HIV transmission per coital act in monogamous heterosexual couples in Uganda. We use these data in combination with their data on the average number of sex acts per month in a binomial model to compute the annual rate of transmission for each age group considered. Our resulting estimations of γ range from 0.0635 for the 30‐ to 34‐year‐old age group to 0.1675 for the 25‐ to 29‐year‐old age group. Long et al. (2009) estimated the annual probability of transmission between heterosexual partners to be between 0.02 and 0.10; these probabilities correspond to annual rates between 0.02 and 0.11. Given these studies, we feel comfortable testing the range 0.01–0.17 for our analysis on γ.
We now consider the adherence parameters. Despite the challenges facing HIV patients, treatment adherence can be achieved in resource‐limited countries. For example, Mills et al. (2006) conducted a meta‐analysis of ART adherence studies in sub‐Saharan Africa and calculated a mean adherence rate of 77% across the aggregated studies, with a 95% confidence interval of 68%–85%. A number of other studies have observed adherence rates in sub‐Saharan Africa in excess of 90% (Byakika‐Tusiime et al. 2009, Orrell et al. 2003, Oyugi et al. 2004). However, Ware et al. (2006) caution that adherence rates may decline over time, as they have done in developed nations where adherence rates to ART are around 70% (Golin et al. 2002). Other longitudinal studies have noted decreasing adherence rates over time (Lima et al. 2009, Mannheimer et al. 2002, Oyugi et al. 2007). One of those studies, by Oyugi et al. (2007), calculated adherence rates ranging from 82% to 95%. These values are likely applicable to the epidemic in Zambia, so for our numerical study, we range α from 0.70 to 1.
The determination of β is more nuanced. Rahaman et al. (1982) provided a graph of how adherence rates declined as a function of residence‐to‐clinic distance in their study in rural Bangladesh. When estimating α and β from their work using a Taylor approximation, we arrive at α = 0.61 and β = 0.0037. Reasonable values for β may be quite small; we note that because a(y) must remain between 0 and 1, β must be small relative to α. We test β on the range [0.003,0.004].
Finally, we range the interest rate ρ from 0.01 to 0.05 since it is commonly valued at 0.03 in cost‐effectiveness and other health literature (Gold et al. 1996). We define 


As expected, for these parameters, the optimal solution under constant adherence is to allocate the entire budget to the first period in all scenarios (Table 2). However, the optimal solution under linearly decreasing period adherence for all cases is to split the budget between the two periods (per Proposition 2). Intuitively, a clinic would only reserve some of the budget for the second period if newly arrived patients will be more adherent than the marginal patients in the first period. The fact that newly eligible patients in the second period can achieve high adherence (because they represent a spectrum of adherence behaviors) is sufficient to reserve some funds until that period. Across the cases tested, the mean [minimum, maximum] percent of total spots that were created in the first period is 53.4 [50.2, 60.2]. The balance of treatment spots between periods is roughly 50–50, with slight preference given to the first period due to the time value of earlier action. For example, for the base case of α = 0.90, β = 0.0035, γ = 0.07, and ρ = 0.03, the optimal solution is to create 63.5 (52.8% of the total) treatment spots in the first period and 56.8 (47.2% of the total) treatment spots in the second period. The resulting adherence of patients enrolled is 0.90 for the first patient and roughly 0.70 for the last patient in both periods.
Case Mix for Numerical Study
Case Mix for Numerical Study
Case (i) indicates that the entire budget is allocated to the first period, and Case (iii) that the budget is split between the two periods in the optimal solution. Recall that for benefits and costs defined as in (3), Case (ii) does not occur.
Finally, we observe that solutions again shift to the first period when adherence is aggregate, since there is no longer an adherence incentive to delay funding until the second period.
Next, we quantify the errors explained in Figure 4. If adherence is constant or linearly decreasing and aggregate, the heuristic decision of allocating the entire budget to the first period is the optimal solution. On the other hand, when adherence is linearly decreasing and per‐period, the heuristic solution is suboptimal. From our analysis, we find that the optimal solution results in the greatest improvement over the heuristic solution when the budget is large relative to small adherence parameters α and β such that the heuristic decision of allocating the entire budget to the first period results in enrolling patients with low adherence. That is, when α ≈ βB, the last few patients enrolled in the first period under the heuristic solution have low adherence (see Equation 1) and so it is advantageous for the clinic to reserve some funds for the second period instead of enrolling those patients. In such scenarios with a decreasing adherence function, we see that it is important to model adherence endogenously.
For example, when we isolate the 85 cases of the numerical study where α = 0.70 and β = 0.004, the mean [minimum, maximum] percent error of pursuing the suboptimal heuristic decision is 9.2 [7.8, 10.5]. That is, applying the heuristic decision in these cases would lead to roughly 9% fewer infections averted than the optimal solution. For the general numerical study, the mean [minimum, maximum] percent error of the heuristic decision is 5.9 [2.6, 10.5]. Hence, splitting the budget does not provide large gains when the budget is small relative to the number of patients who would be reasonably adherent. Further, due to our simplified disease transmission assumptions, our model overestimates the growth of the epidemic, and so our analysis here is a conservative estimate of when expenditure should be deferred. A more detailed model of disease transmission would result in slower epidemic growth and thus less of an emphasis on allocating the entire budget to the first period.
A clinic that believes adherence is constant or even perfect when such is not the case will overestimate the number of infections that its treatment program averts (Proposition 4). In Table 3, we present the magnitude of this overestimation when adherence is constant (α < 1) and when adherence is linearly decreasing. We note that when either period receives an allocation of 0, the objective functions for period adherence and aggregate adherence are identical. When the clinic assumes that adherence is constant, it will allocate the entire budget to the first period; hence, when calculating the clinic's overestimation, the population evolution assumption does not matter. If the clinic assumes that adherence is constant (α < 1) when in fact adherence is linearly decreasing, the clinic overestimates its impact by as much as 35.7%.
Percent Overestimation
Note. Mean [Minimum, Maximum] Percent Overestimation if adherence is Assumed to be Constant (α < 1) or is Ignored (α = 1) when Actual Adherence is Either Constant (α < 1) or Linearly Decreasing and Per‐Period or Aggregate.
Further, if the clinic ignores nonadherence entirely by assuming that all patients enrolled are perfectly adherent (the final column in Table 3), then it overestimates the number of infections averted by a large amount depending on the underlying adherence (e.g., up to 93.9% if adherence is linearly decreasing).
Finally, we performed univariate sensitivity analyses on α, β, γ, and ρ to quantify their individual impact on the number of infections averted in two periods and on the optimal solution with an initial budget of B = 175, assuming linearly decreasing period adherence (Figure 6). The number of infections averted increases as baseline adherence parameter α increases (Figure 6a), since more patients on average experience decreased infectivity due to their treatment. Similarly, the number of infections averted decreases slightly as adherence parameter β increases, because an increase in β represents a decrease in adherence (Figure 6b). The objective is most sensitive to variations in the epidemic growth rate γ. As γ increases from 0.01 to 0.17 new infections caused by each infectious person in 1 year, the expected number of infections averted by implementing the optimal strategy increases from 1.4 to 25.1 (Figure 6c). Varying the interest rate ρ has very little impact on the number of infections averted (Figure 6d). The results are very similar when aggregate adherence is assumed.
All scenarios in the sensitivity analyses are instances of Case (iii); that is, the optimal solution is to split the budget between the two periods. Figures 6e through 6h illustrate how the optimal allocation 


Sensitivity Analyses for the Numerical Study Described in Table 1, Assuming Period Adherence
We conclude that our model is robust to deviations in β and ρ, that adherence parameter α has a modest impact on the resulting number of infections averted, and that our model is most sensitive to variations in γ. The optimal solution is also robust to these changes, and roughly corresponds to creating the same number of treatment spots in both periods in all scenarios tested when adherence is per‐period. When adherence is aggregate, allocating all of the budget to the first period is optimal for all scenarios tested.
Treatment adherence plays an important role in disease management, particularly for chronic illnesses requiring life‐long treatment. For an infectious disease like TB or HIV, adherence is especially critical in both treatment effectiveness and epidemic growth. Policy makers in resource‐limited regions are faced with difficult trade‐offs. Adherence barriers—including those posed by the health delivery supply chain—must be addressed to maximize the effectiveness of any treatment intervention. The combination of declining adherence and increasing treatment enrollment for diseases such as HIV (Ware et al. 2006) further emphasizes the need for modelers and policy makers to incorporate adherence when planning.
We have developed a model that integrates a clinic's capacity decisions with the health outcomes in its patient population. In particular, we use adherence to estimate the impact of treatment decisions on disease incidence in a population. We examine two cases of a simple adherence function that are important in practice due to the coarseness of available data: a constant adherence function and a decreasing adherence function. We chose a linear model to capture decreasing adherence, as that is the most defensible option given prior findings and available data.
We use our model to identify conditions under which a clinic should defer expenditure to future periods and to inform how funding should be allocated over time. Clinics must balance knowledge about population adherence with epidemic growth when creating successful treatment programs. We find that clinics should allocate their budgets across periods to achieve the lowest cost per infection averted. We also find that clinics that ignore or overestimate the adherence of their patient populations will overestimate the effectiveness of their treatment programs even if their funding decisions are optimal. In many realistic scenarios, the overestimation is quite large. By considering adherence, clinics can more rigorously determine if, when, and how much to defer expenditure to future periods.
With our numerical analysis we are able to identify circumstances under which a clinic should defer some expenditure to later periods. In particular, when the budget and adherence parameters are such that the heuristic solution would entail enrolling patients with low adherence, clinics would be better off deviating from the heuristic decision and instead implementing the optimal solution from our decreasing model. For example, in a rural area where patients are sparsely populated in the clinic's catchment area (i.e., where β is relatively large), a clinic with a large budget (i.e., B ≈ α/β) should defer some expenditure to later periods. A clinic with a smaller budget (i.e., B << α/β) will not see large gains from modeling decreasing adherence because the few patients enrolled have reasonably high adherence. To apply our model, a clinic should estimate the adherence of the most adherent patient in its patient population (α) and then consider the residence‐to‐clinic distances of its patient population to determine β. For example, a clinic can judge the adherence of its closest patient (a(1)) and of its farthest patient (


This model is a first step toward understanding the impact of adherence on health delivery within resource‐limited countries. We note that whenever capacity decisions are made in a health context, policy makers should take care to consider the ethical implications of their decisions. Our model provides support for planners in determining capacity, in much the same way that hospitals choose the number of beds to house or insurance providers select which treatments to cover. Clinics can use the results here to gain a better understanding of the trade‐offs between epidemic growth and patient adherence and to help determine when to increase their service radius to target additional patients.
Future extensions of our work here could incorporate more detailed epidemic models, multiple clinics, or different measures of the benefits of creating treatment spots. For example, a more granular disease model that tracks various segments of the patient population could account for the differences in adherence behavior between patients enrolled in each period, as an extension of our work here comparing per‐period and aggregate adherence. Further, as more detailed knowledge and data become available regarding adherence patterns in general or for specific epidemics, more sophisticated adherence models can be developed. Health delivery supply chains impact patients' ability to be adherent through more than just the capacity management at the local clinic. The reliability of the supply chain and drug inventory policies drive the availability of treatment and potentially lead to stockouts (Oyugi et al. 2007, Reilley et al. 2002). In addition, the service capacity of the system of care plays a significant role in adherence. For example, long waiting times in clinics adversely affect adherence (Hardon et al. 2006). While the relationship between a functioning health delivery supply chain and program success has been noted qualitatively (Harries et al. 2001, Schneider et al. 2006), future research could quantitatively model the relationship to justify the importance of an efficient supply chain in reducing disease incidence in resource‐limited regions. In particular, models that can demonstrate the impact of a better health delivery supply chain on disease incidence would facilitate more informed decisions by policy makers to stem the expansion of global epidemics.
Footnotes
Lifetime Costs and Benefits
Varying Epidemic Growth Rates
Proofs
Acknowledgments
The authors thank Eran Bendavid, Margaret L. Brandeau, Lauren Cipriano, Eva Enns, Elisa Long, students of the health policy research seminar at Stanford University, and anonymous referees for their insightful feedback on this paper.
1
We note that we are interested in the clinic's ability to reduce morbidity, not mortality, as some infectious diseases do not have a large direct impact on mortality. Further, the treatment of infectious diseases such as HIV has a substantial effect on quality of life and life expectancy, so policy makers may take that into consideration.
2
We make the simplifying assumption that patients not on treatment and patients who are on treatment but are not fully adherent transmit infection at the same rate. We relax this assumption in Appendix B. Additionally we assume that a nonadherent patient still consumes a treatment spot and remains eligible for treatment in the next period since in reality, patients are unlikely to be refused treatment because of past nonadherence (capacity cost is sunk).
3
That is, we can interpret ![]() to be the adherence parameters multiplied by a factor that denotes infectivity reduction. Let ν ∈ [0,1] denote the suppressed transmission rate (e.g., for HIV, values from 0.80 to 0.96 are appropriate, per the discussion above). Then instead of using
to be the adherence parameters multiplied by a factor that denotes infectivity reduction. Let ν ∈ [0,1] denote the suppressed transmission rate (e.g., for HIV, values from 0.80 to 0.96 are appropriate, per the discussion above). Then instead of using
4
We recognize that enrolling patients in treatment provides enormous individual benefits as well. For example, one could instead define
5
We arbitrarily break ties in favor of the earlier period.
6
7
For reasonable parameter settings (i.e.,
8
One author has traveled to Zambia and interviewed health workers there; some details presented here are based on those interviews.