
Abstract
Management‐by‐walking‐around (MBWA) is a widely adopted technique in hospitals that involves senior managers directly observing frontline work. However, few studies have rigorously examined its impact on organizational outcomes. This study examines an improvement program based on MBWA in which senior managers observe frontline employees, solicit ideas about improvement opportunities, and work with staff to resolve the issues. We randomly selected hospitals to implement the 18‐month‐long, MBWA‐based improvement program; 56 work areas participated. We find that the program, on average, had a negative impact on performance. To explain this surprising finding, we use mixed methods to examine the impact of the work area's problem‐solving approach. Results suggest that prioritizing easy‐to‐solve problems was associated with improved performance. We believe this was because it resulted in greater action‐taking. A different approach was characterized by prioritizing high‐value problems, which was not successful in our study. We also find that assigning to senior managers responsibility for ensuring that identified problems get resolved resulted in better performance. Overall, our study suggests that senior managers' physical presence in their organizations' front lines was not helpful unless it enabled active problem solving.
Introduction
Hospitals face an imperative to improve quality of care and decrease medical errors that harm patients. Healthcare thought leaders and policy makers have advocated for the adoption of “management‐by‐walking‐around” (MBWA) to achieve these goals, resulting in widespread adoption in the United States and the United Kingdom. (Frankel 2004, National Patient Safety Agency 2011). These types of programs—in which senior managers visit the front lines to work with staff to identify and resolve obstacles—came to the attention of hospitals with the publication of one health‐care system's success at improving safety climate through its MBWA‐based intervention (Frankel et al. 2003).
Despite the intuitive appeal of MBWA and history of use in manufacturing organizations, empirical evidence on the program's efficacy in the hospital setting is mixed. Of seven hospitals that implemented an MBWA‐based program, only two were able to sustain the effort over a 3‐year period (Frankel et al. 2008). Those two reported a positive impact on staffs' perceptions of safety climate, but the effect on the five aborting hospitals was not reported. A study of one Veterans Affairs hospital found that patient safety climate worsened on two units that implemented the program, while it improved or stayed the same on two control units that did not implement the program (Singer et al. 2013). Another found that hospitals that implemented a general improvement program with an MBWA component did not improve on a variety of measures compared to control hospitals (Benning et al. 2011).
These mixed findings provide only modest support for widespread implementation of this program in hospitals. The lackluster performance of MBWA in health care may be that health care's specialized and diverse disciplinary knowledge bases (e.g., cardiology, pulmonary, surgery, pharmacy, nursing, etc.) creates a complex environment where it is difficult for senior executives to effectively observe frontline work and provide improvement suggestions (Aflaki et al. 2013). In addition, the highly regulated nature of health care may minimize the marginal effectiveness of MBWA because other audit programs, such as government‐mandated inspections or incident‐reporting systems, already focused senior managers' attention on the front lines of care (Iyer et al. 2013). Furthermore, the mixed results may be due to implementation differences, such as the prioritization methods used to determine which problems get resolved. However, prior studies have not assessed MBWA programs at a more granular level. As a result of the contextual differences in health care and limitations of prior research, much remains to be discovered about what factors and implementation approaches are associated with the success of MBWA in hospitals.
To test more systematically the impact of MBWA‐based improvement programs and to identify factors associated with its success, we implemented one such program in 19 randomly selected hospitals. We compared nurses' perceptions of improvement in performance (PIP) in work areas that implemented the program to the same type of areas at 68 randomly selected control hospitals that did not implement the program. A contribution of our study is thus a rigorous testing of an MBWA program. More specifically, our study design minimizes two methodological challenges of research on improvement programs. First, we minimize selection bias by randomly assigning organizations to the treatment condition. Our study thus provides insight into the program's generalizability beyond those where senior managers decided on their own to implement such a program. Second, the use of control organizations reduces the possibility that positive (or negative) results were caused by time‐dependent variables, such as changes in technology, policies, or awareness over time. Surprisingly, we find that, on average, our MBWA‐based program had a negative impact on nurses' perceptions of performance, suggesting that senior managers' presence in hospital front lines to solicit improvement ideas could be detrimental to workers' perceptions.
A second contribution of our study is developing a categorization of problem‐solving approaches that explains the conditions under which improvement solicitation programs, such as MBWA, are successful. We find that our MBWA‐based program was associated with improved perceptions of performance under two conditions: (1) when a higher percentage of solved problems were considered “easy” to solve, enabling more problem solving and (2) when senior managers took responsibility for ensuring that identified problems were resolved. This suggests that the action‐taking that results from the program, rather than the mere physical presence of the senior managers, is what positively impacts the frontline staff.
In 2, we describe prior research on MBWA programs and develop four hypotheses linking the program to performance. In 3, we describe the intervention, the sample of hospitals that participated in the research project, and our qualitative and quantitative data, measures, and analytic approach. We present the results in 4 and discuss the implications for research, practice, and policy in 5.
MBWA‐based Improvement Program's Impact on Performance
Research has found that quality improvement programs that solicit frontline workers' ideas, such as MBWA, can have a beneficial impact on organizational outcomes (Dow et al. 1999, Powell 1995). MBWA relies on managers to make frequent, learning‐oriented visits to their organization's front lines to observe work and solicit employees' opinions (Packard 1995). Hewlett‐Packard, the company in which MBWA originated, attributed its success using MBWA to good listening skills, willing participation, a belief that every job is important and every employee is trustworthy, and a culture where employees felt comfortable raising concerns (Packard 1995). MBWA is similar to the Toyota Production System's “gemba walks” (Mann 2009, Toussaint et al. 2010, Womack 2011). In a gemba walk, managers go to the location where work is performed, observe the process, and talk with the employees (Mann 2009). The purpose is to see problems in context, which aids problem solution (Mann 2009, Toussaint et al. 2010, Womack 2011).
MBWA has resulted in positive organizational change in some hospitals (Frankel et al. 2003, Pronovost et al. 2004). One explanation is that MBWA leads to successful problem resolution because seeing a problem in context improves managers' understanding of the problem, its negative impact, and its causes. This understanding increases managers' motivation and ability to work with frontline staff and midlevel managers to resolve the issue (Mann 2009, Toussaint et al. 2010, Von Hippel 1994, Womack 2011). Theory further suggests that MBWA's repeated cycles of identifying and resolving problems may create an organizational capability for improvement that reduces the cost of future improvement efforts, creating a positive dynamic (Fine 1986, Fine and Porteus 1989, Ittner et al. 2001). This virtuous cycle is further strengthened because communication from frontline workers about problems aligns managers' perspectives with customers' experiences (Hansen et al. 2010, Hofmann and Mark 2006, Huang et al. 2010, Singer et al. 2009), enabling managers to effectively allocate scarce resources among the organization's multiple improvement opportunities. Performance is also enhanced because managers' presence on the front lines sends a visible signal that the organization is serious about resolving problems. This increases employees' beliefs that leadership values improvement, which in turn spurs employees to engage in the discretionary behaviors necessary for process improvement (Mcfadden et al. 2009, Zohar and Luria 2003). For these reasons, we hypothesize that MBWA will positively impact performance. Hypothesis 1 (H1). Participation in a MBWA‐type program leads to improved performance.
The Effect of Problem‐Solving Approach
Although we hypothesize a positive impact from MBWA, programs that solicit employee suggestions can uncover more problems than an organization can resolve, given limited problem‐solving resources (Bohn 2000, Frankel et al. 2003, Repenning and Sterman 2002). When this happens, the organization's problem‐solving support personnel must decide which of the identified issues they will work to resolve and which ones will be ignored or delayed (Keating et al. 1999, Morrison and Repenning 2011). Thus, an MBWA's program's success may be contingent upon which problems the organization decides to address.
We examine two different prioritization approaches, discuss their benefits and limitations, and develop two hypotheses. We explore two dimensions of problems: solution difficulty and value gained by solving the problem (Aflaki et al. 2013). To simplify the discussion, we consider only two levels of each dimension: problems are either easy to solve or difficult to solve; and they can yield either a small or large value if solved. Organizations are likely to prioritize problems that are of high value and/or problems that are easy to solve. Although we develop hypotheses based on the assumption that organizations have a dominant prioritization scheme (such as addressing high‐value problems), we recognize that organizations could combine the two approaches. This implies that they would emphasize high‐value, easy‐to‐solve problems while ignoring problems that were both difficult to solve and of low value (Aflaki et al. 2013).
The first prioritization approach that we consider is one that addresses issues that are causing—or have the potential to cause—large disruptions. This high‐value prioritization approach ranks problems according to a value score and solves the highest‐valued problems. Many structured approaches to improvement, such as six‐sigma and risk management, use a high‐value prioritization approach (Anderson et al. 2013a,b). In the health‐care context, hospital incident‐reporting systems (Bagian et al. 2001) and MBWA‐based programs (Frankel et al. 2003) advocate calculating a problem's “value” by multiplying the problem's score for severity with its frequency of occurrence (Bagian et al. 2001, Frankel et al. 2003). The hospital then resolves the highest‐value problem first, followed by the second highest, continuing until problem‐solving resources are depleted or remaining problems fall below a threshold value (Bagian et al. 2001). Surfacing and solving the highest‐valued problems should yield substantial gain in performance (Bagian et al. 2001, Girotra et al. 2010). To provide an example in the hospital setting, medication‐related problems are often of high value because they can be fatal and can impact many patients (Bates et al. 1995). In response, many hospitals have implemented computerized physician order entry systems which reduce medication errors by preventing transcription errors and alerting physicians to potential drug allergies or interactions (Bates et al. 1999).
This approach is beneficial because it ensures that limited resources are preserved for problems with the highest values (Frankel et al. 2003). It also helps prevent the queue of unsolved problems from growing unmanageably long by permitting the organization to discard the subset of problems that are deemed too little valued to justify solution efforts (Bohn 2000).
However, there is a downside to focusing exclusively on high‐value problems. The ignored problems constitute the “useful many” which individually do not have a large negative impact on performance (Juran et al. 1999), but which collectively could contribute to serious problems such as medical errors (Reason 2000).
Thus, the second approach that we consider is prioritizing easy‐to‐solve problems (Johnson 2003, Repenning and Sterman 2002). An easy‐to‐solve prioritization approach enables the organization to address problems that are straightforward and quick to remedy—the so‐called “low‐hanging fruit.” This approach may free up resources for addressing problems because the more formal approach of assigning a prioritization score based on severity and occurrence has required significant resources in the case of incident‐reporting systems in both aviation and health care (Johnson 2003).
An easy‐to‐solve prioritization approach may also be helpful in health‐care settings because the cumulative benefit of resolving many small problems can add up to be a significant source of improvement (Jimmerson et al. 2005). Similarly, research has found that major accidents typically result from an unpredictable combination of small magnitude problems rather than from a single large magnitude problem (Perrow 1984, Reason 2000). According to the “Swiss Cheese Theory,” multiple small‐scale problems can align in an unfortunate way that enables an error to harm the customer (Cook and Woods 1994, Reason 2000). Consequently, resolving seemingly low‐value problems can be beneficial, because they otherwise might contribute to the next major accident (Perrow 1984). To illustrate, a study of medical harm in cardiac surgery found that adverse events were more likely to be caused by multiple, simultaneous “minor” issues than by a single, “major” issue. This was because surgeons were less able to perceive and compensate for multiple, simultaneous minor issues while they were able to recognize and remedy a single, major issue that occurred during surgery (De Leval et al. 2000). This line of research implies that it is difficult to assign a “value” to problems because their negative impact is determined in part by the specific situation in which they occur.
Another situation in which the easy‐to‐solve prioritization approach may be superior is where the organization has a “flat landscape” of small magnitude problems. In flat landscapes, the difference between a local high point and the global high point is too small to justify an extensive search effort (Sommer and Loch 2004). This can occur in hospitals for two reasons. First, managers typically address issues that result in patient death or other serious injury such as wrong site surgery. Thus, the only problems that remain may be small magnitude issues. Second, there are many unique opportunities for patient care to fail because work is divided among specialties, departments, and shifts. Problems can occur at any of these handoffs. Thus, unlike manufacturing settings where an undetected malfunction in a machine can be the dominant source of defective product, it is less likely that there is a single, dominant source of repeated failures in hospitals. When there is a flat landscape, improvement arises from solving the lower tail of problems.
It may also be that organizations need to address basic, fundamental problems before they can benefit from trying to address more complex organizational issues. For example, research suggests that problem‐solving efforts are most successful when organizations use relatively straightforward problems to develop sufficient problem‐solving capacity before tackling larger, more complex issues (Keating et al. 1999, Morrison and Repenning 2011). Addressing easy‐to‐solve problems enables frequent problem‐solving cycles, which develops employees' expertise at problem solving (Adler et al. 2003). These dynamics suggest that organizational problem‐solving capacity is more like a muscle that strengthens with exercise rather than a resource that gets depleted with use (Fine 1986, Fine and Porteus 1989, Ittner et al. 2001).
We draw on the arguments outlined in the above paragraphs to develop two hypotheses. When problem‐solving resources are limited and become depleted with use, the organization should focus its scarce human and financial capital on removing the problems that pose the biggest threat. Thus, a high‐value prioritization approach will be associated with improved performance. Hypothesis 2 (H2). Work areas that resolve a higher percentage of high‐value problems will have greater improvement in performance than work areas that solve a lower percentage of high‐value problems.
An easy‐to‐solve prioritization approach should be associated with improvement because it fosters solution of all problems that can be solved, regardless of their hypothetical value. In the health‐care setting, this might benefit the organization because seemingly small‐value problems can nonetheless negatively impact patient safety. Furthermore, the act of solving problems develops the organization's capability to solve more problems in the future. Thus, Hypothesis 3 (H3). Work areas that solve a higher percentage of easy‐to‐solve problems will have greater improvement in performance than work areas that solve a lower percentage of easy‐to‐solve problems.
The Role of Senior Managers in Problem Solving
In addition to the prioritization approach, the success of an MBWA program depends on senior managers' willingness to take responsibility for ensuring that problems identified through the program are resolved (Frankel et al. 2005, Pronovost et al. 2004).
Senior managers can be helpful to frontline workers' resolution efforts because they control financial resources needed to address issues that involve capital investment (Carroll et al. 2006). In addition, they possess the perspective necessary to resolve conflicts that arise when problems cross organizational boundaries (MacDuffie 1997). This insight is valuable particularly because high‐value problems are likely to cross organizational boundaries or require financial resources to resolve.
On the other hand, easy‐to‐solve problems impact only one department and do not require substantial financial resources to resolve. Under these conditions, frontline employees can be empowered to identify and resolve problems (Jimmerson et al. 2005). However, involving frontline workers in resolution efforts requires them to take time away from their direct production responsibilities (Repenning and Sterman 2002, Victor et al. 2000). This can be difficult for frontline employees, especially for health‐care workers who provide direct patient care. Under these conditions, senior managers need to allocate funds for overtime or coverage so that care providers can spend time away from patient care and on resolution efforts.
As outlined in the two above paragraphs, both high‐value and easy‐to‐solve problems require manager support for successful resolution. Therefore, we hypothesize that hospital work areas will achieve better results from the MBWA program when they assign to senior managers the responsibility for ensuring that a problem gets addressed. Hypothesis 4 (H4). Work areas with a higher percentage of problems assigned to a senior manager to ensure resolution exhibit greater improvement than those with a lower percentage of problems assigned to a senior manager.
These four hypotheses outline the theoretical links between our MBWA‐based program and improved performance. Figure 1 depicts these relationships.
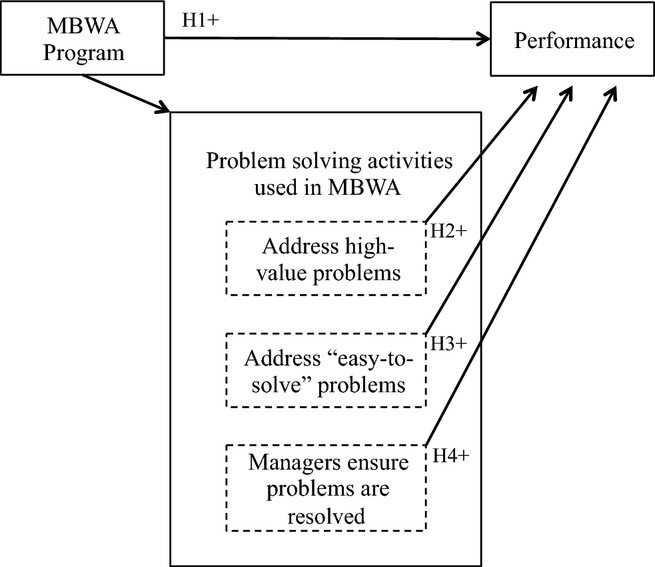
Model of Management‐By‐Walking‐Around's Impact on Performance
Methodology
We test our hypotheses in a field study of US hospitals randomly selected to participate in a patient safety research study, with a subset of the hospitals randomly selected (a second time) to implement our MBWA‐based program. The program was launched in January 2005 and lasted for 18 months.
The MBWA‐based Program
We drew on prior research to design our MBWA‐based program (Frankel et al. 2008, Pronovost et al. 2004, Thomas et al. 2005). It consisted of repeated cycles of senior manager–staff interaction, debriefing, problem solving, and follow‐up. Senior managers such as the chief executive, operating, medical, and nursing officers (CEO, COO, CMO, and CNO, respectively), interacted with frontline staff in a work area to generate, select, and solve improvement ideas. The work area manager was also involved in the selection and solution activities. Senior manager interactions took two forms: visits, called “work system visits,” to work areas to observe frontline work; and special meetings, called “safety forums,” with a larger group of frontline staff from the area to discuss safety concerns. The activities were coordinated with the work area manager.
In work system visits, four senior managers would spend 30 minutes to 2 hours visiting the same work area. The senior managers would each observe a different process, such as medication administration, or a different person, such as a nurse or physician, to shed cross‐disciplinary insight into the work done in the area. The purpose was to build senior managers' understanding of the frontline work context and gather grounded information about problems (Frankel et al. 2008).
Senior managers also facilitated a safety forum in the work area, which was an informal meeting between senior managers and the frontline staff from the work area, held in the work area, during which the staff talked about their work area's safety weaknesses and strengths. We added this component to our MBWA‐based intervention for two reasons. First, a San Diego children's hospital improved its organizational climate by holding meetings where frontline staff spoke directly to the hospital CEO about their concerns and ideas (Sobo and Sadler 2002). Second, a prior research project on an MBWA‐based program found that the program only improved the perceptions of frontline staff who participated in a work system visit (Thomas et al. 2005). Because it is not feasible for senior managers to conduct a work system visit with every single hospital employee within a short time period, Thomas' finding suggests that work system visits on their own will be insufficient to change the perceptions of most hospital employees.
The MBWA‐based program continued with a “debrief meeting,” which organized information collected from the work system visits and safety forums. Senior managers attended, as did work area managers, selected frontline workers, and the hospitals' patient safety officers. The group compiled the improvement ideas identified, discussed and in some work areas prioritized them, and decided next steps, ranging from doing nothing to suggesting solutions and assigning responsibility. Action to address problems selected for resolution followed the debriefing. Managers were encouraged to communicate with staff about implementation efforts, describing what changes, if any, were made in response to identified ideas. Patient safety officers entered the ideas generated and actions taken into an electronic spreadsheet we provided and sent this spreadsheet to our research team for analysis.
Each round of work system visits, safety forums, debrief meeting, solution activities, and communication constituted one cycle. A cycle focused on one work area and took approximately 3 months, which research has shown is the time required to solve problems in an organization (Pronovost et al. 2004). See Figure
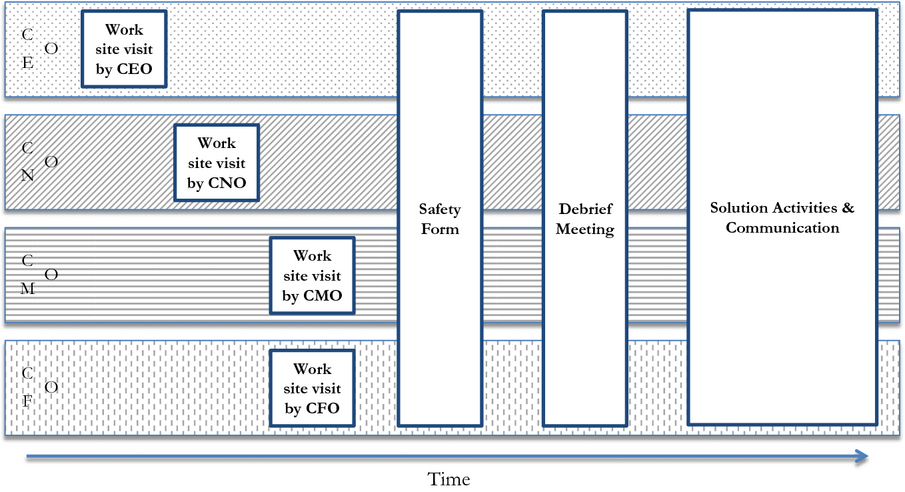
Depiction of the MBWA‐based Program Activities in a Work Area
Recruitment
Our study employed an experimental design which included a pre‐test and post‐test of similar work areas in treatment and control hospitals. We randomly selected 92 US acute‐care hospitals, stratified by size and geographic region, to participate in a patient safety climate survey. We provided no financial incentive, but participation in the safety climate study fulfilled a national accreditation requirement. At enrollment, all hospitals were aware that they may be invited to participate in a program to improve patient safety, but details regarding the program were withheld to prevent contamination of control hospitals. To select hospitals to participate in the MBWA‐based program, we drew a second, stratified, random sample of 24 hospitals from the sample of 92. The remaining 68 hospitals not selected were control hospitals. Data on staff perceptions of performance were collected at control and treatment hospitals through surveys before implementation of program activities (2004, “pre”) and again after the program was completed (2006, “post”). At each hospital, we surveyed a random sample of 10% of the frontline workers, with additional oversampling in OR/PACUs, EDs, and ICUs in the post‐survey period to improve sample size. The baseline “pre” response rate was 52%; and the follow‐up “post” response rate was 39%. For our analyses, we used data from registered and licensed vocational nurses (n = 1117 pre and n = 903 post).
Of the 24 treatment hospitals, 20 completed the program in at least two work areas. Of the four that did not complete the treatment, one went out of business, one was purchased, and two experienced significant senior management turnover. As a result, they were unable to complete more than one cycle of activities and did not provide data. We thus excluded these four from our analysis. There was no difference in staff perceptions of performance in the pre‐period between the four hospitals that dropped out of the treatment and the 20 that did not. Of the original 68 control hospitals, 48 completed the post‐test survey, making an initial total sample of 68 hospitals. There was no difference in survey measures in the pre‐period between the 20 control hospitals that dropped out of the post‐survey and the remaining hospitals. There was also no difference between treatment and control work areas on pre‐period measures of staff perceptions of performance.
Data and Measures
Using the data collection spreadsheet that we provided (Figure 3), treatment work areas reported 1245 patient safety problems identified during the visits and forums. Each hospital also provided a list of the senior managers, which we used to determine whether a senior manager attended the program activity and whether a senior manager was assigned responsibility for the problem. The spreadsheet also contained three columns that the work areas could use to prioritize identified problems. Twenty‐four work areas in eight hospitals filled out this information.
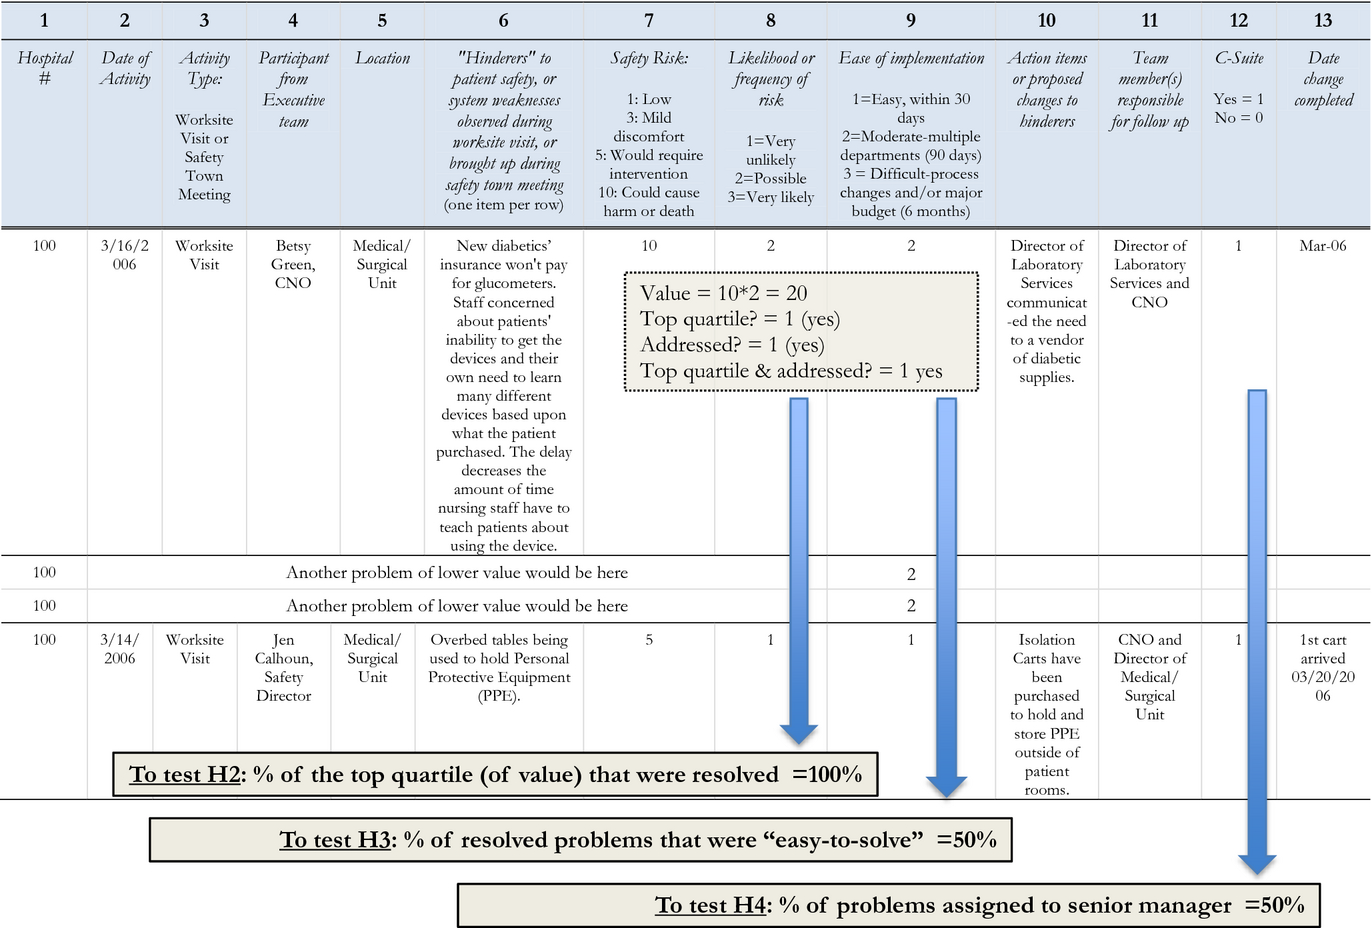
Data Collection Sheet Used by Treatment Hospitals and Two Problems as Examples
Independent Variables
To test the overall impact of the MBWA‐based program (H1), we created a treatment variable, “MBWA in the work area,” which indicated whether the work area received the MBWA‐based treatment (=1) or was a work area from a control hospital (=0). To test the high‐value prioritization approach (H2), we calculated a value score for each problem by multiplying problem severity (column 7 in Figure 3; 1 = low; to 10, could cause death) by estimated frequency of occurrence (column 8; 1 = very unlikely, 3 = very likely) (Bagian et al. 2001, Frankel et al. 2003). This method for calculating the potential value of solving a problem is similar to six‐sigma's risk prioritization number, which uses the product of the scores (on a scale from 1 to 10) of a problem's frequency of occurrence, detectability, and severity (Evans and Lindsay 2005). It is also similar to risk registers used for risk management. A risk register scores each potential risk to a project by multiplying the risk's likelihood of occurrence by severity of the impact if it does occur (Anderson et al. 2013a,b). We used our value score in combination with whether or not the problem was addressed (column 10 in Figure 3) to create a unit‐level variable that represented the percentage of problems in the top quartile (ranked by value) that were resolved, which we call “% of top quartile that were resolved.” As an alternate test of H2, we also created a dummy variable, “Top ranked problem resolved?” A dichotomous variable that indicated whether or not the top‐ranked problem in the work area was resolved. The alternate specification for H2 allowed us to test our prediction using innovation literature theory, which asserts that success can come from identifying and solving even just one high‐value idea (Girotra et al. 2010). To test the easy‐to‐solve prioritization approach (H3), we calculated, from a work area's set of problems that were resolved, the percentage that were rated “easy‐to‐solve,” a “1” on a 3‐point scale, meaning it is was “easy and could be resolved within 30 days” (column 9 in Figure 3). The higher the percentage, the more the unit solved easy‐to‐solve problems. We called this variable “% of problems solved that were low‐hanging fruit.” Finally, to test our hypothesis about senior managers (H4), at the work area level we found the percentage of problems for which a chief executive level manager was assigned responsibility for ensuring that the problem was resolved (column 12 in Figure 3). See Figure
Measure
In accordance with prior research (Chandrasekaran and Mishra 2012, Frankel et al. 2003, 2005, 2008), we evaluated the program's performance using staff “PIP.” To measure PIP, we used four survey items (see Appendix A) from validated survey instruments that measured the effectiveness of quality improvement efforts (Shortell et al. 1995, Singer et al. 2009). Respondents rated each item using a 5‐point scale ranging from 1 = strongly disagree to 5 = strongly agree. Agreement indicated that respondents thought quality and safety performance were improving. The scale exhibited high reliability (Nunnally 1967), with a Cronbach's alpha of 0.84 (n = 1147 nurses) in the pre‐period and 0.88 (n = 1103 nurses) in the post‐period.
We used perception of performance for four reasons. First, employee perceptions are an important outcome because they influence behaviors, which in turn impact objective measures (Zohar and Luria 2003). Second, staff perceptions of performance are a valid indicator of performance (Ketokivi and Schroeder 2004). This is because employees are close to the work and often know if system failures are decreasing or increasing. Research has found that nurses' perceptions of safety are correlated with objective measures of safety outcomes, such as mortality, readmissions, and length of stay (Hansen et al. 2010, Hofmann and Mark 2006, Huang et al. 2010, Singer et al. 2009). Third, employee perceptions have been widely used as outcome measures in operations management research because they enable comparison across organizations (Anderson et al. 2013a,b, Atuahene‐Gima 2003, Bardhan et al. 2012, Chandrasekaran and Mishra 2012, Flynn et al. 1995, Kaynak 2003, Swink et al. 2006). Finally, the use of a perceptual measure was necessitated by hospitals' unwillingness to share data on safety incidents.
Our dependent variable was the change in PIP from the pre‐ to the post‐period. The use of change scores allowed us to examine change over time (Fitzmaurice 2001). To create a composite change score for each work area, we used the pre‐data to calculate the mean of the four items for each nurse, and then averaged by work area. We repeated this process for the post‐data and subtracted each work area's pre‐score from its post‐score. We calculated intra‐class correlations (ICC) and a mean inter‐rater agreement score (r WG) to test whether aggregation of PIP was appropriate. Significant (ICC[1] = 0.06, F = 5.69, p < 0.000, and ICC[2] = 0.82) supported aggregation (Bliese 2000). The r WG for nurses' rating of PIP was 0.60, which also was sufficient for aggregation (Zellmer‐Bruhn 2003). Furthermore, our use of a change score as our dependent variables met the two conditions specified by Bergh and Fairbank (2002): the reliabilities of our survey measures for PIP in pre‐ and post‐periods were high (0.84 and 0.86, respectively) and the correlation between the measures from the two different time periods was low (ρ = 0.24, p < 0.001). As is common in studies using a change score (Bergh and Fairbank 2002), the correlation between the change score and the PIP measure in the pre‐period was negative (ρ = −0.67, p < 0.001). This indicates that there was a greater opportunity for improvement in PIP among work areas with a low PIP in the pre‐period (Fitzmaurice 2001). Therefore, to control for impact of a work area's starting point on the change in PIP, we included a dichotomous variable indicating whether PIP in the pre‐period was in the lower quartile (“bottom quartile for 2004 PIP”). The variable was coded “1” if the work area was in the bottom quartile of work areas in PIP in the pre‐period and “0” for all others. This method enabled us to test for the change in PIP while controlling for a low starting point.
Control Variables
For H1, which tested the overall impact of our MBWA‐based program, the large sample size enabled us to include the following control variables: major teaching hospital (1 = yes, 0 = no); Dun & Bradstreet's measure of the hospital's financial stress, with higher numbers indicating a higher likelihood that the business will seek legal relief from creditors or cease operations without paying creditors in full over the next 12 months; a set of dummy variables for the number of hospital beds (reference group = less than 100 beds; medium = 100–250 beds; large = more than 250 beds); and a set of dummy variables for type of work area (reference group = non‐clinical; OR/PACU; ICU; ED; Med/Surg unit; and other clinical unit). Data on size and teaching came from the 2004 American Hospital Association Survey of Hospitals.
For the hypotheses about problem prioritization (H2 and H3), our sample size was limited to the 24 work areas that formally prioritized their problems in the data collection spreadsheet. As a result, for these hypotheses, we did not have a large enough sample size to include non‐significant control variables in our regression. However, our random selection of hospitals helps alleviate concerns that our model may be subject to omitted variable bias (Antonakis et al. 2010). We did not include control variables for unit type (e.g., ED, ICU, and OR/PACU) as none were significant and their inclusion did not change our results. We also tested for hospital‐level control variables, such as teaching status and number of beds, but none were significant and their inclusion did not change our results. We controlled for availability of “low‐hanging fruit,” which was the percentage of identified problems that were rated as easy to solve. We also controlled for the average value of the top quartile of identified problems.
Our regression equation for H4, the impact of a senior manager being assigned responsibility for problem resolution, included the full set of 58 intervention work areas. We controlled for the percentage of problems within a work area that were resolved (% of problems resolved) by coding a problem as having had solution effort if there was evidence in the dataset that action had been taken to address the problem, and taking the average of this variable at the work area level. We also controlled for the fidelity of implementation with the following variables: the number of work system visits that were conducted, whether a work system visit was conducted by a senior manager (1 = yes, 0 = no), and whether a safety forum was conducted in the area (1 = yes, 0 = no).
Sample Size and Analysis
We used linear regression with robust standard errors and clustered by hospital (Rabe‐Hesketh and Everitt 2004) in Stata 11.1™ to test our hypotheses. The Shapiro–Wilk test for all regressions showed that the residuals were normally distributed (V close to 1 and p > 0.10) (Royston 1992). Multicollinearity was also not an issue as all variance inflation factors for all of our equations were less than 2.5, well below the upper threshold of 10 (Chatterjee and Hadi 1986).
To test the overall impact of our MBWA‐based program (H1), we use data from the four main clinical work areas (OR/PACU, ICU, ED, and Med/Surg). We had data for both pre‐ and post‐PIP measures from 58 intervention work areas in 20 treatment hospitals and 138 work areas in 48 control hospitals. However, missing data for a control variable (financial stress) in two intervention work areas resulted in a final sample size of 56 intervention work areas. To test the impact of problem selection (H2 and H3), we used data from the 24 work areas from eight treatment hospitals that formally prioritized their problems. Finally, to test the impact of senior manager assignment to problem resolution (H4), we used the full set of intervention work areas (n = 58).
Qualitative Data Collection and Analysis
During the intervention, we visited each treatment hospital to tour the clinical areas and to observe MBWA activities, including work system visits, safety forums, and debrief meetings. In addition, we discussed and observed examples of changes implemented in response to problems identified through the program to verify accuracy of the data submitted. There were no discrepancies. We also conducted semi‐structured interviews with a frontline staff member, a department manager, and the CEO from each hospital (see Appendix B). Interviews addressed the nature of performance improvement in the hospital in general and as it related to implementing the MBWA‐based program. Interviews and notes from the meetings were recorded and transcribed. Investigators also wrote a journal of the day's activities from notes taken during the day. The journal and transcripts from each hospital were combined into a single document, which served as our source of qualitative data.
After the intervention was complete, we used these qualitative data in combination with the problem data submitted by the work areas to illuminate differences among work areas in the types of issues identified, actions taken to resolve them, and managers' attitudes. We analyzed transcripts using the procedure described in Miles and Huberman (1994, pp. 58–62). We initially used a list of codes based on our interview questions. We read the transcripts multiple times, revising the codes as we deepened our understanding of similarities and contrasts among the implementation of the program. How the managers prioritized problems for solution efforts emerged as a main theme. One author went through the qualitative data to select all relevant quotes for this theme. Both authors independently reviewed the quotes while blinded from the performance results. We compared our perceptions to come to a consensus. We use the quotations to illustrate differences in implementation approach that impacted the effectiveness of the intervention. Table 6 in the results section displays representative quotations from the five work areas that improved the most over the course of the intervention and the five that decreased the most.
Results
Summary Statistics
Average PIP in the 56 treatment work areas was 3.78 in the pre‐period and 3.69 in the post‐period. The difference of −0.09 was not statistically significant at the 10% significance level. The same four types of work areas (n = 138) in control hospitals had a mean PIP of 3.8 in both time periods. Table
Mean, Standard Deviation (SD), and Correlations for Treatment Work Areas (N = 56 work areas)
***p < 0.001, **p < 0.01, *p < 0.05.
Mean, Standard Deviation (SD), and Correlations for Treatment Work Areas and Identified Problems (n = 24)
***p < 0.001, **p < 0.01, *p < 0.05, † p < 0.10.
Regression Results
Contrary to our prediction, the MBWA‐based treatment was associated with a statistically significant decrease in PIP (−0.17, p < 0.05) compared to the same types of work areas in control hospitals (H1, Table
Linear Regression testing Hypothesis 1 (the Change in PIP in Treatment Work Areas vs. the Same Types of Work Areas from Control Hospitals) Clustered by Hospital with Robust Standard Errors in Parentheses
***p < 0.001, **p < 0.01, *p < 0.05, † p < 0.10.
The effectiveness of the program did vary, however, among work areas. As shown in Model 1, our control variable for whether or not the work area was in the bottom quartile for pre‐period PIP was significant (β = 0.75, p < 0.001), suggesting that work areas with the lowest PIP scores in the pre‐intervention period exhibited a positive change in PIP over the course of the intervention. Additional analysis revealed that the work areas that were in the bottom quartile for our dependent.
variable, change in PIP, had a decline in PIP ranging from 0.375 to 2.25. Of these 15 work areas that experienced the greatest decline in PIP, four were already below median in the pre‐period, suggesting that their decline was not merely a regression to the mean effect. The work areas in the top quartile of change in PIP experienced an increase in PIP ranging from 0.38 to 1.33 points. This large variation in results prompted us to examine factors associated with success.
Model 1 in Table
Regression Comparing Change in PIP in Treatment Work Areas that Rated the Severity, Frequency, and Ease of Solution of the Problems, Clustered by Hospital with Robust Standard errors in parentheses (H2 and H3)
***p < 0.001, **p < 0.01, *p < 0.05, † p < 0.10.
Testing H2 using highest‐value score instead of the mean priority of the top quartile and a dummy for whether the top‐ranked problem for value was resolved instead of the percentage of problems rated in the top quartile for value that was solved was also not significant (Table 4, Model 2). This result fails to support theory from the innovation literature suggesting that solving the highest‐value idea drives performance in our context. However, the percentage of problems resolved that were rated “easy‐to‐solve” remained significant in this model (coefficient = 0.82, p < 0.01), providing additional support for H3. Prioritizing easy‐to‐solve problems appeared to increase PIP.
An alternate explanation for our finding could be that work areas were more successful because they spent more money on problem solving rather than because they prioritized easy problems. To control for this “spend more” explanation, the authors individually rated the rough cost of each solved problem on a scale of 1–3 with 1 = low (cost ≤ $500), 2 = medium (cost > $500 < $150,000), and 3 = high (cost ≥ $150,000) based on the description of how work areas solved the problem and independent research to check the cost of products or services mentioned in the description. We used these ranges because they represented different categories of solutions. The cheapest category was solutions that involved a one‐time purchase of a relatively low‐cost supply (<$500). An example is applying a coating to one window to improve patient privacy. The second category was intended to cover mid‐range solutions such as the purchase of equipment or consumable supplies. An example is the purchase and installation of new lighting in a catheterization laboratory to illuminate procedures. The most expensive category was for solutions that involved construction or hiring of multiple people. An example is a solution that involved hiring multiple people to transport patients within the hospital. We compared scores and discussed our rationale until we reached consensus for all solved problems. We then summed the total estimated solution costs, estimating 1 = $250; 2 = $5000; and 3 = $150,000, for all of the solved problems in each work area.
Another possible explanation is that variation in quality of solution efforts impacted the results (e.g., some work areas might have engaged in only superficial steps while others might have systematically resolved underlying causes). We also controlled for this “higher quality” explanation by hiring 10 nurses not affiliated with our study hospitals to rate the solution effectiveness of the proposed solution for each problem using a scale from 1 to 10. The low end of the scale was used for problems that were not resolved (1 = “no information given”; 2 = management dismissed the issue or it was not a safety issue; and 3 = issue not considered due to lack of funds or issue passed off to someone else without any follow‐up). The higher the number, the more substantial and systematic the solution (e.g., 9 = major investment or change; 10 = systemic fix that would prevent recurrence). The scale is available from authors. Agreement among nurses on their ratings was acceptable (κ = 0.23) (Landis and Koch 1977). The mean rating for solution effectiveness was higher at 5.9 for solved problems (“solution action in progress” on our scale) than 2.7 (“no solution implemented”) for unsolved problems, which validates their coding.
Given our small sample size, in this secondary analysis we omitted the high‐value prioritization variables, as they were not significant in our primary analyses. As Model 3 shows, the variable for the cumulative “cost of solving problems” was not significant. This may be because work areas could improve PIP without having to spend a lot of money on solutions. Solution effectiveness was also not significant. The percentage of solved problems that were low‐hanging fruit remained significant (coefficient = 1.22, p < 0.05), indicating that the results are similar after accounting for spending and solution effectiveness. The evidence in the three models supports H3, which predicted that prioritizing easy‐to‐solve problems would be associated with higher PIP.
Table
Impact of the Percentage of Problems Assigned to Senior Managers on Change in PIP in Treatment Work Areas (H4)
***p < 0.001, **p < 0.01, *p < 0.05, † p < 0.10.
Robustness Check
Other scholars have used a different approach for testing improvement over time by using the post‐measure as the outcome variable and the pre‐measure as a control variable (Fitzmaurice 2001). We tested our hypotheses using this method and the results were the same (results not shown).
Qualitative Results
To provide insight into the nature of implementation of MBWA‐based programs, Table 6 presents qualitative data from the five work areas that improved the most and the five that decreased the most. Between pre‐ and post‐periods, on average PIP improved by 0.85 for the top five work areas and decreased by 1.4 for the bottom five. Our examination of issues identified and actions taken suggests that the top work areas identified meaningful problems and managers took these problems seriously. For example, hospital 88s Med/Surg unit was one of the most improved work areas. One of the identified issues was that the small size of the medication room prevented two nurses from preparing medications simultaneously, which was an inconvenience and delayed patient care. Senior managers discussed the issue with staff and they collectively made a plan to move the medication room to a larger space. The COO commented, “It's a little thing, but when you actually see them doing the process, you say, ‘Wait a minute, that is difficult for them.'” An interview with a nurse highlighted management's willingness to address issues. She commented, “These people address safety issues. It may not always get addressed the way you want, but it still gets addressed.”
Illustrative Problems, Solutions, and Quotes from Top and Bottom Quartile Work Areas
*Pyxis™ is an automated medication‐dispensing device used by nurses to administer medications to their patients.
Conversely, in the bottom work areas, an emphasis on prioritizing the highest‐valued problems limited solution efforts. For example, hospital 129s ED identified valid issues, such as long lead times to receive lab results. However, in the safety forum, we observed the manager spend the entire time getting staff input on prioritizing the items, leaving no time to discuss how the issues might be resolved. This work area did not solve any of the problems they had identified, despite investing substantial time in identifying and prioritizing them. As Table 6 shows, this pattern was common. Two of the six bottom work areas did not resolve any problems, another's “solutions” were largely to re‐educate staff, and a fourth area provided us with no information about solved problems. These implementation details suggest an inability to make meaningful progress on solving the problems. The lack of solution efforts illustrates how relying too heavily on a high‐value prioritization approach can preclude taking action. Furthermore, in some of the work areas in the bottom quartile for change in PIP scores, such as hospital 34s OR/PACU and hospital 65s ED, identified issues had to be validated by an external group, such as the patient safety committee, before resolution efforts would be authorized. This additional step substantially slowed the pace of change. Hospital 65s CEO explained his prioritization philosophy, “You can't fix them all, but you have to prioritize. Our patient safety committee will end up doing that.” However, the safety officer from that hospital explained the negative effect this had on staffs' perceptions, “What happens is you heighten the awareness among people and then, if they don't see resolutions, then it becomes a bone of contention.”
Discussion, Implications, and Limitations
In this study, we investigated the effectiveness of an MBWA‐based program in randomly selected hospitals. We found evidence that participating in this particular program decreased performance on average. Given that many quality‐improvement initiatives fail to achieve expected gains (Beer 2003, Nair 2006, Repenning and Sterman 2002), it is perhaps not surprising that our program failed to yield positive results for all work areas. Nonetheless, this is an important result because many hospitals throughout the United States and United Kingdom have implemented—and continue to implement—similar programs. Our study provides a cautionary tale that visits by senior managers to the front lines of the organization to solicit improvement ideas will not necessarily increase staffs' perceptions of performance improvement. There may be negative repercussions if senior managers attempt, but fail, to engage meaningfully with frontline staff. We suspect that the negative consequences arose from soliciting, but not sufficiently addressing, frontline staffs' concerns (Keating et al. 1999, Morrison and Repenning 2011). Failure to meet expectations, once raised, can frustrate employees, negatively impact organizational climate, and dampen employees' willingness to provide future input (Tucker 2007). Thus, our study suggests that there is a hidden, psychological cost of asking employees for ideas that are subsequently disregarded.
To understand why some units had better results than others, we examined two approaches to problem solving. Solving a higher percentage of the highest‐valued problems was not associated with increased PIP. This result is similar to an earlier finding in the TQM literature that formalization could overwhelm actual improvement efforts, leading to employee dissatisfaction with the program (Mathews and Katel 1992). Conversely, solving a higher percentage of easy‐to‐solve problems was successful, lending support for approaches that create a bias toward action. This signals the value in addressing “low‐hanging fruit,” at least in the short term (Keating et al. 1999, Morrison and Repenning 2011). Our research does not find that a focus on surfacing and resolving only high‐value problems yields improved staff perceptions.
Senior managers can facilitate a bias for action. We found that having senior managers assume responsibility for ensuring that problems get resolved was associated with increased PIP. One explanation for this finding is that organizational change often requires senior managers to provide financial resources to pay for required equipment, materials, or labor; and organizational support to get an upstream department in the organization to change how they do their work if benefits accrue downstream. In other words, senior managers can help ensure that action happens. Given the improvement literature's emphasis on empowering frontline employees to solve problems (Powell 1995), our finding may be interpreted as highlighting the importance of empowering frontline employees to identify and solve problems while supporting those efforts by ensuring that organizational obstacles to improvement are removed.
Implications for Theory
Manager commitment is associated with successful implementation of performance improvement programs that rely on frontline employee participation (Ahire and O'Shaughnessy 1998, Coronado and Antony 2002, Kaynak 2003, Nair 2006, Worley and Doolen 2006). We found that a program that stimulated managerial involvement was productive for some, but not all, work areas. An explanation of the negative result of our MBWA‐based program was that asking employees for their suggestions and then not implementing them sent the message that employees' ideas were not valued and that the program was symbolic. Research by Miles supports this explanation (1965). He postulated that managers hold one of two beliefs about the value of employee participation programs. One belief was that frontline staff participation was valuable because it increased morale, though the actual ideas they contributed were unhelpful. These managers believed in the symbolic value of employee participation programs, such as MBWA. Miles (1965) found that improvement programs failed when managers held this belief. The second belief—which was associated with success in Miles' study—was that interactions with frontline staff were valuable because their ideas were actually useful. The belief in the substantive value of employees' ideas underlies a core TPS principle: respect for people (Liker 2004). Miles' study suggests that senior managers' respect for frontline employees' concerns may have been an important but unmeasured moderator variable for our MBWA program. An implication is that rather than just seeking to increase manager involvement, it may be critical first to ensure that managers value the ideas raised by frontline staff.
An explanation for the lack of positive impact from the high‐value prioritization approach may be that problem values in the hospital work areas in our study had a relatively flat landscape. As a result, pursuing a high‐value prioritization approach did not yield a substantial improvement over focusing on easy‐to‐solve problems. The flat landscape may be because the work areas had already addressed their large‐value problems or because the fragmented service environment of health care creates a wide range of small‐scale problems. The easy‐to‐solve prioritization approach may have been successful in our study, because the work areas needed to first tackle fundamental, lower‐value problems before advancing to more complex problems (Keating et al. 1999, Morrison and Repenning 2011). Taking care of the basic infrastructure and requirements is a necessary precursor to more comprehensive organizational change required by higher priority score problems (Keating et al. 1999, Morrison and Repenning 2011).
There are likely circumstances under which prioritizing high‐value problems is helpful, such as when only one idea can be fully developed, like implementation of an enterprise‐wide information system. We also believe that organizations benefit from resolving high‐value problems, which tend to be top‐down, strategic improvements, as well as easy‐to‐solve problems, which tend to be bottom‐up, tactical initiatives. Organizations should try to nurture both kinds of problem‐solving capabilities. For example, organizations may have experts working on identifying and solving high‐value problems through six‐sigma projects, while frontline employees simultaneously work on resolving smaller scale issues in their local work area through lean initiatives. Furthermore, it may be that organizations begin their improvement journey by successfully resolving relatively easy problems, but then need to develop new capabilities to resolve more complex problems (Keating et al. 1999, Morrison and Repenning 2011). For example, reducing the time required to find vital sign monitor equipment on a nursing unit likely requires different problem‐solving skills than reducing patients' lengths of stay in the hospital.
Implications for Policy
Our study suggests that policy makers can play an important role in improving safety in hospitals by encouraging organizations to build problem‐solving capacity. Rather than requiring hospitals to participate in a specific change program, such as MBWA, that may not be fully validated, policy makers could instead provide incentives for hospitals to build the generic capacity to solve frontline problems. Given the trend toward requiring hospital to implement multiple quality‐improvement initiatives concurrently, we suspect that it is likely that many programs are being implemented superficially and in ways that lead to harmful results similar to those we observed in this study. This could be contributing to the oft‐reported failure to achieve gains through improvement initiatives that frustrate the health‐care industry (Landrigan et al. 2010). Our study provides a warning about mandating implementation of improvement programs before fully understanding the conditions required for the programs to yield successful outcomes.
The financial incentives used to encourage adoption of electronic health records in the United States may be instructive. Policy makers rewarded “meaningful use,” as demonstrated by the functionality that was achieved, rather than rewarding implementation of a particular software (Blumenthal 2010). Similarly, policy makers could provide incentives for building problem‐solving capabilities that improve patient‐centered performance rather than advocate for a specific improvement program.
Implications for Practice
Many initiatives to improve safety begin by trying to increase employees' reports of near misses, errors, and incidents (Bagian et al. 2001, Evans et al. 2007). Implied assumptions are that increasing the number of reports enables organizations to conduct trend analysis that illuminates high‐value problems which can then be solved; and that many issues will be of sufficiently low value that they can be ignored at low or no cost to the organization. In contrast, our study suggests that there may be little benefit, and some potential harm, to this approach. Rather than increasing reporting, organizations might be better served by addressing known problems, which builds problem‐solving capabilities, which in turn enables action‐taking on more problems. Our finding corroborates prior research that highlighted the importance of problem‐solving capacity for successful improvement programs (Adler et al. 2003, Keating et al. 1999, Morrison and Repenning 2011). This advice is consistent with the vision for a continuously learning health‐care system articulated by the US Institute of Medicine, requirements for which include systematic problem solving. Our study also resembles Kaizen, a structured problem‐solving approach involving managers and frontline workers. However, important differences that may make Kaizen more successful than our program are that Kaizen occurs after managers and frontline staff have been trained on a standardized problem‐solving technique and that it emphasizes taking action to solve as many problems as possible within the given time period (Imai 1986). Thus, it prevents resource depletion by limiting the time spent identifying and solving problems rather than by selecting among them.
Limitations
Our findings must be considered in light of study limitations. First, our small sample size limited our analysis. Our sample was small for several reasons. The cost‐ and time‐intensive nature of conducting an experiment with hospitals over 18 months made it challenging to conduct our field‐based, interventional program with 24 organizations, and we would have struggled if there were more. In addition, despite our providing a method of prioritizing problems, many organizations chose not to assign prioritization values and therefore work‐area coded data on problem value were not available for all treatment work areas. Future research with larger sample sizes could test more nuanced theory. For example, an easy‐to‐solve prioritization approach may be most successful for work areas that start from a weak position and can benefit most from action, whereas a high‐value prioritization approach may be most helpful for experienced work areas that can be more selective.
A second limitation is the perceptual measure of improvement. Hospitals were unwilling to share actual safety incident measures with us. In addition, publicly available clinical measures, such as mortality, readmissions, and process of care measures, started being reported publicly only after the initiation of this study. Although we conducted analyses using these “post study” clinical outcome data, the regressions were not significant in explaining variation. However, for reasons detailed above, a perceptual measure is an important indicator of the impact of the intervention we tested. Furthermore, prior research on an MBWA‐based intervention that did have access to clinical outcome data did not find links between multiple clinical outcomes and the intervention (Benning et al. 2011), corroborating our study results.
Third, hospitals did not track resources spent on solution efforts. Therefore, estimation was the only way of testing the alternate explanation that spending more money on process improvement yielded better outcomes. Future research could contribute to improvement theory by examining the cost of improvement efforts compared to benefits. A fourth limitation is that we did not randomize an easy‐to‐solve prioritization approach vs. a high‐value prioritization approach among work areas. Instead, those differences emerged naturally. A randomized assignment of these two prioritization approaches would provide a stronger test of the hypotheses.
Conclusions
Understanding the impact of MBWA‐based programs is helpful for organizations that may be considering implementing them. In our study, organizations whose managers ensured that problems were addressed achieved better results. This suggests that improvement programs are more likely to change employees' perceptions when they result in action being taken to resolve problems than when they are a symbolic show of manager interest. On the basis of study findings, we recommend that organizations focus on increasing their capacity to act on improvement suggestions rather than expending further effort on generating more suggestions and prioritizing them.
Footnotes
Survey Questions for Perceived Improvement in Performance
Interview Questions
Acknowledgments
Funding was provided by Agency for Healthcare Research and Quality RO1 HSO13920. Additional funding was obtained from Fishman Davidson Center at Wharton. Jennifer E. Hayes provided valuable data coding assistance.