
Abstract
Drug shortages have been a major challenge facing the US pharmaceutical industry and government in recent years. Although the problem has drawn tremendous attention from the government and media, limited academic research has been devoted to this problem, and few solutions have been proposed based on rigorous research. This study addresses the drug shortage problem from a supply chain perspective, a key aspect missing in the literature, and proposes to mitigate shortages through drug purchase contracts. By modeling the drug supply chain, we capture the objectives of various supply chain parties, and investigate Pareto‐improving contracts that mitigate drug shortages, improve drug manufacturer's and group purchasing organization (GPO)'s profits, and cut government spending and healthcare providers’ costs. We explore structural properties of key supply chain decisions and the Pareto‐improving contracts, and conduct scenario analysis with realistic industry data to evaluate shortage mitigation solutions. Our analysis shows that increasing drug prices only, a solution advocated by many, is not very effective in shortage mitigation. Price increases must be paired with strengthened failure‐to‐supply clauses (called the IPS approach) to achieve consistent and significant shortage reduction as well as Pareto improvement. Across all scenarios tested, a 30% price increase under IPS can lead to a minimum, average, and maximum shortage reduction of 25%, 53%, and 70%, respectively. Our analysis also shows the impacts of IPS on different parties in the supply chain and the impacts of various model parameters on shortage mitigation. The IPS approach rewards reliability of drug supply, which is in line with the FDA's strategic plan to reward quality, but is easier to achieve in this regulation‐based industry. Interactions with the government and industry practitioners indicate that IPS also challenges the current mindset in pharmaceutical contracting.
Introduction
Drug shortages have been a major challenge facing the US pharmaceutical industry in recent years. The number of drugs on shortage tripled from 2005 to 2010, reaching 456 in 2012 (FDA 2011, GAO 2014). In the first half of 2011, 99.5% of 820 hospitals surveyed experienced drug shortages, and nearly 50% of the hospitals experienced more than 20 shortages (AHA 2011). Given the average shortage duration of over 9 months (GAO 2011), drug shortages have incurred significant labor cost for shortage management ($216 million annually; Kaakeh et al. 2011) and extra purchasing cost for substitutes ($200 million annually; Cherici et al. 2011a). Since many of the drugs on shortage are medically necessary by the FDA's definition (e.g., pertinent cancer drugs), the shortages have also led to significant social welfare losses in terms of delayed or canceled treatments, suboptimal patient outcomes, longer recovery times, increased patient complaints, and even deaths of patients.
The escalating drug shortages have drawn tremendous attention from healthcare providers, patients, and media, and have spurred an executive order from the President, legislation efforts in Congress, and a special Drug Shortage Program within the FDA. The FDA also encourages researchers to develop models to study drug shortages based on manufacturers’ characteristics and market factors (FDA 2011). In spite of the heightened attention and the vast number of reports, very limited academic literature has been devoted to this problem, and few solutions have been proposed based on rigorous research. This study aims to fill this gap by proposing a solution based on rigorous analysis of the drug supply chain. Our proposal and analysis have been presented to the FDA and the Office of the Assistant Secretary for Planning and Evaluation (ASPE) for discussion.
Causes of Drug Shortages
The current drug shortages primarily concern generic sterile injectable drugs, which account for 80% of the 127 shortage cases studied by the FDA in 2010 and 2011 (FDA 2011). Several characteristics of generic sterile injectable drugs make them vulnerable to shortages. First, these drugs often have low profit margins, as most of them are long off patent. Second, sterile injectable drugs require costly production lines and complex manufacturing processes that are vulnerable to quality problems violating the Current Good Manufacturing Practices (cGMPs). In the case of a cGMPs violation, depending on its severity, drug manufacturers often need to halt the production immediately, fix the problem, and wait for the FDA's inspection and approval to resume production. Some violations may even cause facility shutdowns for a substantial amount of time (FDA 2011).
The combination of low profit margins and complex production processes makes the drugs unappealing to manufacturers, leading to a high market concentration. The top three generic injectable drug manufacturers hold 71% of the entire market, and most sterile injectable drugs have one manufacturer that produces at least 90% of the drug, innovator and generic combined (FDA 2011). Further, although existing production lines can often produce multiple drugs with similar manufacturing characteristics, these sterile injectable drugs often receive low capacity allocation due to their slim margins. Manufacturers may even discontinue their production to seek higher profits from other drugs (GAO 2011).
The above characteristics of sterile injectable drugs result in industry‐wide high capacity utilization, which often implies less time for maintenance, thereby exacerbating the drug supply chain's vulnerability to quality‐related disruptions. For example, Thomas (2012) reports a case where managers order shortcuts that compromise quality and skimp on cleaning to shorten the turnaround time between batches. Such practices increase the chances of quality problems that may force a production shutdown. The high capacity utilization also makes it challenging to respond effectively to disruptions; disruptions that could otherwise be absorbed through a diversion of capacity can lead to cascading and persistent shortages (ASPE 2011, FDA 2011, GAO 2011). As a result, disruptions due to quality problems are linked to 54% of shortages (ASPE 2011), followed by the lack of capacity or other delays (21%) (Piana 2012). Furthermore, the disruption durations are highly significant and uncertain, with an average duration of over 9 months (GAO 2011).
Given that manufacturers lack incentives to maintain sufficient capacity, would they hold sufficient inventory to counter disruptions? Unfortunately, holding sterile injectable drugs is costly, as they require sterile, light‐ and temperature‐regulated storage environments. Meanwhile, failure to meet customer orders incurs very low cost: although most drug purchase contracts include failure‐to‐supply clauses (FTS) that require manufacturers to compensate buyers when failing to supply the drugs, these clauses are often very weak. For example, many contracts only compensate a buyer if the buyer can find the same drug from an alternative source, and the contracts only reimburse the price difference. However, due to the high market concentration, it is very difficult to identify an alternative source during times of shortage. As a result, drug manufacturers, on average, only compensate 10% of buyers’ losses due to FTS (ASPE 2011). Obviously, such weak FTS clauses do not help secure drug supply.
In summary, as GAO (2014) concludes, production disruptions and constrained manufacturing capacity are the key immediate causes of drug shortages, and low profit margins are the key underlying cause (cf. Figure 7 in GAO 2014). Indeed, the low prices provide “no incentive for manufacturers to produce them (the drugs) or invest in the necessary infrastructure to prevent or fix a production problem” (American Society of Clinical Oncology (ASCO) in Piana 2012). However, the weak FTS clauses, overlooked by much literature, are also detrimental, as they disincentivize drug manufacturers from maintaining sufficient inventory to satisfy customer demand.
Our Proposed Approach
Among the different perspectives that have been taken to analyze this problem, one key piece seems missing: the supply chain perspective. The drug shortage problem involves multiple supply chain parties with distinct objectives and unique relationships: while a drug manufacturer aims at maximizing its profit, the government, as the major payer (many of the drugs on shortage are covered by government programs such as Medicare), hopes to maintain its spending while reducing shortages. Healthcare providers are keen to mitigate shortages to reduce suboptimal patient outcomes, but they are also concerned about cost reduction. At the same time, the group purchasing organization (GPO), which represents its healthcare provider members and negotiates the drug purchase contract with the manufacturer, aims to improve its profit. With these different parties, the drug supply chain possesses the unique characteristics: the buyer (the provider) is not the payer (government) or the consumer (patients), the price setter (the GPO in many cases) is not the payer or the buyer or even the consumer, and both the buyer and the payer have social welfare concerns beyond cost considerations. Thus, effective shortage mitigation calls for Pareto‐improving solutions considering all the supply chain parties’ objectives and their unique characteristics.
In this study, we take the supply chain perspective and propose mitigating drug shortages through supply chain contract. As mentioned earlier, in drug purchase contracts, the contract price is often over‐emphasized, whereas the FTS clause seems nominal and is often overlooked. In this study, we propose to consider both price and FTS as key contract parameters to gain a complete understanding of the impact of the contract on shortage mitigation. Note that this impact is influenced by a price‐capacity‐inventory triangular effect. Intuitively, increasing prices can incentivize drug manufacturers to increase capacity. Given that demand is relatively insensitive to price (most of these drugs are medically necessary), the increased capacity would also reduce capacity utilization, improve quality maintenance, and potentially mitigate disruptions and, hence, shortages. In the meantime, increasing prices can also incentivize manufacturers to hold more inventory. However, capacity and inventory are strategic substitutes (cf. Angelus and Porteus 2002, Chao et al. 2009, Allon and Zeevi 2011): increasing capacity may reduce inventory because with sufficient capacity, a manufacturer can easily ramp up production if needed and does not need to keep high inventory levels. Hence, the effectiveness of the contract on shortage mitigation is not straightforward.
To evaluate the effectiveness of the Pareto‐improving contracts, we thoroughly investigate the drug supply chain by employing multiple research methodologies. First, we develop an analytical model of the drug supply chain, which captures all different parties’ objectives and decisions, and incorporates key features of the problem, such as capacity‐dependent disruption probability, uncertain recovery time, and mixed lost sales and backorders. Based on the model, we characterize the impact of the contract parameters on the objectives and explore analytical properties of the Pareto‐improving contracts. Next, by applying the widely‐used strategic decision‐making method of scenario analysis, we develop three major scenarios based on key features of the problem and realistic industry data, and test the effectiveness of our proposal on each scenario. To assure the completeness of our test, we further complement the scenario analysis with a full factorial analysis to cover a wide range of other cases. Further, we discuss our results with the FDA and ASPE staff and industry practitioners, all of whom provide insights on our proposal from various perspectives.
Our study generates several key findings. First, increasing drug prices only (referred to as IP), which has been advocated as a natural solution to the drug shortage problem in response to the current low profit margins, is unfortunately not very effective in mitigating drug shortages. Increasing drug prices must be paired with strengthened FTS clauses (referred to as IPS) to achieve consistent and significant shortage reduction. The effectiveness of this pairing is due to the triangular effect described earlier: an effective shortage mitigation requires a significant price increase to overcome the substitutional effect between capacity and inventory, but the IP approach does not render a large enough Pareto‐improving space for price increase. The IPS approach, on the other hand, adds a significant dimension to resolve this problem and is shown to be much more effective over a wide range of scenarios. For all scenarios tested, a 30% price increase under IPS leads to a minimum, average, and maximum shortage reduction of 25%, 53%, and 70%, respectively.
Related Literature
Our study is related to four streams of literature: (1) drug shortages, (2) pharmaceutical supply chains, (3) supply chain disruptions, and (4) scenario analysis. We next review related studies in each stream.
There have been many government reports and white papers on the state, causes, and measures of drug shortages (e.g., FDA 2011, ASPE 2011, GAO, 2011, 2014, ASHP 2009, AHA 2011, HSCA 2011). Woodcock and Wosinska (2013) discuss the economic and technological drivers of drug shortages. Mcbride et al. (2013) and ASA (2012) survey the consequences of drug shortages on cancer and anesthesia care. Hoffman et al. (2012) conduct case studies on the related expenditures. The FDA has taken measures to mitigate drug shortages. These measures focus on expediting the review of new manufacturing sites, new suppliers, and specification changes, which accounts for 71% of the cases the FDA handles, as well as on strengthening information sharing by manufacturers who may foresee drug supply problems (FDA 2011). FDA (2011) has also called for researchers to quantitatively model and assess the problem. However, academic studies on this topic have been very limited. Yurukoglu et al. (2016) empirically investigate market entry and capacity choice with respect to reimbursement policy change. Many articles in medical journals focus on providing clinical guidelines for alternative drug usage during drug shortages.
The literature on pharmaceutical supply chains is also scarce. For example, Burns (2002) analyzes the key developments and trends in the U.S. healthcare supply chains. Schwarz (2010) describes the flow of products, information, and money in drug supply chains. Iacocca et al. (2013) compare different business models for brand drugs. Schwarz and Zhao (2011) analyze the current situation of pharmaceutical distribution and raise questions for further research. Zhao et al. (2012) investigate brand drug supply chains under two contract models and evaluate the value of information sharing. Gray and colleagues (Gray et al. 2011; Gray and Massimino 2014; Gray et al. 2015, 2016) have examined how pharmaceutical plant location relates to quality performance; Gray et al. (2016) examine pharmaceutical contract manufacturer quality. Dai et al. (2016) study vaccine supply contracts.
As for the stream of research on supply chain disruptions, an extensive body of literature exists (see Gurnani et al. 2012 for a review) with a focus on sourcing strategies to mitigate supply disruption risks. In contrast, our focus is on capturing the impact of production disruptions on drug shortages and various supply chain parties’ objectives. As discussed, the disruptions herein depend on multiple factors that are not modeled in previous literature. For example, many reports qualitatively observe that a higher capacity utilization indicates a higher chance of disruptions due to more congestion and less time for maintenance (e.g., FDA 2011, ASPE 2011). However, quantitatively capturing such a phenomenon is challenging because data related to the relationship between capacity and disruptions are scarce. Based on an approximation, we develop a reliability function that captures the dependence of the disruptions on multiple factors and estimate the function parameters from industry reports.
Finally, to evaluate the effectiveness of our proposal, we adopt the idea of scenario analysis, which has been widely used by businesses and government agencies for strategic planning (Bradfield et al. 2005). Traditionally, scenario analysis usually crafts two to four plausible major scenarios based on hypothetical realizations of key driving forces and then uses these scenarios as references for strategy preparation and evaluation (see, e.g., Schoemaker 1995 and Shell 2008 for details). Our application of scenario analysis differs from the traditional application in several ways. First, the traditional application crafts scenarios based on the uncertainty (and possible outcomes) of key driving forces, while in our study, the effectiveness of a proposal is mainly determined by the variation of key driving forces. For example, since a successful proposal must incentivize drug manufacturers to increase capacity, the cost of capacity adjustment strongly influences the effectiveness of the proposal. This cost varies for drugs with different manufacturing characteristics. Thus, we construct scenarios based on this variation, instead of the uncertainty, of key driving forces. Second, traditionally, the driving forces are often identified via brainstorming or Delphi method, whereas in our research, they are derived from literature and industry practice. Third, traditional scenario analysis faces some criticism for its “subjective and heuristic nature,” which may leave “many academics uncomfortable” (Schoemaker 2004). In our study, by mapping the scenarios to quantitative model parameter values, we evolve the qualitative process to a rigorous quantitative process and obtain objective and rigorous evaluations.
Drug Supply Chain Model
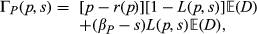
In this section, we model the drug supply chain pertaining to shortages. The supply chain consists of a major drug manufacturer (seller), a group of healthcare providers (buyers) represented by a GPO, and the government, which reimburses the drug through the Medicare program. Central to the supply chain is the purchase contract between the GPO (on behalf of the buyers) and the manufacturer. The contract includes a unit wholesale price p and a failure‐to‐supply (FTS) compensation s to the buyers for each unit of demand the manufacturer cannot satisfy. As discussed, in current practice, FTS compensation is only paid if the buyers are able to obtain the drug from an alternative source. However, the low availability of alternative sources during shortages seriously weakens the compensation. To overcome this limitation, we consider a compensation on each unit of unsatisfied demand. The contract duration is typically 24–36 months (see, e.g., Navarro 2009), denoted by T. Notably, the random demand during the contract duration, denoted by D, does not depend on the contract parameters p and s due to the low price elasticity of demand: many of the drugs in shortage are medically necessary (FDA 2011), and Medicare, instead of the patients, pays for the drugs. Given a purchase contract, we define the drug shortage level, L(p, s), to be the ratio of expected lost sales to the expected demand

In the pharmaceutical industry, a GPO pools healthcare providers’ purchasing volumes to negotiate a favorable contract with the manufacturer. It is therefore more appropriate to consider a group of providers than each individual one. In addition, this model focuses on a single manufacturer and a single GPO, as “most sterile injectables have one manufacturer that produces at least 90% of the drug, innovator and generic combined” (FDA 2011), and and healthcare providers “route most of their purchases through a single national alliance” and “utilize (another) only for specific contracts in limited supply areas” (Burns and Lee 2008, Hu et al. 2012).
Next, we formulate the objective of each supply chain party as a function of the contract parameters (p, s). Although the objectives are affected by many factors, we focus on the most essential factors to capture the major tradeoffs of the problem.
GPO
A GPO mainly gains revenue from two sources. First, a GPO charges a contract administration fee (CAF) from manufacturers as a percentage commission (say, α percent) on sales to GPO members. The CAF is the primary source of a GPO's revenue (Burns 2002). In this study, we consider α as exogenous, since it is decided based on the sales of all drugs; the drugs in shortage, although causing serious consequences, constitute only a small portion of all drugs. Besides the CAF, a GPO also charges a membership fee to each participating healthcare provider. This fee is exogenous, flat, can be viewed as a sunk cost, and is thus not modeled in this study. It is also worth noting that a GPO does not hold any inventory. Thus, given a contract (p,s), the GPO's expected profit is

Drug Manufacturer
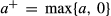
Given a contract (p, s), the drug manufacturer makes two major decisions: the production capacity for the T periods of contract duration and the production/inventory decisions in each of the T periods. In generic drug production, manufacturers often produce multiple drugs with similar manufacturing characteristics on the same production lines and adjust capacity allocation among the drugs based on needs and contracts (Ventola 2011, GAO 2014). We assume that the capacity, once set at the beginning of the contract duration, remains unchanged over all T periods, because the capacity decision is more strategic and of longer term than inventory decisions in nature (cf. Simchi‐Levi et al. 2003, Waters 2006), and the capacity adjustment may require FDA review/approval and is hence time‐consuming (FDA, 2014, 2016b, GPO 2016).
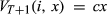
Suppose at the beginning of the contract duration, the manufacturer has an initial capacity of


Government
The government (via programs like Medicare) covers the reimbursement of many drugs on shortage, and bears three types of shortage‐related monetary or social welfare losses that are often much higher than the reimbursement cost. First, the reimbursement cost for alternative drugs or therapies (if any) is usually more expensive than the original drugs, incurring about $200 million extra purchase cost annually (Cherici et al. 2011a). As an example, levoleucovorin, the substitute for the oncology drug leucovorin during its shortage, is nearly 60 times more expensive (Goldberg 2009).
Second, the government must deal with social welfare losses due to suboptimal treatment outcomes. Other than some obvious cases, there has been a lack of consensus in the usage of alternative drugs and a lack of data supporting the effectiveness of alternative drugs (e.g., using doxorubicin in place of liposomal doxorubicin; see Mcbride et al. 2013). The use of substitutes also often leads to suboptimal outcomes. Metzger et al. (2012) estimate that after cyclophosphamide was substituted for mechlorethamine during its shortage, the two‐year event‐free survival for children with Hodgkin's lymphoma dropped from 88% to 75%. In a survey of oncology drug shortages by Mcbride et al. (2013), 48% of respondents reported tumor recurrences, and 40% reported reduced time to death. When there are no candidates for substitutes, drug shortages also cause delayed or canceled treatments. For example, in the aforementioned survey, 93% of institutions reported delays in chemotherapy administration or regimen changes.
Third, the shortages also incur other social welfare losses. For example, during shortages, healthcare providers may have to purchase from other sources that are generally much more expensive, and, in extreme cases, from the gray market (unofficial and unauthorized market). Cherici et al. (2011b) examine 1745 orders filled by the gray market and find an average markup of 650% and a maximum markup of 4533%. Although the government usually does not reimburse drugs purchased from the gray market (healthcare providers or patients often absorb this cost), the gray market has significantly adverse impacts, leading to significant social welfare losses.
Therefore, to fully capture government spending on drug shortages, we must consider both the monetary expenditure on reimbursement and the social welfare losses. Let r(p) represent the unit reimbursement cost for a drug with wholesale price p. For example, Medicare currently reimburses drugs at 6% above their market wholesale prices. Let


By the above discussion, the total government spending under a contract (p, s) is

Healthcare Providers
Healthcare providers buy the drug at the wholesale price p and are reimbursed by Medicare at the reimbursement price r(p). Similar to the government's loss


Sections 3.1–3.4 above have formulated the objectives of the supply chain parties involved. To evaluate these objectives, we need to further analyze the manufacturer's profit under the optimal inventory policy, U(p, s, κ), and the shortage measure, L(p, s).
Inventory and Shortage Analysis
We study the drug manufacturer's optimal inventory policy in section 4.1 and evaluate the shortage measure in section 4.2.
Drug Manufacturer's Optimal Inventory Policy
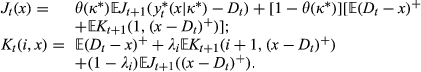
Given a contract (p, s) and a capacity decision κ, the drug manufacturer makes inventory decisions for each of the T periods of contract duration. These decisions must consider production disruptions, which are under the influence of two types of factors: those independent of capacity utilization (e.g., a facility's specific conditions [new or old] and workforce quality assurance training) and those dependent on capacity utilization (e.g., certain aspects of maintenance and cGMPs compliance. For instance, disruptions due to managers ordering shortcuts that compromise quality and skimp on maintenance are certainly related to capacity utilization; Thomas 2012). Since our focus is supply chain analysis, we assume that the capacity‐independent factors are exogenous. In addition, we assume that the capacity‐dependent factors depend on the long‐run average capacity utilization, because a manufacturer's efforts to maintain the desired quality standard (cGMPs) are reflected in its commitment to preventive inspection and maintenance on a regular basis (FDA 2004). This requires the manufacturer to make long‐term maintenance plans based on the average capacity utilization, instead of spontaneous quality efforts based on the constantly changing capacity utilization in each period. Given a capacity κ, the long‐run average capacity utilization is


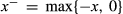
In practice, production disruptions lead to a mixture of backorders and lost sales. Specifically, when the production is normal (not disrupted), unmet demand is often backordered because the expected demand and supply are roughly equal and the manufacturer can mostly satisfy backorders in time. The manufacturer typically informs buyers when they will receive their backorders, and buyers typically accommodate this waiting time. Backorders usually do not cause shortages (Wellman 2001 and Tyler 2002). On the other hand, when the production is disrupted, since the disruption duration is often significant and uncertain, the manufacturer usually cannot quote a time for order delivery. In this case, buyers often resort to alternative sources, treatments, or drugs to meet their needs. Unmet demand is then lost for the manufacturer. Indeed, the survey of ASA (2012) on anesthesia drug shortages finds that 96.3% of anesthesiologists switch to alternative drugs, 50.2% change procedures, 7.0% postpone cases, and 4.1% cancel cases.
With the above discussion, we now describe the sequence of events. The manufacturer starts period t, 1 ≤ t ≤ T, with an initial inventory level x and a production status: normal or disrupted. If the production is normal, the manufacturer chooses a target post‐production inventory level y. The production incurs unit cost c and has a one‐period lead time that reflects the complex manufacturing process. The manufacturer then observes the demand in period t,


If the manufacturer starts period t with an initial inventory x, a production status as disrupted, and the disruption has lasted i periods, then the manufacturer uses the inventory x to satisfy demand


Notation
Under a contract (p, s) and a capacity κ, let 


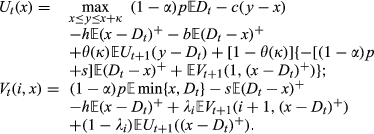
In the expression of 
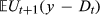

In the expression of 


In period T + 1, the boundary condition is set to be 
With this model, we now derive the structural properties of the optimal inventory decisions:
Given a contract (p, s) and a production capacity κ, the maximand of 


Given a contract (p, s) and a capacity κ, let 


Given a contract (p, s) and a capacity κ, there exists a base‐stock level 
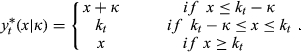
Theorem 1 indicates that the manufacturer should not produce if the inventory level exceeds the base‐stock level 

Without loss of generality, we assume that the manufacturer starts the contract duration with zero initial inventory and normal production. Thus, the manufacturer's expected profit generated by the optimal inventory policy U(p, s, κ) in Equation 2 is simply 
Shortage Measure
This section derives the shortage measure L(p, s). Yurukoglu (2012) accessed the drug shortage website of the American Society of Health System Pharmacists (ASHP) and obtained the fraction of time various drugs were in shortage. However, he pointed out that the weakness of this measure is that it “does not capture the varying magnitudes of shortages.” Our study aims to capture the magnitudes. As discussed in section , backorders that are not the result of production disruptions typically do not cause shortages, whereas lost sales during disruptions often lead to serious consequences. Thus, a critical indicator of drug shortages is the manufacturer's lost sales during production disruptions.
Given a contract (p, s), let 


The boundary condition in period T + 1 is: 
Again assuming that the production is normal and the initial inventory is zero at the beginning of the contract duration, we define the shortage measure as the cumulative lost sales ratio over the contract duration: 

Pareto‐Improving Contracts
In sections 3 and 4, we have formulated the objectives of supply chain parties and derived the shortage measure, all as functions of the contract parameters (p, s). In this section, we explore properties of the Pareto‐improving contracts. Let 


The set of Pareto‐improving contracts is 
To study the Pareto‐improving contracts, we first derive properties of the supply chain measures. Since Medicare currently reimburses drugs at 6% above their market wholesale prices, in this analysis, we consider a reimbursement price r(p) such that r(p + δ) − r(p) ≥ δ, ∀δ > 0. This condition means that when the wholesale price p increases, the reimbursement (retail) price increases by a larger amount, which encompasses Medicare's current policy as a special case. In addition, for generality, in Appendix S3, we also consider a fixed‐price policy (i.e., r(p) = a for some a) that was used by Medicare before 2005.
Next, we characterize the impacts of the contract parameters on supply chain measures


With these properties, we are ready to explore the Pareto‐improving contracts. For a given p, let 


Since Proposition 1 has shown that for any given p, strengthening s reduces the manufacturer's profit but improves all other measures (note that decreasing 


The set of Pareto‐improving contracts is: 
Theorem 2 indicates that among the lower bounds 


The Pareto‐improving contracts serve as a feasible region for contract selection and provide supply chain parties with options and common ground for determining a contract under a specific situation. Notably, for generic drugs, GPOs typically have high bargaining power: the top five GPOs in the U.S. command 85–90% of the market (FDA 2011, ASPE 2011). Thus, we next specify the Pareto‐improving contract when the GPO is the contract designer, that is, the contract that maximizes the GPO's profit.
Let 
In Theorem 3, 


So far, we have derived some properties of the Pareto‐improving contracts. Based on these properties, we next conduct an extensive scenario analysis with realistic industry data to evaluate the effectiveness of our proposal and its impact on the different supply chain parties.
Scenario Analysis
In section 6.1, we construct three important scenarios that correspond to a major portion of the drugs on shortage and then in section 6.2, we transform the scenarios to quantitative decision scenarios. We further discuss our data source and parameter setting in section 6.3 and evaluate our proposal under each scenario in section 6.4. Finally, for greater generality, we complement the three major scenarios by a full factorial analysis of a wide collection of scenarios in section 6.5.
Scenario Construction
We generally follow the procedure suggested by Schoemaker (1995) for the scenario analysis. Based on the scenario‐axes technique (Schwarz 1991, van't Klooster and van Asselt 2006), we aim to identify the driving forces that have the highest impact on the shortages and exhibit considerable variation across the drugs on shortage (as discussed in section 2, variation plays a key role in determining the effectiveness of a proposal). Note that from 2010 to 2014, the therapeutic classes that experienced the most serious shortages included anesthetic, anti‐infective, cardiovascular, nutritive, oncology, and endocrine (ASPE 2011, FDA 2011, GAO 2011, 2014). As discussed in section 1, the root driving forces that differentiate these drugs from other drugs are their low profit margins and special manufacturing characteristics. Since the profit margins are already captured in the contract parameters, manufacturing characteristics seem to be the proper criterion for scenario construction. With respect to this criterion, the drugs in the therapeutic classes with critical shortages naturally fall into three scenarios.
The low‐adjustability scenario (L‐scenario). This scenario typically fits sterile drugs that require highly specialized or even dedicated facilities, including, for example, some anti‐infective and oncology drugs. The production of these drugs must take place in “clean room” environments with well‐defined manufacturing processes and controls. The production often requires a complex, specialized process of aseptic processing and terminal sterilization. Some drugs requires additional lyophilization (Woodcock and Wosinska 2013). Certain drugs, such as penicillin (anti‐infective), are “highly sensitizing and can trigger serious allergic reactions at very low levels and as a result, may be limited to specific manufacturing lines” (GAO 2014). Examples of other drugs that require highly specialized lines include cephalosporins (antibiotics) and some cytotoxics (oncology) (Woodcock and Wosinska 2013). Thus, for the drugs in the L‐scenario, changing capacity usually incurs a high cost (e.g., involving complex reconfiguration of lines, deep cleaning, and substantial effort to assure the cGMPs). However, once the capacity is increased to a sufficient level, many of the currently observed disruptions, such as contaminations from microorganisms and visible particulate matter, can be significantly mitigated. Thus, the cost and the gain from capacity adjustment often have a positive relationship: the higher the cost, the less likely the drug manufacturer has already adjusted the capacity to a desirable level to mitigate disruptions, and the more likely a significant reliability improvement will occur once capacity adjustment is stimulated by a proposal. The low‐adjustability scenario then corresponds to high cost and high gain.
The medium‐adjustability scenario (M‐scenario). This scenario applies to sterile drugs that require moderately specialized facilities, including, for example, some anesthetic, cardiovascular, nutritive, and endocrine metabolic drugs. These drugs still require the complex aseptic processing and sterilization, but they share the production lines with other drugs with similar manufacturing characteristics. The production of multiple drugs on the same lines (via different batches) is common in practice (Ventola 2011). In an example from GAO (2014), 30–50 different drugs are manufactured on a given line. Changing the capacity of these drugs requires the reallocation of the line capacity, certain cleaning, and reconfiguration. However, the cost and gain from changing the capacity are often lower than the highly specialized line case in the L‐scenario.
The high‐adjustability scenario (H‐scenario). This scenario mostly includes orally‐administered drugs, which require much less specialized facilities and less complex processing (from 2011 to 2013, orally‐administered drugs represented 27% of the shortages, GAO 2014). These drugs often share production lines with other drugs, and the capacity adjustment is less costly (although still costly compared with the drugs without serious shortage issues). However, because of the low capacity adjustment cost, the capacity may have already been at a reasonable level, meaning a relatively low gain in reliability from the capacity adjustment.
The above three scenarios correspond to three distinct types of manufacturing characteristics, which, together with the contract parameters, capture the key driving forces of the problem. Next, we translate these scenarios to quantitative decision scenarios for evaluating our proposal.
Evolving Toward Decision Scenarios
In line with Schoemaker (1995), after constructing narrative scenarios, we need to translate them to decision scenarios to quantitatively test our strategies and gain insights. We do this by mapping the three scenarios to different sets of parameter values in the previously developed supply chain model. As discussed, the three scenarios mainly differ in the cost and gain (reliability improvement) from capacity adjustment, for which we provide further details next.
Capacity Adjustment Cost
As discussed in section 3.2, given a contract, the manufacturer adjusts its capacity from 


Capacity Adjustment Gain: Estimation of Reliability Function
The second critical difference among the scenarios is the impact of capacity adjustment on disruption mitigation. As discussed, capturing the exact relationship between the capacity and disruption probability is very difficult. Fortunately, as in all scenario analyses where approximation is often used for future projection, we have developed the following approximation to estimate the reliability function (definition in section 4.1) based on a simple model and the data from industry reports and previous research.
In each period, the manufacturer's production can be either normal or disrupted. Following a common assumption in literature (cf. Chapter 9 in Ross 2014), we assume that the normal production duration (time until disruption, or up time) follows an exponential distribution with mean γ(κ) under a given capacity κ. By the memoryless property of exponential distribution, the reliability (the probability that no disruption occurs in a period) is then the probability that the system up‐time lasts longer than one period, that is, 


Next, we estimate the distribution of the disruption duration (down time) based on the data in GAO (2011). The data well fit an exponential distribution with a mean of 9 months (see more details in Appendix S8). Thus, given that the production is disrupted in a period, the production recovers in the next period with probability 

Now we are ready to obtain some estimates of the parameters 


Further estimation of 


Data Source and Parameter Setting
Data used in the analysis come from the following three sources: SEER 18 and SEER‐Medicare Link, two premium research databases on cancer treatments maintained by National Cancer Institute. SEER 18 provides data on cancer patients’ demographic characteristics and drugs used in treatments, from which we estimate the demand parameters. SEER‐Medicare Link provides data related to cancer drug reimbursement, from which we estimate the original and substitute drug prices and substitution rate. Data derived from white papers, industrial reports, academic research, etc., as detailed later. In addition, for the parameters that are unavailable from databases and reports, unattainable from industry (non‐existent or confidential, e.g., capacity and its impact on disruptions), or different from drug to drug (e.g., production cost), for generality, we test multiple levels of these parameters in a wide collection of scenarios in our scenario and full factorial analysis.
We next provide details on our parameter setting.
Contract Parameters
We set the contract duration to be 2 years or T = 24 months, a typical contract length in practice (cf. the discussion on page 382 of Navarro 2009). For the current contract (as a benchmark for the proposed contracts), we normalize the price to 


Demand Parameters
Since the generic drugs under investigation typically have been on the market for a long time with relatively steady demand distributions, we assume that the demands in each period, 
Cost Parameters
We assume that the unit monthly holding cost is h = 3, and the unit monthly backorder cost is b = 4. The 3% monthly (or 36% annually) holding cost factor is consistent with the high cost of storing sterile injectable drugs, which requires sterile, light‐ and temperature‐regulated environments. Based on our interactions with the industry, we learn that the unit production cost often varies from 20% to 60% of the contract price for different generic drugs on shortage. In our scenario analysis, we first set the unit production cost to the average value, c = 40. We then broaden our coverage by testing three levels, c = 20, 40, 60, for drugs with low, medium, or high production cost in the factorial analysis. In fact, our analysis shows that the effectiveness of the proposed contracts does not vary significantly with the production cost.
GPO Commission
The GPO charges a percentage commission, α, to the manufacturer for sales to the GPO's members. The “safe harbor” provisions of the 1987 amendment nominally limit α to 3%. Since GPOs have high bargaining power, we assume α = 3% in this analysis.
Proposal Evaluation under the Three Major Scenarios
We are now ready to evaluate the proposed solution. In this evaluation, we discuss the results under the M‐scenario in detail since it corresponds to a large class of drugs. We also briefly discuss the corresponding results under the L‐ and H‐scenarios, since the results in all scenarios are similar qualitatively but differ somewhat in quantity, as reported later.
We first demonstrate the set of Pareto‐improving contracts. In Figure 1, the shaded region shows the Pareto‐improving contracts under the M‐scenario. The horizontal axis represents the contract price as multiples of the current price 


Pareto‐Improving Contracts
Figure 1 shows that in some Pareto‐improving contracts, s may be 50 times the original drug price, which appears difficult to implement. Similarly, since government spending is sensitive to price increase, doubling the price may also cause concerns. For demonstration, we restrict the price increase to 30% of the original price (i.e., 
Pareto Triangle Curves [Color figure can be viewed at
Specifically, Figure 2a shows the Pareto triangle. As predicted in Lemma 2, the manufacturer's iso‐profit curve 


The Pareto triangle contains all implementable Pareto‐improving contracts. To select a specific contract for demonstration, we again focus on the GPO‐designed contract. As the GPO's profit 

Note that similar results and patterns hold under the L‐ and H‐scenarios. We thus omit the details therein and summarize the shortage mitigation under the three scenarios. We find that our proposal of IPS can reduce the drug shortages by 60%, 58%, and 52% in the L‐, M‐, and H‐scenarios, respectively. Thus, the proposal is very effective and robust. Interestingly, the shortage reduction in the low‐adjustability scenario is even more significant than the other two scenarios. This is due to the complementary effect between the cost and gain from capacity adjustment, which will be detailed in section 6.5. This result is of considerable practical importance because the drugs with low‐adjustable capacities often present the most severe shortages.
Full Factorial Analysis for Other Scenarios
The above scenario analysis tests our proposal under three major scenarios, which are derived from industry practice and capture a wide variety of drugs on shortage. However, under rarer situations, some drugs may have high cost and low gain, or low cost and high gain from capacity adjustment, which are not captured in the three scenarios. Thus, for greater generality, we complement the scenario analysis with a full factorial analysis, where we permutate parameter values to test a wider collection of scenarios. Specifically, we test three parameters for multiple levels: g = 1000, 2000, 3000, 


We examine the shortage reductions in all of the 27 scenarios. We find that across all scenarios, the 30% price increase leads to a minimum, average, and maximum shortage reduction of 25%, 53%, and 70%. Clearly, the worst (best) shortage reduction 25% (70%) appears when the capacity adjustment cost is very high (low) but reliability improvement is very low (high). Appendix S10 presents details of the shortage mitigation results.
In addition, to understand what parameters have significant impacts on the shortage mitigation, we further conduct an ANOVA of the shortage mitigation results. The ANOVA identifies three terms with significant influence: g, 


Finally, as a demonstrative example, we apply our solution to a specific oncology drug, leucovorin, whose shortages have been highly influential. We collect the demand, price and reimbursement data on this drug, fine‐tune the model parameters, and evaluate our solution. As a result, our solution recommends increasing the price by 30%, from 89.4 cents to $1.16 for a 50‐mg vial, and increasing the FTS penalty from about 1 cent to $4.04 (roughly 3.5 times the drug price). These changes will reduce the shortages by 60.3%. In comparison, only increasing the price to $1.16 without increasing the FTS penalty can reduce the shortages by 12.8%. This example again shows the effectiveness of our solution. Appendix S10 provides more details of this example.
Government Spending and Policy Implication
Although not directly involved in the negotiation of drug purchase contracts, the government, as a payer, may have significant impacts on the contracts through policies (e.g., reimbursement policy). In this section, we derive additional insights on the impact of our proposal on government spending.
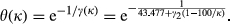
We focus on the Pareto‐improving contracts that minimize government spending under Medicare's current reimbursement policy, r(p) = 1.06p, and under the M‐scenario for illustration (other scenarios exhibit similar patterns). Since government spending decreases in s (Proposition 1), minimizing the spending entails selecting contracts on the upper curve of the Pareto‐improving region, 


Price Minimizing Government Spending
Notes. The current price 


In addition, to demonstrate the robustness of the IPS solution, we further examine the price range that reduces government spending from the current contract for different values of 


Ending Remarks
Drug shortages have posed significant public health threats in recent years. Addressing the problem remains a top priority for the FDA, and a focus of attention of government agencies such as the ASPE and the Government Accountability Office (GAO) and organizations such as the ASCO. As one of the very few academic studies examining the drug shortage problem, our research takes a supply chain perspective, a piece that is currently missing in the literature, and proposes to mitigate shortages through supply chain contracts. By modeling the unique characteristics of the drug supply chain, we investigate the Pareto‐improving contracts that mitigate drug shortages, improve the manufacturer's profit, cut government spending and providers’ cost, and ensure the GPO's profit. We explore analytical properties of these contracts and show their effectiveness in shortage mitigation through scenario analysis based on realistic industry data. Our results suggest an important implication: increasing price only (IP), implied by many (e.g., ASCO in Piana 2012) as a natural cure for the drug shortage problem, is not very effective in shortage mitigation. Rather, increased price must be paired with strengthened FTS compensation to achieve very effective shortage reduction. This is because IP does not provide sufficient Pareto‐improving space to counter the substitutional effect between capacity and inventory when price increases. Our analysis provides the range of effective price and FTS values under a wide collection of scenarios and the corresponding optimal production/inventory policies for drug manufacturers.
Throughout our research, we have actively pursued interactions with government agencies and industry practitioners. We made a presentation to key staff of the FDA and ASPE in the U.S. Department of Health and Human Services, who later presented our proposal in the national ASHP/Pew drug shortage stakeholders’ meeting and helped us to connect with industry practitioners (GPO) to discuss the potential of implementation. We also made connections with manufacturers interested in our proposal through industry forums. These interactions help us not only to improve our model and analysis but also to obtain additional insights.
As advocated in the FDA's Strategic Plan for Preventing and Mitigating Drug Shortages (FDA 2013), one important aspect of preventing and mitigating drug shortages is to be able to reward quality/reliability. In the pharmaceutical industry, while differentiating product quality is often difficult since all marketed drugs are supposed to have met the same quality standards, rewarding reliability of drug supply, “an important, but largely unrecognized aspect of quality” (Woodcock and Wosinska 2013), is much easier to implement. It could be argued that shortcuts may be taken to meet a deadline that may hurt quality, as in the aforementioned case discussed in Thomas (2012). Anand et al. (2012) provide logic that quality requires constant attention; and other pressures may distract from this. To the extent though that manufacturers understand that attention to compliance with quality will result in better reliability, our proposal of IPS provides the right incentives. It does so by granting a higher reward (i.e., lower FTS penalty) to manufacturers who are able to provide a more reliable drug supply (or fewer manufacturing disruptions). Our quantitative analysis also confirms the effectiveness of this approach.
While the government is an integral part of the drug shortage problem, drug purchase contracts are between the manufacturer and the GPO, which are naturally profit‐aiming entities. The FDA always encourages achieving desirable results through financial incentives, which is also the focus of this study. While increasing prices to secure supply may be common in many industries, it seems to be an “intriguing” concept for the pharmaceutical industry (particularly for buyers represented by GPOs) because: (1) the leaders of the industry, brand drug manufacturers, almost never run into shortages due to high profitability; (2) generic drugs may have insufficient supply due to low profitability, but the prices of these drugs are largely influenced by GPOs, which are often concerned about price increases since their function is to pool demand for lower prices. Indeed, while price increase is considered an immediate cost to buyers, more reliable supply is a long‐term benefit. Our proposal calls for buyers’ willingness to pay a higher price to hedge against future uncertainty. While this is a difficult task for GPOs which, in the current system, are largely evaluated by prices but not explicitly penalized by supply shortage, it is critical that GPOs take the responsibility to convince buyers about the tradeoff between the short‐term cost and long‐term benefit in order to implement our proposal to address the shortage problem. We believe our quantitative analysis and the potential benefit demonstrated in the analysis help with this task and contribute to the advancement of drug purchase contracting.
While we believe our study captures the major tradeoffs in the drug shortage problem, we have made some simplifying assumptions as laid out in the study and used mean values and industry norms to estimate a few parameters. With the FDA striving to improve data sharing across the drug supply chain, an updated evaluation with future data would be helpful to refine the effect of the proposal. It is also worth noting that our proposal is most useful for drugs prone to shortages and those whose shortages cause significant losses. Our analysis does not intend to cover all drugs. For example, most brand drugs and orally‐administered drugs (whose shortages are uncommon due to high profit margins or less complex manufacturing processes) and drugs that are not medically necessary or have inexpensive substitutes are not the target of our proposal. Finally, although we focus on the specific context of drug shortages (see the discussion of context‐specific industry studies in Joglekar et al. 2016), our analysis provides a possible framework for industries where product shortages adversely impact social welfare. These industries are very different from those where the main theme is revenue management rather than shortage mitigation.
Footnotes
Acknowledgments
We are grateful to Aaron Yao for providing support and access to medical and reimbursement data. We express our gratitude to the staff of FDA and ASPE for their valuable comments and suggestions. We sincerely thank the department editor, Nitin Joglekar, the senior editor, and the two anonymous referees who helped improve this study immensely. The first author gratefully acknowledges support from the Doug and Maria DeVos Faculty Summer Research Award at Purdue University.