
Abstract
Malaria is a major health concern for many developing countries. Designing strategies for efficient distribution of malaria medications, such as Artemesinin Combination Therapies, is a key challenge in resource constrained countries. This paper develops a solution methodology that integrates strategic‐level and tactical‐level models to better manage pharmaceutical distribution through a three‐tier centralized health system, which is common to sub‐Saharan African countries. At the strategic level, we develop a two‐stage stochastic programming approach to address the problem of demand uncertainty. In the first stage, an initial round of shipments is sent before the malaria season to each local clinic from district hospitals, which receive medications from regional warehouses. After the malaria season begins, a recourse action is triggered to avoid shortages in the form of (i) lateral transshipment or (ii) delayed shipment. The optimal solutions developed by the strategic model identify small clinic clusters possessing exclusive transshipment policies. Therefore, we decompose the problem at the tactical level, solving each clinic cluster independently using a Markov decision process approach to determine optimal periodic transshipment policies. A case study of our proposed distribution system is performed for 290 facilities controlled by the Malawi Ministry of Health. Numerical analysis of Malawi's distribution system indicates that our proposed cluster‐based decomposition method could near optimally reduce shortage incidents. Moreover, such an approach is robust to challenges of developing countries such as slow paper‐based inventory review, uncertain transportation infrastructure, the need for equitable distribution, and seasonal and correlated demand associated with malaria transmission dynamics.
Keywords
Introduction
Due to a combination of intense poverty and environmental and local weather conditions, Malawi suffers from an exceptionally high burden of malaria. Dzinjalamala (2009) indicates that all Malawians live at year round risk for malaria, although incidence peaks during the December–May rainy season. The World Health Organization (WHO) (2014) estimated that at least a third of all medical consultations are malaria related and a recent Malaria Indicator Survey showed that more than a third of all Malawians test positive for recent infections at any given time (see Malawi Ministry of Health 2012). Malaria spending makes up a major portion of total expenditures on health in Malawi, crowding out spending on other conditions. Despite decades of elimination and control efforts, malaria remains one of the most common causes of child morbidity and mortality worldwide. According to the WHO, there were nearly 207 million suspected malaria cases in 2012. In addition to imposing an immense burden on health and welfare, malaria is a major impediment to the economic development of impoverished nations (see Gallup and Sachs 2001, Malaney et al. 2004). Thus, for the past decade, malaria control and elimination have been a priority for international and domestic health agencies, non‐governmental organizations (NGOs), and health ministries. Malaria is a treatable disease, and prompt administration of medicines for uncomplicated malaria such as Artemesinin Combination Therapies (ACTs) can prevent the most severe outcomes. However, stock outs of essential medications are common in developing countries, particularly those facing disproportionate malaria burdens (see PMI 2014, Sudoi et al. 2012). Problems in regional supply chains have been noted as a major barrier to timely and efficient distribution of malaria medications to meet local demand (see Bateman 2013, Daniel et al. 2012, Tetteh 2009).
Malawi's Existing Health System
Malawi's public health system is a three‐tiered network consisting of central warehouses and regional hospitals in the first tier, district hospitals in the second tier, and primary health centers and local community clinics in the third tier. Each tier receives supplies from and answers to the tier above it with the exception of the central warehouses and regional hospitals which answer directly to the Ministry of Health, see Figure 1. Distribution of pharmaceuticals begins at the Central Medical Stores (CMS) in Lilongwe, Malawi, which allocate drugs to the regional hospitals and central warehouses (first tier). First tier distribution then delivers to district hospitals, which are in turn responsible for supplying primary health centers and local community clinics.
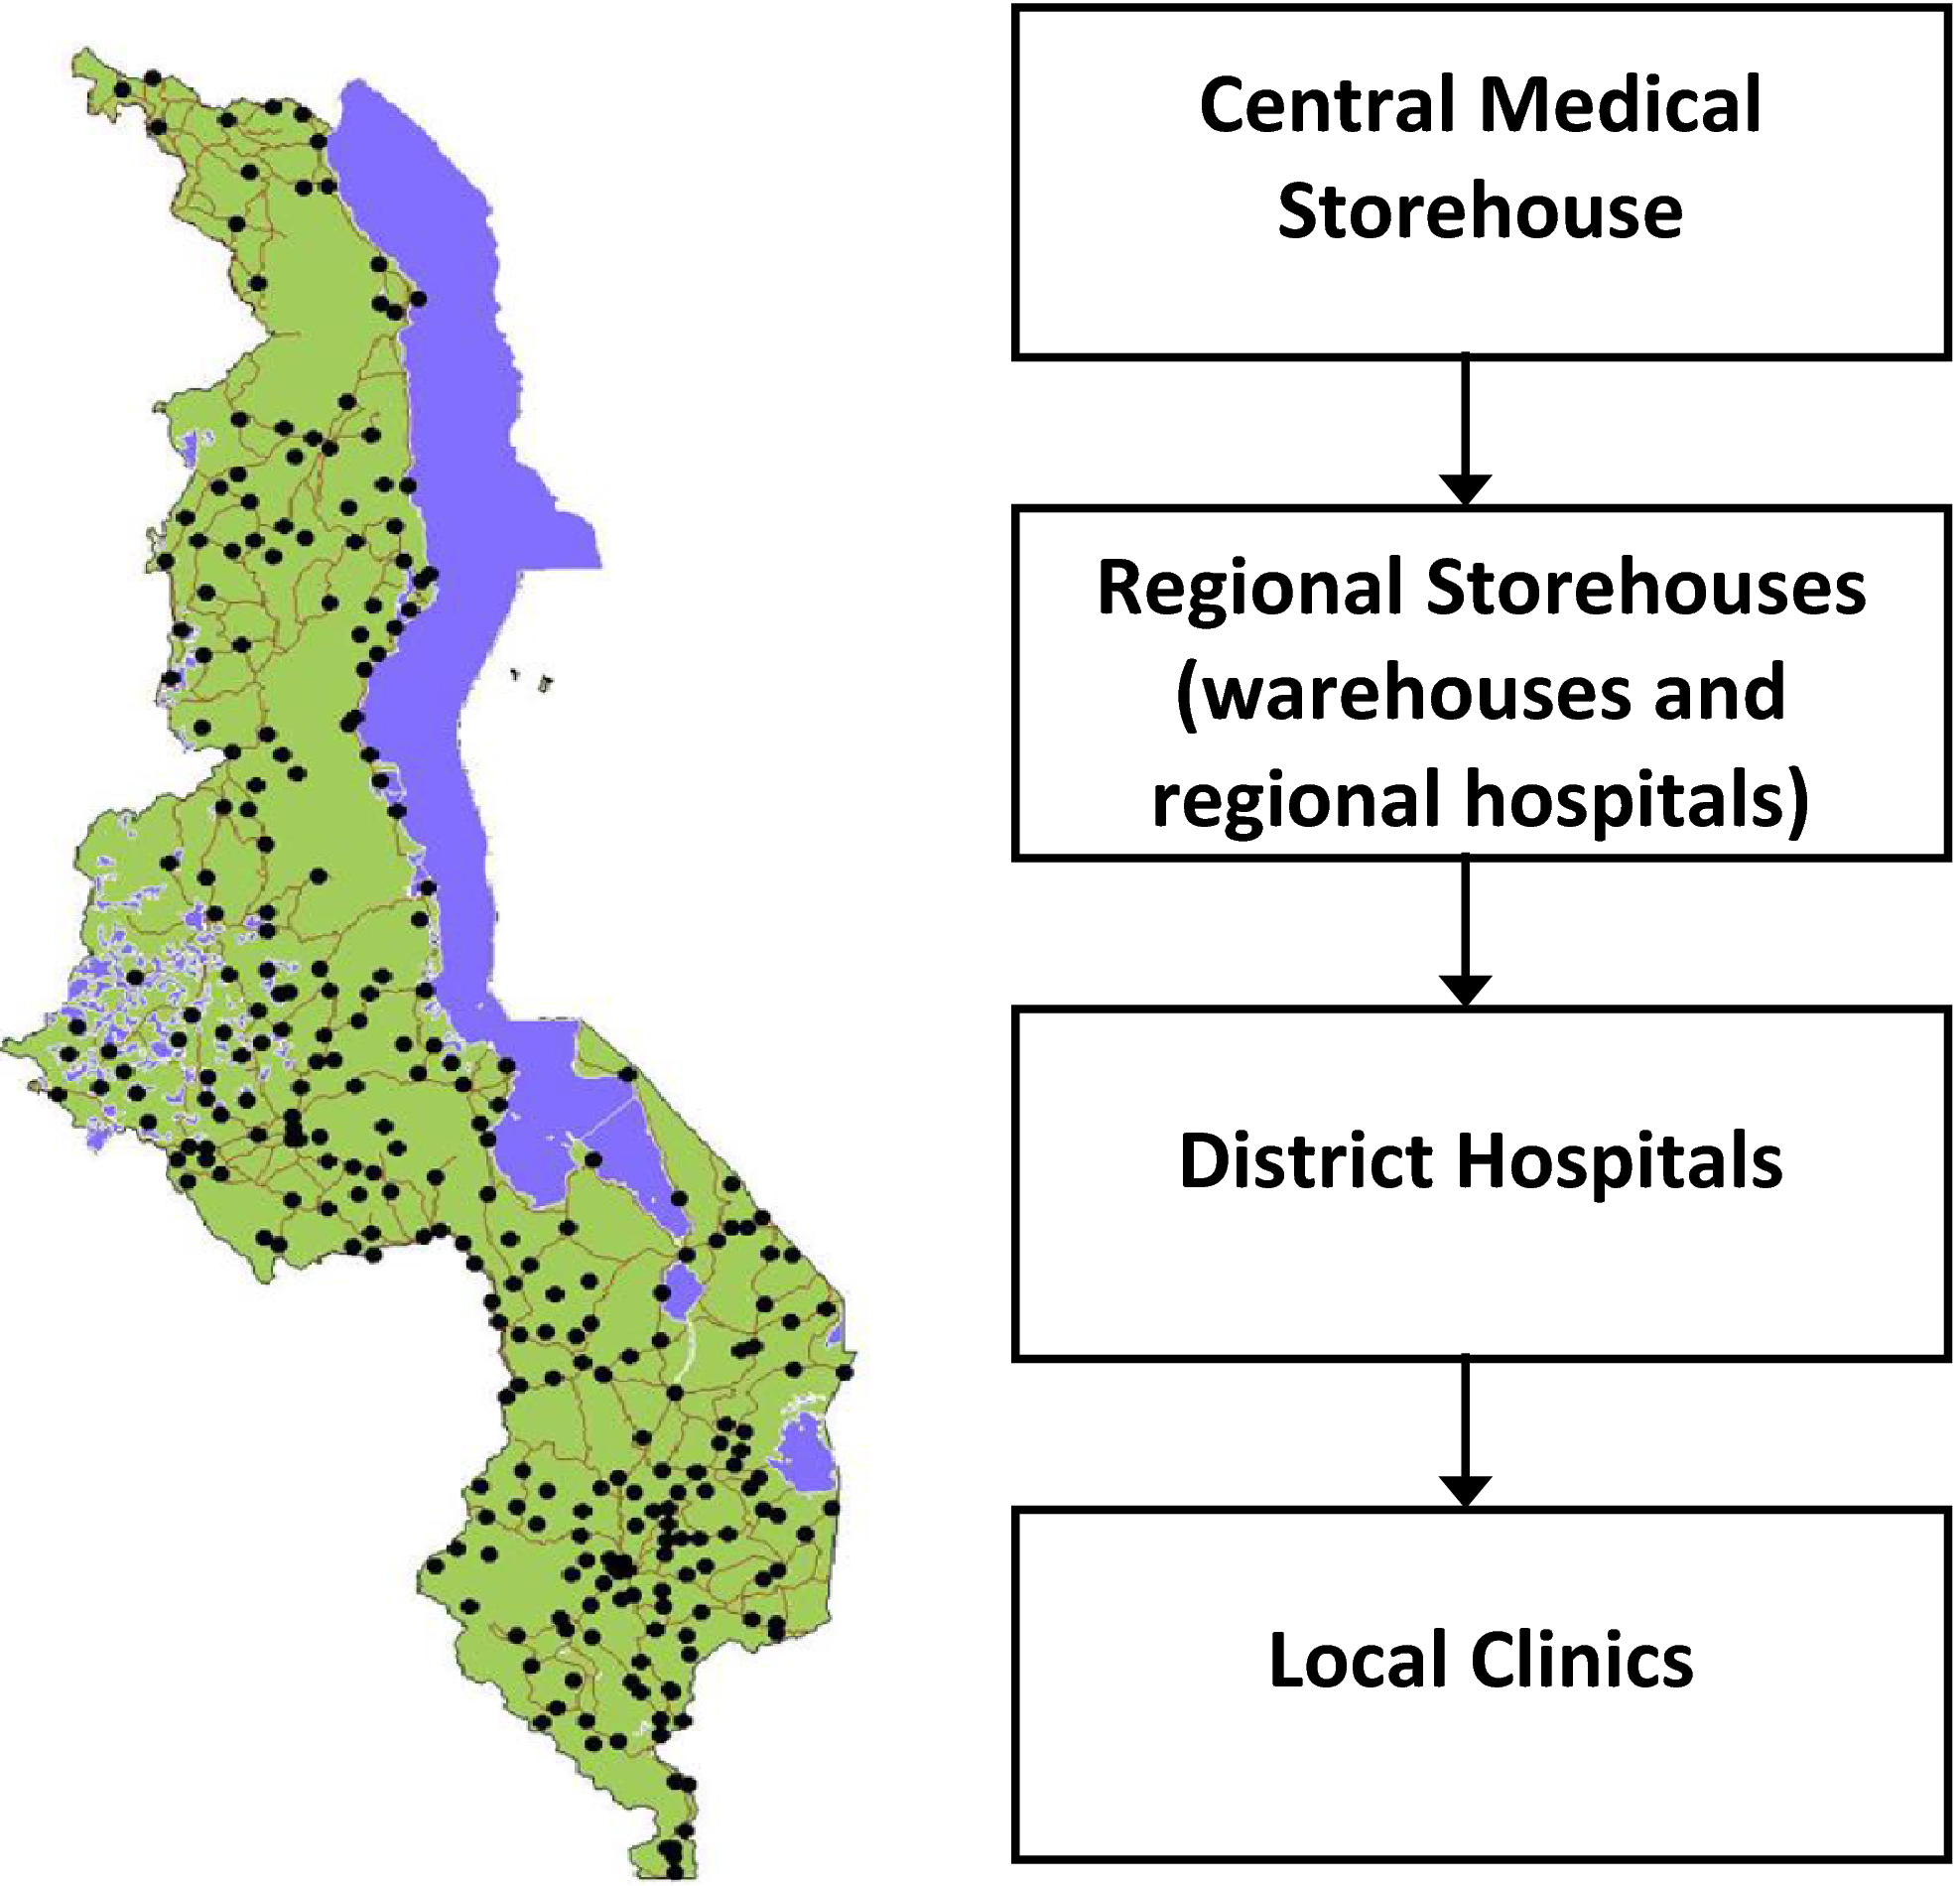
Malaria Pharmaceutical Distribution Network in Malawi [Color figure can be viewed at
In this paper, we employ stochastic programming and Markov decision models to optimize distribution approaches and significantly decrease treatment shortage while limiting transportation costs.
Operational Challenges
Foster (1991) claims that: (i) proper inventory management of medications in Africa can reduce costs by 15%–20% and (ii) transportation of drugs and medical aid is an especially critical factor in Africa. According to Claeson and Waldman (2000), the efficacy of delivering health care through such systems has been the subject of debate for decades. Underdeveloped health systems that rely on centralized and hierarchical supply chains with a central authority acting as primary distributor of goods can suffer from many problems.
Transportation infrastructure is generally poor, fuel shortages complicate matters and roads are often in bad condition, especially during the rainy season, when malaria is most prevalent. Cultural issues and regional rivalries lead to inequities in access and supply. This observation is based on one co‐author's on the ground experience working with malaria in Malawi.
Some research has focused on strategies that circumvent, replace, or radically decentralize public health systems, for example, Gallien et al. (2012); however, government sponsored distribution systems remain the most prominent source of medications in most developing countries, including Malawi and nearly all sub‐Saharan African countries.
In this paper, we explore transportation schemes that combine both strategic and tactical level operations to increase the effectiveness of ACT distribution channels within the public, centralized supply chain of Malawi. While we study a centralized government supply chain, these methods can also be applied to other problems concerning the distribution supply chains for pharmaceutical products outside of the public sector, such as those of the NGOs like John Snow Inc (see
Literature Review
Literature from a number of areas is relevant to this paper, including (i) global health and humanitarian response literature, and (ii) transshipment and multi‐echelon distribution models. In our model, we consider a two‐stage response in the distribution of medical supplies (as in disaster preparedness) as well as dynamic periodic lateral (bidirectional) transshipment decisions among clinics (the lowest echelon) based on small clusters of nearby clinics that are identified by the higher level two‐stage model. Our context is distinguished by characteristics that include: a centralized distribution system, three echelons and a network of almost 300 stockpoints, non‐stationary demand by month, lost unfilled demand, and heterogeneous shipping cost parameters enabling distances and road conditions to be incorporated in the model.
Global Health and Humanitarian Operations
Emergency response research tends to focus on broad public health needs that must be addressed in a rapid and targeted manner after a period of prior planning, often involving inventory prepositioning. Published research regarding disaster preparedness and emergency response is extensive and has been well documented by several survey papers, including Altay and Green (2006), Simpson and Hancock (2009), and de la Torre et al. (2011).
Particularly relevant to our methodology are emergency response models that employ two‐stage stochastic programming. These approaches involve an initial allocation of resources before a disaster and subsequent transportation to affected locations after a large emergency event (see e.g., Mete and Zabinsky 2010, Salmerón and Apte 2010).
Models of disaster preparedness and emergency response share similarities with our work; however, they typically involve rare events with unknown timing that require a rapid response. The global health operations literature generally encompasses a broader perspective. Kraiselburd and Yadav (2013) claims that global health supply chains suffer due to lack of coordination between entities, competing and/or myopic objectives, and poor supply chain design. Our paper touches on these areas specifically with respect to analysis and improvement of ongoing supply chain operations. Recent work has begun to make the distinction between ongoing and emergency operations in global health, including Stauffer et al. (2016), that implements a stochastic programming model to balance objectives from both perspectives. Jahre et al. (2016) also considers ongoing operations and is complementary to our work as the authors consider positioning of global warehouses and distribution network construction. Our work functions on ongoing operations within the context of an existing network. To place our work within the public‐sector supply chain context, we note that Yadav (2007) provides a framework for public‐sector supply chains involving: registration, selection, procurement, distribution, and delivery. We specifically study the area of distribution and delivery.
From a funding standpoint, both Gallien et al. (2016) and Natarajan and Swaminathan (2014) consider the impact of funding disbursement on the effectiveness of prevention and treatment programs, particularly in Africa. Gallien et al. (2016) finds that effective (frequent) monitoring of resource usage and using cash buffers rather than regional stock buffers can improve performance. While we do not directly study funding mechanisms, we do analyze the impact of different levels of funding on supply chain performance. Other mechanisms that affect the delivery of humanitarian operations include earmarked funding, Besiou et al. (2014), and armed conflict, Jola‐Sanchez et al. (2016). In the case of Malawi, the latter has never been a major issue and the former does not have much impact on malaria medication distribution, but nonetheless are important to consider in the broader context of global health operations.
Transshipment and Multi‐Echelon Distribution Models
Our work also contributes to the area of transshipment research. Paterson et al. (2011) provides a comprehensive survey of transshipment, identifying areas where additional research is particularly needed. Among multiple areas in need of development, they cite the following three: (i) using transshipment to proactively redistribute/balance the stock with multiple transshipment epochs, (ii) further work on larger numbers of locations (rather than the typical two or three), and (iii) larger networks with three or more echelons. As will be seen, our paper addresses these areas of need through a combination of modeling, theoretical analysis, and numerical analysis.
Traditionally, the literature on transshipment has generally addressed problems with only two retailers in analytical approaches for tractability (see Paterson et al. 2011 for references). Most of the literature assumes infinite capacity for replenishment, although some papers model a finite supply or production capacity. In our setting, the total amount of medication available is restricted, having been donated or sold to the country in large up‐front lots—the method preferred by the ministry. Thus, replenishment costs are limited to the cost of shipment or transshipment.
A multi‐period, multi‐location approach is taken in Robinson (1990), and it shares a number of features with our model, such as multiple retailers in a multistage optimization setting with random demand and either backlogging or lost sales. A key feature of this analysis is time‐stationarity of the model at each period, which is not an appropriate approximation for our setting. We consider non‐stationary demand distributions over time; therefore, the control policies become more complex, in part because the multi‐period solution does not reduce to a single‐period solution. Furthermore, the Markov decision process (MDP) approach taken by this paper would be intractable for our 290 facilities; however, we use the optimal solution of our strategic stochastic program to decompose the network into small clinic clusters. The resulting cluster‐level transshipment problems are solvable by MDP. We use the cluster transshipment policies determined via the MDP to derive operational insights. These include a strong characterization of optimal policies having a threshold structure and performing rebalancing above the threshold.
Herer et al. (2006) extends the multi‐period, multi‐location work of Robinson (1990), and it differs from our work in ways that include maintaining a stationary model, and allowing backordering; it also assumes replenishment from a central supplier in every period. Rosales et al. (2013) provides a model consisting of two retailers and uses simulation to study the impact of model parameters (e.g., cost, lead‐time, and demand uncertainty) on both a transshipment model and an allocation system structure—shipment from a centralized depot. This work also addresses the issue of geographical demand correlation, which often is raised in practical settings. As intuition would suggest, positive correlation in demand across suppliers reduces the benefits of transshipment. Intuition and experience with malaria and its mechanisms suggest that positive correlations can be expected across clinics close to each other, captured in both our stochastic programming and MDP models.
Rottkemper et al. (2012) provides a mixed‐integer programming approach to minimize a shortage and operational costs under demand uncertainty in the context of humanitarian operations. They use data from clinics in Kayanza province in Burundi to illustrate the effectiveness of their approach. Since the size of our problem is much larger, we construct a more scalable approach. Our paper aligns with Rottkemper et al. (2012) in demonstrating that transshipments can significantly reduce the unsatisfied demand at slightly increased overall cost. In addition, we argue that allowing transshipment actions can result in higher robustness against poor road conditions—an inherent characteristic of distribution problems in the developing world.
A main modeling contribution to the transshipment literature is the integration of both the strategic and tactical levels by combining a stochastic programming approach with a MDP approach. Previous work tends to consider one or the other. This integration is facilitated by the identification and use of the special geographical clinic clustering structure resulting from the optimal solution of the strategic model to decompose the country‐wide distribution problem into tractable subproblems that could be solved using MDP.
Other contributions stem from the unique features of our application area: distribution of pharmaceuticals in the developing world. First, the situation in this problem differs from conventional inventory models which tacitly assume an environment of ongoing production and consumption. However, in very poor countries such as Malawi, pharmaceutical supplies are often donated annually in advance of that year's malaria season with mid‐season replenishment being uncommon. This lack of ongoing and predictable supply causes distribution and transshipment to behave differently from traditional contexts. Second, we analyze equitable solutions addressing perceived fairness, which is not typically a consideration in traditional transshipment literature. Third, we capture the impact of geographically and temporally correlated demand and seasonality of demand reflecting the characteristics of malaria. Fourth, we explore the impact of transshipment frequency, which is important because many developing world clinics use time consuming paper‐based inventory systems and cannot engage in near‐continuous review that electronic monitoring systems prevalent in retail and warehousing would allow. Fifth, we explore the impact of poor road conditions along certain transportation routes that are common, particularly during the rainy season (and consequently the peak malaria season), when roads can get washed out.
Strategic Optimization Model for Medication Distribution in a Public‐Sector Supply Chain
In this section, we develop a strategic‐level optimization for distributing malaria medications throughout a centralized, national distribution network. We first present a baseline that performs all distribution up front and has no recourse mechanism to adapt to randomness in the demand. This baseline is similar to the current state of distribution policies in many developing countries. We then present two recourse models that represent operational innovations that can better help the centralized public sector supply chain react to uncertainty: delayed shipment and transshipment. Each model has benefits and drawbacks, but both should be potentially implementable without significant additional investment.
Baseline Model without Recourse
To demonstrate the effectiveness of incorporating demand uncertainty in distribution decisions, we first define a “baseline” model as a surrogate for the current state of ACT distribution in Malawi. Note that this baseline model already represents an optimization with respect to the current practice. However, it is naive in the sense it makes all transshipment decisions before demand is realized by minimizing expected transportation costs and shortage penalties without any real time updates and recourse actions. Specifically, the model assume knowledge of future demand scenarios and their probabilities, but cannot react to any particular realization. Notation for all the distribution models that follow is given in Table 1.
Distribution Model Notation
The main decision variable in the baseline model, x
ij
, corresponds to the number of malaria treatments transported on arc (i, j). All distribution decisions are made at the same time based on an historical estimate of demand. An auxiliary variable, 

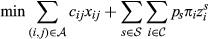
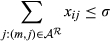
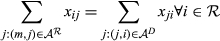
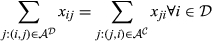
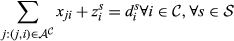
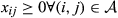
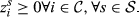
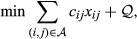
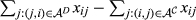
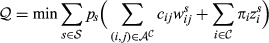
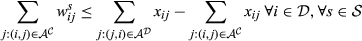
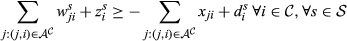
The objective function 1 minimizes total cost, comprised of transportation costs and shortage penalty and 2 constrains the amount distributed to be at most the available supply (σ). Constraints 3 and 4 represent the flow conservation constraints for regional warehouses to district hospitals and district hospitals to local clinics respectively. The left‐hand‐side of Equation 5 represents the total flow of ACTs into local clinic i plus the shortage in that clinic under scenario s (

Two‐Stage Stochastic Formulation
The models in this section contrast with the baseline model in the sense that additional demand information becomes available and recourse actions are triggered in the second stage. In the first stage, the Malawi Ministry of Health would decide how many ACTs to send to each facility before the malaria season begins. In the second stage, the actual demand is realized and the Ministry can take recourse actions to address the supply and demand mismatch. Here we consider two potential recourse actions: (i) transshipment and (ii) delayed shipment.
In the transshipment model (section 3.3), all the ACTs are distributed among all the facilities (tier 1, 2, and 3) in the first stage. In the second stage, transshipment of ACTs between facilities occurs to adjust inventories in light of new demand information. In the delayed shipment model (section 3.4), an initial delivery of ACTs is distributed to the clinics, but some is held back at the higher tier. During the malaria season, a better estimate of the demand is realized and a second round of shipments is delivered. Delayed shipment is less cost effective, but from an implementation standpoint it has the political benefit of not needing to take stock from one clinic to give to another. Transshipment, on the other hand, is more cost‐effective but harder to centrally control. Note, however, that according to Kiczek et al. (2009) transshipment already occurs on an ad hoc basis in Malawi and in a more structured manner in neighboring Zambia (Mtonga 2010).
Figure 2 illustrates the timeline of events for the two‐stage stochastic models. Note that the recourse actions are not necessarily done all at once. Instead, the transshipments or delayed shipments are made throughout the malaria season as needed. Therefore, the recourse decisions considered here are aggregate‐level surrogates for the actual periodic adjustments in the inventory level of each facility.
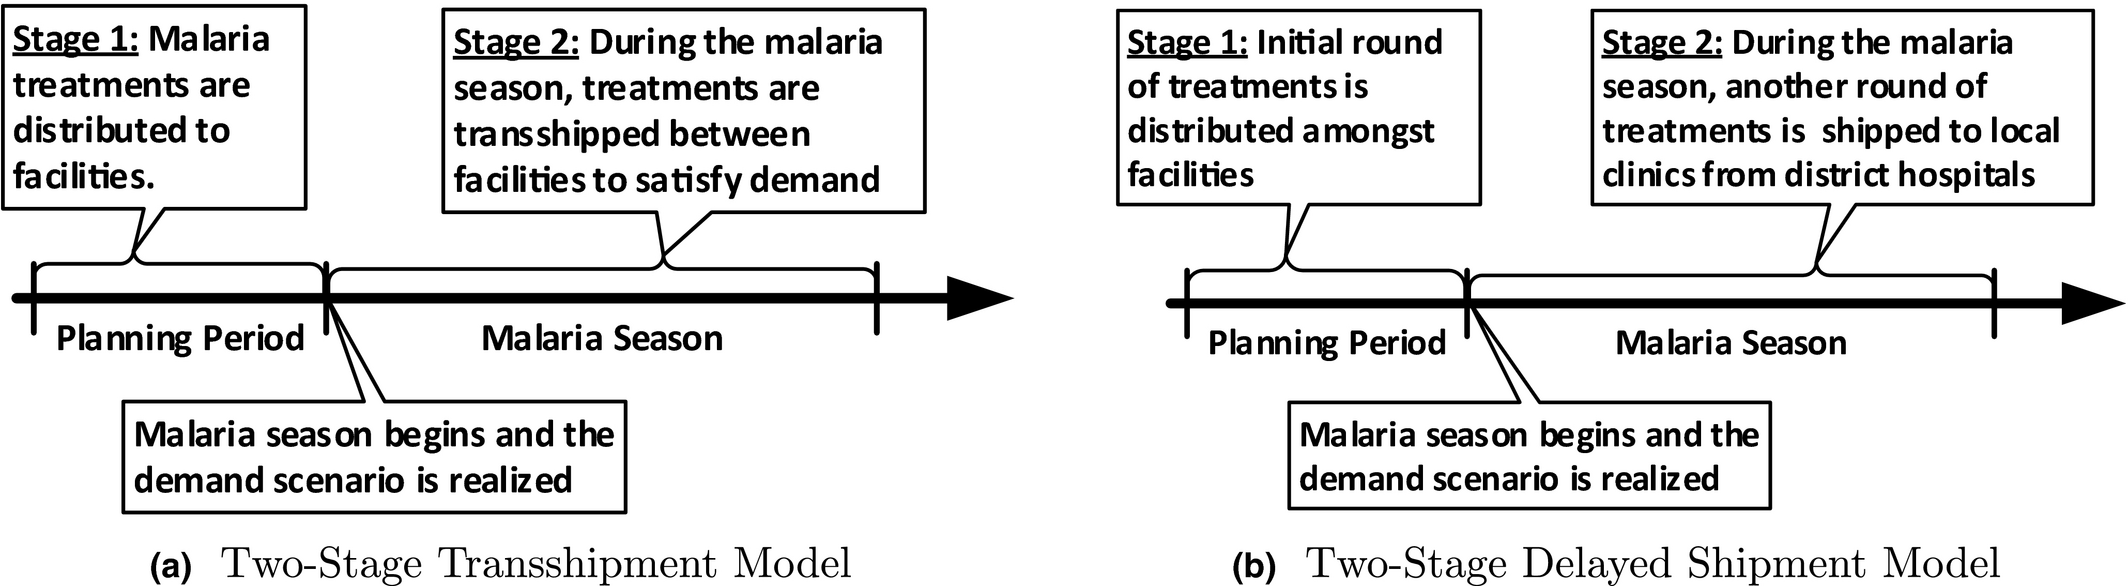
Event Timelines for Two‐Stage Stochastic Models
Two‐Stage Transshipment Model
A necessary assumption for this stochastic programming formulation is that transshipment occurs immediately and instantaneously (as in a continuous review system) in response to every stock out. This approximation is acceptable for the planning stage that the stochastic program represents. We assume a set of scenarios (


The decision variable 


Two‐Stage Delayed Shipment Model
In the delayed shipment model, some ACTs are reserved at a higher tier for shipment after the start of the malaria season. The first‐stage problem has an identical formulation to the transshipment model. The expected recourse function, 


In addition to the two‐stage models, we also formulate an analogous three stage model that provides two opportunities for recourse during the malaria season. This model is used for comparison of reaction frequency, but the framework is nearly identical to the two stage models. For completeness, the formulation is presented in Online Appendix S1, where we also present an alternate objective function that focuses on equity.
Scenario Analysis: Costs, Resource Availability, and Uncertainty
In this section, we present the results of computational experiments based on actual locations of health facilities that were mapped in a country‐wide survey conducted by the Japanese International Cooperative Agency (JICA) in the year 2000. Facility demand was estimated based on regular malaria case counts as reported by hospitals and clinics to the central Ministry of Health, spanning the years 2003–2008. The data are summarized in annual government Health Management Information System (HMIS) reports prepared by Republic of Malawi Ministry of Health (2009) These reports include case counts reported by month at each facility, whether the demand was met or not.
As in all developing country contexts, there were some missing and incomplete data at the facility level. However, this nation‐wide reporting program became fully operational in all districts in 2002 and remained so during our data‐collection time‐frame, Chaulagai et al. (2005). The incident counts in the data were mostly complete, with well over 80% of the facilities reporting. We estimate the case counts at facilities where data was missing by considering incidence rate for the region; see for example, Dzinjalamala (2009) and the catchment (population) that the facility serves. Multiplying the population of the catchment by the region's incidence rate, we obtain approximate case counts. Catchments were estimated using Thiessen polygons in conjunction with Malawian Census data. This general approach is widely used for estimating facility‐level incidence of malaria in Malawi and other parts of Africa in the epidemiology and public health literature (see Bennett et al. 2013, Chaulagai et al. 2001, 2005, Dzinjalamala 2009, Hay et al. 2010, Kazembe 2007, Kazembe et al. 2006).
It was assumed that people used the closest health facility. In reality, this may not always be true, as patients may prefer one facility over another, or transportation (i.e., buses) might facilitate travel to a farther facility. Nonetheless, as in common practice, case counts were assigned proportional to health facilities based on the estimated population catchment and the probability of contracting malaria associated with each geographical region. If the necessary data can be obtained, an interesting follow‐up study could compare the actual demand against the Thiessen polygon interpolation mechanism to determine the accuracy of such approximations. Note, determining the error in the Thiessen polygon approach has been well‐explored in the literature (e.g., Tatalovich et al. 2006, Yang et al. 2004), in which Thiessen polygons are found to perform well relative to other methods
Data were averaged over the five years to model a typical malaria season in Malawi in the face of partially missing data at the clinic level. By observing clinics where the data were more complete, we noted that, over the five years, there was some variability from year to year but little evidence of overall upward or downward trend. This is further confirmed by the World Malaria Report 2014 (see WHO 2014), which indicates no significant trend over the time period. Although there was a slight increase in malaria‐related hospital admissions over the time frame, the report states that data were insufficiently consistent to assess any trend in Malawi, consistent with observations from our own data. Although we recognize the limitations of the data available, it is still very significant that this effort is data‐driven and reflects real temporal and spatial patterns of malaria incidence given current research.
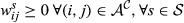
Figure 3 shows the geographical and seasonal shape of the ACT demand curve from our data. The darker color (red) in Figure 3a, indicating higher annual demand, tends to appear near populous urban areas like Blantyre and in both urban and rural areas near Lake Malawi where mosquitoes are more prevalent. In our historical demand data, malaria prevalence in each region grew over the malaria season proportional to the infected population. Figure 3a was generated by creating a heat map (ARCGIS) from the case counts at the various facilities at their locations from our data). A heat map was used because our data use agreement did not allow us to show case counts or relative sizes at individual, identifiable facilities. Figure 3b shows that malaria medication demand basically follows a six‐month seasonal pattern which coincides with the seasonal patterns of rainfall and thus of Anophelene mosquito prevalence. This was also obtained from our monthly case count reports from the HMIS annual reports from 2003 to 2008. Furthermore, the geospatial and monthly standard deviations in our data were 443.9 (CV = 0.11) and 326.56 (CV = 0.97), respectively.
Plot of Demand for Malaria Medication Based on Geography (total yearly demand) and Seasonality (by month) [Color figure can be viewed at
In the three‐stage model, we divided the year into three periods, each consisting of four months. In both two‐ and three‐stage models, the first period is August 1 through November 30, which is considered the pre‐malaria season with an average demand of 113,331 over the time frame. The other eight months, December 1 through July 31, are considered the malaria season. In the two‐stage model, the second stage is December 1 through July 31. In the three‐stage model, the second stage is December 1 through March 31, with an average demand of 674,702, and the third stage is April 1 through July 31 with an average demand of 1,319,287.
To generate clinic‐level demand scenarios, we used the estimated clinic‐level demand (based on the historical prevalence data and the aforementioned interpolation method using Thiessen polygons) as the baseline. To make the results more robust to a range of possible events, 10 scenarios (details will follow) were then generated based on the expert opinion from one of our co‐authors who has performed extensive field‐work in Malawi regarding malaria. The scenarios developed herein were designed and confirmed based on his personal experiences over several years in Malawi. Our data include demand from 290 facilities including 3 regional warehouses, 21 district hospitals, and 266 local clinics.
For each clinic, we generated 10 scenarios to populate demand parameters for the second (

Ten Demand Scenarios Were Generated Based on the Observed Historical Demand for Each Clinic (D i )


Note that a more sophisticated demand forecasting model could use the historical data on malaria cases as a baseline in conjunction with demographic census information to detect key drivers of malaria case load, and consequently, medication demand. Such advanced models could better characterize spatial and temporal variation in medication demand. Such advanced approaches, although feasible, are beyond the scope of the current research.
To capture the transportation cost (c ij ), we calculated the distance between each facility pair in kilometers. For the purposes of this research, we used Euclidean distance. A road map for Malawi was available, and more accurate measures of road distance based on a map could have been produced, but it was found that the quality of the map varied by geographic area. It was found that Euclidean distances accurately reflect road‐based measures regionally in Malawi and other research has confirmed that this measure is satisfactory compared to more sophisticated methods (see Nesbitt et al. 2014). To account for cartographic shortfalls on published maps and thereby maintain consistency over the region of interest, we use straight line distance.
Road quality in Malawi varies widely and the system is mostly underdeveloped so the unit transportation cost can vary by route, although specific data on road quality are not available. Thus, we initially use the average transportation cost per kilometer in Malawi reported by Lall et al. (2009) which is about 4 cents (or 228.4 kwacha, the Malawian currency), but vary the costs to account for road conditions in our sensitivity analyses.
In the following sections, we consider key features in analyzing a public‐sector supply chain in the developing world. We begin by performing a sensitivity analysis on the shortage penalty, transshipment costs, and supply availability. All three factors have been shown to be of significant concern in the literature. We then conclude with a novel analysis of road conditions, which are known to degrade significantly during the rainy season when malaria is most prevalent.
Sensitivity Analysis on the Value of Shortage Penalty
Estimating the shortage penalty for malaria medications is non‐trivial. Factors such as loss of income and productivity (for patients and relatives) during the course of infection, and health care expenditures should be taken into account in order to obtain a correct estimate. It should be noted that given the type of parasite, the symptoms and their severity vary dramatically. Some people may have already developed immunity while for others (especially children) the disease can be deadly. Furthermore, malaria can have a higher indirect impact on children by hampering their physical and intellectual growth. Accounting for all these factors and monetizing their impact is key to determining the actual value of the shortage penalty and is beyond the scope of this paper. Due to a lack of reliable data regarding health care expenditures, we performed a sensitivity analysis on the value of the shortage penalty. As a baseline, we begin with Malawi's national income per capita, reported to be $810 by the World Health Organization (WHO) (2014). According to UNICEF (2004), malaria can slow the economic growth in sub‐Saharan Africa by 1.3% annually. Based on these statistics, one can estimate the economic impact of malaria in Malawi at the individual level to be about $10.5 in lost economic growth, which is considered a lower bound because it captures only the loss of economic growth. In this section, we consider shortage penalty values between $10 and $100. Based on our computational results, even a low number, $20, is high enough to trigger effective distribution of medications. Hence, we use the $20 shortage penalty for future illustrative examples and computations (e.g., section 4.5). For the following experiments, we set the available supply of ACT to 1.5 million units as this was also a middle range for the estimated annual supply.
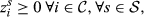
Figure 4 demonstrates the inverse relationship between shortage penalty and transshipment volume, which is consistent with results reported by Rottkemper et al. (2012). The three‐stage delayed shipment model tends to be more effective at addressing shortage, although at a higher transportation cost. As the shortage penalty increases, however, we observe that the gap between the three‐stage delayed shipment model and the three‐stage transshipment model shrinks. Also note that under high shortage penalty values, the two‐stage delayed shipment model results in higher shortage than the two‐stage transshipment model. This occurs because once the actual demand is realized, the delayed shipment model can only send additional shipments of medications from the district hospitals to the local clinics to address shortage. The transshipment model, on the other hand, has a broader base of facilities from which to satisfy demand. In some sense, this confirms the results of Rosales et al. (2013) that transshipment models outperform generalized allocation mechanisms under most parameters.
Sensitivity Analysis on Potential Values of Shortage Penalty (total available supply = 1.5 million units)
Transshipment Cost Sensitivity Analysis
In this section, we analyze the sensitivity of the transshipment model to the transshipment cost and compare it with the delayed shipment model. In particular we explore the cases where (i) transshipment is cheaper and (ii) more expensive than shipment along the main channels from the regional and district hospitals. It may be possible that shipments are cheaper because smaller and more frequent shipments may be transported with smaller and cheaper transportation methods, such as a motorcycle or small vehicle that can more easily pass difficult terrain or roads that are damaged by heavy rains. In these cases, a large truck may have difficulty navigating certain routes and therefore be more costly relative to transshipment. On the other hand, it may also be possible that frequent transshipment loses economies of scale, making clinic‐to‐clinic shipping costs more expensive. Thus we analyze how the models react in both cases. To do so, we modify the cost of clinic‐to‐clinic transshipment to be X% of the standard cost of shipment, where X ranges from 0% to 150%. Costs for the other routes remain unchanged.
In Figure 5a and b, the dashed lines represent the expected transportation cost and expected shortage volume respectively for the delayed shipment models. These are constant across all scenarios because delayed shipment does not use the clinic‐to‐clinic routes. The solid lines represent the transportation and expected shortage costs for the transshipment model. When transshipment is not expensive, all the inventory is initially allocated to one clinic in the cluster, which then transships to the other clinics due to the lower cost of transshipment relative to the cost of the initial distribution.
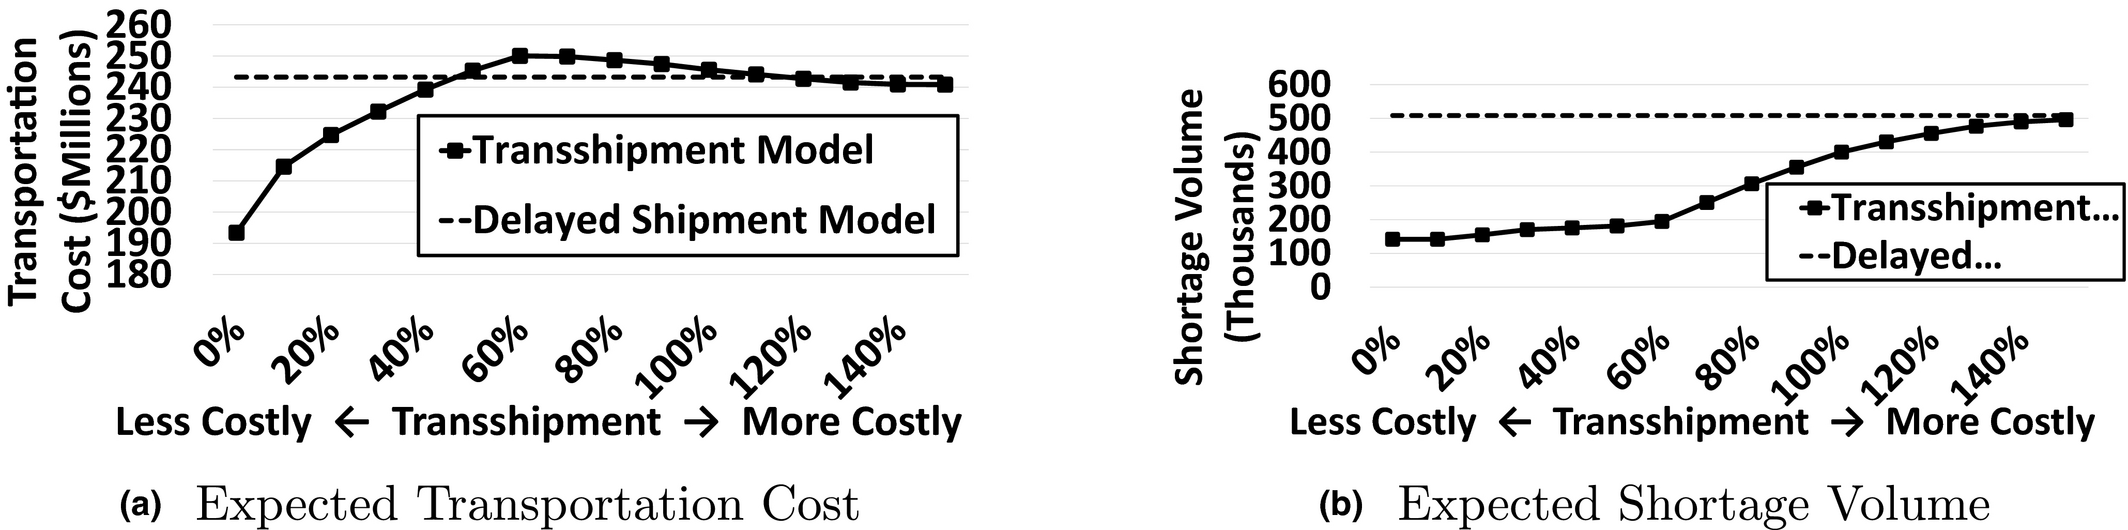
Transshipment Cost Sensitivity Analysis Using the Two‐Stage Model
Transportation cost initially increases as transshipment becomes more expensive; however at 60%, the transportation cost begins to decrease while the shortage penalty increases more sharply. This inflection point occurs because at this level, clinic‐to‐clinic transportation becomes expensive enough that the model will stop transshipping along certain routes altogether, preferring some shortages rather than incurring high shipping costs, e.g., shipping across the country to fulfill a small amount of demand. As observed in section 3.2, the similarity between Equations 10 and 15 enables the transshipment model to store some inventory at district hospitals and delay shipments if necessary. When transshipment becomes prohibitively expensive, clinic‐to‐clinic shipments are avoided entirely and the transshipment model restricts itself only to the cheaper routes used in the delayed‐shipment model; then both costs approach those of delayed shipment.
While the shape of the curve is driven by the particular network structure as well as the shortage penalty and original transportation cost values, changing these values would likely shift the inflection point while maintaining the overall shape. A key insight is that, once transshipment reaches a scenario‐specific cost threshold (e.g., 50%–60% in Figure 5), the transportation cost will remain relatively stable, as the optimization becomes more conservative as to how far one would be willing to ship medications to satisfy unmet demand in a different region. Essentially, transshipment eliminates routes from consideration due to high cost thus becoming less effective in satisfying all demand. This serves to localize the transshipment mechanism around increasingly proximate geographical clusters. As an extension of this line of reasoning, the higher the penalty cost for unmet demand, the longer the model resists localizing transshipment efforts in favor of more regional/national transshipment. Thus, depending on the strategic goals and constraints of the distributor, the optimal shipping network may be more localized or more national.
Sensitivity Analysis on Supply Availability
Supply availability is a major challenge in distributing malaria medications in holoendemic areas. As reported by Natarajan and Swaminathan (2014) the process of procuring humanitarian supplies can be subject to delays and uncertainty. To better assess the effectiveness of our proposed stochastic models, we compare their results for a range of possible supply values, between 500,000 and 2,000,000 units while fixing the shortage penalty at $100. Figure 6b, shows that the stochastic models can better utilize the additional supply of medications to address shortage compared to the baseline model. Among the stochastic models, three‐stage models tend to be better at utilizing additional supply than two‐stage models. This insight is similar to the key takeaway from section 3.5.1; specifically, the three‐stage model better utilizes the supply of ACTs through targeted repositioning in stages two and three. Obviously as more medications are available, more medications will be transported, and while the total cost of shortage decreases, transportation cost will increase. As mentioned earlier, the analysis in this section is performed by fixing the per unit shortage penalty (π) at $100. Based on the discussion in section 3.5.1, a higher value of π creates more incentive for the model to transship more items and reduce the overall shortage cost. As observed in Figure 6b, for a fixed value of π, as the total supply volume increases, transportation cost almost reaches a plateau. We can expect that increasing π will shift the plateau to the right, while reducing π will shift the plateau to the left.
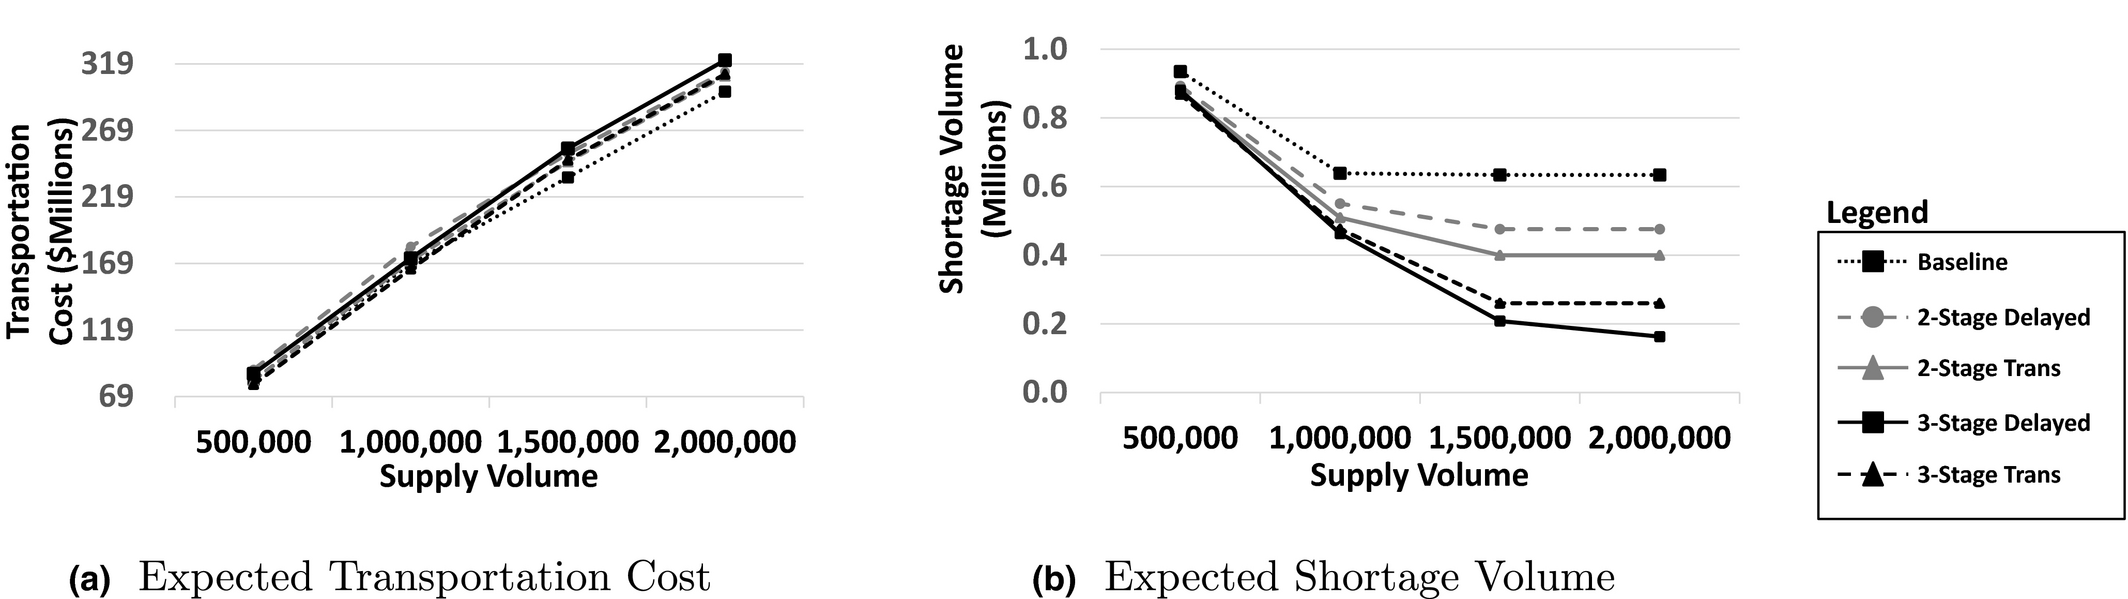
Sensitivity Analysis on Supply Availability (Shortage Penalty = $100)
Road Condition Analysis
As mentioned in section 1.2, poor road conditions can make certain transportation routes difficult and therefore more costly, requiring, for instance, special vehicles or delayed travel during especially poor weather periods. To analyze this feature of supply distribution in the developing world, we design a scenario in which a proportion of the roads in our supply network is made more costly to travel due to poor road conditions. Since we are not aware of any data on the actual road conditions of the thousands of potential supply routes, we test the model's sensitivity to poor road conditions by varying the proportion of total routes that are considered to be in poor condition from 10% up to 50%, with the poor routes being selected at random with an additional cost of shipping along the given route also generated randomly. In the scenario where 10% of roads are considered in poor condition, we assigned a Bernoulli indicator to each road where the road is considered in poor condition with p = 0.1 and standard condition with 1 − p = 0.9. If the road was found to be poor, we multiplied the transportation cost by 1 + U(0, 0.5), where U(·) is a uniform random variable. We modify the cost per km rather than adding a random quantity to each route because when traveling on a poor road for a longer distance, the cost should increase more than when traveling on a poor road for a shorter distance. We then generated five outcome samples for the entire set of routes. For the 20% scenario, we started with the same bad roads as the 10% scenario and then modified the remaining roads that had not been touched in the previous scenario using a Bernoulli probability that guaranteed that 20% of the total routes would be modified (in this case p = 0.111). This yields a coherent comparison between the different scenarios. The rest of the scenarios (30%–50%) were generated in the same manner.
Figure 7 shows the results for the different percentages of roads in poor condition in terms of transportation cost (Figure 7a) and the expected shortage (Figure 7b). The X's represent the solution of the transshipment model for the five different random scenarios we generated at each percentage of poor roads. The dashed line represents the average of the five scenarios for transshipment. Likewise, the plus symbol and solid line represent the corresponding outcomes for the delayed shipment model.
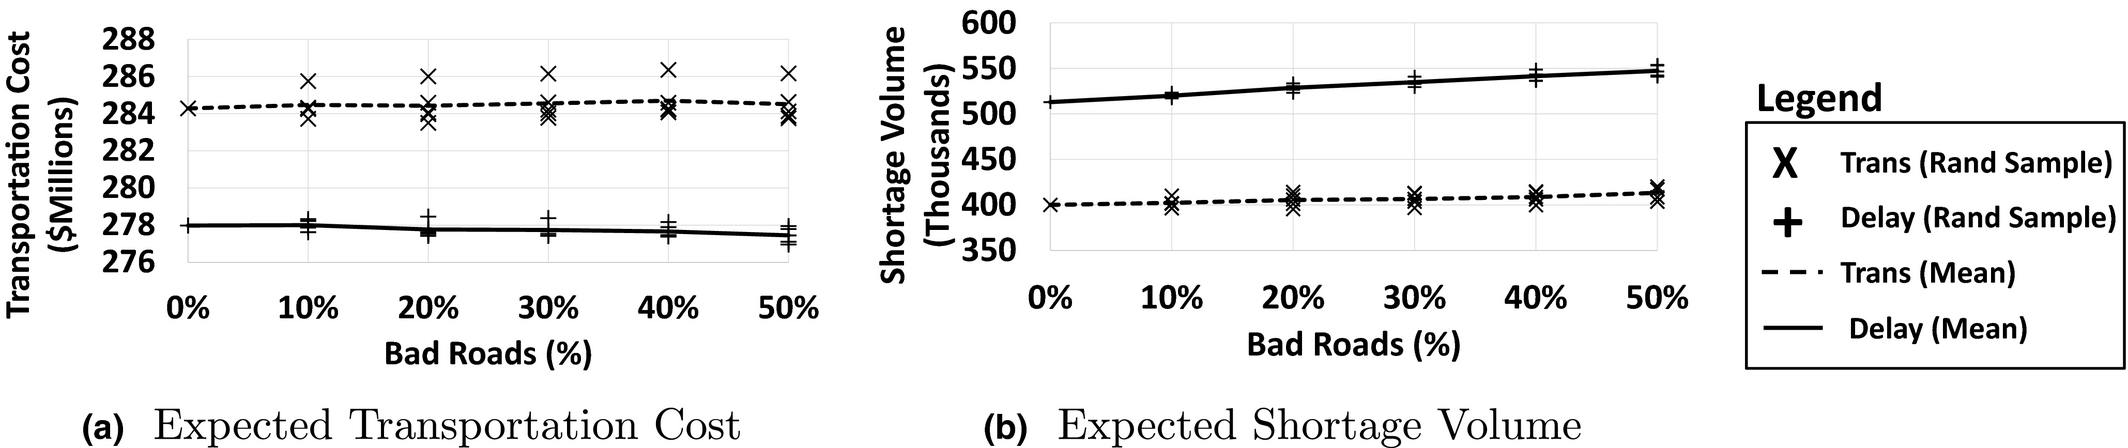
Analysis of Road Conditions Using the Two‐Stage Model
First, note that the transportation cost remains relatively stable as the percentage of bad roads increases. This is because the transportation cost is high enough that it becomes more beneficial to keep medications locally rather than ship across routes with poor road conditions for a small reduction in shortages. Delayed shipment costs trend downward because there are fewer viable options when a key route becomes affected by poor road conditions so the model chooses to accept more shortages. The transshipment model, on the other hand, has more flexibility because there are many more options when clinic‐to‐clinic routes are added. When one route becomes more expensive, the model is able to find other viable routes to transship product. The transshipment model's transportation cost demonstrates a slight upward trend as the transshipment model seeks alternative routes that allow for more movement of medications at a slightly higher price.
The cost of storing more medications locally can be measured in terms of increased shortages. As seen in Figure 7b, the slope of the increase in shortage is steeper for the delayed shipment model than the transshipment model, which implies that the transshipment model is better at meeting demand as road conditions worsen.
A key takeaway from this analysis is that poor road conditions lead to an increase in shortages and less movement of product around the network. However, the flexibility of the transshipment model to choose alternate routes enables more demand to be satisfied relative to delayed shipment, albeit at increased transportation cost due to using more expensive alternate routes.
A New Distribution Structure: Establishing Clinic Clusters
One of the key insights gained from the computational experiments on the strategic‐level stochastic program is the appearance of what we call clinic clusters. That is, the transshipment stochastic models group clinics together into clusters such that transshipment often occurs within clusters only, and very rarely between different clusters. In our transshipment model experiments, for example, only 15%–25% of clinics send ACTs to other clinics in the recourse stage. These sender clinics transship their excess inventory to between 2 and 5 proximal receiver clinics in the vicinity of the sender clinic. Figure 8 illustrates five representative clinic clusters in the northern area of Malawi. This idea of clusters can be used to decompose the nationwide problem into tractable cluster‐level problems that can be solved independently at the tactical/operational level. This is the key to integrating the strategic models with the operational models that we develop in section 4
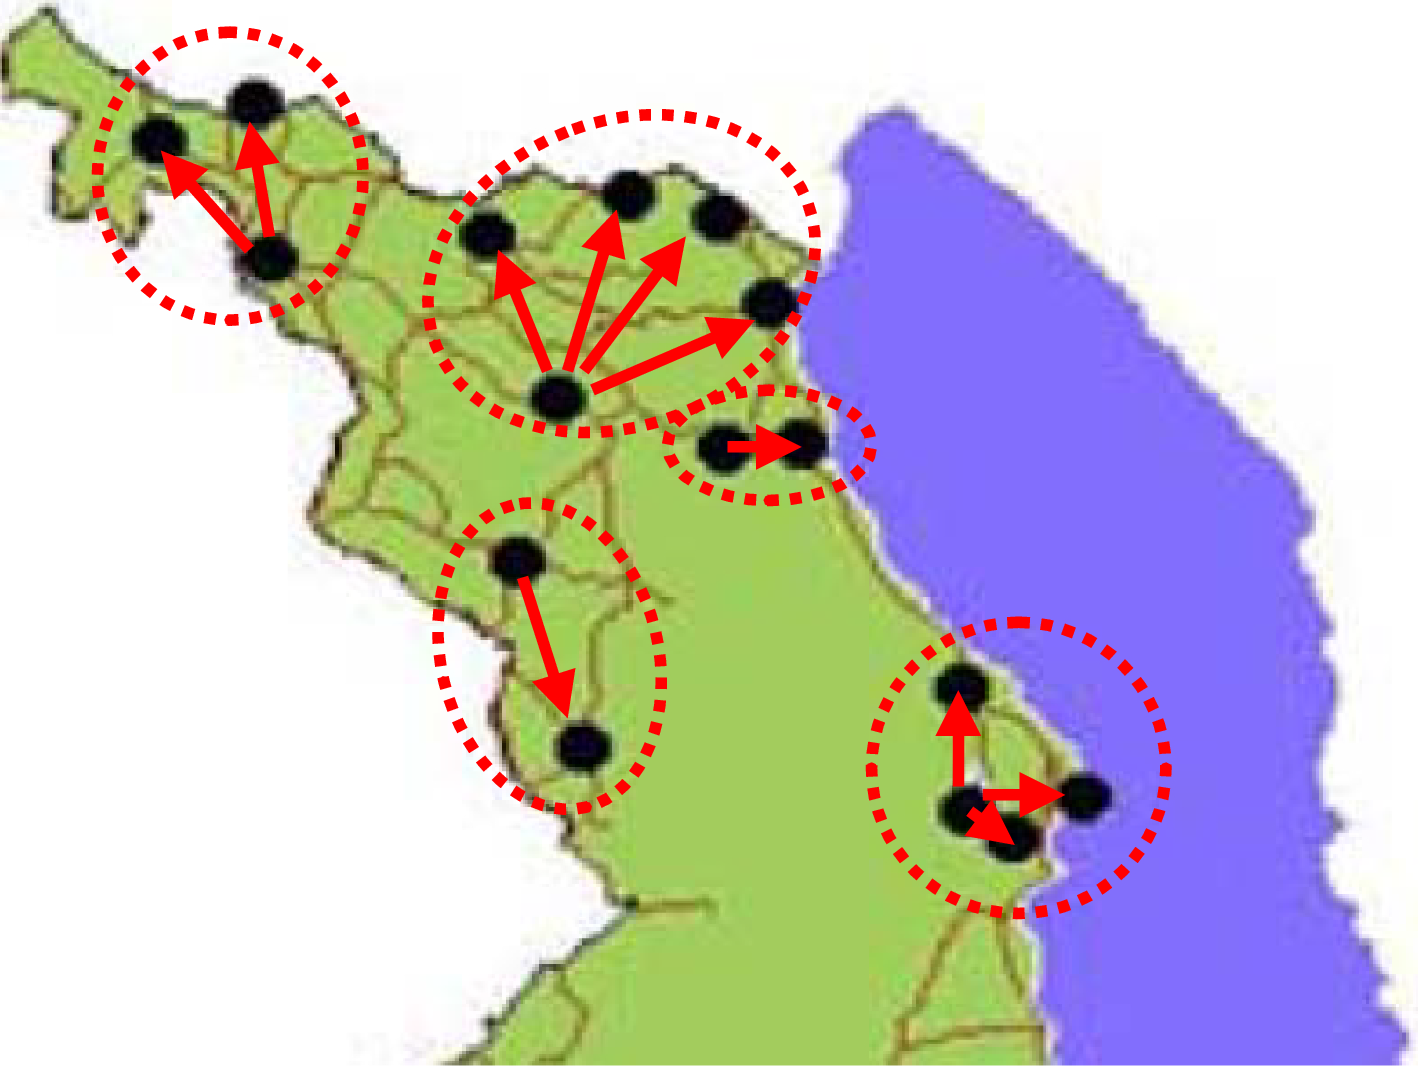
Five Clinic Clusters in the Northern Region of Malawi [Color figure can be viewed at
This decomposition has further benefits. The geographic proximity of clinics within a cluster increases the likelihood that the clinics would be willing to work together toward a transshipment program; this partially mitigates challenges associated with regional rivalries mentioned in section 1.2 Proximity also makes transshipment more feasible by motorcycle or small vehicle that are less likely to get stuck due to poor road conditions. Finally, communication—a major cause of breakdown of supply—is much easier for tightly clustered clinics.
A Tactical/Operational Model for Transshipment in Clusters
For the strategic planning models of section 3.2 and section A.1 in Online Appendix S1, it was necessarily assumed that recourse occurred under continuous review. In reality, transshipments would likely occur periodically at regularly scheduled intervals after stock reviews at each facility. In this section, we use a MDP to develop a mechanism to operationalize the transshipment concept at a cluster level based on the strategic plan developed in the previous sections.
First, we formulate a MDP model to analyze the dynamics of a periodic review system for the clinic clusters. Second, we analyze the structure of the optimal policy under a reasonable demand assumption for clinics that are within close geographic proximity. We are able to show that balancing the load evenly across the clinic cluster is optimal, but re‐balancing occurs only in a cluster‐level “sweet spot” where there is not too much or too little inventory in the cluster as a whole. Third, we parameterize the model with historical demand data (as described at the beginning of section 3.5) and solve the MDP numerically to illustrate the behavior of the model and explore unique features of distributing pharmaceuticals in the developing countries.
To identify clinic clusters, we solve the strategic‐level transshipment model to optimality and calculate the optimal values of transshipment between two clinics under all scenarios, i.e., 


Note that this is not an exact clustering method (e.g., k‐means). Instead, we are inferring cluster structures from the results of the transshipment model. The downside to this method of developing clusters is that the cluster boundaries depend on the actual parameter values. For instance, as the cost of transshipment increases, the model tends to hold on to some inventory at the district hospitals and ship them to clinics with a delay. In another extreme case, when transshipment is very inexpensive, a clinic may receive a small shipment from another clinic that cannot be meaningfully assigned to the same cluster. Hence, the results of the stochastic program will not always guarantee that we obtain mutually exclusive clusters. We emphasize, however, that we focus on identifying mutually exclusive clusters of clinics based on the idea that very small or zero flows between two clinics in the strategic planning model indicate little need for short term transshipment between them. So, by eliminating shipments that were lower than an empirically determined threshold, we identified mutually exclusive clusters of clinics—see Appendix S2 for more details. While we developed a very intuitive approach, future research would better understand the power of our approach by comparing it to other optimization‐based approaches or even to integrate other holistic considerations into the process. In practice, the system designer can bring to bear good experience‐based judgment.
In our operational model, each clinic cluster is modeled separately with a periodic review cycle in which each clinic's inventory is surveyed and then a decision is made as to how much to transfer to other clinics within the cluster. At the beginning of each period, each clinic incurs a shortage penalty for unmet demand from the prior stage—indicated by a negative inventory value. Next, a decision is made regarding how much product to ship between clinics. Finally, demand arrives to each clinic within the cluster according to a distribution for epoch n of 
Clinic Transshipment Model Dynamic Program Notation
In the tactical model, we only focus on the clinics in one cluster, which means they are all in close proximity. This makes the distance between each clinic in the cluster approximately the same, which allows us to safely approximate c
ij
= c, where i and j are in the same cluster. However, an advantage of the MDP approach is that it easily accommodates nonlinear cost functions and transport capacity limits if needed. The expected cost‐to‐go is based on the positive part of
Structural Properties and Insights for Clinic Cluster Transshipment
In this section, we analyze several structural properties of our MDP model to gain insight into the optimal transshipment policy for clinic clusters. We specifically show that (i) the entire cluster is better off when any clinic in the cluster increases its initial supply, (ii) balancing the inventory among clinics is optimal, and (iii) the optimal transshipment policy is of threshold nature.
f
n
(
We begin by defining what it means for a function to be balanced. Next, we show that the balanced property is preserved by the expectation operator in Lemma 1. This lemma supports development of further operational insights including the key result (Theorem 2 and Corollary 1) that the optimal transshipment policy is of threshold nature; and depending on the cluster‐wide inventory levels and the disparity between the clinics the optimal action will either (i) re‐balance the inventory across the cluster so that each clinic has the same inventory level or (ii) do nothing. This result is supported by deriving ancillary insights that show the optimal states for a clinic cluster possess the property that all clinics have “roughly equal” inventory levels (Lemma 3), and transshipment only occurs from clinics with higher inventory to clinics with lower inventory (Lemma 2). These last two Lemma's also guarantee that our decision support has the appealing property of being perceived as fair by implementing clinics: no clinic with less inventory will ship to one with higher inventory, and the goal of the algorithm is to achieve inventory balance among the clinics.
As a precursor to model analysis, we begin by describing the reasonable assumption for tightly clustered clinics that the severity of malaria outbreak will follow a similar pattern among the clinics of the same cluster. Mathematically, we mean that it is equally likely to see malaria incidence of x in clinic A and y in clinic B as it is to see incidence y in clinic A and x in clinic B. We call this a symmetric demand distribution. With symmetric demand, we can prove the properties mentioned above. We begin with a definition of a balanced function and then proceed to show that the MDP value function is balanced, which guarantees the optimality of balancing inventory levels across the clinics within a given cluster.
We call a function 
In the following lemma, we show for symmetric demand distributions that the expected cost‐to‐go function of the MDP preserves the balanced property. We then use this lemma (with proofs for this and all results in Online Appendix S3) to prove structural properties of our periodic review with transshipment MDP and build up insights supporting the optimality of balanced inventory levels across the cluster.
If the two clinics in a cluster have a symmetric demand distribution and the function f
n
(
If function f
n
(
This result, combined with the following lemma, reduces the action space significantly since the optimal action u * must be an element of {0, …, ⌊ 0.5 × (max{ξ 1, ξ 2} − min{ξ 1, ξ 2})⌋}. u * will be the amount of medication shipped from the clinic with higher inventory to the one with lower inventory. The next lemma (proved in Online Appendix S3) demonstrates that a completely balanced inventory distribution is the lowest cost state for a clinic cluster. Hence, each clinic cluster will desire to move toward a cluster‐wide balanced inventory as long as the cost of achieving the balance is not too great—which is shown by Theorem 2 and Corollary 1.
If f
n
(

Now, we are ready for the main result, which is that the optimal transshipment policy follows a threshold in which the clinics will either (i) re‐balance the inventory across the cluster so that each clinic has the same inventory level or (ii) do nothing. We first show that the MDP value function is balanced in Theorem 2. This means that the optimal solution of our MDP has the properties of Lemmas 2 and 3.
When the demand vector has a symmetric distribution, the value function in 19 is balanced.
Optimal Actions in Period 5 for Three Parameter Settings
Under a non‐decreasing shipping cost, the optimal policy is of threshold nature with stage‐dependent thresholds. Depending on the shipping cost, the optimal action will perform the minimal amount of transshipment necessary to balance the inventory (in the sense of Definition 1) or do nothing.
As an example of Corollary 1, consider the case where there is a fixed cost per shipment. The optimal policy balances the inventories between the two clinics in the following way: 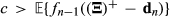

Illustrative Example of the Optimal Area‐Based Transshipment Policy
In this section, a numerical example is used to gain insight into state‐specific optimal actions. For the purpose of exposition, we begin with an example of a cluster consisting of two clinics. We also scale the units of demand and supply to obtain the following restricted state space:
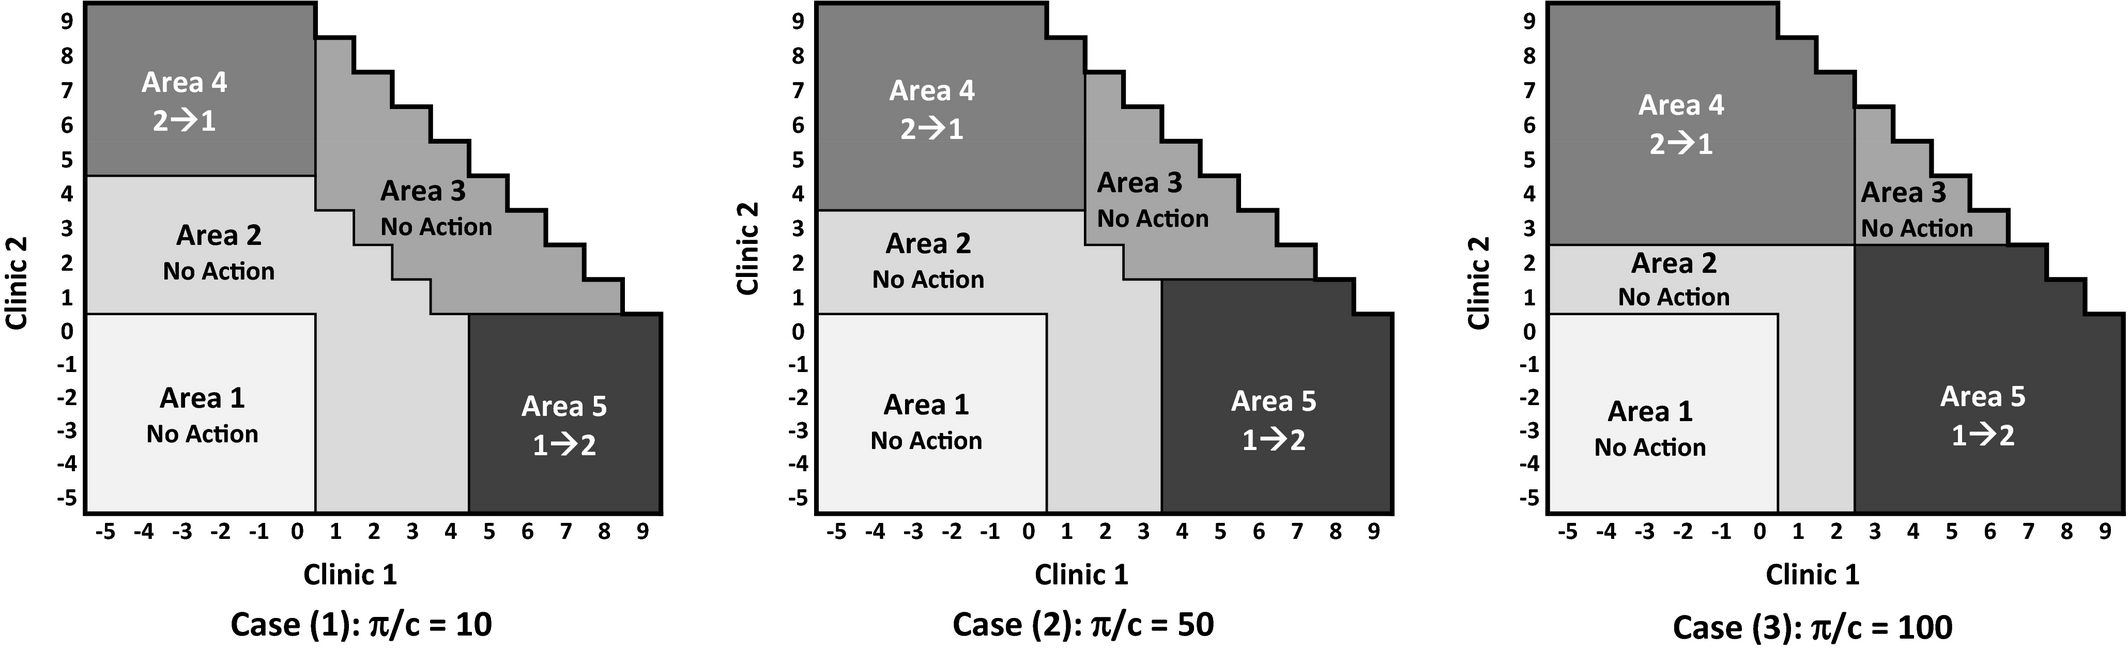
We solve the two‐dimensional MDP under three different parameter settings where the ratio of shortage penalty to unit transportation cost was either: (1) low, (2) moderate, or (3) high and solve it for six stages (one stage for each month of the malaria season). Figure 9 illustrates the optimal actions at stage 5 (i.e., n − 1) for each state for cases (1), (2), and (3). The optimal actions in Figure 9 are identified by five areas, 1 through 5, described in more detail in Table 4.
Five Areas in the Two‐Dimensional Illustrative Example
Figure 9 shows that the ratio of shortage penalty to transportation cost (π/c) plays an important role. As this ratio increases, there is more transshipment between clinics; transshipment Areas 4 and 5 becomes larger while no action Areas 2 and 3 shrink. As the π/c ratio decreases we observe less transshipment, which has the opposite effect on the areas. This behavior demonstrates the importance of low cost and accessible shipping options for short distance transport as this leads to more effective transshipment policies.
In section 4.1, we found the structure of an optimal transshipment policy with two‐clinic clusters and symmetric demand. While the setup considered was reasonable both in the demand assumption (as argued previously) and size (a number of clusters from the strategic model contained only two clinics), we can further extend the analytical results to clusters containing three clinics through numerical analysis. The insights are summarized below:
Corollary 1 extends to clusters of size greater than two. When the demands of all the clinics in a cluster are symmetrically distributed, the optimal action is to balance the inventory between the clinics in the cluster.
As the ratio of the shortage penalty to the transshipment cost increases, it is optimal to ship more units between the clinics; increasing the effectiveness of transshipment in preventing ACT shortage.
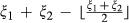
Similar to the previous example, we scale the units of demand and supply to obtain the following restricted state space:
The system state has three dimensions, so we only illustrate the optimal actions for three inventory levels at Clinic 3: 0, 2, and 4. For ease of comparison, we chose a moderate ratio of shortage penalty to transportation cost, i.e., π/c = 10. The optimal actions in Figure 10 are identified by five areas, detailed in Table 5. Figure 10, shows that the optimal policy balances the inventory between the three clinics when demand is symmetric. As the inventory level of clinic 3 increases, that clinic ships more pharmaceutical units to Clinics 1 and 2 if needed.
Optimal Actions in Period 5 for a Cluster Consisting of Three Clinics
Five Areas in the Three‐Dimensional Illustrative Example
Clinic Clustering vs. Fully Integrated Optimization
In section 3.6, we introduced a method for integrating the strategic and tactical levels of supply allocation through the decomposition of the strategic model into clinic clusters based on the structure of the solution. While this approach has significant computational advantages (the tactical MDP is intractable at the level of the full‐scale problem), a question remains regarding loss of optimality stemming from the cluster‐based decomposition. In this section, we address this issue by studying four of the larger groups of clinics for which the strategic model recommended cluster decomposition. Through numerical analysis, we compare for each group (i) the fully integrated solution, (ii) the cluster decomposition solution suggested in section 3.6, (iii) and the solution of the baseline (i.e., naive) model from section 3.1
For the fully integrated solutions, we solve a MDP that performs both the initial allocation of inventory (stage 1) and the transshipment between any pair of clinics within the group of clinics studied (stage 2). This is done in reverse, by solving the MDP for all possible initial inventory allocations, and then selecting the optimal initial inventory to minimize the total cost using an exhaustive search.
For the cluster decomposition solution, we first run the optimization that solves the strategic planning problem to identify the optimal clusters within the larger group and initial allocation of inventory within each cluster (as described in section 3.6). Next, we solve an MDP for each cluster separately, only allowing transshipment between clinics within the same cluster. This approach bridges the strategic and the tactical/operational models.
For the baseline model, we simply solve the baseline optimization and allocate inventory accordingly. In solving the MDP, we use the actual demand patterns (scaled down for tractability) at each clinic to incorporate (i) non‐stationary demand by month during the six‐month malaria season, and (ii) demand variability by year by including very high, high, medium, low, and very low years.
To select the four larger groups of clinics to study, we first identified groups of four and five clinics that (i) were all in close proximity to one another and (ii) were split into two clusters based on the global strategic solution (containing all 290 clinics). We capped the group size at five clinics because analyzing any larger group of clinics causes the fully integrated solution to be intractable due to the curse of dimensionality. Furthermore, including larger groups usually entails groups of clinics with significant distance between clusters, in which case the optimal solution would almost never utilize shipping routes not available in our cluster topology—as seen in the strategic solution. Hence, this analysis should be sufficient to capture the key comparison of full integration vs. the decomposition approach. Table 6 shows distances in kilometers between clinics in each of the four master groups.
Intraclinic Distances for Four Larger Groups of Clinics that can be Decomposed into Clinic Clusters
Note: Data in matrix form with clinic number as the row and column headers.
The clusters derived from the strategic solutions for each group were as follows. Group 1: Cluster 1 = Clinic 274 and 285; Cluster 2 = Clinic 139, 142, and 143. Group 2: Cluster 1 = Clinic 249 and 252; Cluster 2 = Clinic 1, 2, and 263. Group 3: Cluster 1 = Clinic 12 and 13, Cluster 2 = Clinic 256 and 265. Group 4: Cluster 1 = Clinic 3 and 4; Cluster 2 = Clinic 225 and 252.
We now present the optimality gap of both the cluster‐based decomposition strategy and the baseline modeling approach compared to the fully integrated optimal solution. We analyze different starting levels of total inventory for the entire group. We start at the highest levels that can potentially satisfy the full demand in most scenarios and decrease the total initial inventory in the cluster by two until reaching a very low level of 10. This allows us to study the solution at different levels of inventory relative to demand to capture the impact of inventory scarcity (or lack thereof) on the optimal solution as well. Since each of the clusters was normalized to have similar average demand (although different dispersion of demand across clinics in the cluster), we use the same range for all clusters. Table 7 presents the results for the four groups for very low initial inventory levels (10) up to high initial inventory levels (32). Beyond this size of initial inventory the fully integrated model for five clinic groups (group 1 and 2) became intractable. There are several key observations from the table. First is that the percent optimality gap for the proposed decomposition heuristic is very small for both 4 and 5 clinic groups, typically between 0%–1%, with the average gap being 0.5% and the maximum only reaching 3.2%. Second, the gap for the decomposition heuristic remains stable as the initial inventory increases, whereas the gap for the baseline model grows monotonically at an increasing rate. When the initial inventory is low, all models can use nearly all of the initially allocated demand. The decomposition heuristic continues to track the fully integrated model closely because the clinic clusters created by the decomposition heuristic have the property that cross‐cluster shipping is generally undesirable so the fully integrated model rarely uses these shipping lanes. Hence, the fully integrated model behaves like the clustered model in most cases, which leads to the small optimality gap.
Optimality Gap (%) for Decomposition Heuristic and Baseline Optimization vs. the Fully Integrated Optimization for Clinic Groups 1–4
Computational Bounds for the Fully Integrated Model
In section 4.3, we show that the cluster‐based model behaves like the fully integrated model for a limited set of clinics. However, the fully integrated model can become intractable (due to the increase in the state‐space) as the number of clinics increases. In this section we calculate lower bounds on the fully integrated model for larger problem instances to describe the performance of the cluster‐based model for a larger set of clinics.
Karmarkar (1987) develops a Lagrangian relaxation approach (by relaxing inventory balance constraints and adding them with a penalty to the objective function) to calculate a lower bound for multi‐location, multi‐period inventory problems. This work also proposes a method for calculating upper bounds by decomposing the problem by location—similar to our cluster‐based approach. In this vein, we develop an easily implementable lower bound for our problem. Instead of dualizing the inventory balance constraints, we adapt a version of the two‐stage stochastic program in which all the demand is realized in two stages. We consider a set of 14 clinics—groups 1,2, and 3 as described in Table 6 and compare the lower bound (based on this stochastic program adaptation) and the upper bound (results of the cluster‐based model) to calculate bounds on the optimality gap of the cluster based model. We calculate the upper and lower bounds for a range of initial inventory values. The results are illustrated in Table 8.
The Lower and Upper Bound Calculations for a Set of 14 Clinics; Optimality Gap (%) is Calculated by Comparing the Lower and Upper Bounds
As seen in Table 8, the difference between the cluster‐based model (upper bound) and the lower bound on the fully integrated model is very small. In some cases (low initial inventories), the cluster‐based decomposition model results are virtually the same as the lower bound. As the initial inventory level increases, the gap between the cluster‐based model and the lower bound increases, however, the gaps are still very small. Note that the approach presented earlier in this section could be used to calculate a lower bound for larger problem instances—or even the entire country. However, such lower bound results would be meaningful only if one also solves the cluster‐based problem for the larger problem (or the entire country) to obtain an upper bound.
Operational Considerations and Insights for Pharmaceutical Distribution in Developing Countries
As mentioned in section 1.1, drug distribution and transshipment between clinics within a centrally controlled (government) distribution network in the developing world has several distinguishing features that contrast this environment with that studied in the traditional transshipment literature. These features include equity (ethical/fairness objectives), periodic review with lengthy intervals due to time consuming paper‐based inventory calculation methods, geographically and temporally correlated and variable demand including seasonality due to characteristics of malaria.
We analyze these features by consider a cluster with two clinics (Clinic 124 and Clinic 133 in our dataset) from the eastern portion of central Malawi to the northeast of the capital city of Lilongwe. Transshipment cost is $0.45 per unit (determined by distance and transportation cost per km) and the shortage cost is $20. Demand was taken from monthly case counts at the two facilities, which had similar levels of demand. We ran the experiments for a three‐month period, since it is unlikely that the clinics will deplete their supplies during the first few months of the malaria season and transshipment only has a major effect when supplies run low at the clinics. When analyzing the system cost of each solution, we present an average and a maximum cost over all reasonable starting inventory levels at Clinics 124 and 133.
From these experiments, we have the following findings: (i) The chase and balanced (so‐called equitable or ethical) policies are very close to optimal when clinics are clustered with other clinics nearby. (ii) Seasonality (predictable variability) is easily handled by transshipment, unlike random demand variability, which has a significant impact on system cost. (iii) Transshipment is effective even with infrequent review intervals.
Equitable/Ethical Transshipment
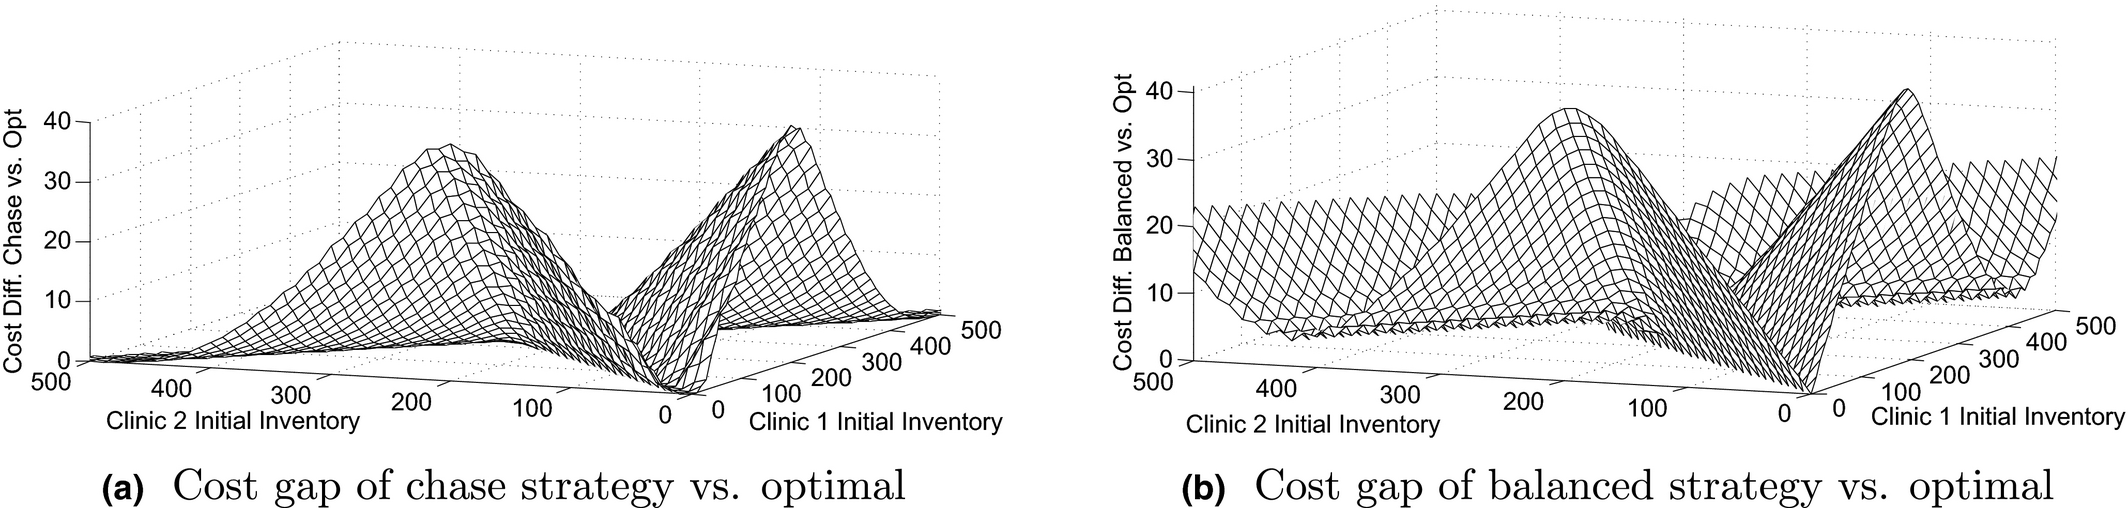
In delivering pharmaceuticals to patients in need, a prime consideration is fair and equitable distribution. For purposes of exposition we define two policies, chase and balanced, which we term ethical policies. Both policies always ship medication to fulfill demand if supply exists within the cluster. The “chase strategy” assumes that if there is shortage in one clinic in a given period, the other clinic is able to (and will) immediately transship available supply to satisfy that demand in the same period that it occurs. In the second scenario, we assume (as we do in the previously described formulation of the MDP) that demand at any clinic that cannot be satisfied immediately is lost and a shortage penalty is incurred. The “balanced” strategy will transship in each period to rebalance the supply at the clinics in the cluster to observe the ratio of expected demand at each clinic. For example, if both clinics have the same expected demand over future periods, then after transshipment in each period both clinics will have the same supply (±1). This strategy is based on the structural results from Thm. 1 and is also equitable since ensures both clinics receive equal supply (relative to their expected demand) in each period.
The result of these experiments shows that these equitable solutions are very close to optimal. The cost gap between the balanced (chase) solution and the optimal solution was $12.3 ($7.7), or 0.6% (0.4%) of the total cost, over a three‐month time period on average across all instances of the initial inventory level, which is the cost equivalent of 0.4 shortages over three months. The maximum value of any instance was $40.6 ($39.9), or 2.1% (2.1%) of the total cost, which is equivalent to two shortages over three months.
Figure 11 shows the gap between the equitable and optimal solutions for both (a) the chase strategy and (b) the inventory balancing strategy as a function of initial inventory levels at Clinics 1 and 2. In both strategies, there is almost no difference when the inventory is initially distributed evenly between both clinics, with the highest gap occurring when the initial inventory level is highly imbalanced. This occurs because both the chase and balanced ethics‐driven strategies attempt to restore the balance and will often incur unnecessary shipping cost rather than anticipating future demands. Note that with the balanced strategy, the cost gap rises again if initial inventories are very high. This is because a completely balanced inventory is not needed to satisfy all the future demand, so inventory balancing incurs cost to transship supplies that will not be needed.
Cost Gap between Optimal Policy and Equitable Policy Based on Initial Inventory Levels at Clinics 1 and 2
Demand Variability and Seasonality
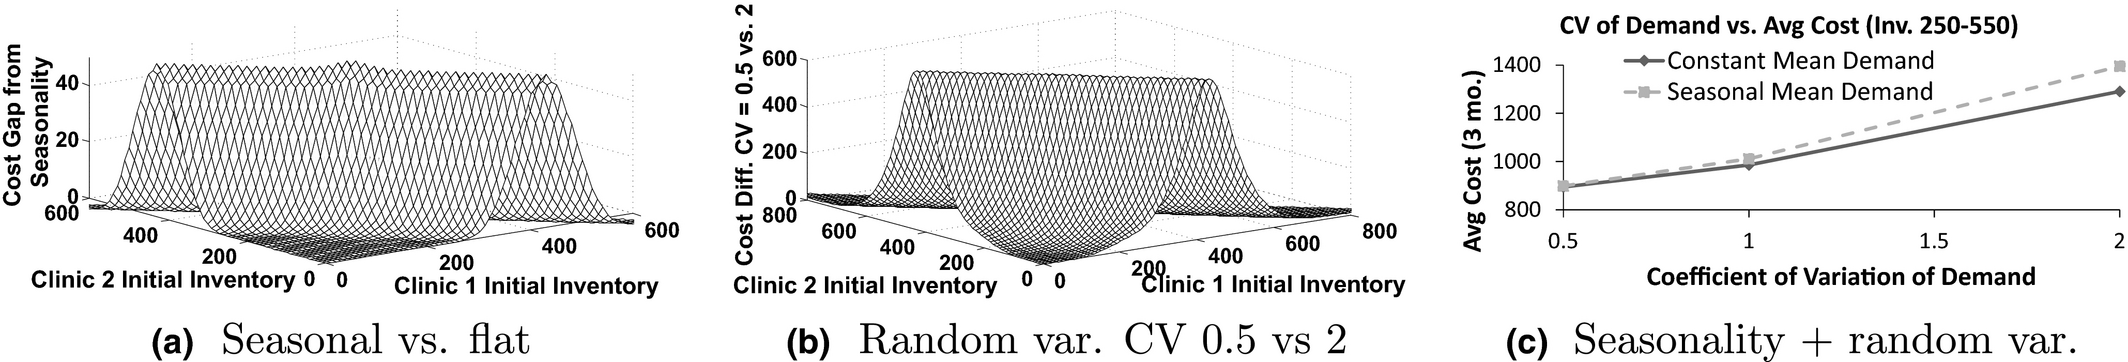
Because malaria is seasonal, demand for ACTs follows a seasonal pattern (predictable variation) with variability from season to season (random variation) as well as geographically correlated demand. We compare the actual demand pattern for Clinics 124 and 133 with demand patterns where we vary the predictable and random variation as a counter factual. To capture random variation, (i) we model demand as a Normal random variable with the actual case counts representing the mean demand, and (ii) we vary the standard deviation to achieve different coefficients of variation (CV = σ/μ): low (CV = 0.5), medium (CV = 1), and high (CV = 2). We then took discrete points on a grid of ±0, 0.25, and 0.5 standard deviations to generate five different demand scenarios for each period in the MDP. The intervals were chosen to provide significant dispersion while avoiding negative demand scenarios. We also consider the interaction between random and seasonal variation.
We find that, while random variation has a significant impact on the objective, malaria demand seasonality is handled well by transshipment. The average (maximum) cost gap between the seasonal and flat demand patterns was $14 ($58) over a three‐month time period on average, or 1.2% (4.9%) when compared with the baseline cost, which is the cost equivalent of 0.7 (2.9) shortages over three months. Figure 12a shows that seasonality has little effect if there are either high or low levels of initial inventory in the cluster, with the largest impact occurring if there are moderate levels of inventory. Figure 12c demonstrates that random variability has a much larger impact on total cost than seasonality. Also observe that as random variation increases, so too does the impact of seasonality (black solid line vs. dashed gray line).
Cost Gap Caused by Seasonal and Random Demand Variability
The structure of the cost gap for low (CV = 0.5) vs. high (CV = 2) random variation relative to initial starting inventory at Clinics 124 and 133 is nearly identical to the seasonality gap, but the magnitude is much higher. The average (maximum) cost gap between the low and high variation demand patterns was $146 ($686), or 12% (57%) of the baseline cost, over a three‐month time period on average, which is equivalent to 7.3 (34.3) shortages over 3 months. For both seasonal and random variation, initial inventory imbalance has little effect on the cost gap.
Periodic Review Interval
In the developing world, pharmaceutical inventories at distributing clinics are often taken using a paper‐based system rather than an electronic inventory. This process can be time consuming, so for practicality it is better to consider periodic system review rather than continuous review. We study the impact of the transshipment frequency by varying the length of the periodic review interval over a three‐month span and comparing with a daily transshipment policy (which is similar to continuous review).
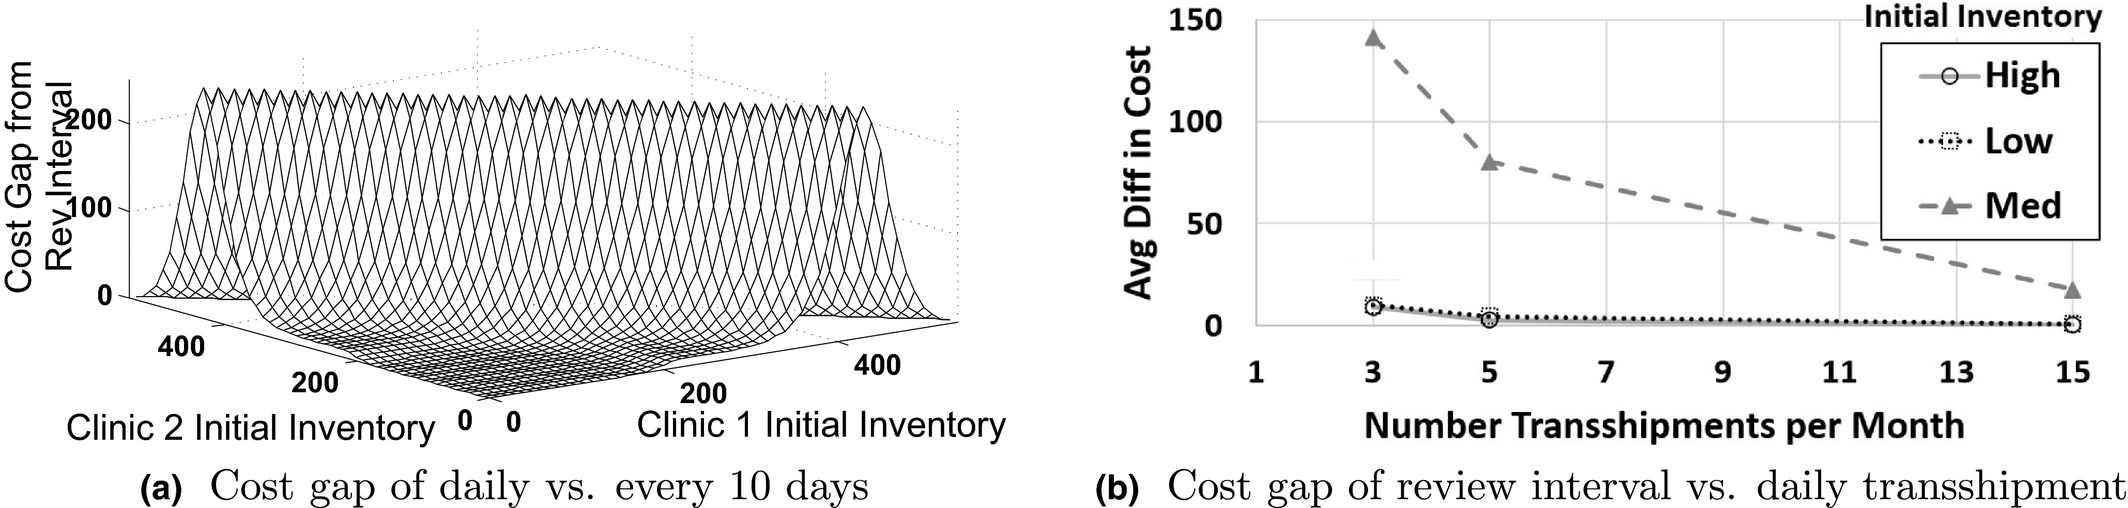
Figure 13a shows the cost gap going from daily transshipment to once every ten days. There is little impact if there is small or large amount of initial inventory, and initial inventory imbalance does not play a big role. The average (maximum) cost gap between transshipping daily vs. once every ten days was $71 ($267), or 3% (11%) of the baseline cost, over a three‐month time period on average, which is equivalent to 3.6 (13.4) shortages over three months. Figure 13b shows the cost gap for various transshipment intervals for high, medium, and low levels of initial supply. The frequency of inventory review has an average gap equivalent to only one extra shortage each month. This is encouraging for developing countries where continuous or frequent review enabled by electronic tracking is not likely to be available.
Cost Gap Caused by the Frequency of Transshipment for Daily, Every Other Day, Every Six Days, and Every 10 days over a Three‐Month Time Frame
Insights and Policy Design
The results of our numerical experiments yield some useful insights for designing an effective distribution strategy. First, the largest cost impact comes from year to year variability in demand. Better data collection and forecasting can help reduce some of this uncertainty. Second, transshipment frequency did not have a large impact on cost, implying that transshipment can be effective even with infrequent, paper‐based data collection methods prevalent in the developing world. Third, the balanced policy is very close to optimal, which indicates that it is a sound principle to balance inventory between clinics at each transshipment period. Furthermore, if the initial inventories start out balanced, then there is almost no difference between the equitable inventory balancing policy and the optimal policy. In addition to being an easily implemented policy, inventory balancing is also likely to be perceived as fair by all parties and near optimal. These reasons suggest that inventory balancing (relative to average demand at each clinic) can be an effective transshipment policy within clusters.
Methods for Implementing Transshipment Policies within a Clinic Cluster
In this section, we propose a practical operational policy for managing ACT distribution within a clinic cluster. This policy establishes transshipment inventory zones demarcated by the amount of inventory at each clinic in the cluster. This could be easily implemented in a paper‐based chart/table. Determining which zone the cluster currently falls within would directly tell the clinics how many units to transship and where. These inventory zones would consider the total number of ACTs allocated to the cluster from the strategic planning model as well as the “cost” of transshipment. Transshipment cost can include the actual shipping cost and the willingness of clinics to transship. If clinics are opposed to transshipping, this cost would increase and the transshipment zones would shrink. However, clinics are likely to understand that if they are unwilling to transship, they also will not receive transshipments when needed due to the cluster level policy. This should encourage their willingness to participate in a transshipment scheme.
In support of transshipment as a viable operational policy, neighboring Zambia already has clinic‐to‐clinic transshipment policies in place (see Mtonga 2010). According to Zambia's Ministry of Health Standard Operating Procedure, Mtonga (2010), and interviews of a person familiar with the drug distribution system in Zambia, ministry of health clinics use a paper‐based system to keep a monthly record of three months average consumption and stock levels. This is used to calculate restocking levels. At any point in time, most clinics are in short supply of some drugs and have a surplus of others. The district level health office, which is in charge of 20–30 clinics, distributes medications from the clinics that have surplus to the clinics with shortages. Where all clinics have a low inventory, the district level health office will typically try to balance the shortages across clinics. Notably, transshipment is already being practiced on an ad hoc basis in Malawi itself as confirmed by conversations with local professionals and Kiczek et al. (2009).
There is an opportunity to leverage this type of stock count communication scheme. After the transshipment areas are designed and agreed upon, the district level office can use a decision support system to guide periodic transshipment of ACTs. The district office would periodically calculate stock levels for each clinic within a cluster. This decision support system could replace or augment the heuristic approach currently being employed in Malawi and Zambia to better serve the populations of each clinic cluster. Furthermore, because the clinic clusters identified in section 3.6 are generally small, the incentive to share between them is greater because the populations served by these clusters are all neighbors. It may be possible to establish authority over each cluster to manage the within‐cluster transshipment as a method to increase adoption.
Conclusion and Future Research
This paper addresses the challenging problem of distributing pharmaceutical products with seasonal demand through a centralized public health delivery system common to developing countries. Specific challenges to distributing pharmaceuticals in countries such as Malawi include: under‐developed transportation infrastructure, spatially and temporally uncertain demand, and limited financial resources. This paper develops an analytical approach to effective distribution of malaria drugs, integrating strategic level planning (where the planning horizon spans through the malaria season) with a tactical (periodic) level transshipment optimization. We do so by decomposing the national network problem into localized clinic clusters. This enables a tractable solution to the periodic review tactical MDP. Through analysis of the MDP's structural properties, we show that a simple area‐based transshipment policy could easily support transshipment decisions, even in a paper‐based inventory management environment. This decomposition heuristic was shown to be nearly optimal when compared with a fully integrated optimization that would be intractable at the national scale. Furthermore, the clinic clusters identified in the optimal solution of our strategic model can be a novel mechanism to overcoming political concerns while taking full advantage of the transshipment approach.
Using the strategic and tactical models, we explored several unique features of medication distribution in the developing world through a set of computational experiments using compiled estimates of facility level malaria counts for Malawi. Our results suggest that strategic planning can reduce expected ACT shortages by at least 16% while controlling transportation costs. We further showed that the optimal transshipment solution cost converges to the delayed shipment solution cost as the clinic‐to‐clinic transshipping becomes more expensive. However, transshipment is more effective in dealing with poor infrastructure and bad road conditions prevalent in the developing world. Investigating other features of medication distribution in the developing world, we found that equitable polices are near optimal for geographically proximate clinic clusters, transshipment is fairly robust to the length of the periodic review interval that may be imposed by paper‐based inventory systems in the developing world, transshipment solutions are robust to seasonality (as in the case of malaria), and year to year variation has the largest impact of any of the above factors.
A challenge regarding the successful application of the methods offered is in the implementation itself. Successful implementation would require proactive efforts from the Ministry of Health of Malawi to improve the current system. The problems of inadequate communication and transportation infrastructure could hinder full implementation. A low‐cost, cell phone‐based reporting system such as SMS For Life in Tanzania could at least overcome the former. Given the easily transportable nature of malaria medications and the relatively short distance between facilities, the latter might be overcome simply by sending goods through public transport such as minibuses or by taking medications directly to facilities by bicycle. It is difficult to foresee how these methods, which rely on a connected and cooperative system of facilities, could be utilized in the private sector portion of Malawi's healthcare landscape, because it represents a patchwork of small sole‐proprietorships which might be hesitant to transship goods for free and even more hesitant to allow other shops to take away potential customers. It is possible that innovative mechanisms enabling compensated transshipment might be developed, although that topic is outside the scope of this paper.
In conclusion, the result of our integrated strategic and tactical models is a tractable decision support system approach that can guide government policy in driving better health outcomes at a lower cost. Our methods could be extended to fit pharmaceutical products for other diseases such as diarrhea, dengue fever, and influenza. Furthermore, the methods offered here could be applied not only to public sector supply chains but also to NGO or private sector supply chains for products which have seasonal and geographic demand heterogeneities.