
Abstract
We consider an M/M/1 queueing system with a pay‐for‐priority option, and study customers’ joint decisions between joining/balking and pay‐for‐priority. The equilibrium strategies are thus two‐dimensional. First, we fully characterize the equilibrium structure and identify the Pareto‐dominant strategies of such a game analytically, under both the observable and unobservable settings. Interestingly, the equilibrium structure, the system throughput, and the service provider's optimal price for priority premium can all be non‐monotone in the service reward, which departs from the existing models of priority queues without balking. In particular, we find that an increase in service reward can actually hurt the firm's revenue (everything else being equal). Second, we compare the server's revenue between the observable and the unobservable settings. We find that the service provider is better off with the observable setting when the system load is either low or high, but benefits more from the unobservable setting when the system load is medium. The fact that the optimal setting switches twice as the system load increases, is rather interesting; we explain the intuitions behind it in this study. Finally, we demonstrate the implications of these findings by applying our model framework to Papa John's Pizza, based on publicly available information. Our analysis suggests that Papa John's could benefit from prviding customers with wait information while slightly decreasing its fee for Papa Priority.
Introduction
In service industries, charging for priority access is an efficient and prevalent business scheme for managing congestion and revenue. On the one hand, both the consumer welfare and the service provider's revenue can improve with the design of an appropriate priority system (Gavirneni and Kulkarni 2016). And, on the other hand, the concept of pay‐for‐priority is natural for customers to understand—one can obtain priority access to the service by paying a premium in addition to the basic service fee, or remain a non‐priority customer who is responsible only for the basic service fee but may be overtaken by future customers who opt in for priority.
From the perspective of the revenue‐maximizing service provider, both service fee and priority premium contribute to revenue. Correspondingly, when the service provider sets an optimal price for priority access, it should take into consideration two possible market‐force consequences: (i) The price of priority premium can affect the total customer throughput, and therefore the total amount collected from the basic service charges; and (ii) for customers that decide to use the service, priority pricing also determines the number of priority purchases and thus the portion of revenue that derives from priority premium. At a more granular level, because customers can make both joining/balking and priority/non‐priority decisions upon arrival to the service system, the trade‐off identified in the point (i) above can be related to customers joining/balking decision while point (ii) is based on their priority‐purchasing decision.
In the literature of Operations Management, pay‐for‐priority decisions have been well‐studied with strategic customers, however, joining/balking decisions are typically not studied concurrently. Such a treatment (which ignores balking), could be sometimes unrealistic especially when customers have alternative service seeking options. Motivated by this research gap, our work studies customers’ joint decisions on joining/balking and pay‐for‐priority. Consider the following priority‐queue examples. (Tourism) To obtain a UK tourist visa, there is an optional service where the applicant “can pay an extra fee to fast‐track the application and have the visa application processed ahead of the non‐priority applications.”
1
However due to the high price and otherwise lengthy visa process, some customers choose to tour a different country (The Daily Telegraph 2013). (Recreation & Entertainment) Visitors of the Universal Orlando Resort can pay an extra $85 to get in the priority line. Similarly, the Park City Mountain Resort in Utah offers a $25/day Fast Track lift‐ticket upgrade that allows patrons to use express lanes at popular lifts. Alternative balking options exist for customers in parks (e.g., Walt Disney World) and ski resorts (e.g., Canyons) nearby. (Restaurants) Papa John's moves a pizza order to the front of the line “so that it is made faster” if customers pay a $3 “Papa Priority” fee;
2
RAAD, a start‐up mobile app, allows its users to skip the long lines at bars and restaurants by paying a certain fee set by the vendors. In both settings, customers can freely decide to join, purchase priority, or balk (using a different restaurant). Later in the study, we will use the Papa John's Pizza example again to illustrate some of our findings (section 5.3). (Manufacturing) Tesla customers can pay $1000 to reserve a Model 3 car which will be delivered according to the order when the reservation is received. Customers who do not reserve will not get the car until all the pre‐orders are fulfilled. The money is a deposit, so the priority premium in this example is the opportunity cost of the capital. Customers also have the option of purchasing a car from a different company.
All of the above‐mentioned priority examples include customer's balking options. Studying balking altogether with priority decisions is however not only relevant to real‐world practices, but also brings about technical merits. Particularly, there are three modeling advantages. First, without balking only a system with workload less than one can be studied due to the stability requirement. Second, if customers do not have a balking option, they are assumed to join the queue even when the expected utility under the service provider's optimal price is negative, causing inconsistency with behavior of strategic consumers. 3 Last but not least, revenue maximizing is purely equal to priority premium maximizing when balking is not allowed (i.e., throughput is fixed) because revenue collected from the basic service fee is constant. This totally ignores the impact of priority pricing on system throughput and customers’ joining/balking decisions, and can lead to suboptimal decisions and revenues for the firm (see Appendix S3 for a specific example).
To this end, we incorporate customers’ joining/balking decisions into a pay‐for‐priority system. The problem is nontrivial due to the two‐dimensional decision scope. We consider the following research questions: Q1. How do strategic customers make simultaneous joining and priority decisions? Q2. What is the service provider's optimal price for priority premium?
Furthermore, observing the real‐life examples mentioned earlier can be broadly categorized into observable and unobservable settings; we want to study Q1 and Q2 for both the observable and unobservable cases. Doing so enables us to understand the impact of queue length information on the server's revenue. In particular, we develop one more research question: Q3. Comparing the server's revenues between the observable and unobservable setting, which setting is best for the service provider?
To address the research questions, we consider a single‐server queue with a pay‐for‐priority option. Homogeneous customers arrive according to a Poisson process with potential arrival rate Λ. The service times are independent and exponentially distributed with rate μ. We assume, as is done typically in the literature, that the values of Λ and μ are common knowledge among the customers. Upon arrival, a new customer decides whether to join the queue or balk (value of outside option is normalized to zero), with or without seeing the state of the system. A joining customer also decides whether or not to purchase priority for a premium P set by the service provider. A priority customer obtains non‐preemptive priority for service over the non‐priority customers (i.e. a non‐priority customer who has started service will not be cut in line by a priority customer), and the queue disciplines within the priority and within the non‐priority lines are both first‐come, first‐serve (FCFS). We note that the non‐preemptive priority discipline is technically more challenging than the preemptive case, 4 and also more consistent with real‐world examples. Customers are risk neutral and act to maximize their expected utilities. The options they have upon arrival to the system can be distilled into (i) balk; (ii) join the queue and purchase priority; and (iii) join the queue without purchasing priority. We assume that any decision made is irrevocable, and reneging or purchasing priority after joining the non‐priority line is not allowed.
A typical cost‐reward structure in the literature is adopted, as in Naor (1969): Each customer receives a reward R, which is equal to the service value V less the basic service fee F, from completion of the service, but incurs a waiting cost C per unit of time while in the system. The fee for priority and non‐priority customers are therefore given by (P + F) and F, respectively. For notational convenience, we denote the
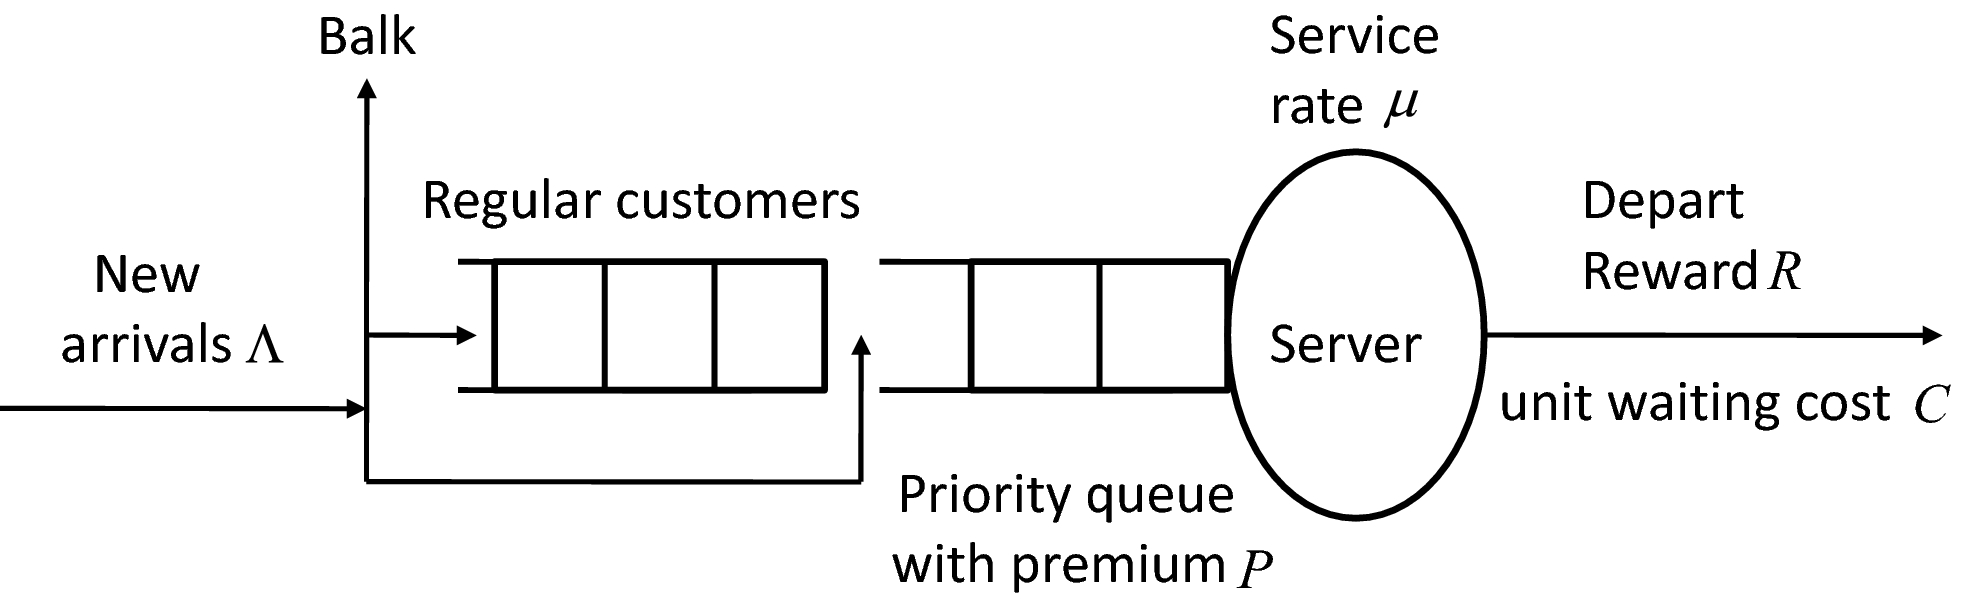
Schematic Representation of the M/M/1 Priority Queueing System with Balking
In the observable case, customers make rational decisions based on the state of the system observed upon arrival, including the number of customers in the priority queue and in the entire system. While they do not know the state of the system in the unobservable case, customers make decisions based on evaluating the expected waiting times from the system parameters. As all the customers are ex ante symmetric in our model, we will only consider symmetric equilibria under which all of the customers adopt the same strategy.
The main results of the study are as follows: We fully characterize the equilibrium structure of the model and develop the necessary analytical tools to identify the Pareto‐dominant strategy. In particular, for the observable case, we prove that pure equilibrium can only be a threshold strategy with two thresholds. For the unobservable case, we prove that a mixed strategy can be an evolutionarily stable strategy (ESS).
5
Furthermore, we show that avoid the crowd (ATC) behavior can exist in the presence of multiple equilibria in a two‐dimensional decision problem. We demonstrate that the equilibrium structure, system throughput and the service provider's optimal price for the priority premium can all be non‐monotone in the service reward R. Interestingly, with customers making both joining/balking and priority decisions, increasing service value without increasing service fees can actually lead to reduced firm revenue. Comparing the server's optimal revenues under the observable and unobservable setting, we find that the service provider is better off with the observable setting when the system load is either low or high, but with the unobservable setting when the system load is medium. We demonstrate the implications of these findings by applying our model framework to a mini case study (Papa John's Pizza) based on real‐world information.
The rest of study is structured as follows: Section 2 summarizes the related literature and highlights the contribution of our work. Sections 3 and 4 investigate the unobservable and observable cases of the model. Section 5 presents numerical analyses including a mini case study that reveals interesting insights on equilibrium, as well as on the service provider's revenue across different settings. Section 6 concludes the study. We defer all the proofs to Appendix S1. Appendix S2 generalizes some of the analyses to the M/G/1 setting and demonstrates that the convergence speed of our system to steady‐state is very reasonable. Appendix S3 provides a specific example to illustrate that leaving out customers’ balking decisions in a priority queue can lead to quite a suboptimal revenue for the firm.
Literature Review
Our paper studies equilibrium strategies of strategic customers in a priority queueing system with balking and the subsequent revenue management problem for the server.
The literature on strategic customers in queues dates back to Naor (1969). In Naor's model, homogeneous customers observe the queue length upon arrival to an M/M/1 queue and make decisions to either join the queue or balk. Edelson and Hilderbrand (1975) studied the unobservable version of Naor's model, where same decisions are made by the customers without observing the state of the system. We study both the observable and the unobservable settings by allowing the customers to make both joining/balking and pay‐for‐priority decisions. Hassin (1986), Chen and Frank (2004), Chambers and Kouvelis (2006), Shone et al. (2013), and Hu et al. (2018) all compare the outcomes between an observable queue and an unobservable queue with joining/balking customers, however, to the extent of our knowledge, this study seems to be the first one that compares observable and unobservable priority queueing systems.
Following Naor (1969), strategic customer behavior in queues has been studied in a large volume of literature with multiple dimensions, such as heterogeneous customers, reneging or retrial behavior, and delay information announcements. We will primarily review papers with priorities below and interested readers are referred to Hassin and Haviv (2003), Stidham (2009), and Hassin (2016) for comprehensive reviews on other variations to Naor's model.
There are different regimes studied in the priority literature. Inspired by the examples listed in the Introduction section, our model allows for balking and focuses on non‐preemptive priority. The unobservable part of our model can be seen as an extension to the M/M/1 model discussed in section 4.2 of Hassin and Haviv (2003). In their model, customers decide whether to purchase priority for a given price or to remain a non‐priority customer for free. We extend their model by allowing the customers to balk when their expected payoff from joining the system is negative.
Gavirneni and Kulkarni (2016) studied a similar unobservable setting where customers balk when their expected payoff is lower than that in a first in, first out (FIFO) system without balking or priorities. In their paper, customers have heterogeneous waiting costs (modeled as a Burr distribution), so the ones with high/median/low waiting costs choose to become priority/non‐priority/balking customers, respectively. In contrast, customers in our model are ex ante symmetric, and our work solves a two‐dimensional equilibrium with simultaneous joining/balking and priority purchasing decisions under the unobservable setting which has not been done before.
Our observable setting is built on the models in Adiri and Yechiali (1974) and Hassin and Haviv (1997). Adiri and Yechiali (1974) analyzed an M/M/1 model with two priority classes when the priority discipline is either preemptive or non‐preemptive. They identified a single pure equilibrium of threshold‐type that specifies that arriving customers will purchase priority, if and only if the number of customers in the non‐priority queue exceeds a certain threshold. Hassin and Haviv (1997) extended the set of equilibrium strategies to include mixed strategies under the preemptive regime. The authors added to Adiri and Yechiali (1974) by showing that multiple equilibria exist in this case and they also gave an example of a non‐threshold (pure) equilibrium.
Compared to Adiri and Yechiali (1974), we show that multiple threshold equilibria exist under the non‐preemptive regime, and give both necessary and sufficient equilibrium conditions. The single equilibrium (threshold) that Adiri and Yechiali (1974) identified in equation (20), on page 1057 of their paper, coincides with the biggest possible equilibrium threshold in our study. We also prove analytically that a pure equilibrium strategy under the non‐preemptive regime must be of a threshold type. This is a nice contrast to the preemptive result studied in Hassin and Haviv (1997). The non‐threshold pure equilibrium example in their paper no longer survives as an equilibrium in our case.
For both the unobservable and observable cases, we are able to identify the full equilibrium structure and pin down the Pareto‐dominant equilibrium by analyzing the structure of the consumer welfare function. We then study the pricing problem for the server when it can adjust the priority premium. Alperstein (1988) considered a similar revenue maximization problem in the preemptive regime. Mendelson and Whang (1990) showed that maximum social welfare can be induced using the Cμ‐rule when the customer classes are exogenously segmented. Afèche and Mendelson (2014) extended the results to a generalized delay cost structure.
Rather than paying the priority premium determined by the service provider, another priority pricing scheme known as “bribery” occurs when customers choose the amount of money they wish to pay/bribe in exchange for a level of priority which is in turn determined by the payment amount. Typically, customers who pay a larger bribe are placed in the queue before those who pay less. We refer interested readers to section 4.5 in Hassin and Haviv (2003) for an excellent review of the bribery literature.
According to the same book, the strategy of customers can be defined as either avoid the crowd (ATC) or follow the crowd (FTC). Typically, a unique equilibrium can be identified because of the ATC behavior, while FTC allows for multiple equilibria (e.g., see Afimeimounga et al. 2005, Burnetas and Economou 2007, Guo and Hassin 2011, Guo and Zhang 2013). We show, however, that ATC behavior can exist in the presence of multiple equilibria in a two‐dimensional decision problem like ours. There seems little prior research that studies two‐dimensional equilibrium strategies of strategic customers. An exception is Hassin and Roet‐Green (2017), in whose setting customers first decide whether to join an unobservable queue, inspect the queue length or balk and then make a second join‐or‐balk decision if inspecting.
The Unobservable Model
In our unobservable model, we assume customers do not observe the state of the system. They make decisions based on the information of the system including Λ (potential arrival rate) and μ (service rate) as well as the cost/reward parameters C (unit waiting cost), P (price of the priority premium) and R ≜ V − F (service reward ≜ service value − service fee). To consider a symmetric equilibrium, suppose that customers will join the system with probability q ∈ [0, 1] (and balk with probability 1 − q) upon arrival, and any joining customer will purchase priority with probability p ∈ [0, 1]. The decision process is shown in Figure 2.
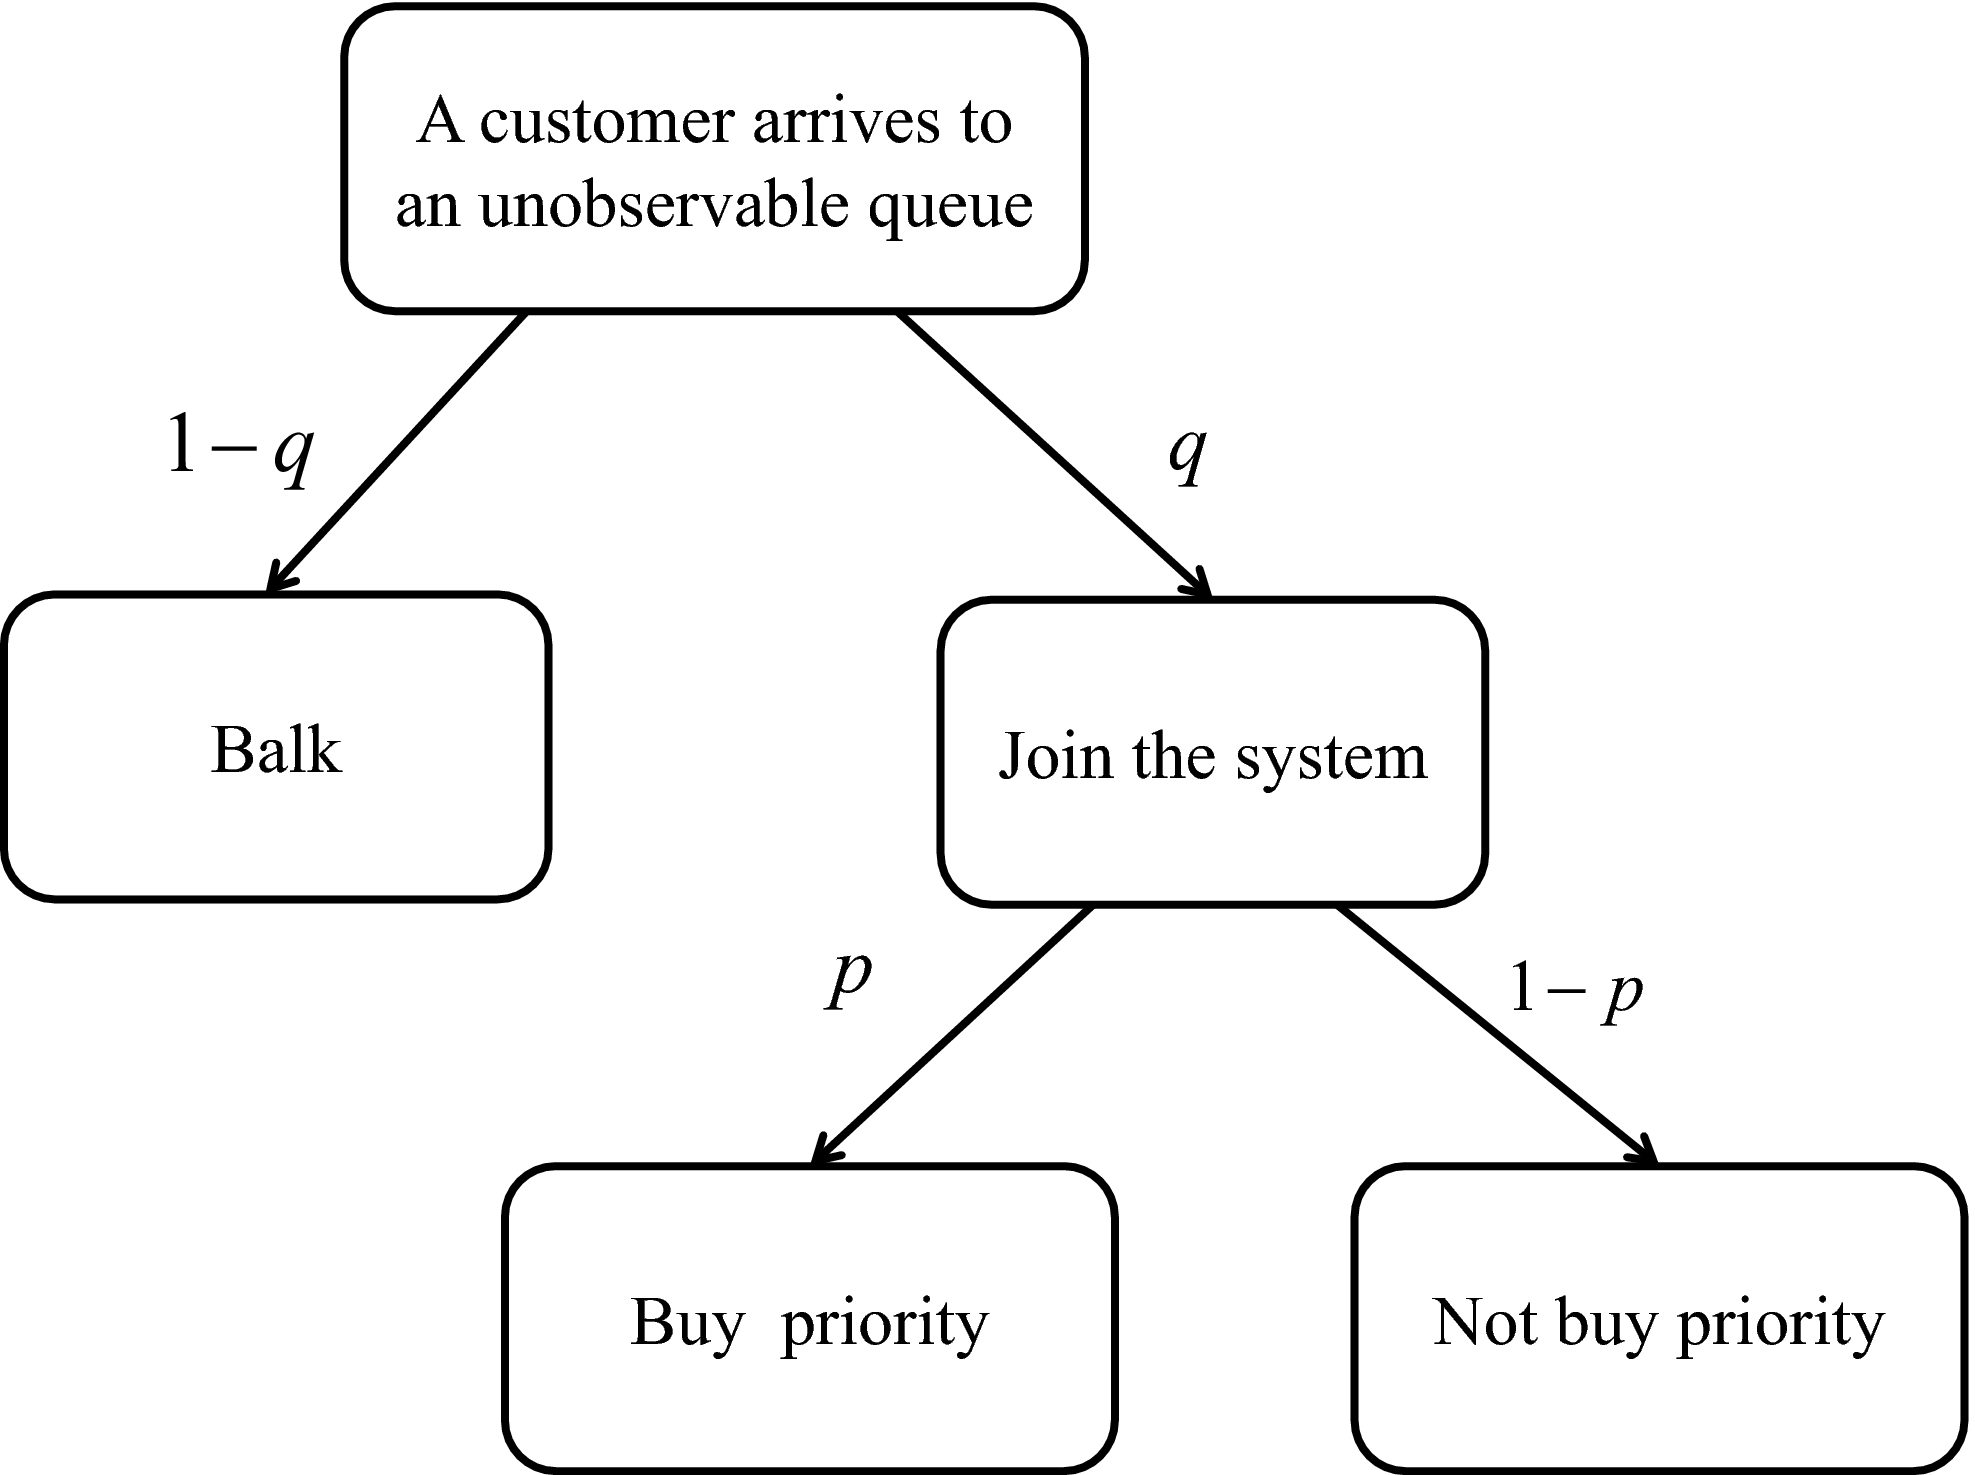
The Decision Process under the Unobservable Setting
The strategy space of the customers can be described as a pair (p, q) ∈ [0, 1] × [0, 1] in the two‐dimensional space. Under (p, q), the effective arrival rate to the system is λ ≜ Λq, where the effective arrival rate for type‐o and type‐p customers are λ(1 − p) and λp, respectively. The three pure strategies, balking, joining without priority and joining with priority, can be characterized by (0,0), (0,1) and (1,1), respectively. Otherwise, (p, q) defines a mixed strategy. Our goal is to identify all the equilibrium strategies. Because of the one‐to‐one correspondence between q and λ (i.e., λ = Λq), we will use (p, λ) for notational convenience to signify a strategy for the customers.
In this section, we first derive the equilibrium strategy for the customers under some given priority premium P, and then find the optimal revenue for the service provider when it can adjust P. To simplify notations, we will use ν R ≜ Rμ/C and ν P ≜ Pμ/C which are the service reward and priority premium relative to the average waiting cost for a service cycle.
Equilibrium Strategies
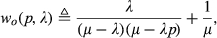
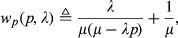
The expected sojourn times for the two types of customers are functions of effective arrival rate λ and the probability to purchase priority p, which are given as follows (see chapter 33 of Harchol‐Balter 2013):
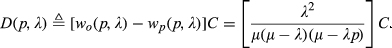
D(p, λ) is an important criteria for customers’ decision making. By purchasing priority, a customer can lower expected waiting cost by D(p, λ). Thus, if the priority premium is less than D(p, λ), it is wise for the customer to purchase priority. Otherwise, it is not. The following lemma describes an important property of this reduction function.
When λ < μ and 0 ≤ p ≤ 1, D(p, λ) is monotone increasing in p and λ.
Lemma 1 shows that the reduction in waiting cost with purchasing the priority increases with the total effective arrival rate to the system, as well as the probability of the priority purchase among the joining customers. Recall that D(p, λ) = [w o (p, λ) − w p (p, λ)]C. Intuitively, as more customers choose to enter the system or purchase priority, a non‐priority customer will on average be more likely to be overtaken by a greater number of priority customers who arrive in the future. Therefore, this customer will be more incentivized to purchase priority. This is an FTC behavior described by Hassin and Haviv (2003).
The strategy of the customers depends on both the parameters of the system and the announced price P for the priority premium. When all customers follow the strategy (p, λ) (hereinafter referred to as “under” the strategy (p, λ)), we define the expected total costs for the two types of customers as C o (p, λ) ≜ w o (p, λ)C and C p (p, λ) ≜ w p (p, λ)C + P, respectively. These costs are shown in Figure 3 as functions of λ. In particular, four curves, C o (0, λ), C o (1, λ), C p (1, λ), and C p (1, λ), are plotted.
Expected Total Costs for the Customers vs. Effective Arrival Rate [Color figure can be viewed at
Note that D(p, λ) = P holds if and only if C o (p, λ) = C p (p, λ), so the possible (p, λ) that satisfy C o (p, λ) = C p (p, λ) are given by the shaded areas in Figure 3a and b. To derive the equilibrium strategy of the customers, however, we need to introduce a lemma first.
If (p, λ) is an internal equilibrium, that is, p ∈ (0, 1), then w
o
(p(λ), λ) decreases in λ.
Lemma 2 establishes the monotonicity of the expected waiting time for non‐priority customers under strategy (p, λ) when p ∈ (0, 1). In Figure 3a and b, we bold the points in black that satisfy C
o
(p(λ), λ) = C
p
(p(λ), λ) when

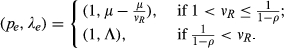
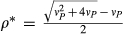
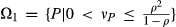
When ρ < 1, for given cost‐reward values C, P, R, the unique Pareto‐dominant equilibrium strategy for the customers, denoted by (p
e
, λ
e
), is given as follows: When ν
P
= 0, p
e
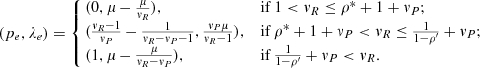
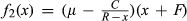
= 1 is the dominant strategy and the system reduces to an FCFS‐based M/M/1 queue where When When where

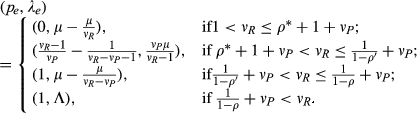

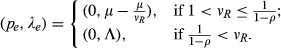


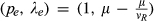
For the case ρ ≥ 1, analogous results can be derived through a similar proof, and the equilibrium strategies of the customers are as follows: When ν
P
= 0, When ν
P
> 0,
We have presented the full equilibrium structure for the unobservable setting in Theorem 1. Even though multiple equilibria exist in some cases, we cannot assert that they represent the FTC situation (as opposed to ATC), since we are studying a two‐dimensional decision problem. For example, when p e = 0, the expected payoff for the customers is R − Cw o (0, Λq e ), that is, no one purchases priority. Since w o (0, Λq) is increasing in q, when all the other customers choose to join the system with higher probability q > q e , it reduces the expected payoff for the tagged individual, and their best response will be to balk. That is, an individual's best response for the joining probability is a decreasing function of the same decision made by other customers when p e = 0. Therefore, it is an ATC situation in terms of the joining probability/decision q.
It is widely known in literature that mixed equilibria cannot be ESS in an unobservable priority queue without balking (e.g., see theorem 4.5 in Hassin and Haviv 2003). This is consistent with our Lemma 1 which observes FTC customer behavior with respect to the priority decision. However, due to customers’ ATC behavior in q, we can actually identify mixed equilibrium that are unique and ESS, e.g., the one in Case (2) of Theorem 1 is proven to be so in Appendix S1.
Figure 4 illustrates the (Pareto‐dominant) equilibrium strategy of the customers, (p e , q e ), when Λ = 3, μ = 2, C = 1, and both the service reward R and the priority premium P vary. The arrows indicate increasing values in R, while the different curves from bottom to top correspond to increasing values in P. As expected, as the service becomes more rewarding (R ↑), customers tend to purchase more priority at the equilibrium (p e ↑). Surprisingly, the equilibrium joining probability q e is not monotone in R. In particular, when R is sufficiently small (c.f. p e = 0 in Figure 4) or sufficiently large (c.f. p e = 1 in Figure 4), q e is increasing in R. Otherwise (c.f. 0 < p e < 1 in Figure 4), q e is decreasing in R. This is because when R is sufficiently small or large, a marginal increase in R does not change the equilibrium priority probability (i.e., p e remains 0 or 1). It prompts more customers to enter the system. Yet when R has an intermediate value, a marginal increase drives more priority activities (p e ↑). This leads to higher expected waiting time for non‐priority customers, and the equilibrium joining probability decreases (q e ↓).
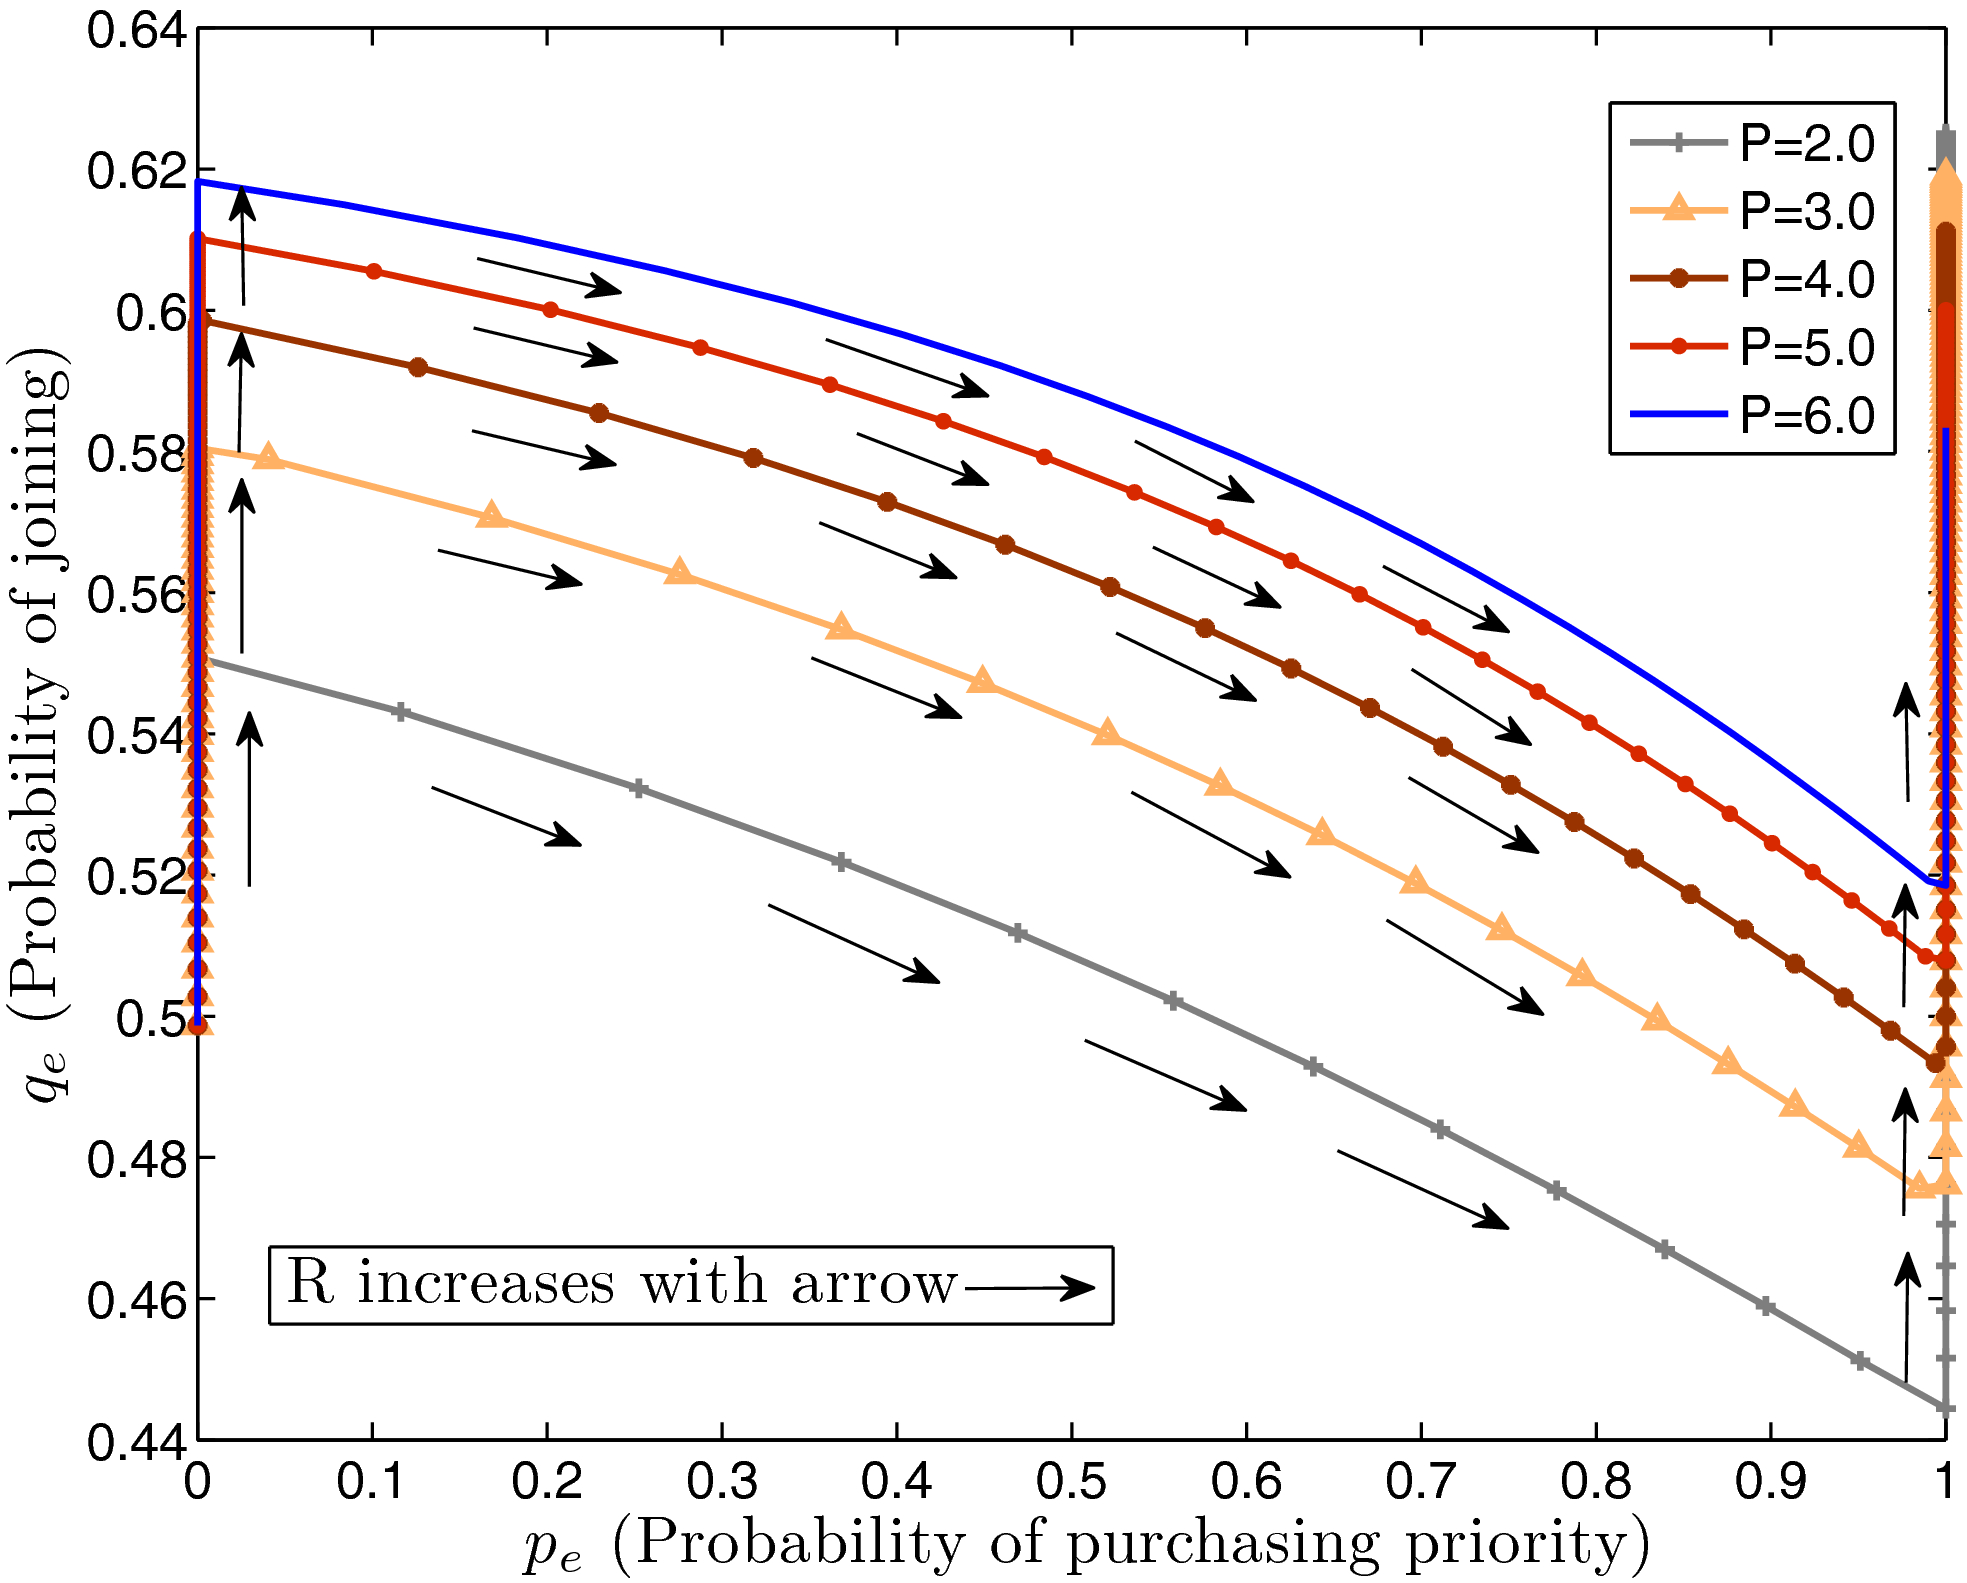
The Equilibrium Strategy vs. R and P When Λ = 3, μ = 2 and C = 1 [Color figure can be viewed at
The firm's revenue is given by the summation of the basic service fee plus the priority premium, that is, Λq e F + Λq e p e P. In this case, for given service/priority fees F and P, increasing the service value V (thus R ↑) may actually reduce the firm's revenue (because Λq e F ↓), especially when the amount of the basic service fee F is significant. This is a counter‐intuitive result: increasing a customer's service value without charging them more could lead to the firm's decrease in revenue. This is due to the intervention of balking and priority decisions explained earlier, and does not occur in M/M/1 queues only with priority (no balking) or only with balking (no priority).
Server's Revenue
In section 3.1, we identified the equilibrium behavior of the customers given the price of priority premium P. In this section, we endogenize P to study the service provider's revenue maximization problem. We assume the basic service fee F is fixed in this study to focus on the pricing strategy of the priority premium. Since customers respond to P, we model the interaction between the server and the customers as a Stackelberg game, where the server is the leader and the customers are the followers. The goal of the server is to maximize its revenue while anticipating customers’ equilibrium strategies. The following lemma delivers an expression for the server's revenue.
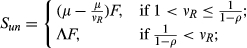
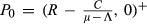
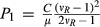
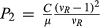
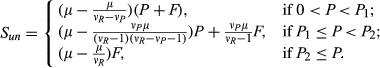
When ρ < 1, the server's expected revenue (rate) under the unobservable case, denoted by S
un
, is given as follows: When ν
P
= 0 or When where

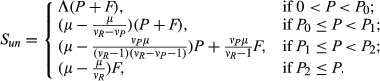
For ρ ≥ 1, we have
Note that in both cases, ρ < 1 and ρ ≥ 1, the server's revenue function S un is continuous and non‐negative in P. Continuity can be easily verified by comparing the left and the right limits of the piecewise function S un evaluated at the points P 0, P 1 and P 2. We present the optimal revenue for the server under the unobservable case in the following theorem:
When ρ < 1, the optimal revenue for server is given by


When ρ ≥ 1, the optimal revenue for the server is given by
We now compare our findings to those in the Gavirneni and Kulkarni's (2016) paper which also studies a priority queueing system with balking customers. In our study, customers balk when their expected utility is negative. In particular, we model the service reward R as an explicit parameter. As R increases, it affects customers’ utility and can lead to more or less joining behavior in equilibrium. However, in the setting of Gavirneni and Kulkarni (2016), customers balk when their expected utility is lower (or equivalently cost is higher) compared to that in a first in, first out (FIFO) system (no balking or priorities) with the same service reward—customers’ joining/balking decisions are thus not affected by the absolute value of the service reward. As a result, even though in both papers an increasing service reward leads to a higher probability of priority purchase among the joining customers, it always increases a firm's revenue in Gavirneni and Kulkarni's (2016) case, but not necessarily in our setting (because there can be less joining customers overall).
The fundamental difference between the two papers is thus driven by the modeling trade‐off where our work focuses on revenue and pricing and theirs on cost and social welfare. To further strengthen the contribution of our study, we now turn to study observable systems. Then through comparing the unobservable and observable settings, we aim to provide managerial insights as to when the service provider is beneficial from revealing the queue length information.
The Observable Model
In the observable setting, all the arriving customers can observe the state of the system including the number of customers at the server, in the priority queue and in the regular (non‐priority) queue. Since R > C/μ, an arriving customer who finds the server idle will immediately obtain service without purchasing priority. Otherwise, this customer decides whether or not to join the system, and if they join, whether or not to purchase priority, in order to maximize expected utility. Clearly, these decisions are state‐dependent, which is different from the unobservable model.
Equilibrium Strategies
A customer strategy is a mapping from the system states to decisions. For simplicity, we will only consider pure and symmetric equilibria for the observable case. Although all the customers adopt the same strategy in equilibrium, when they arrive at different states of the system they can end up making different joining and priority purchasing decisions. Furthermore, unlike a FCFS queue, customers’ decision making is affected by future arrivals. For example, the expected waiting time of type‐o customers is not only affected by other regular customers queued in front of them, but also by type‐p customers who are either in the system or will arrive in the future to overtake them.
Let us denote the state of the server by I, that is, I = 0 indicates that the server is idle and I = 1 is occupied. Let N o and N p denote the number of customers in the regular queue and in the priority queue, respectively (not including the person at the server if any). Then, N ≜ I + N o + N p corresponds to the total number of customers in the system.
Let


For any strategy


Leaving out the balking option for the moment, Lemma 4 states that when strategy


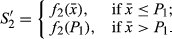
Any pure symmetric equilibrium strategy of the game can be described by two thresholds m,n ≥ 0 where the strategy, written as [m, n], specifies a customer to
Theorem 3 provides a few important insights. (i) If the system is not busy (0 ≤ N ≤ m), customers join the system and do not need to purchase priority. As the system gets busier (m < N ≤ m + n), customers would still join but it would be wiser to purchase priority to reduce the waiting cost. Finally, as the system gets too crowded (N > m + n), customers do not join any more. (ii) A pure equilibrium strategy must be of the type [m, n] as described in the theorem, that is, other pure equilibrium forms do not exist. However, for a given set of system parameters {Λ, μ, C, P, R}, the equilibrium may not be unique, that ism may not be unique (c.f. Theorem 4). (iii) Hassin and Haviv (1997) showed by a counter‐example that a threshold strategy is not the only pure equilibrium type when the priority discipline is preemptive, while in our case non‐preemptive priority is studied and we have a different result. It is easy to verify that the example in their paper is not an equilibrium strategy in our model. To further elaborate on why non‐threshold equilibrium can exist in preemptive queues but not in non‐preemptive queues, let us consider a particular customer at the server when it is busy. Under the non‐preemptive scheme, the decisions of future arrivals do not depend on whether the status of this customer is a priority or an ordinary customer. In contrast, under the preemptive scheme, an arrival benefits more from a priority purchase if the customer currently being served is an ordinary customer (the new arrival can preempt) as opposed to a priority customer (the new arrival cannot preempt). As a consequence, customer decisions not only depend on the queue length but also on the status of the customer at the server, leading to possible non‐threshold equilibria.
Under an equilibrium strategy [m, n], whenever there is any customer waiting in the priority queue (i.e., N
p
> 0), the server must be busy (i.e., I = 1) and there must be m customers in the non‐priority queue (i.e., N
o
= m), so we have N = I + N
o
+ N
p
> m + 1. It implies that N
p
= 0 whenever N ≤ m + 1. Therefore, when m, n > 0, Equation 4 is equivalent to
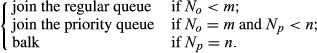
The decision process of the system under the observable setting is illustrated in Figure 5, according to Theorem 3. Note that the expected waiting time of a type‐p customer is not affected by type‐o customers and its expression is straightforward. The challenge is to find the expected waiting time of a type‐o customer who might be overtaken by future arrivals.
The Decision Process under the Observable Setting
Under strategy [m, n], the stochastic process {(I(t), N
o
(t), N
p
(t)), t ≥ 0} is a three‐dimensional continuous‐time Markov chain where N
p
(t) = 0 whenever N
o
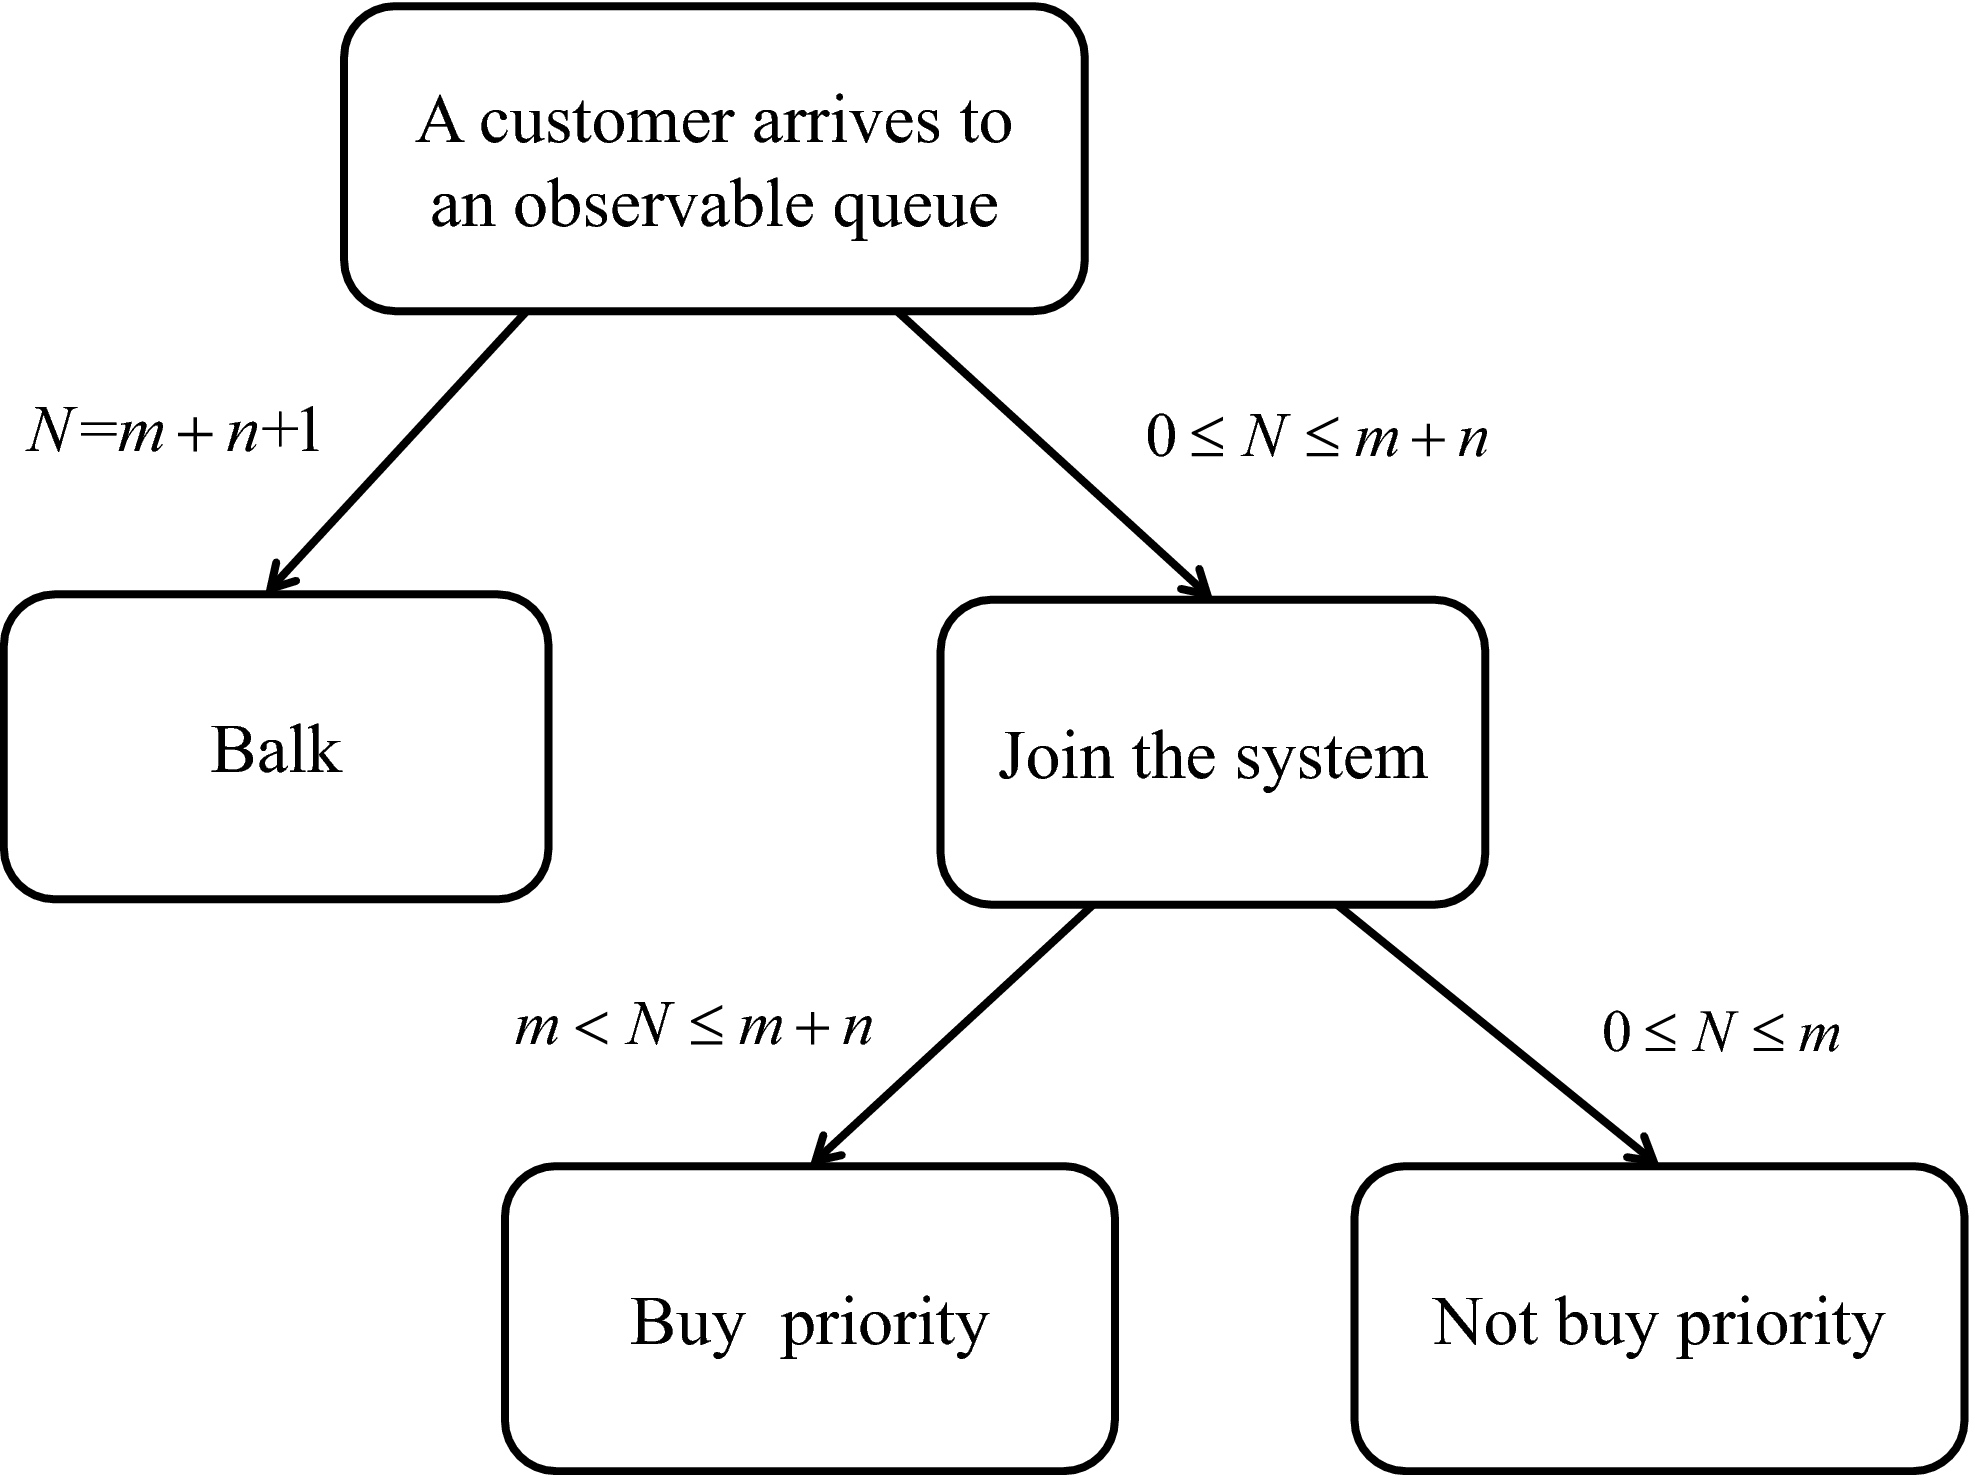
(t) < m. Let A
k
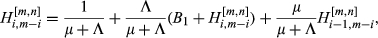
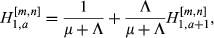
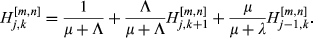
be the expected waiting time for the mth customer in the regular queue when there are k priority customers, k ≤ n. Define B
k
≜ A
k
− A
0 where B
k
is the expected time it takes the system to reach state (1, m, 0) from state (1, m, k) for the first time. A
k
satisfies the following equations:
When all customers adopt strategy [m, n],

Under the strategy [m, n], we define


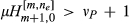
A priority customer incurs an expected sojourn time of at least 2/μ units of time. Otherwise, the server would have been idle when this customer arrived, and the customer should have not purchased the priority. Thus when 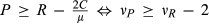
Now consider ν
P
< ν
R
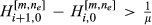
− 2. An equilibrium strategy [m, n] given in Equation 4 specifies that being the n
e
th customer in the priority queue has a positive expected payoff, but not being the (n
e
+ 1)th customer. For a type‐p customer, their expected waiting time is purely determined by the other priority customers queued in front of them and the person at the server, but not any type‐o customers. Thus, we must have 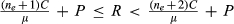

N
p
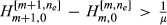
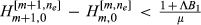
(t) = 0. If Suppose


N
p
(t) > 0. If [m, n
e
] is an equilibrium, we must have 


The expected waiting time of ordinary customers Under [m, n
e
],


Using the fact that 
When 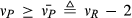


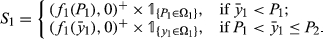
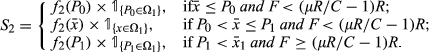
Table 1 summarizes the equilibrium types given by Theorem 4. (i) When the price of the priority premium is too high (

Equilibrium Type vs. 


(iii) When 


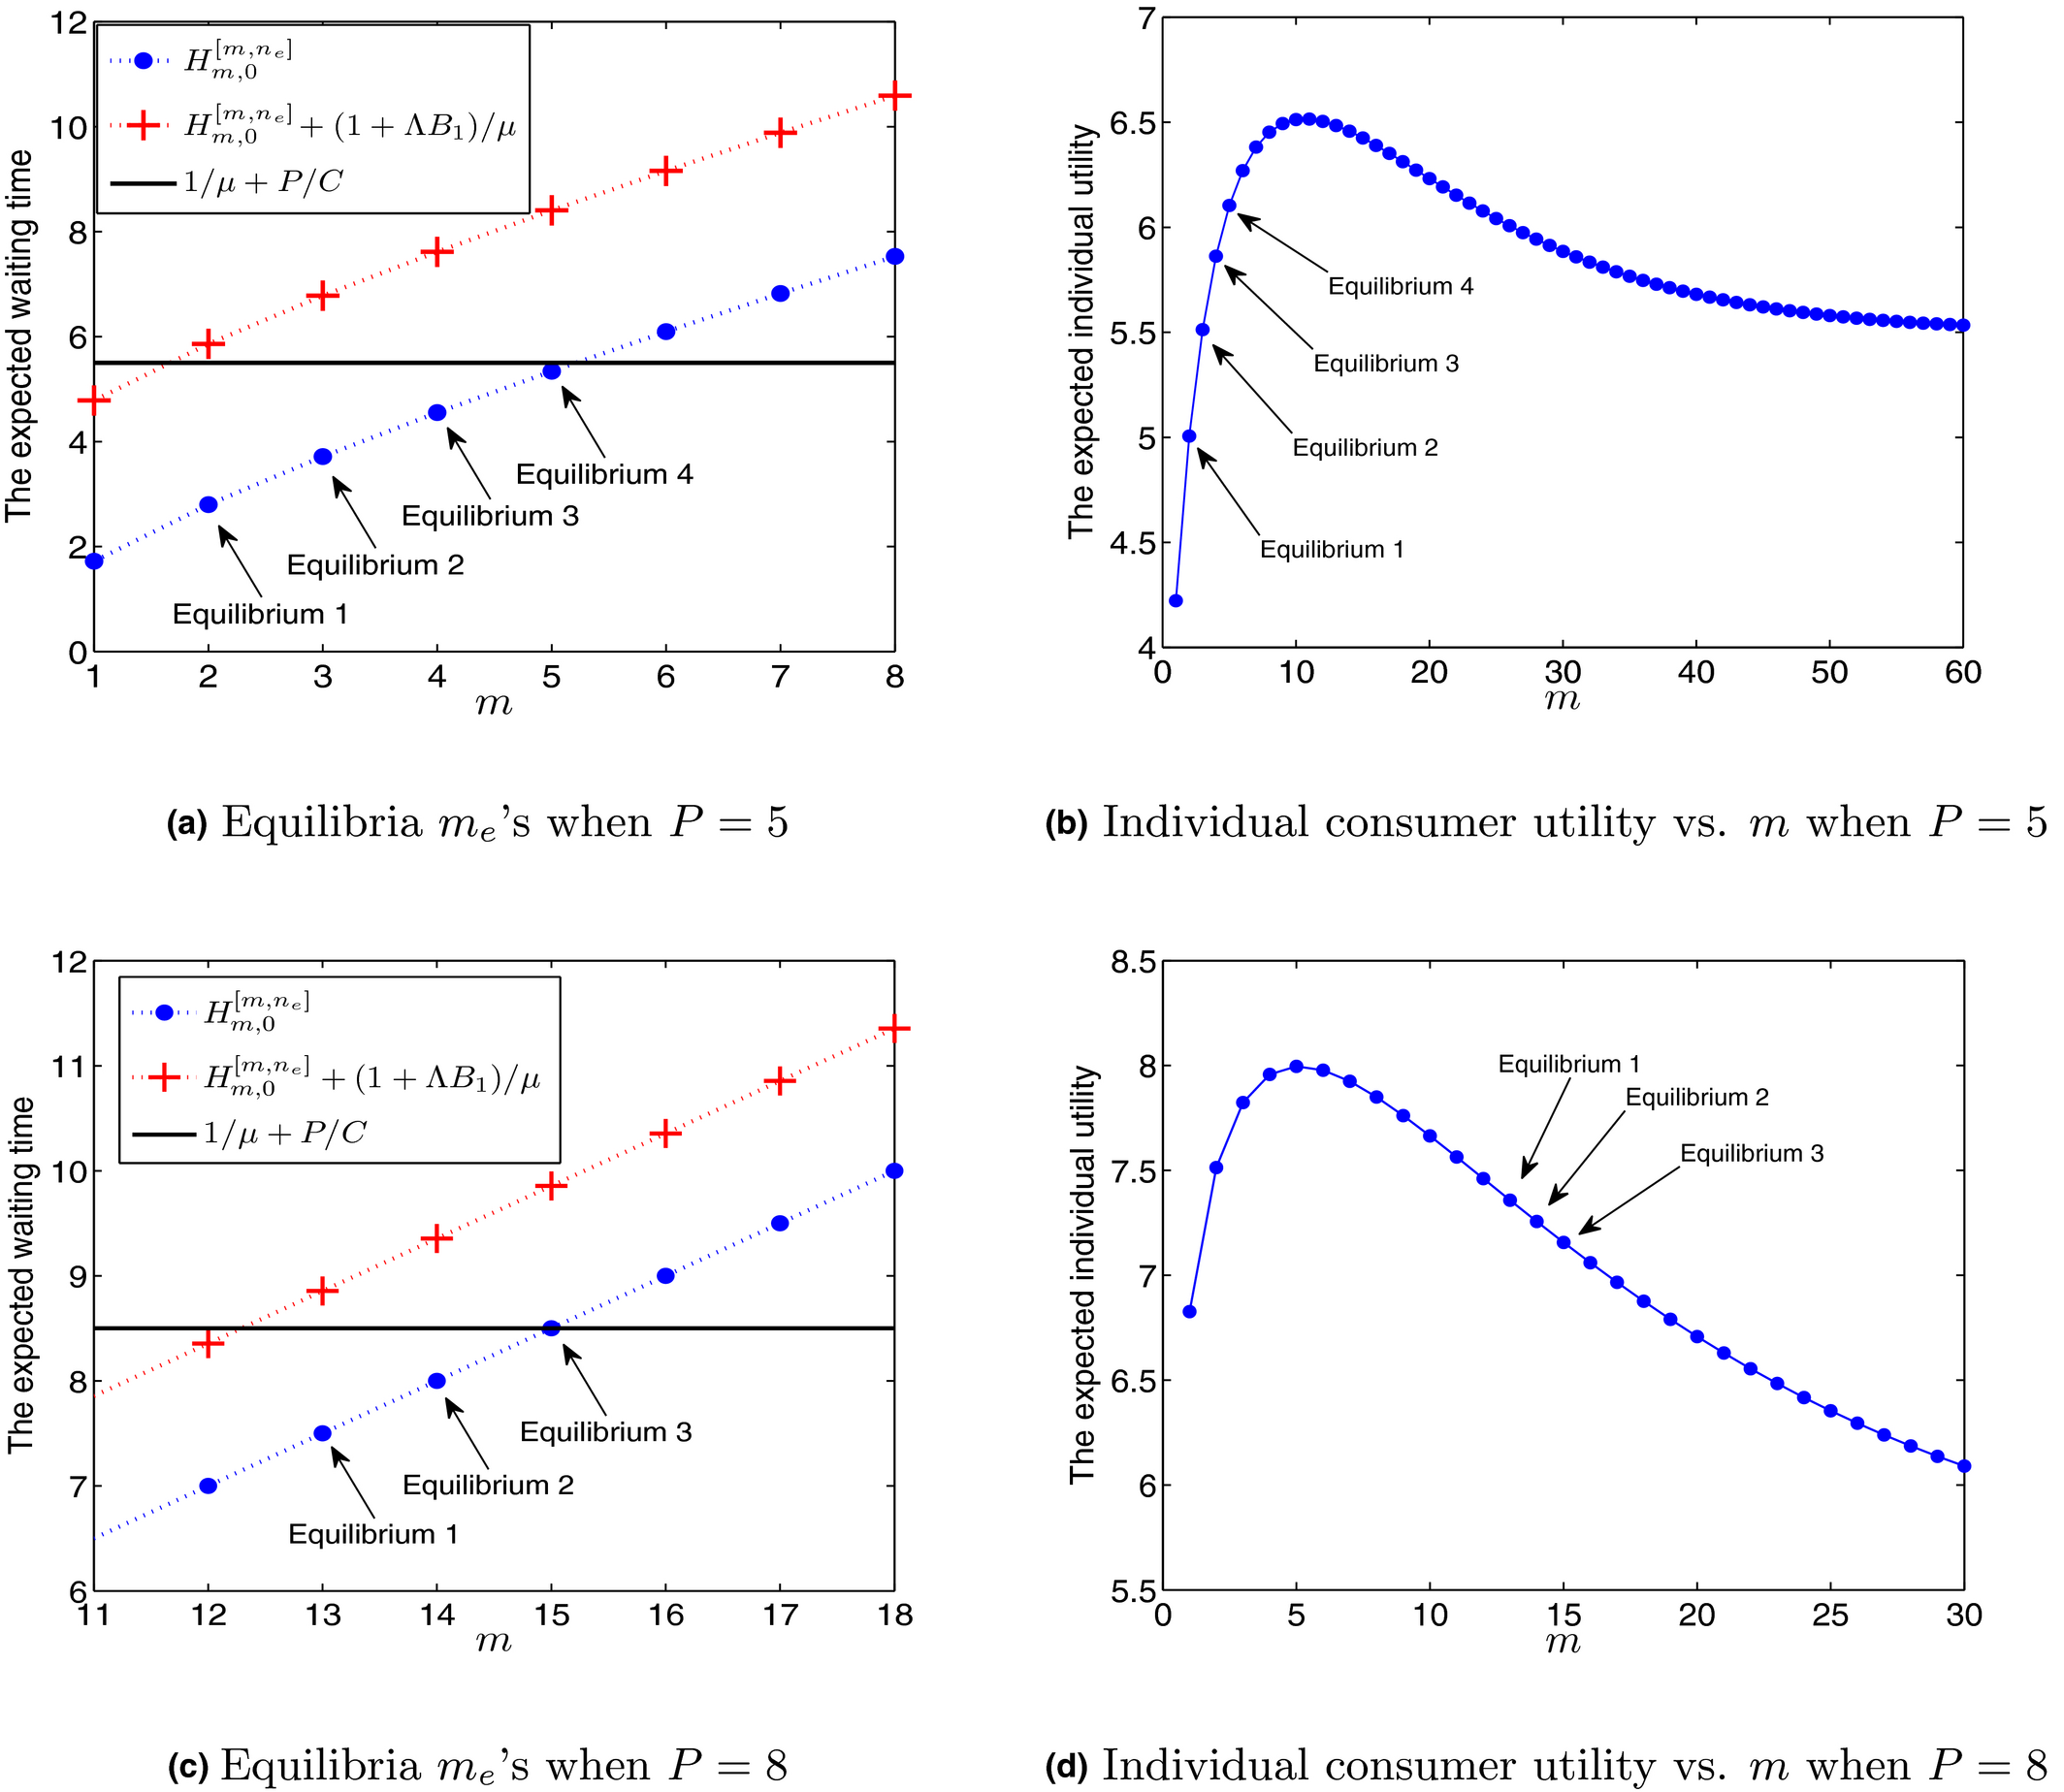
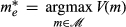
Illustration of Multiple Equilibria (R = 10, C = 1, μ = 2, Λ = 1.8) [Color figure can be viewed at
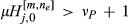
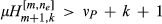
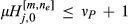
We note that Equation 11 is a necessary and sufficient condition for an equilibrium threshold m
e
. Adiri and Yechiali (1974) identified a single equilibrium in equation (20) of their paper, which is only a sufficient condition. Their equilibrium coincides with 
In the case of multiple equilibria, we seek to identify the Pareto‐dominant equilibrium, denoted by 
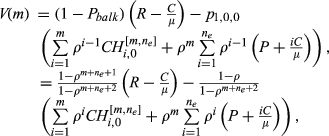


For m ≥ 1, we have the following inequality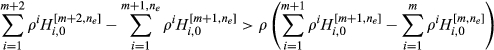
Among 


In a special case covered in the following theorem, we always have 
When ρ < 1, there exists a threshold 


Under Theorem 6's condition, that is, when ρ↓ (so waiting time for priority customers is relatively short) and the service value R↑, new arrivals can afford to purchase priority to overtake customers waiting in the regular queue. As a consequence, the equilibrium regular‐queue thresholds m
e
's all shrink so the additional value of overtaking is neutralized. When 

Similarly, we can investigate the impact of Λ and P on the Pareto‐dominant equilibrium, 


Forms of Pareto‐Dominant Equilibrium [Color figure can be viewed at
When multiple equilibria exist, we observe that 


Server's Revenue
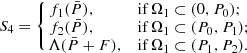
Like in the unobservable setting, we model a Stackelberg game between the server and the customers, where the server is able to maximize its expected revenue by optimizing over price P for the priority premium. The basic service fee F is fixed. Let p i,j,k denote the steady‐state probability of state (i, j, k) for the underlying queueing process {(I(t), N o (t), N p (t)), t ≥ 0}. Recall that N p (t) = 0 whenever N o (t) < m. The stationary distribution of the system can be derived as follows.
Under strategy [m, n], we have
We can then derive the unconditional probability of an arrival choosing to balk, join as a regular customer and join as a priority customer, denoted by P balk , P o and P p , respectively. Clearly, P balk + P o + P p = 1.
Under strategy [m, n], we have
Corollary 1 is intuitive, as the balking probability is expected to decrease in m or n (recall that balking happens when N > m + n). Similarly, the probability of becoming an ordinary or a priority customer increases with the corresponding threshold value, m or n.
Under the Pareto‐dominant equilibrium 
Numerical Experiments
In this section, we present numerical results using graphs and tables for both the unobservable and observable cases. In particular, we first examine the impact of the model's parameters (including Λ, C, P, R) on the equilibrium behavior of the customers (section 5.1). We focus our discussion on the Pareto‐dominant equilibrium, denoted by [m
e
, n
e
] with a slight abuse of notation (instead of 
On the Equilibrium Strategies
Figure 8 illustrates the impact of ν R = Rμ/C on the effective arrival rate λ e under the unobservable case with Λ = 2.5 and ν P = 6, where λ* = ρ*μ and λ′ = ρ′μ are as defined in Theorem 1. In the graph, the light grey area corresponds to the joining rate at the equilibrium of the regular type‐o customers, while the dark grey area corresponds to the priority type‐p customers.
Effective Arrival Rate vs. ν
R
when Λ = 2.5 and ν
P
= 6 under the Unobservable Case [Color figure can be viewed at
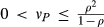
It is clear that the proportion of type‐p customers increases as ν R ↑. When the reward R is sufficiently big (i.e., ν R = Rμ/C ≥ 1/(1 − ρ′) + ν P ), all joining customers end up purchasing priority. It is interesting to note that the joining rate of the regular customers first increases then decreases. This is consistent with Case (3) of Theorem 1 which predicts that it increases in ν R over 1 < ν R ≤ ρ* + 1 + ν P and decreases in ν R over ρ* + 1 + ν P < ν R ≤ 1/(1 − ρ′) + ν P . As a result, the effective arrival rate (combining both the type‐o and type‐p customers) at equilibrium is not monotone in ν R or R, which is different from the results in FCFS queueing systems such as Naor (1969) and Edelson and Hilderbrand (1975); the effective arrival rate always increases in ν R in those papers. The difference is driven by the fact that customers are self‐interested. As ν R ↑, an arriving customer has more incentives to purchase priority, which explains the monotonicity of the joining rate of the priority customers in ν R . However, this imposes negative externalities to the customers in the regular queue, and the proportion of these type‐o customers decreases and eventually all of them vanish.
Next, we discuss the impact of system parameters on the equilibrium strategy 
Equilibrium Thresholds under the Observable Case vs. R and P with Different Λ [Color figure can be viewed at
Equilibrium Strategy [m e , n e ] under the Observable Case with Λ = 1.8 and Different R, P
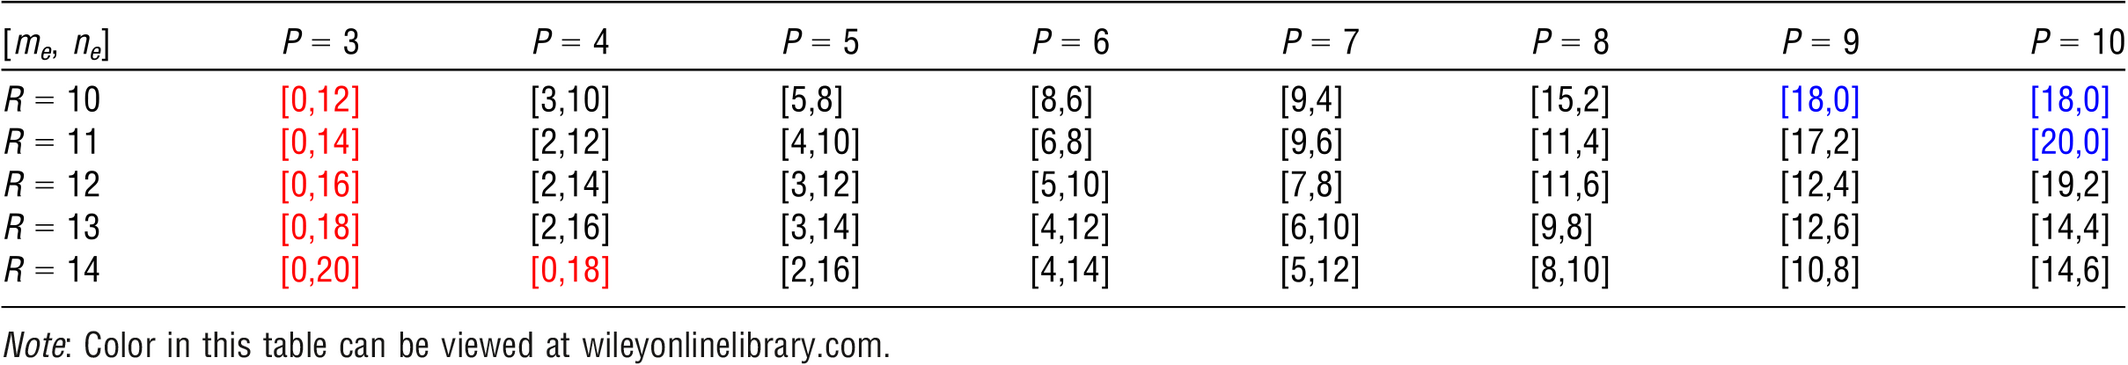
In Figure 9a, we study the impact of reward R on m
e
and n
e
when facing different Λ levels. It is interesting that while n
e
(which is the same for all Λ levels according to Theorem 4) is monotone in R, m
e
is not. This is because when R < P + 2C/μ, no customers purchase priority at equilibrium. Thus, R↑ drives the increase in customers joining the regular queue (

On the Server's Optimal Revenue
Figure 10 provides a comparison of the server's optimal revenue between the observable and unobservable settings as the values of the service reward R and the system load ρ vary. Interestingly, the service provider has an incentive to reveal the state of the system to the customers when the system load is either low or high in order to maximize revenue (corresponding to Region A and Region C of Figure 10 respectively), but it has an incentive to hide it when the load is at a medium level (Region B in Figure 10). This observation is different from the results presented in Chen and Frank (2004) and Hu et al. (2018) where there are no priority customers. To elaborate on the intuitions, we zoom into each region and plot the server's revenue against price for both the observable and unobservable cases. In particular, we set R = 6, 8, 10 and use ρ = 0.6, ρ = 1.2 and ρ = 1.8 to study Region A, Region B and Region C in Figure 11a, b, c correspondingly.
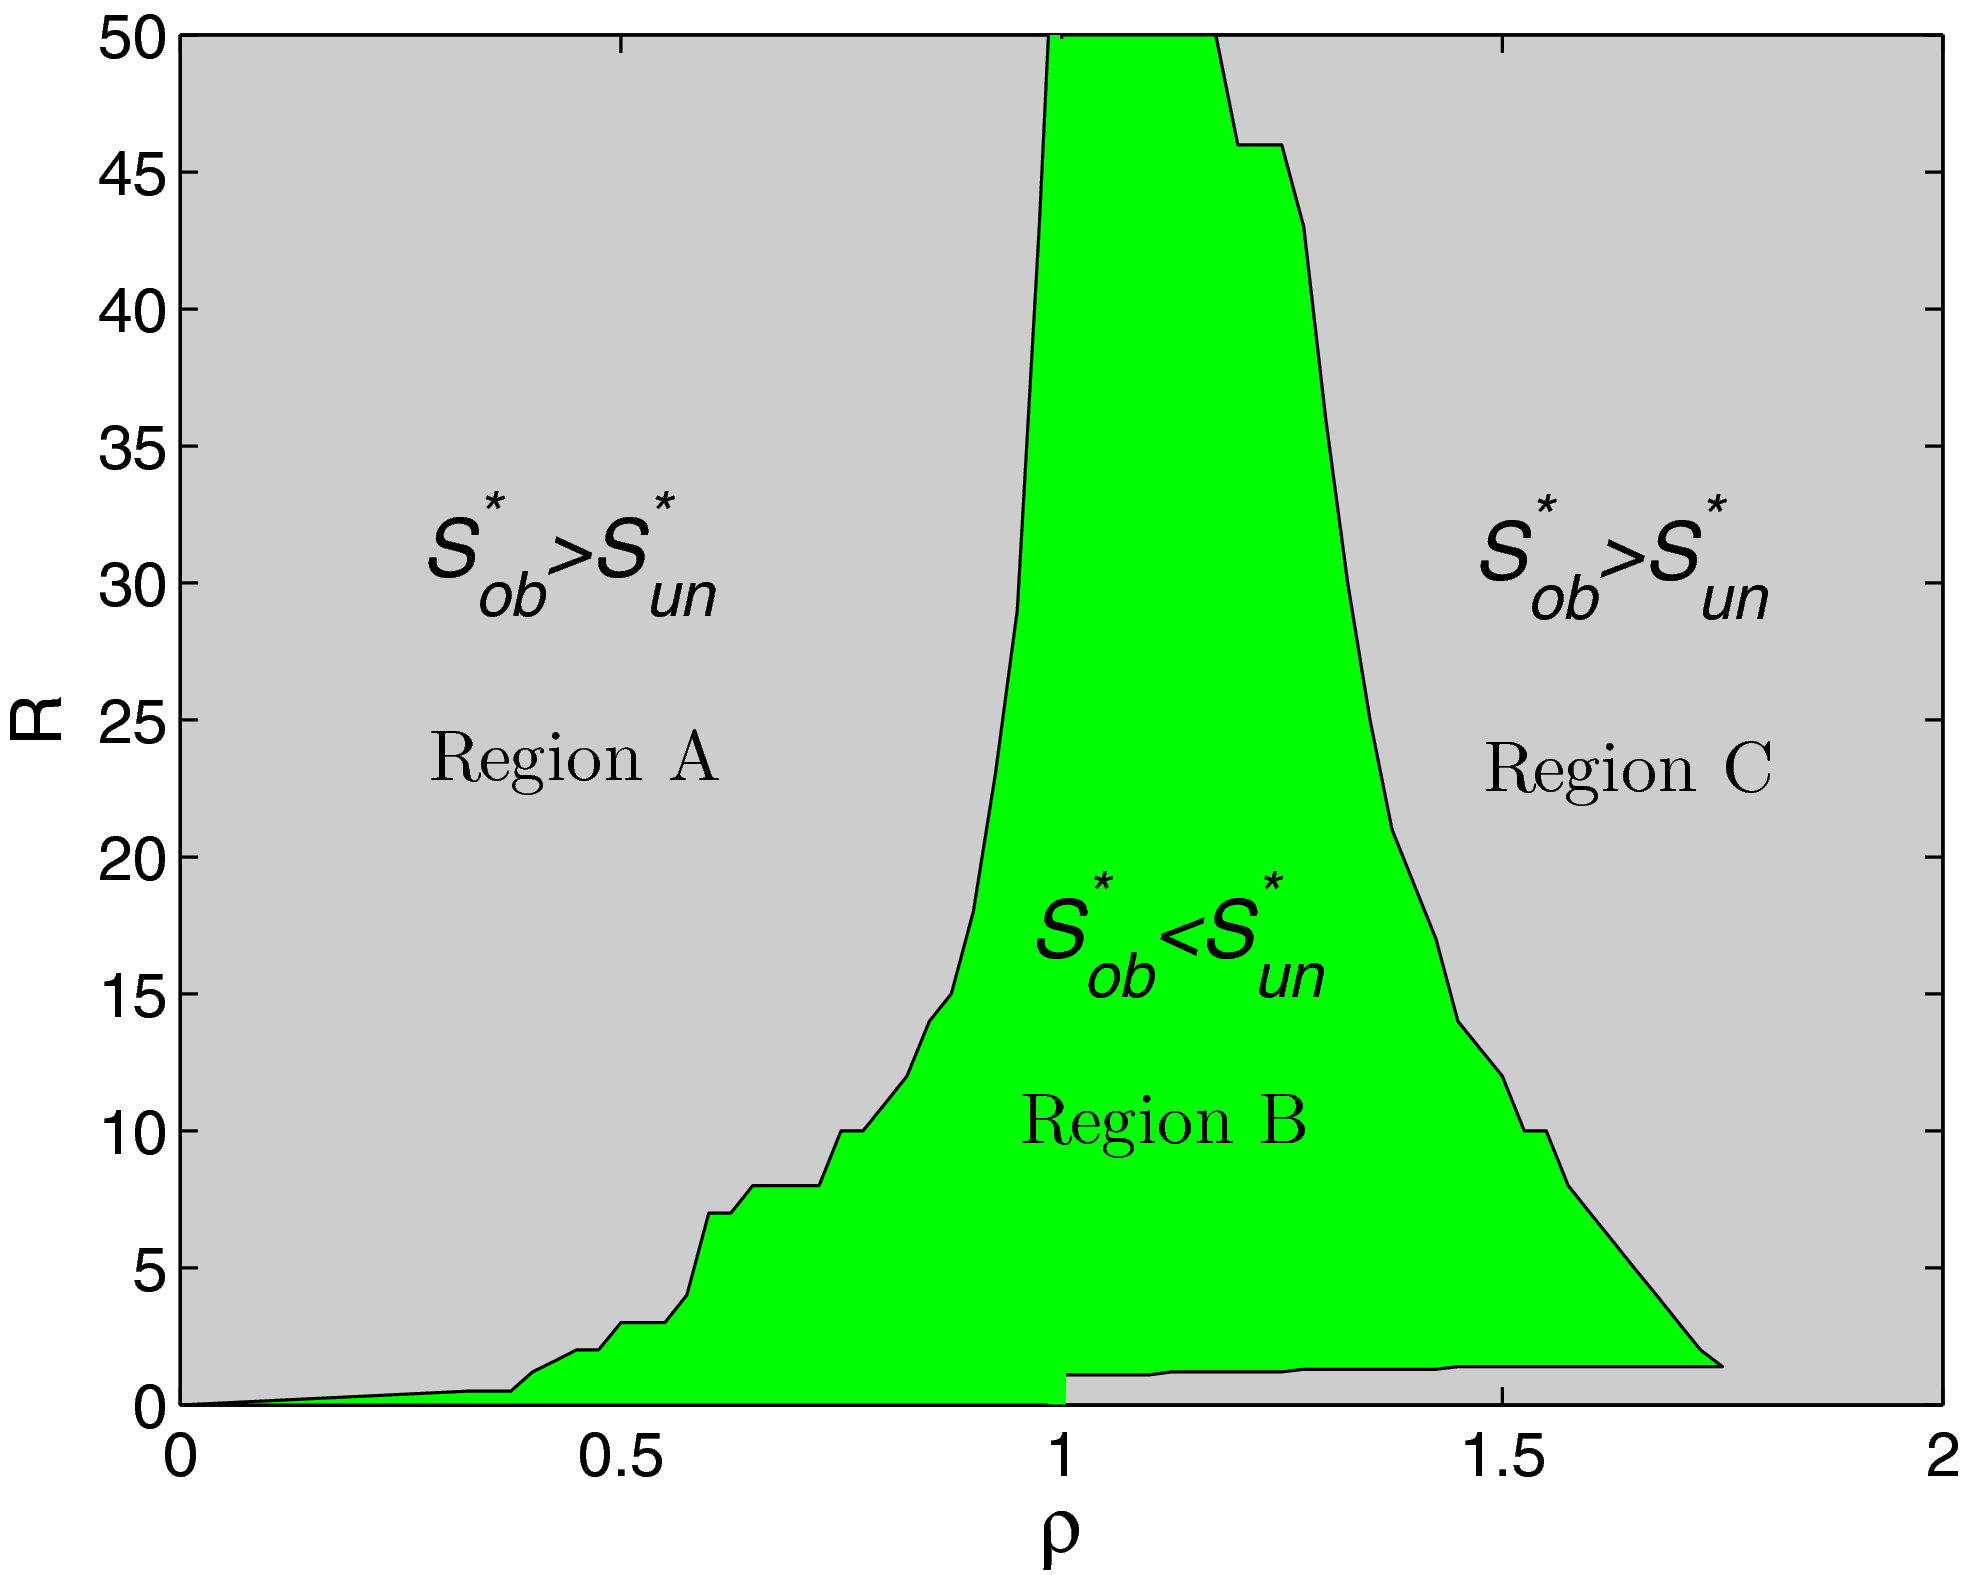
Comparison of Optimal Revenues under Unobservable and Observable Settings [Color figure can be viewed at
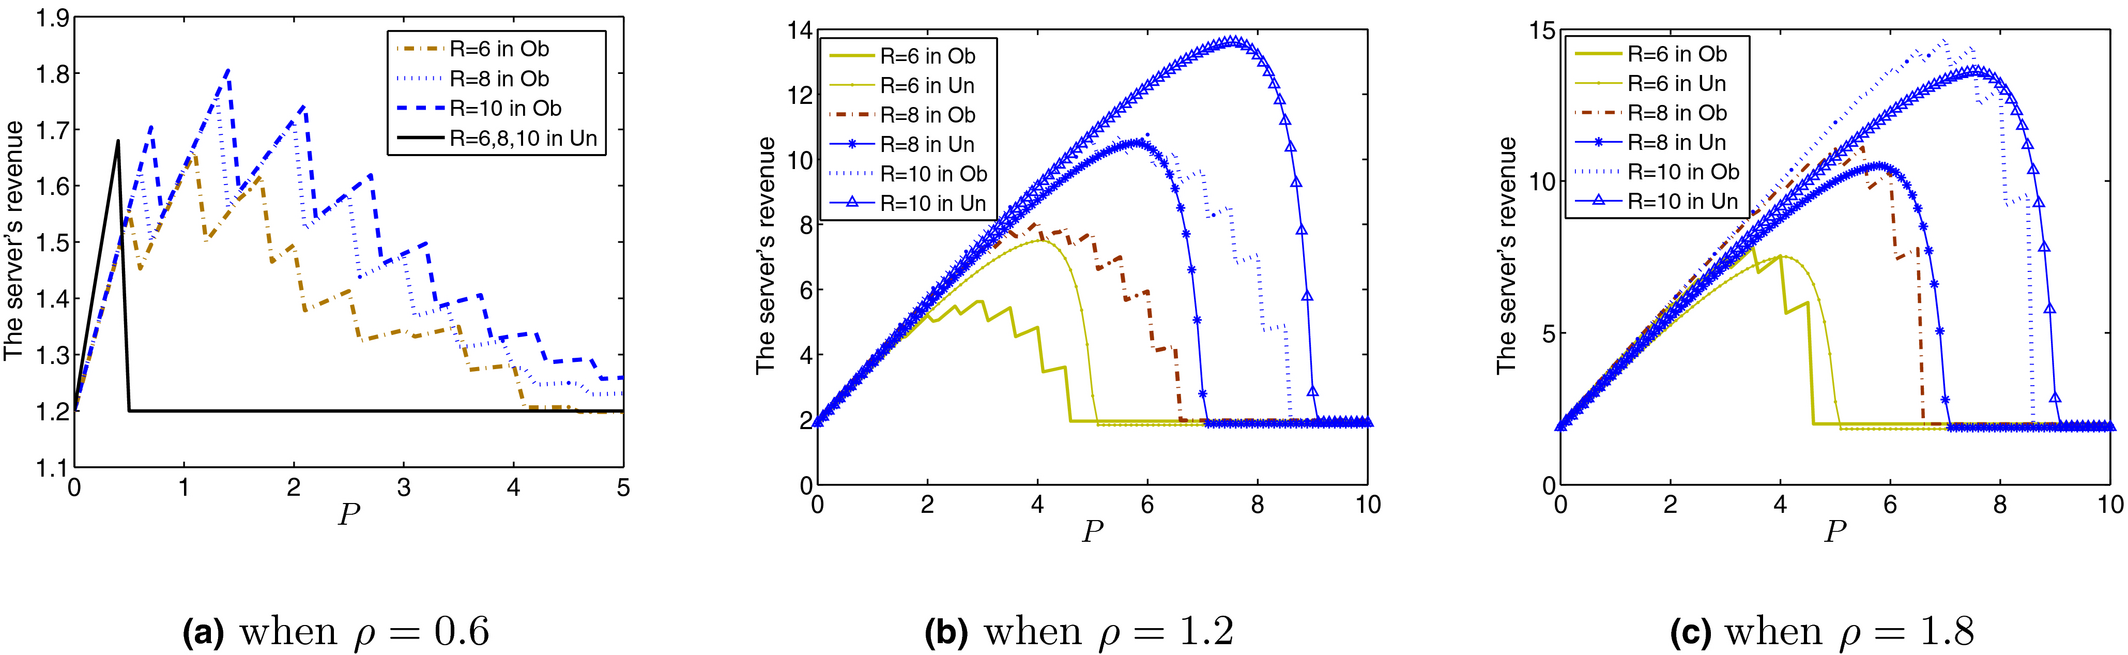
Server's Revenues in Observable [Ob] and Unobservable [Un] Cases vs. P [Color figure can be viewed at
First, when the system load is sufficiently low (i.e., ρ = 0.6 in Figure 11a), customers anticipate a short expected waiting time under the unobservable case, so the server needs to charge a sufficiently low premium to induce priority purchases (
Second, when the value of the system load falls into an intermediate range (i.e., ρ = 1.2 in Figure 11b), customers anticipate an increased expected waiting time compared to the case ρ = 0.6 under the unobservable case, and are comfortable with purchasing priority at a higher premium. Under the observable case, even though the system load is higher compared to the case ρ = 0.6, the increase is not significant enough compared to the case ρ = 1.8 and there are times when the system will still be in low states. At equilibrium, there will be less customers who purchase priorities in the observable setting compared to the unobservable setting, leading to an overall lower revenue.
Finally, consider a system load that is sufficiently high (i.e., ρ = 1.8 in Figure 11c). In this case, the relationship between the optimal revenues are again flipped (the server is better off with the observable setting). This happens firstly because the server's revenue under the unobservable case remains unchanged in the system's workload ρ as long as the potential arrival rate is sufficiently large (see Lemma 3 for the ρ > 1 case). Therefore, the server's revenue under the unobservable case are identical in Figure 11b and c. Secondly, for the observable case, we can observe that revenue continues to increase in ρ, so eventually the revenue under the observable case surpasses that under the unobservable case.
The fact that the optimal setting switches twice between the observable and unobservable case, as the system load increases, is rather interesting. To the best of our knowledge, this is a new result in the literature. It also raises the need for practitioners to have a deeper understanding of their services and industries before making relevant adjustments. In what follows, we provide a concrete example to demonstrate the implications of this finding.
A Mini Case Study
In this section, we conduct a case study on Papa John's Pizza, the third largest pizza restaurant chain in the United States. This spring (2017), Papa John's introduced a $3 Papa Priority fee that allows customers to bump their pizza orders to the front of the line. 6 Our goal is to study this priority practice under our model's framework, derive the optimal price for the priority premium and present some managerial insights.
We first proceed to extrapolate the model's parameters using real Papa John's data that is publicly available, including information provided in the company's 10‐K report. Papa John's received a total of 16.61 million orders in the United States within a 30‐day span in spring 2017.
7
In the spring, the company operated 3428 locations in the United States. (including both company‐owned and franchised stores).
8
The average number of orders that a US location receives in a day can be calculated as
Papa John's receives customer orders through its digital channel including online/mobile orders (approx. 60%), over the phone (approx. 20%) and walk‐in customers (approx. 20%).
9
We will focus on orders that require delivery because the waiting time for in‐store pick‐up or dining has small variability. Typically, orders received from the digital and phone channels require delivery (80% of the total orders). For simplicity, we assume that it is always the case. Furthermore, a Papa John's location is normally open Monday through Sunday from 10 am till 11 pm (13 hours in total).
10
Therefore, we can estimate the effective arrival rate λ to a US store as
Next, we estimate the basic service fee F for the model which in this case corresponds to the US average customer order dollar amount. From the company's 2016 10‐K report,
11
Papa John's annual revenue was $1.71 billion, including sales from company‐owned restaurants and royalties/fees from franchised restaurants in its US and international locations. We identify the average order dollar amount in a US location by only considering the US company‐owned location since sales information for the franchised stores is not available, and more importantly, because the legal structure of a store (company‐owned vs. franchised) should have little impact on customers’ order sizes. According to the annual report, sales of US company‐owned restaurants amounted to 47.6% of total revenue, contributed by 702 locations. Thus F can be estimated as
Now we proceed to study the optimal priority pricing strategy for the server (an average Papa John's store) under different service rewards R and potential arrival rates Λ. In practice, customers will not be willing to wait more than an hour and half for their pizzas, so we control the reward‐to‐waiting‐cost ratio R/C to be under 1.5 hours. To do that, we normalize the unit waiting cost C to be $10/hour, that is, customers’ utility of the food decreases $10 an hour by the delay of the delivery (when the average order is $20), and vary R < $15. On the other hand, because the effective arrival rate λ is 10 orders/hour, we investigate scenarios where the potential arrival rate Λ is in its neighborhood (from 7 orders/hour to 14 orders/hour).
Tables 3 and 4 present the optimal prices for Papa Priority predicted using our theoretical unobservable and observable models studied in sections 3 and 4, respectively. First of all, the optimal price P* for the priority premium always increases with Λ in both cases (for fixed R), as the server can charge a higher premium with a greater number of potential customers. Second, P* increases monotonically in R under the unobservable case, but not under the observable case (see the underlined values in Table 4). This is because the server's revenue is a piecewise function under the observable case (see Figure 11 for an example). Furthermore, the current practice of Papa John's reflects an unobservable setting. Assuming customers’ waiting tolerance is 48 minutes (i.e., utility of having a pizza becomes negative after 48 minutes of waiting or R/C = 0.8 hours), our model's predicted optimal price ($3.02) is very close to Papa Priority's actual charge of $3 for Λ = 10, 11, 12, 13, 14 orders/hour (which is consistent with λ of 10 orders/hour).


Next, we investigate whether it is beneficial for Papa John's to release real‐time queue length information (e.g., they can show wait information on their existing app). To do that, we fix R/C = 0.8 hour. Table 5 presents the optimal revenues for the unobservable and observable cases as the potential arrival rate Λ increases. We observe that Λ = 11 orders/hour is the turning point from the unobservable to the observable setting (see Table 5), that is, when 7 ≤ Λ < 11 orders/hour, Papa John's earns more revenue under the unobservable setting, but when Λ ≥ 11 orders/hour, it has a higher revenue from the observable setting (the more profitable case is underlined accordingly). This also corresponds to the shift from Region B to Region C described in Figure 10.
Optimal Revenue as Λ Increases (R = $8)
Given that their effective arrival rate is estimated to be λ = 10 orders/hour, it is unknown to us whether the potential arrival rate Λ is between 10 orders/hour and 11 orders/hour, or greater than 11 orders/hour. If it is already greater than 11 orders/hour, or if at some point in the future it surpasses 11 orders/hour, our analysis would suggest that the company can benefit from revealing the number of waiting orders to the customers by operating under an observable model. However, there are also pricing implications. In particular, the company should decrease the Papa Priority fee by about a quarter of a dollar at the time of the switch (from $3.02 to $2.69, see the underlined values in Table 6). Eventually, the Papa Priority fee can be increased again as demand continues to grow.
Optimal Price of Priority Premium as Λ Increases (R = $8)
In practice, Papa John's potential arrival rate must vary by the time of the day, the day of the week, and the year's season. Our results suggest that the company may be interested in implementing a dynamic priority pricing strategy with respect to the potential arrival rate to further maximize their revenue. However, there are two caveats: (i) Priority premium should increase with demand (i.e., potential arrival rate Λ) within the observable or unobservable case, but may not be the case when switched from one setting to another. (ii) As a company with the motto “Better Ingredient, Better Pizza,” Papa John's priority premium may need to be reduced in some cases when its pizza quality/taste improves (because the optimal price for the priority premium is non‐monotone in R).
Conclusions
In this paper, we study a single‐server queueing system with non‐preemptive pay‐for‐priority options in the presence of strategic customers. Under both the unobservable and observable settings, we first derive the equilibrium strategies of the customers for given priority premiums, and then study the server's revenue maximization problem. The primary contribution of this study to the literature is two‐fold and described as follows.
Our first contribution is to study customers’ simultaneous joining/balking and pay‐for‐priority decisions. Including balking in priority queueing systems not only is more realistic to real‐world practices, but also increases the complexity of the problem due to the two‐dimensional decision scope. For games with one decision, it is well‐known that ATC typically leads to a unique symmetric equilibirum, while FTC leads to multiple equilibria. However, in our two dimensional settings we are able to identify ATC activity in the presence of multiple equilibria. We refer interested readers to the discussion in section 1.8.2. of Hassin (2016) on this topic.
Under the unobservable setting, we found that equilibrium and system throughput are not monotone in the service reward R, which departs from the conclusions of priority queueing models in the existing literature without balking. This is driven by customer's self‐interested nature and the intervention of their joining/balking and pay‐for‐priority decisions. Specifically, when R is sufficiently small (or large, respectively), all the joining customers choose to opt out (or in, respectively) for priority. But when R is in the middle range, R↑ induces higher probability of priority purchase which discourages non‐priority customers by increasing their expected waiting cost. Accordingly, the total system throughput decreases in R due to less joining customers. Furthermore, because the server revenue is a function of both the system throughput (on which it collects basic service fees) and the number of priority purchases (on which it collects priority premiums), increasing service rewards for the customers (R↑) may in fact lead to reduced firm revenue. Under the observable setting, we show again that the equilibrium threshold and the server's optimal price do not need to be monotone in R. In addition, our theoretical work identifies the necessary and sufficient condition for an equilibrium to hold. In the presence of multiple equilibria, we can nail down the unique Pareto‐dominant equilibrium analytically.
Our second contribution, which has not been done in literature before, is to compare an observable priority queue with an unobservable priority queue. By comparing the server's optimal revenues in the two different settings, we find that the service provider is better off with the observable setting when the system load is either low or high, but with the unobservable setting when the system load is medium. We also demonstrate the implications of this finding by applying our model framework to a mini case study (Papa John's Pizza) based on real‐world information. Our analysis suggests that Papa John's could benefit from providing customers with wait information while slightly decreasing its fee for Papa Priority.
Our model is not without limitations. For example, the analyses are based on M/M/1 queues in steady state. In Appendix S2, we show that the analysis for the unobservable case can be generalized to the M/G/1 setting, but unfortunately the observable case is not tractable. To justify our steady‐state analysis, we show that the convergence speed of our system to steady‐state is very reasonable, based on the work of Janssen and Van Leeuwaarden (2005). We have also considered a static model, e.g., the priority premium is not dynamic and decisions made are irrevocable; a customer who has decided to join the non‐priority queue cannot purchase priority later on. A dynamic pricing or decision model would be an excellent future research direction. Afèche and Sarhangian (2015) consider rational abandonment of the lower priority customers in an observable queue. The priority discipline is preemptive and customers’ priority levels are exogenous. Yang and Debo (2017) study an unobservable referral priority queue where a customer can get into the priority queue by referring new customers. Finally, it may be an interesting direction to consider heterogeneous customers in our model setting.
Footnotes
Acknowledgments
The authors thank the Department Editor, an anonymous Senior Editor, three anonymous referees and Prof. Refael Hassin for their very helpful and constructive comments, which have led to significant improvement of the study. This research was supported by the National Natural Science Foundation of China (grant no. 71571014) and the China Scholarship Council (grant no. 201707090037). The authors thank Daniella Arias and Daniel Gautreau, MBA students at Georgetown University, for proofreading the manuscript.
1
2
3
For example, the optimal price for the priority premium is
4
Under the preemptive scheme, as long as there are priority customers in the system, the customer at the server (currently being served) is always a priority customer. But this is not the same for the non‐preemptive scheme.
5
6
7
8
9
10
11
Available at