
Abstract
It is well‐recognized that pre‐positioning assets in advance of a natural disaster is important for supporting timely relief provision after a disaster occurs. In addition to preparing for imminent disaster events, humanitarian relief organizations also maintain such asset allocations over time to support future responses to recurrent events such as wildfires or winter storms. This study is motivated by the authors’ work with one such relief organization, the American Red Cross in Colorado and Wyoming, and it discusses a new mixed integer linear programming model that can help to more effectively pre‐position needed assets to open emergency shelters. The new model incorporates a measure of risk into its objective function, which helps address the need for generating equitable solutions, and the model explicitly considers reallocation of assets to nearby locations after a disaster event occurs. Model performance is first analyzed in the context of the Red Cross’ actual asset allocation problem and the results show a decrease in residual risk from that of historical allocations of more than 33%. The general applicability of the approach is then illustrated in the context of several different extensions to the base model and a series of important takeaways are presented and discussed.
Introduction
The ability to respond quickly to a disaster event depends, to a large extent, on the ready availability of humanitarian relief resources close to where the disaster occurs. Pre‐positioning such resources in appropriate locations, therefore, can have a significant impact on disaster response. Depending on the context, such pre‐positioning may take the form of establishing one or more permanent warehouses, or it may involve creating temporary storage locations prior to an impending disaster (such as a hurricane). It also may involve locating and maintaining numerous small stockpiles of supplies throughout a region in order to respond to smaller, more frequently occurring natural disasters.
To pre‐position items effectively, it is necessary to determine the types of supplies that need to be pre‐positioned, along with the quantities of those supplies that are necessary and the locations in which to place them. It is particularly challenging to do this when the pre‐positioning takes place well in advance of a given disaster because there can be significant uncertainty about both the locations that will be impacted and the potential impacts that will be felt in those locations. This implies that there may be significant value in allowing a humanitarian relief organization to explicitly consider the actual risk of a disaster when choosing the specific locations in which to pre‐position disaster resources. To explore the potential benefits of this concept, this study explicitly proposes a risk‐based approach to developing optimal plans for pre‐positioning resources.
The American Red Cross (hereafter referred to as the Red Cross) is a well‐known example of a not‐for‐profit organization that provides disaster relief services, as well as military family support, management of blood donations, and health and safety training programs. The organization operates both domestically and internationally as a member of the International Federation of Red Cross and Red Crescent Societies (American Red Cross 2015). One of the regular relief activities with which the Red Cross is involved is the pre‐positioning of supplies such as cots, blankets, water, and first aid kits, to support opening shelters for people who are temporarily displaced by a disaster. These resources are typically stored within container assets such as trailers or caches, which are then placed in specific locations across a given region.
Although there is a recurring need for individuals and families to receive support provided by these assets, especially in recent years with the growing frequency and severity of disasters, the Red Cross currently lacks an analytical approach for determining the most effective asset locations. To help address this need, the authors worked directly with the Red Cross in Colorado and Wyoming to develop a mixed integer linear programming model that could improve their asset allocation. The model formulation for this problem explicitly incorporates disaster risk into its objective function to generate asset allocations that can effectively target the areas with the greatest potential need. Given a calculated risk value for each potential location, the model then adopts a novel approach for analytically assessing the impact of additional asset units to reduce this risk so as to minimize the amount of risk remaining once all available assets are allocated.
One of the identifying characteristics of the Red Cross allocation problem is that even though the trailer assets tend to stay where they are placed, they can be moved very quickly, if necessary, to address the need for opening a shelter in a nearby location within a few hours. The resulting asset location model is, therefore, extended to allow for quantifying both the direct value that such assets have to the locations where they are placed and the indirect supplementary value that they also have for the surrounding areas if they are needed. Because this indirect value is cumulative, it can make a substantial contribution to the overall distribution of coverage that results from an allocation.
When the model is applied in the context of the actual Red Cross asset allocation problem, the results show that it is able to significantly improve the effectiveness of the current allocation of trailers and caches, both in terms of the amount of risk addressed, the residual of which is 33% more than what the current allocation plan provides, and in terms of the equitability of the distribution of assets. In particular, the explicit incorporation of vulnerability into the model's objective function helps the model automatically generate solutions that target populations with the greatest amount of need. To further explore this behavior, our discussion subsequently compares and contrasts the model's performance against that of several other approaches for ensuring equity in resource allocations; our hope is that the insights from this additional analysis will contribute to the broader conversation about equity in other humanitarian contexts.
We begin our discussion with a review of the relevant literature, and then introduce our motivating problem setting in more detail. We then explore the availability and utilization of empirical data related to the risk‐based objective function, present the different components of the model formulation, and discuss the results of applying the model in the specific context of the Red Cross’ allocation problem. This is followed by an analysis and discussion of the general robustness of the model, as well as several possible extensions to demonstrate the model's flexibility and adaptability to a variety of different contexts. The study then concludes with a look at the implications of the overall research effort and a discussion of several important takeaways.
Literature Survey
Van Wassenhove (2006) was one of the first to outline the importance of supply chain management in humanitarian aid and disaster relief. It is now well‐recognized that effectively managing such supply chains can be extremely complex due to factors such as demand uncertainty, non‐traditional objectives, shifting priorities, and operational needs that change over time (Balcik et al. 2010, Charles et al. 2010, Day et al. 2012, Holguín‐Veras et al. 2012). This inherent complexity means that there is both a significant need and a significant opportunity to develop analytic approaches for improving humanitarian supply chain operations.
Caunhye et al. (2012) specifically identify facility location and stock pre‐positioning as important pre‐disaster operations for organizations that respond to disasters. Determining proper facility locations and stocking levels for the assets at these facilities is vital to post‐disaster operations, since placing assets in unsuitable locations or failing to have sufficient supplies on hand can significantly delay response efforts. Many existing facility location models utilize binary variables associated with a set of pre‐determined locations, allowing one‐to‐many of these locations to be selected in the process. One such approach is presented in Jia et al. (2007a,b), where the authors establish a method for locating multiple facilities to maximize population coverage while addressing demand uncertainty and coverage quality. A similar methodology is established by Balcik and Beamon (2008). Working with a set of pre‐screened locations that could serve as distribution centers, they consider both final locations and the number of units at each location. Adopting an objective of maximizing coverage, the model then shows the impact of pre‐disaster planning on overall response and budget allocation. Rawls and Turnquist (2010, 2012) further extend this work by considering not just facility location, stocking levels, and distribution, but also the potential for disruptions to the facilities and to the network.
Duran et al. (2011) collaborated with CARE International to determine warehouse locations for seven types of supplies utilized in worldwide disaster relief. The mixed‐integer model they present involves 12 candidate locations and works to minimize the average weighted response times to disasters anywhere in the world. Based on the results of this study, CARE selected three specific facilities for pre‐positioning supplies. Stauffer et al. (2016) worked with Red Cross data to develop a model for managing vehicle resources throughout the disaster cycle, including not only the immediate relief and response efforts, but also the longer‐term recovery processes. They also specifically consider the use of temporary regional hubs to reduce the response time for unexpected disasters. Our own work with the Red Cross focuses on a somewhat similar problem of pre‐positioning assets to respond immediately to uncertain events.
Salmerón and Apte (2010) address the issue of uncertainty in the disaster environment by creating a stochastic model for pre‐disaster budget allocation of resources including warehouses, medical facilities, and shelters. They include a logistics component for deliveries of materials, as well as transportation of affected populations, and their model allows for different scenarios to be developed to guide this budget allocation process. Mete and Zabinsky (2010) also create a stochastic model for the storage and distribution of medical supplies. Their model addresses the pre‐positioning and response phases, and they utilize a case study in the Seattle area as an illustrative example. Other similar research involving stochastic models has focused on facility or warehouse location subject to earthquakes (Tofighi et al. 2016, Verma and Gaukler 2015) or hurricanes (Davis et al. 2013).
While many such models have relied on scenarios describing a set of possible events, Campbell and Jones (2011), instead, incorporate a measure of risk that is based on the probability of a facility being destroyed or made inaccessible. Their approach seeks to create an alternative to scenario‐based disaster relief models and avoid the difficulty of creating accurate models without a significant amount of historical data. Akgün et al. (2015) also incorporate a measure of risk into their facility location model. Their definition of risk includes three components: threat, vulnerability, and consequence, and, like Campbell and Jones (2011), they focus their treatment of risk on the likelihood and extent to which each relief facility might be disrupted by the hazard. Ultimately, the risk is calculated for each demand point in the area of study and, through a multi‐step procedure, the optimal facility locations are selected to ensure a reliable network. Our treatment of risk is somewhat similar to the work of Akgün et al. (2015), in that it breaks risk down into three different components, but our focus is specifically on the risk to the population itself and not to the viability of the resources. We, thus, assume that the relief assets will actually be available at the location where they are positioned.
As represented in this discussion, much of the existing research in the area of humanitarian facility location and stock pre‐positioning has focused on distribution centers, warehouses, and other large facilities, and the role that they play in relief networks. Although providing support for sheltering has been understudied in comparison, there are several existing efforts that adopt this focus. Zhen et al. (2015), for example, looked at how large metropolitan areas are divided and assigned to sheltering locations, as well as other factors (vehicle routing, supply locations) that determine an effective relief supply network. Vanajakumari et al. (2016) presented an integrated multi‐step model that determined the optimal staging areas for temporary warehouses of supplies, the inventory levels needed for those supplies, the size of trucks needed to make those deliveries, and finally the routing for those trucks. Their work specifically involves pre‐staging resources for an impending or predictable disaster. In contrast, although our risk‐based model discussed below could be adapted to apply to such impending disasters, our focus is on planning for different types of events that occur frequently with little‐to‐no warning.
The need to ensure equity in activities that involve vulnerable populations, such as providing post‐disaster relief, is widely recognized as being extremely important (Gralla et al. 2014, Huang et al. 2012, Van Wassenhove and Pedraza Martinez 2012). This importance is reflected in the fact that equity is one of the three key measures, along with efficiency and effectiveness that are generally associated with determining appropriate locations for public service facilities (Marsh and Schilling 1994, Savas 1978). Within the healthcare and public policy literature, the concept of equity is typically divided into the notions of vertical equity and horizontal equity (Joseph et al. 2016, Mooney 2000, Mooney and Jan 1997). This particular division of the concept is also found in domains such as climate change (Cazorla and Toman 2001) and tax policy (Colman and Remler 2008), but it only recently has made an appearance in the context of operations management (Karsu and Morton 2015) and risk mitigation (Zolfaghari and Peyghaleh 2015).
Horizontal equity is specifically defined to be “the equal treatment of equals,” and it reflects the importance of ensuring that every individual or group with need has access to the same amount of resources to meet that need (Joseph et al. 2016). This can be provided by equity constraints that ensure that a certain amount of demand is met in each location (Davis et al. 2013, Noyan et al. 2016, Yan and Shih 2009). Vertical equity, on the other hand, is “the unequal, but equitable, treatment of unequals,” and it instead focuses on providing an amount of resources that is proportional to the amount of need (Joseph et al. 2016). This can be achieved, for example, by adopting an objective function that incorporates a measure of human well‐being over time, such as deprivation costs (Holguín‐Veras et al. 2013), or one that specifically targets need, such as a function based on risk.
In summary, our research makes several distinct contributions to the literature. First, it introduces a new risk‐based objective function, based on hazard likelihood, population exposure, and population vulnerability, which allows for pre‐positioning relief assets given the expected need, and provides a novel approach for modeling the impact of multiple units of additional assets on the local population's risk exposure. The model's overall performance is then assessed with respect to both risk reduction and the equity of the final asset allocations. Second, the article discusses quantifying the supplementary (although reduced) value that mobile assets can have in adjacent locations, with each asset providing an additional level of partial coverage that can further drive down the overall exposure to natural hazard risk. In our motivating problem setting, the ability to move these relief assets to the adjacent areas within hours is critical for opening shelters because lengthy delays are unacceptable if individuals and families need to be evacuated from their homes. In general, however, the ability to quantify the additional value associated with access to mobile assets applies to a range of different problems in which asset reallocation is possible. Third, the article directly addresses the need for more empirically grounded, evidence‐based applications and model development in humanitarian disaster relief (Pedraza‐Martinez and Van Wassenhove 2016, Starr and Van Wassenhove 2014). Because the central model was iteratively developed in direct collaboration with the Red Cross to avoid invalid assumptions and establish a link between theory and practice (Altay and Green 2006, Galindo and Batta 2013), this effort represents another step down the path of increasing the relevance of research to managerial practice.
Problem Statement
Sheltering Needs in Colorado and Wyoming
The last decade has seen a marked increase in large‐scale disasters requiring sheltering responses in the Western United States. According to the Federal Emergency Management Agency, there were only 14 disaster declarations in Colorado from 1980 to 2000, but from 2001 to 2016 there were 67 declarations (FEMA 2017). El Paso County, which includes Colorado Springs, experienced the Waldo Canyon Fire in 2012 (Stableford 2012) and the Black Forest Fire in 2013 (ABC7 2013), both of which required the evacuation of thousands of people. In September of 2013, the Front Range region, the corridor from southern Colorado to Wyoming along the eastern side of the Rocky Mountains including the greater Denver metropolitan area, flooded due to unprecedented rainfall, impacting more than 2.88 million acres (Dreier and Neary 2013); in total, 15 counties were included in federal emergency declarations as a result of the flooding. At the height of the disaster, 25 shelters were opened by the Red Cross and over 12,000 people were ordered evacuated. Thousands more were isolated and unable to evacuate due to high waters and/or infrastructure damage (Coffman 2013). In addition to these large‐scale events, there have been numerous other small disasters in both Colorado and Wyoming in the past decade that were not extensive enough to merit federal declarations but still required Red Cross shelters to be opened.
Red Cross Background
There are two distinct types of assets that the Red Cross uses to facilitate the opening of a shelter: caches and trailers. Caches are reserves of sheltering supplies, mainly cots, blankets, and other urgently needed materials, that are kept at a specified location. These caches typically contain materials sufficient for 15–25 people, and are often packed into very large containers or boxes. Caches are generally utilized for smaller‐scale incidents and are stored at schools, churches, community centers, and other locations at which shelters can be opened. In some instances, caches cannot be stored at the sheltering locations so they are, instead, stored at local Red Cross offices and moved to a nearby shelter when needed. The Red Cross does not generally move caches outside of the county in which they are placed because the amount of time and effort needed to move a small quantity of supplies over long distances is not an effective use of the organization's limited staff and volunteers.
In contrast to caches, trailers can be attached to vehicles and are easily moved to a different location within a short period of time. Consequently, trailers can help not only with opening a shelter in the county in which they are placed, but also with providing support, if needed, to any adjacent counties. These trailers are often stored at Red Cross offices, fire and police departments, or local government offices, and can be transported to the sheltering partner's location. In addition to the advantage of having supplies pre‐loaded in a mobile carrier, trailers are larger than caches and the amount of supplies contained within them is typically sufficient for 50–75 people. If larger shelters are required, or stocks of supplies at shelters diminish, then restocking of supplies can be handled by the surrounding trailers and caches, or supplies can be requisitioned from the main storage facility in Denver. The Denver facility, in turn, can be replenished from several different national Red Cross warehouses located in the United States, with the Las Vegas facility being the one most closely located to the region of study.
The Red Cross chapters in Colorado and Wyoming merged in 2013, becoming the first two‐state regional chapter in the United States. The Red Cross in Colorado is divided into five chapters (Central, Northern, Southeast, Southwest, and Western), while Wyoming is a single chapter. As part of the merger, the Red Cross wanted to examine their operations so that they could move forward in a more efficient manner. The organization had already begun examining the placement of existing caches and trailers to ensure the accuracy of locations and to begin standardization of the materials included within each asset. Although this was seen as a great step forward, they also wished to be able to systematically determine asset placement.
The current asset placements and chapter boundaries are shown in Figure 1. Traditionally, asset placement has been accomplished through historical precedent (i.e., an asset has been in a location for a long time, often pre‐dating current employees and volunteers and is, therefore, kept at that location) or intuition (a need is perceived). To help the Red Cross improve these placements, the authors worked with the organization to determine asset allocation based on the development of an analytical model grounded in empirical evidence.
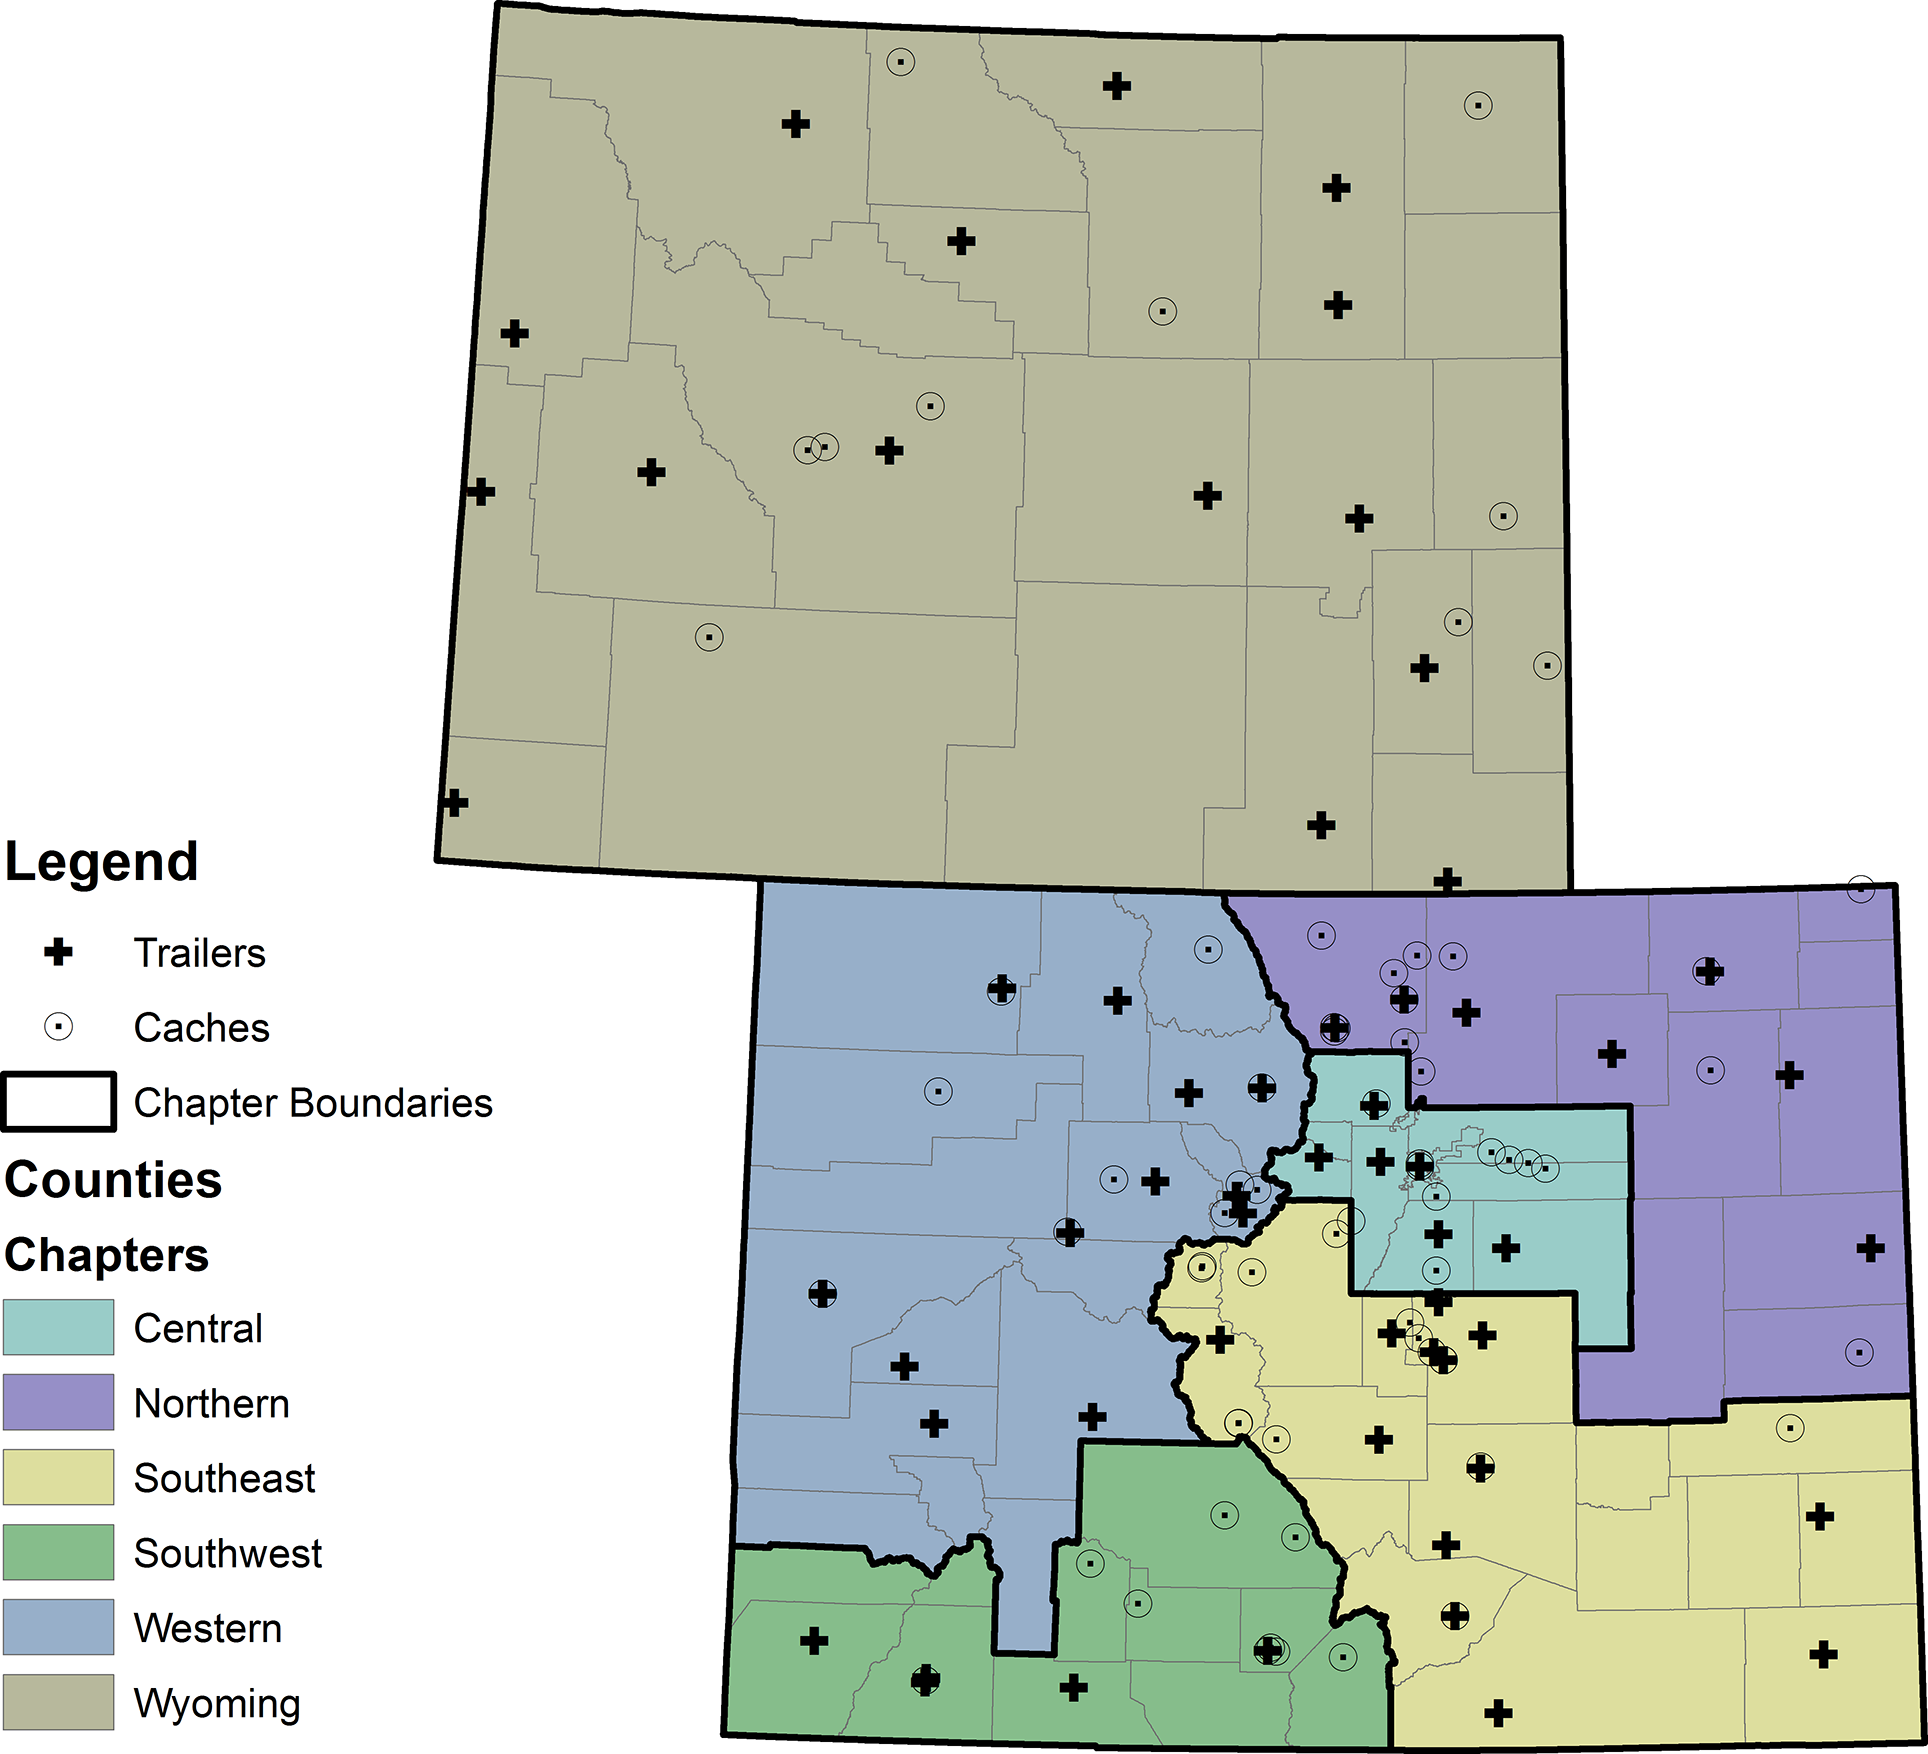
Current Asset Placement and Chapter Boundaries in Colorado & Wyoming [Color figure can be viewed at
Methodology
Data Collection
The first step in the process of creating an asset allocation model for the American Red Cross was to interview the logistics specialists for each chapter, as well as the regional logistics coordinator. These interviews were conducted with the goal of understanding both what went into the logistics decisions and the unique characteristics of each chapter, so that representative constraints could be incorporated into the model. For example, some counties and municipalities previously purchased and then donated trailers or caches of materials to the Red Cross to use. As a result, these assets cannot be moved from their current locations, even if they could be better utilized in other places. Conversely, since some counties prefer to handle sheltering needs themselves, there are other locations where the Red Cross has little or no presence.
There were several key pieces of data that the Red Cross was unable to provide to support the model development. First, there was no comprehensive tracking of historic asset usage and deployment within the organization. Although some chapters kept information about their most recent utilization of assets, particularly trailers, other chapters did not have this information. Because of this inconsistency, we were unable to incorporate such historic data into the model. The Red Cross has since developed a new mechanism for tracking asset usage, and it is possible that this information will be available in the future to help improve the model further. The second type of data that we were unable to get access to was the historical records of shelter openings and individuals served. The Red Cross does have a web‐based system in which each shelter opening is supposed to be registered, yet, despite significant effort; the system was unable to generate the reports needed to provide a meaningful historic dataset. As with the asset utilization data, if improvements to data collection and to the data retrieval process are made, then this system could become a valuable resource for further improving the model.
Although the inability to include these data sets puts some limits on model development, we agree with Galindo and Batta's (2013) caution that the general scarcity of disaster‐related data and the low frequency of previous disaster events can lead to inaccurate predictions if too much emphasis is placed on the use of historical disaster data, such as when an historic earthquake is used to predict the damage pattern of a future earthquake. This is especially true given the changing demographics and environmental conditions in the U.S. Mountain West. Colorado is the second fastest growing state in the United States (Murphy 2016), and the Denver metropolitan area is one of the 10 fastest growing areas in the country (United States Census Bureau 2016), yet, the number of assets available for sheltering support by the Red Cross have not kept pace with this increase. In addition to the population increase, new settlement patterns also contribute to increased risk. For example, in Colorado, the population residing in the wildfire‐urban interface, the area with the greatest risk for wildfires, has more than doubled between 2000 and 2012 and it is expected to be 300% greater by 2030 (Colorado State Forest Service 2015). Furthermore, the United States National Climate Assessment (2014) predicts general increases in both drought and wildfire activity, as well as in extreme winter storms and tornados, and it indicates that heavier winter and early spring precipitation along with earlier snowmelt are leading to increased flooding in both Colorado and Wyoming, with these trends expected to continue in the future.
Risk Definition
To capture the potential for disasters in the context of humanitarian relief, our new asset allocation model uses a measure of relative risk that is common within the social science literature (Aerts et al. 2013, Akgün et al. 2015, UNISDR 2009, Villagrán de León 2006, Willis et al. 2006):

Hazard Data
The hazard component of risk Equation 1 represents the likelihood that a particular hazard will occur. Working with state agencies in Colorado and Wyoming, we were provided the data utilized in state‐level hazard mitigation planning. Over 20 different hazard event types were tracked by each state and the list was ultimately narrowed down to four key hazards (floods, tornadoes, wildfires, and winter storms) after discussions with the Red Cross. These hazards represent the most common events for which the Red Cross provides sheltering in these states, and they are estimated to be associated with 90%–95% of shelter openings. Because the hazard likelihoods in both states were provided at the county level, this became the granularity used in the model. The lack of more geographically specific data made it infeasible to determine more precise locations for asset placement within each county. Hazard likelihoods for floods, tornadoes, wildfires, and winter storms are shown in Figure 2.
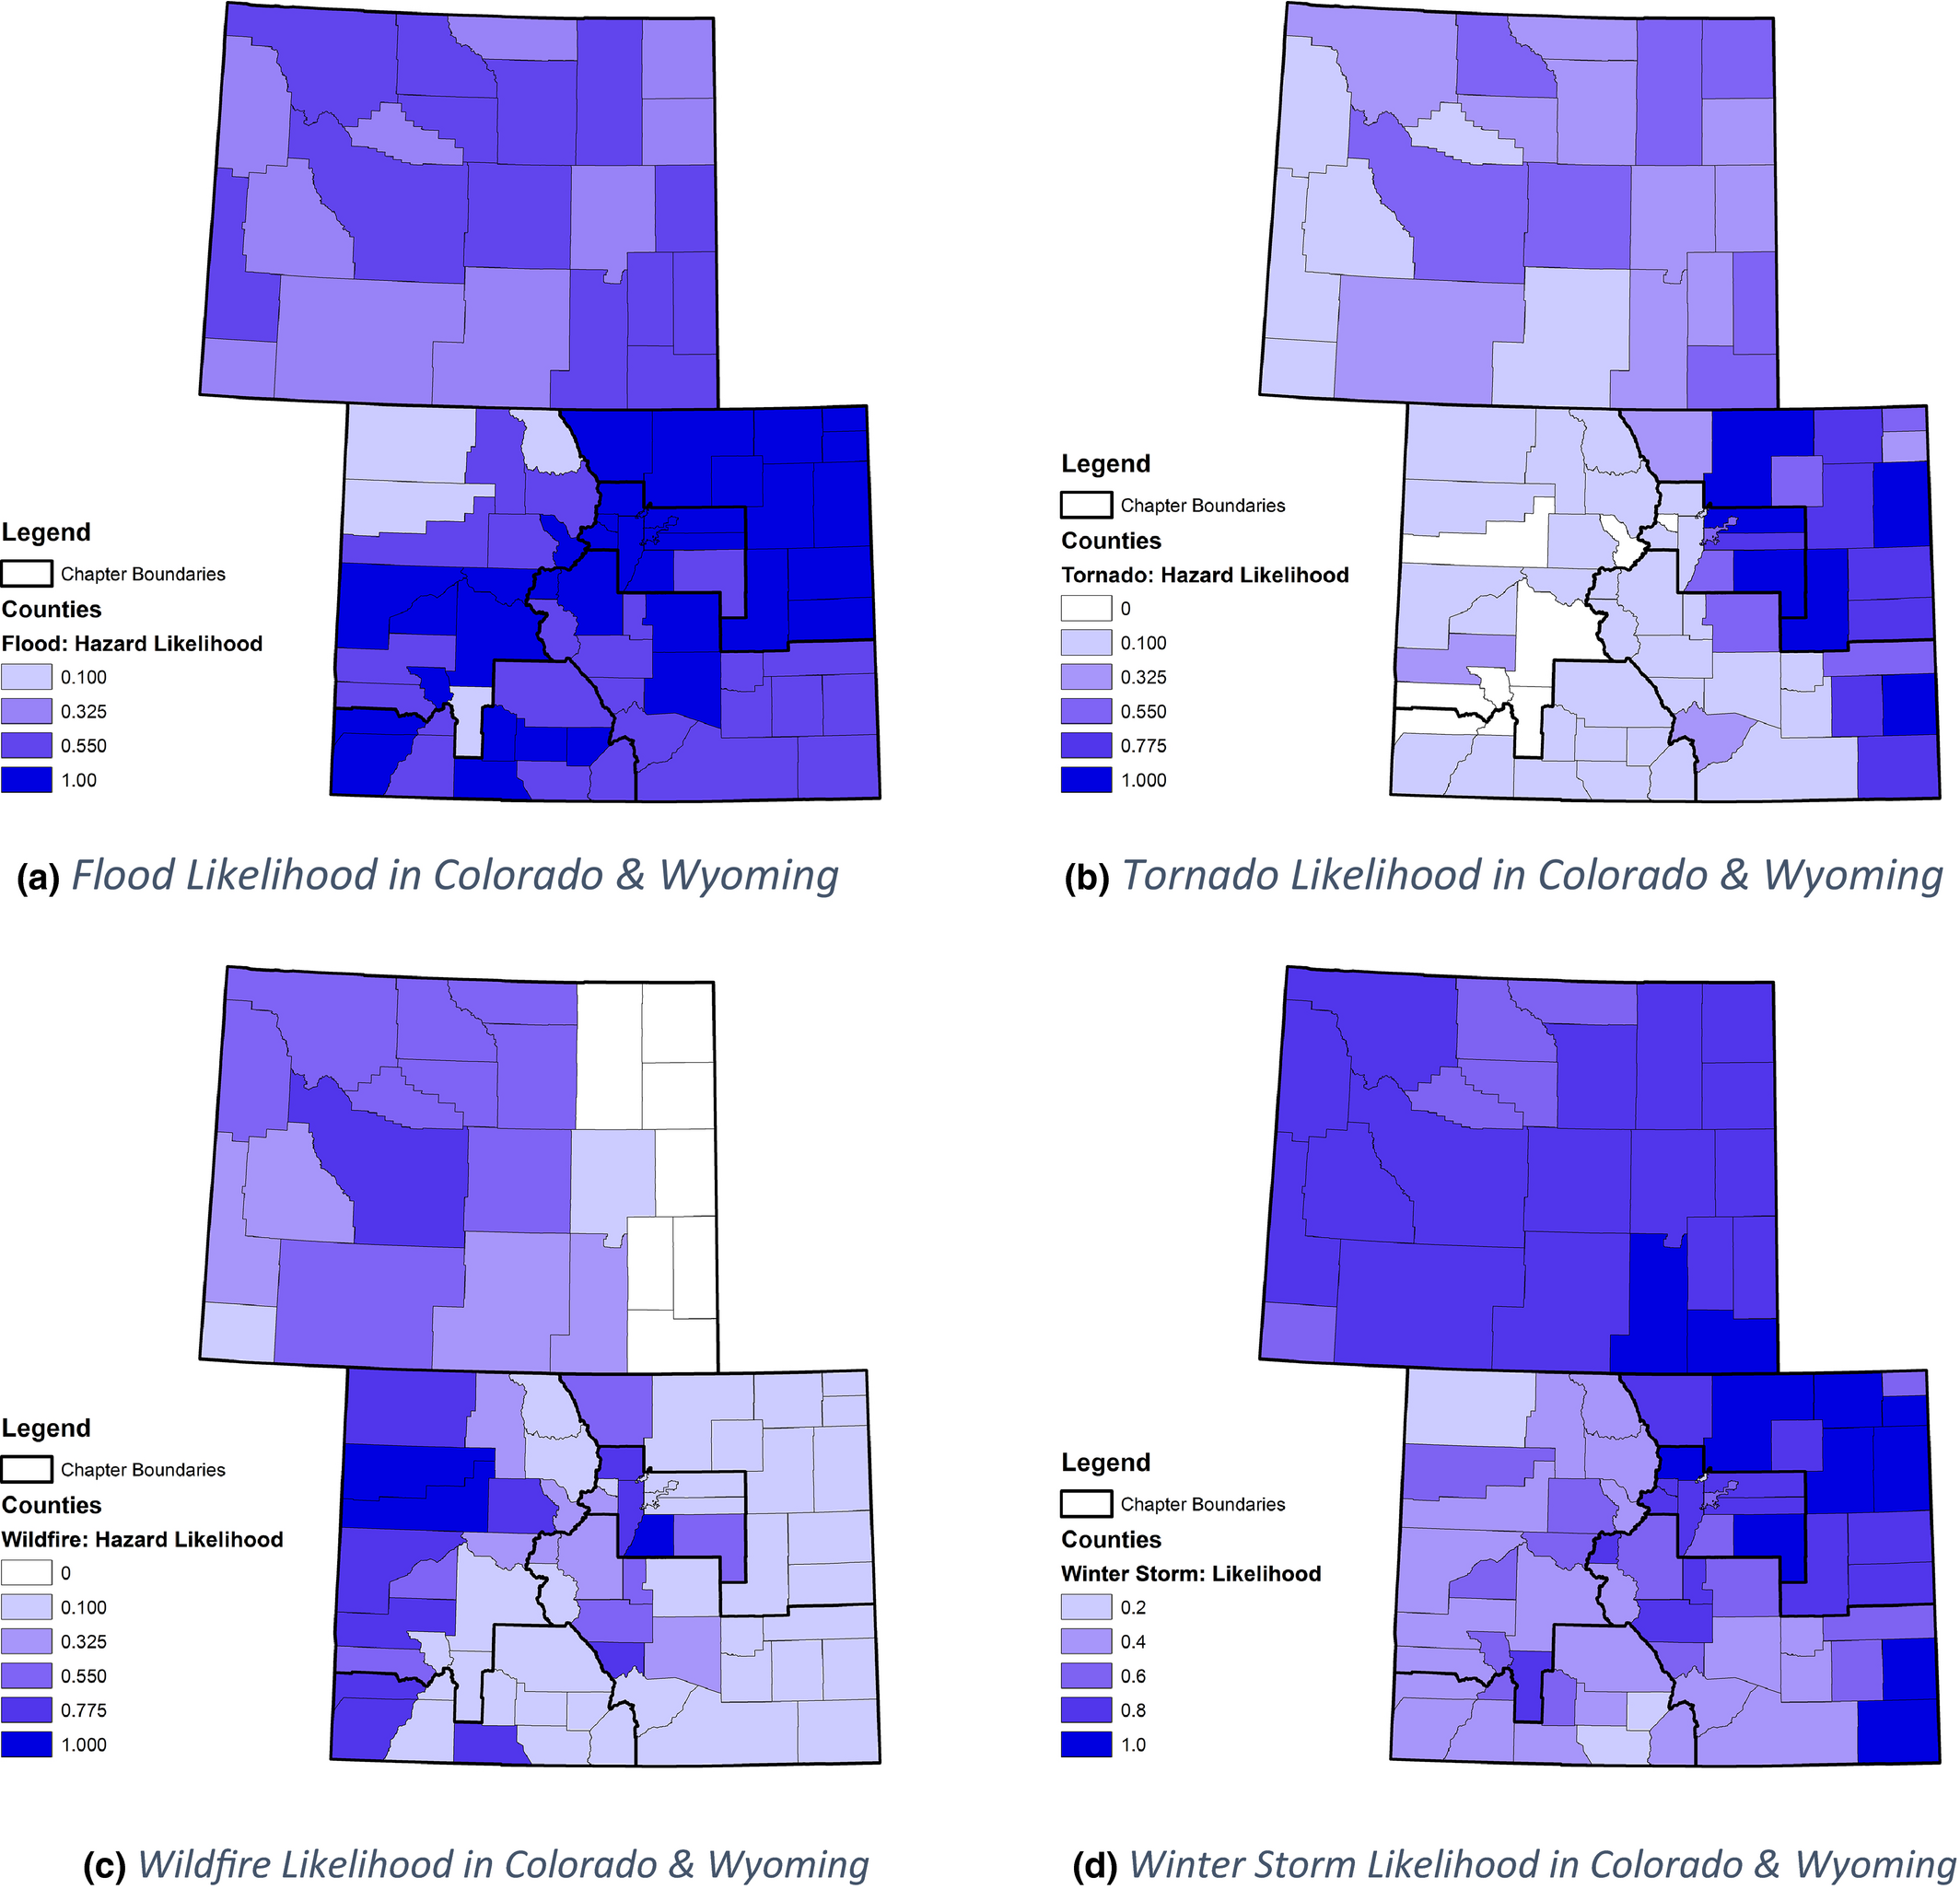
(a) Flood Likelihood in Colorado & Wyoming. (b) Tornado Likelihood in Colorado & Wyoming. (c) Wildfire Likelihood in Colorado & Wyoming. (d) Winter Storm Likelihood in Colorado & Wyoming [Color figure can be viewed at
Exposure Data
The exposure component that is used for the risk calculation, in each county and for each hazard type, is defined by three types of data as shown in Equation 2:

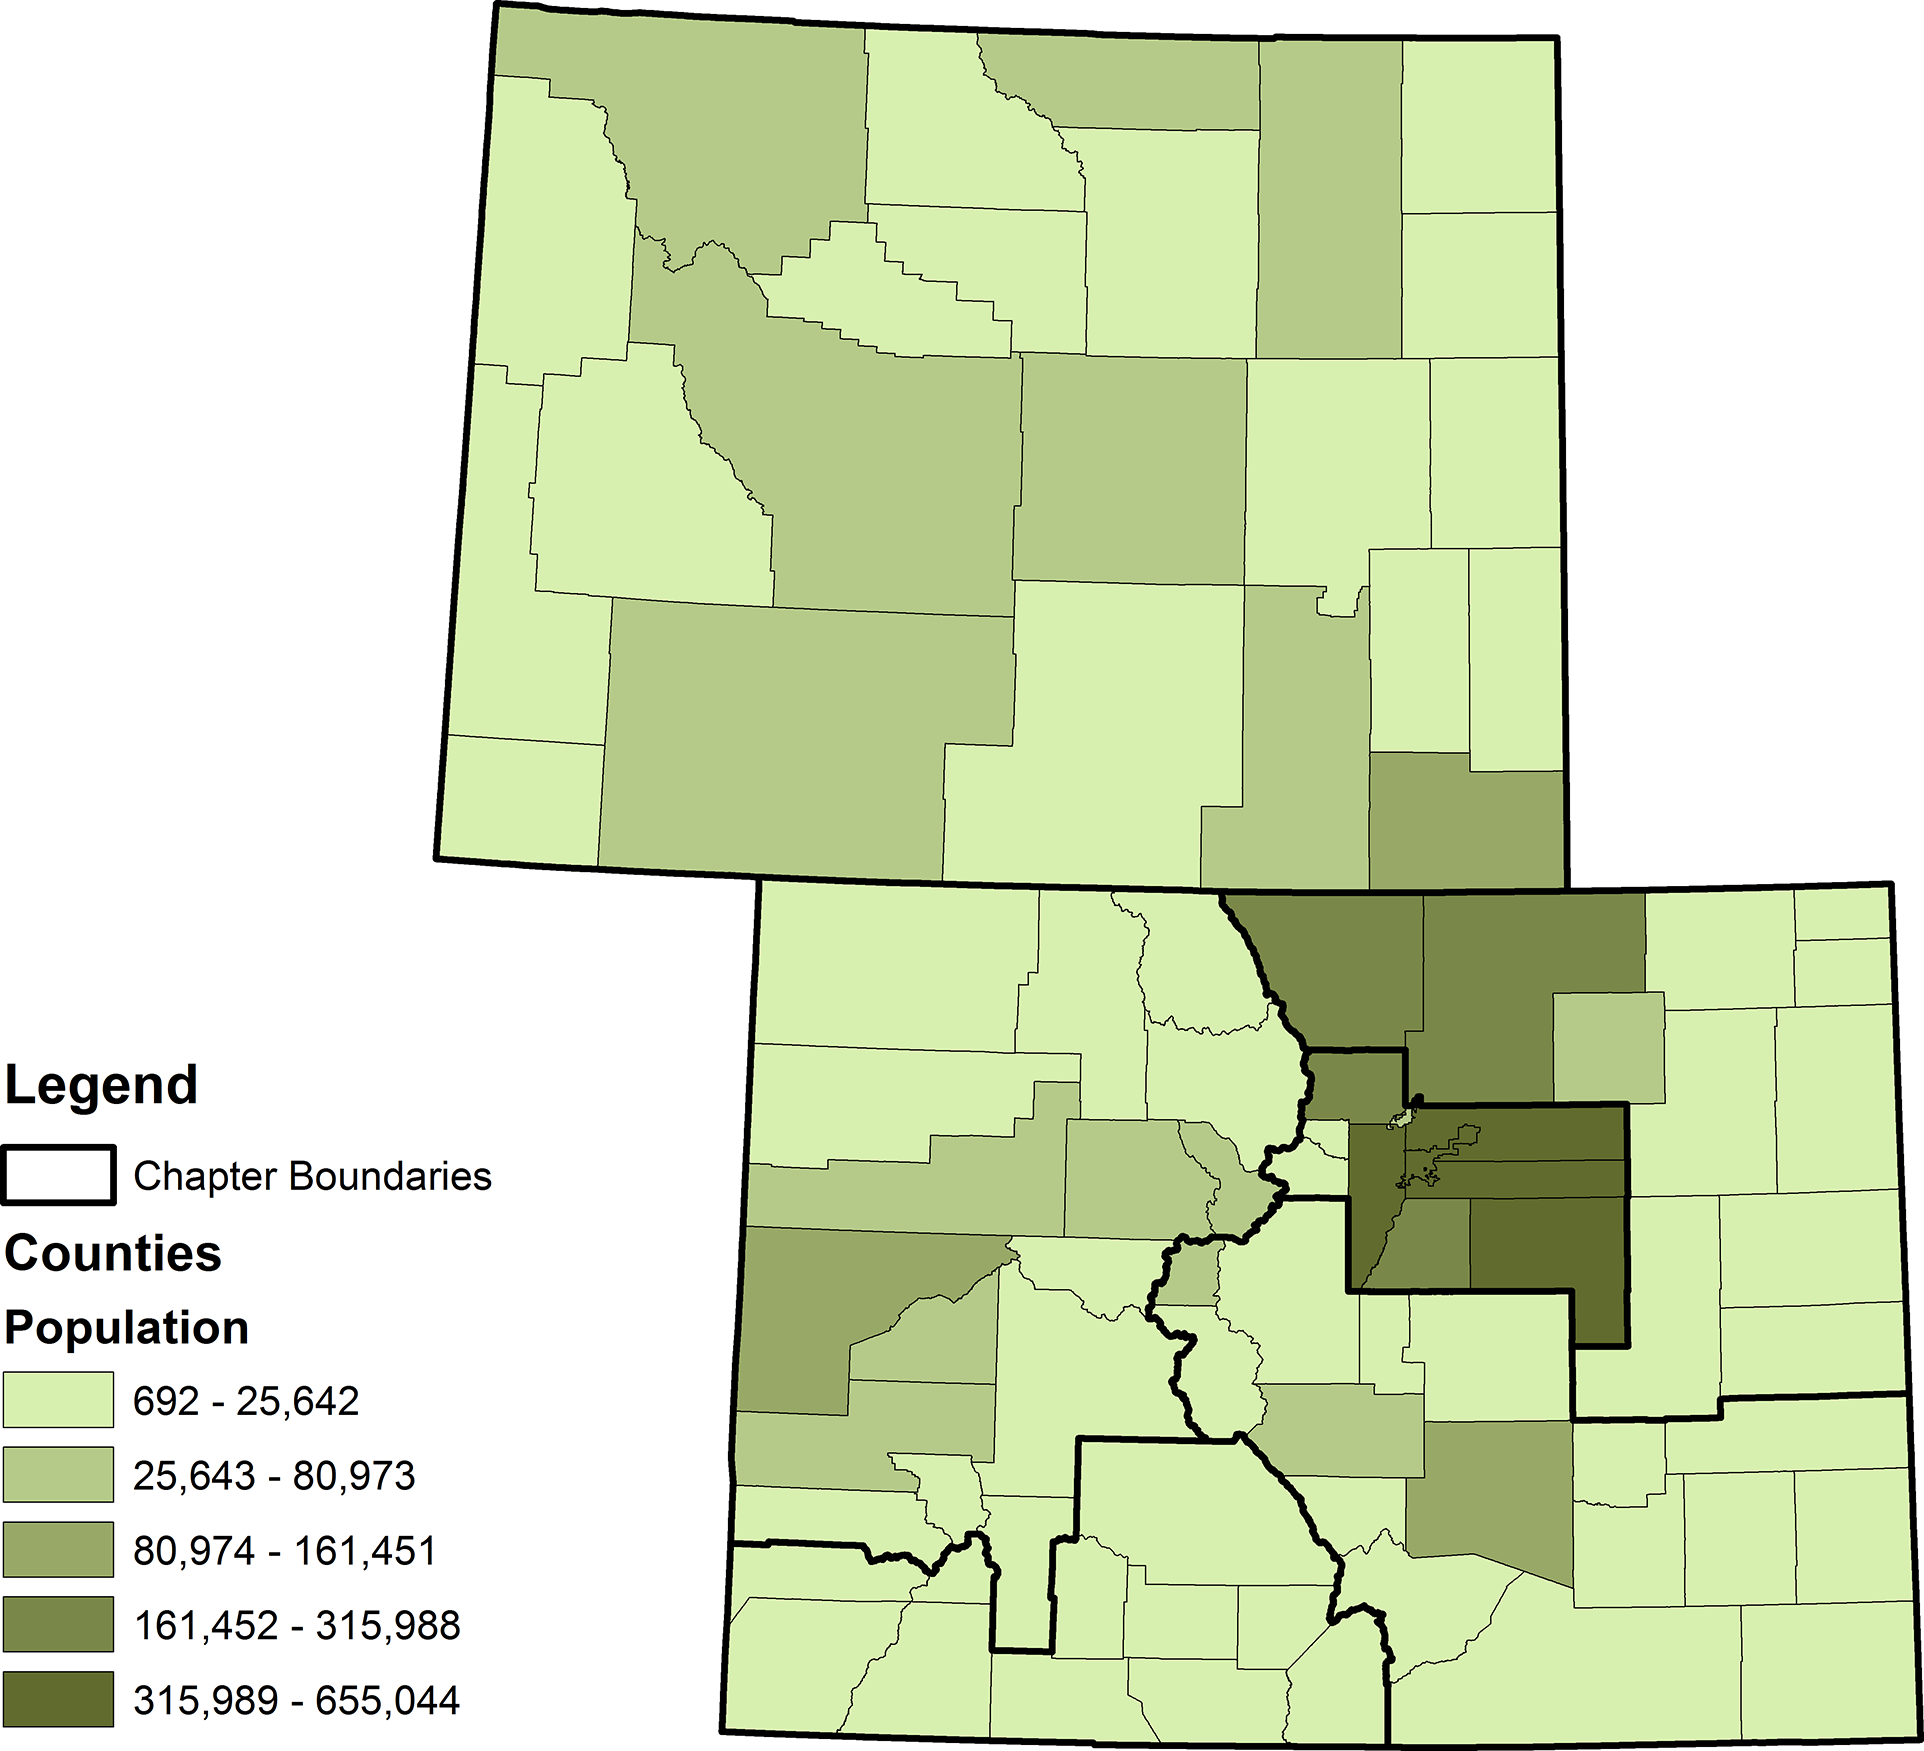
Population in Colorado & Wyoming [Color figure can be viewed at
Displacement data was provided via the state hazard mitigation plans, wherein the displacement was defined to be the estimated number of people or percentage of the population in each county that would need to be evacuated from the area for a given hazard type. This displacement term helps to account for the geographic distribution of individuals in the county, relative to different landforms such as forests or flood plains that may be susceptible to particular hazards. Although residents displaced by a hazard can be sheltered in neighboring counties, this is very infrequent. Instead, it is much more common for shelters to be set up within the vicinity of the disaster, even in the case of very large events. During the 2013 floods in Colorado, there were shelters created throughout the numerous impacted counties in Colorado.
Sheltering needs, the final component of exposure, was introduced based on discussions with the Red Cross, when they noted that two counties can have similarly sized displaced populations but may see different numbers of residents actually seeking shelter. Traditionally, the Red Cross has seen greater proportions of residents seeking shelter in urban counties than in rural counties, but even counties with similar demographics can behave differently. The disaster program managers for each chapter were, thus, asked to estimate the percentage of the impacted population that they would expect to see in an overnight shelter. These percentage values were then multiplied by the population and displacement percentages in each county to provide an adjusted value of exposure that was used in the risk calculation as a sheltering needs factor.
The instances of potential exposure across the two‐state region were concentrated in the Central chapter of Colorado, which is in the Denver area and contains over 50% of the total population in the two states. The Southeast and Northern chapters also contain large population centers, accounting for 17% and 12% of the population, respectively. Given the concentration of population in these areas, the exposure levels will naturally be higher for these chapters than for the remaining three chapters in the region.
Vulnerability Data
Both Wyoming and Colorado use the Social Vulnerability Index (SoVI) methodology (Cutter et al. 2003) in their hazard mitigation plans to assess the vulnerability of their communities to the effects of a disaster. This index is based on data such as socioeconomic status, race/ethnicity, age, employment characteristics, and rental rates, as indicators of the inherent vulnerability of a given population. Because of the widely accepted nature of this measure (Burton 2010, Myers et al. 2008, Solangaarachchi et al. 2012) the calculated SoVI values for each individual county are used to represent vulnerability in the risk calculation for this model, with negative values representing less vulnerable counties and positive values representing more vulnerable counties. The results are shown in Figure 4.
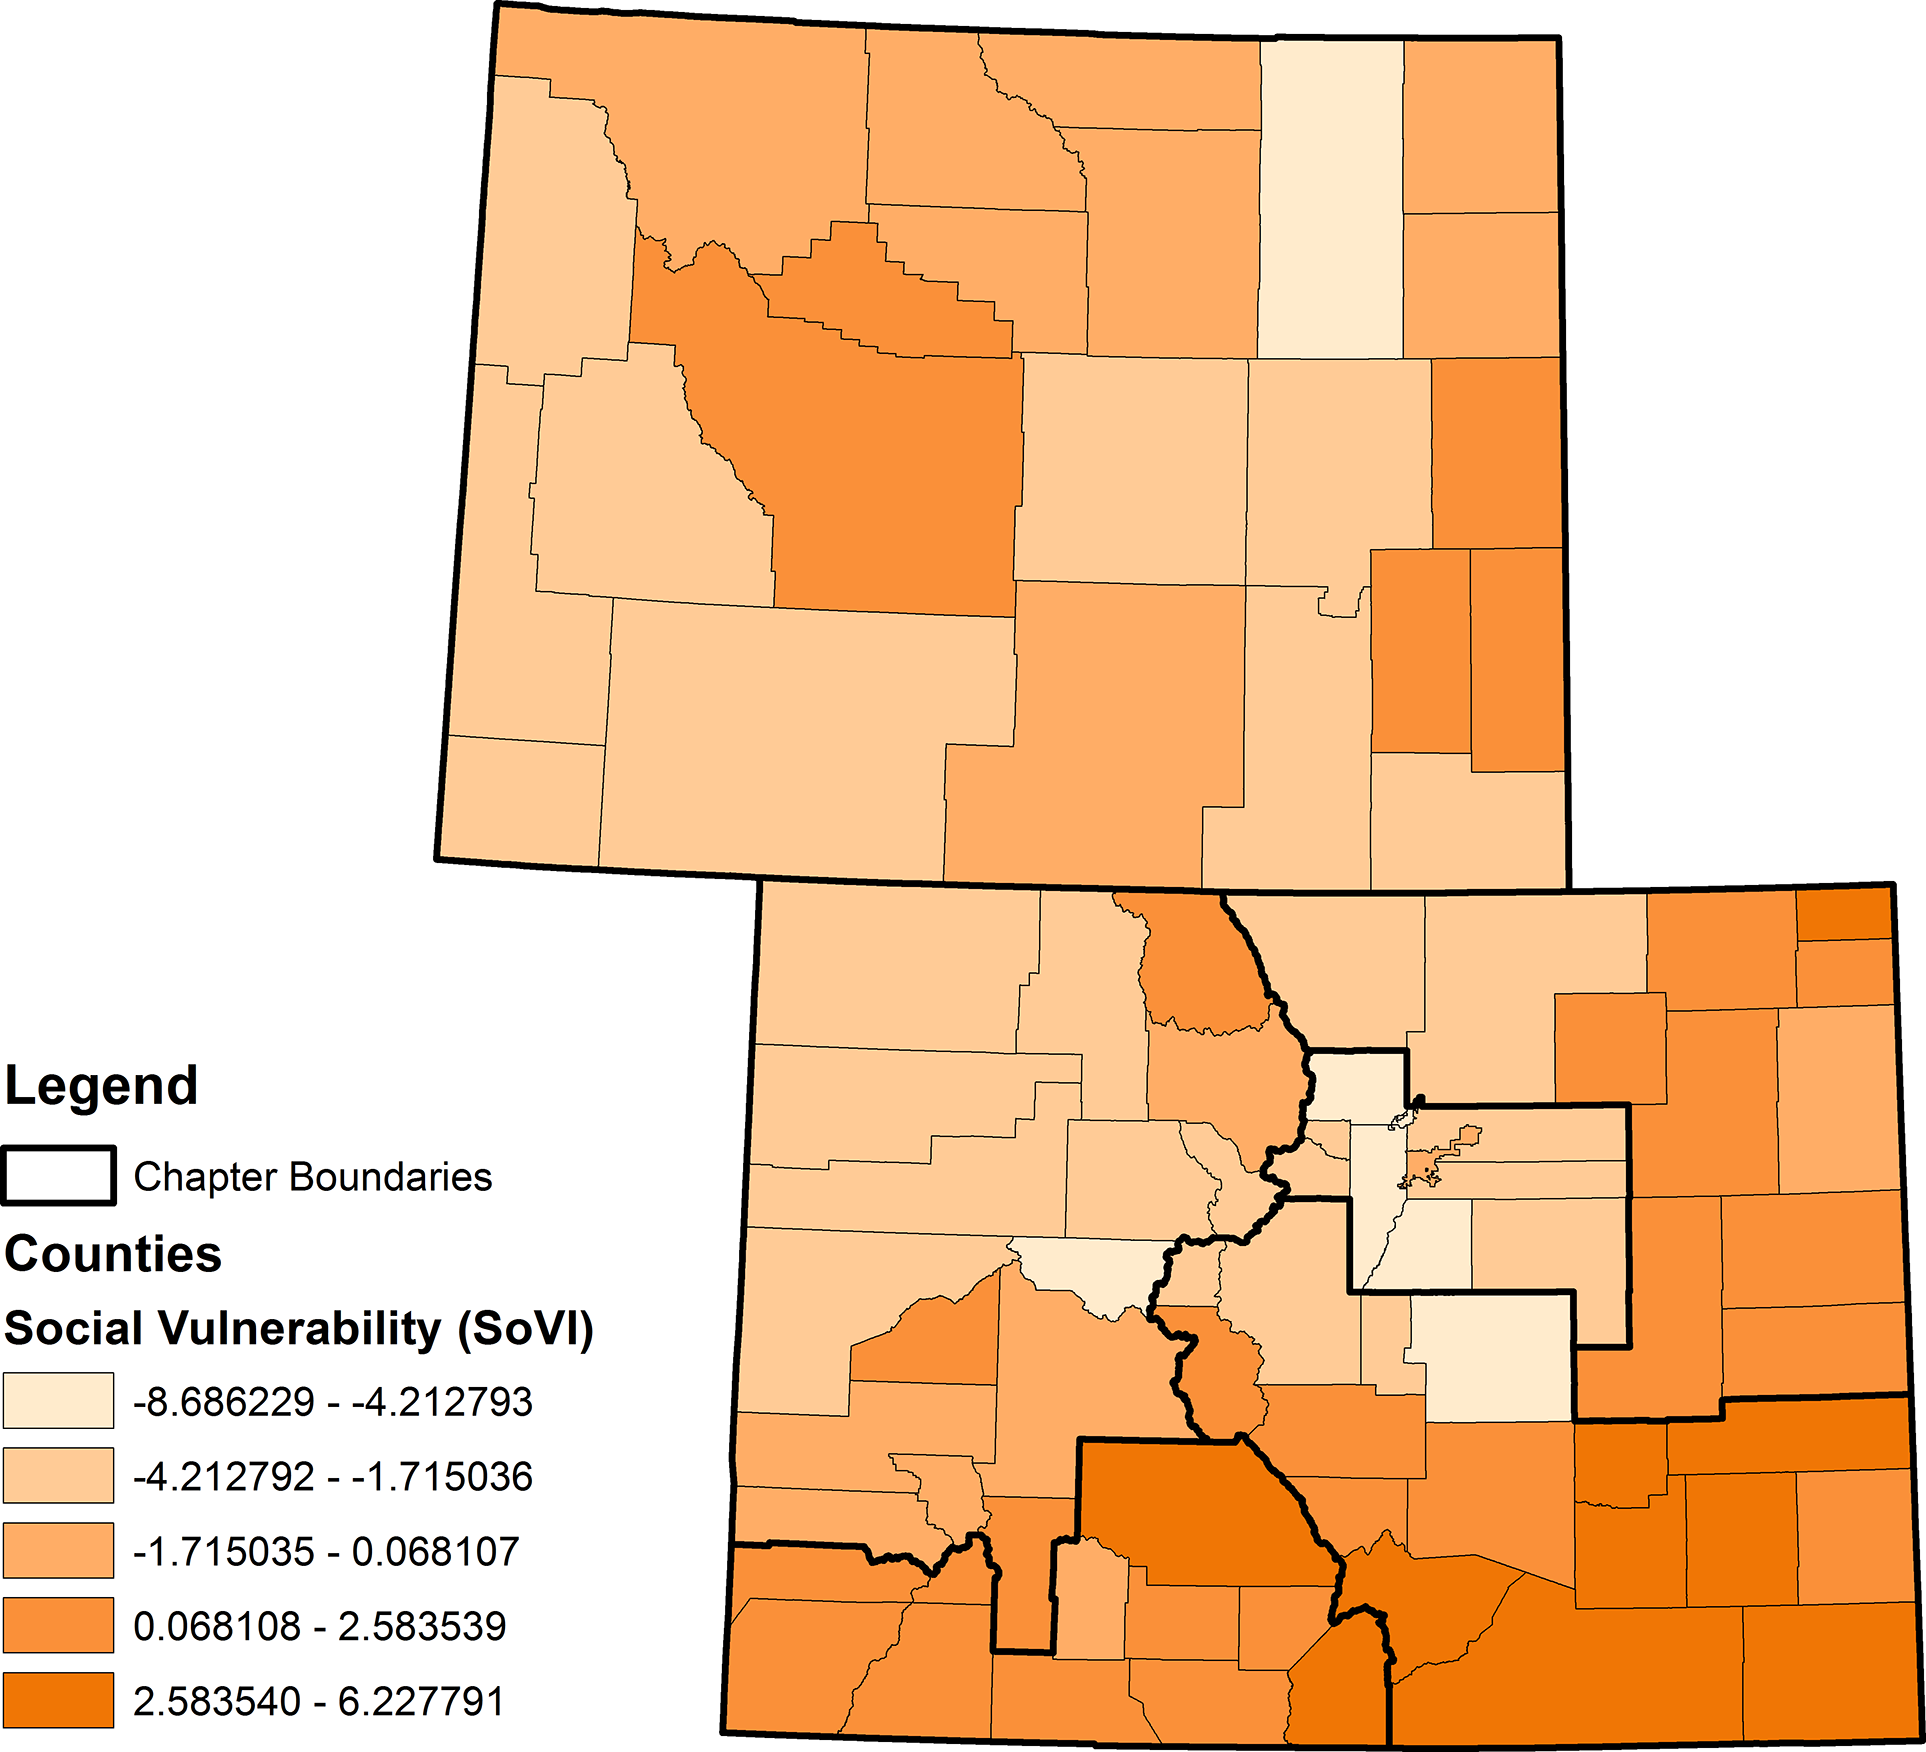
Social Vulnerability Index Values in Colorado & Wyoming [Color figure can be viewed at
It is important to note that in an initial round of model development, we presented the Red Cross with a model that included the social vulnerability measure but not the sheltering needs component from the exposure calculation (Equation 2). The Red Cross commented that they have looked at the issue of vulnerability previously and that they consider the two types of indicators to represent different characteristics. In their opinion, although the SoVI values are important, they do not capture the same information as the sheltering needs factor and it is for this reason that both values are included in the model.
Additional Considerations
A complicating factor in the calculation of such risk is the fact that only three of the four hazards (floods, tornadoes, and wildfires) lead to shelter populations that are drawn from the local resident population. For the fourth hazard, winter storms, the vast majority of people seeking shelter are, instead, non‐local travelers that are stranded due to poor conditions and road closures. These people often seek the services of a shelter due to the lack of available rooms in local motels and hotels. This is a common occurrence in many parts of Colorado and Wyoming where steep passes and harsh winter conditions often occur in isolated and less populated areas of the states. Because of this, neither the use of the exposure values nor the use of the vulnerability values in the risk calculation was determined to be appropriate in the context of winter storm hazard calculations. Instead, the model includes the winter storm sheltering needs as a constraint, ensuring that assets are placed at the appropriate locations to facilitate winter storm shelter openings based on the recommendations of the disaster program managers.
Another consideration in determining risk is whether or not to include structural fires, which are a relatively common cause of sheltering in urban environments in particular. Even though specific information is not currently available regarding the rate at which such incidents occur in either Colorado or Wyoming, the National Fire Protection Association has previously used demographic information to find several key factors leading to increased incident rates. However, since most of this information is already captured in the social vulnerability calculations and in the population density, using it to calculate hazard likelihood might lead to issues of autocorrelation among the input data. The risk calculation, therefore, assumes that structural fire likelihood is implicitly captured through the population and social vulnerability measures, and it does not include it as a separate, distinct hazard.
Risk‐Based Model Formulation
Given this very specific definition of risk, the generalized version of our asset allocation model is formulated as follows:
Defining H
ij
and E
ij
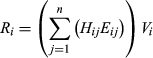
to be, respectively, the hazard likelihood and exposure levels for hazard j in location i, and letting V
i
be the corresponding vulnerability value, the initial risk for location i is given by:
Let A
i1, A
i2, …, A
iM
be decision variables representing the number of units of each of M different types of assets, respectively, that are to be placed in location i ∈ {1, …, N}, and let


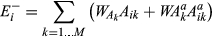
We then let


The actual allocation of assets does not change the hazard likelihood, and it does not fundamentally change the underlying vulnerability of a location's residents (as measured by the SoVI). As new assets are placed in a location, however, and as assets are placed in adjacent locations, the exposure in that location (i.e., the population still in need of sheltering assistance) decreases and, thus, the overall risk associated with the location decreases as well. With this in mind, we can calculate the exposure coverage provided by the allocated assets as follows:
Given exposure E
ij
, as defined above, we define weights


It is important to recognize that even though highly populated locations might have thousands of people exposed to a hazard, a single asset, such as a cache or a trailer, is probably only ever able to provide sheltering support to a small proportion of that number. Allocations should reflect the implicit decrease in the level of resources per person that the organization provides at higher levels of exposure, in part because other sources of support are also available in more populated areas. Such nonlinear behavior is directly reflected in the Red Cross’ current distribution of assets: they currently allocate one trailer to cover the needs of Baca County, with a population of less than 4000 people, but they allocate only five trailers to El Paso County, with a population of more than 650,000.
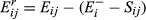
To reflect the nature of this behavior, we can adjust Equation 5 to incorporate an exposure function, f(·), that allows for scaling the provided coverage in a nonlinear manner:
Equation 6 now allows us to calculate the residual risk for each location after allocation as follows:

The full optimization model is presented in Appendix B. In addition to the typical constraints on variable and parameter values, the model also allows for a minimum amount of exposure coverage to be required in each location to support considerations such as the winter storm sheltering need constraint discussed previously. The model also allows incorporation of earmarking constraints (Aflaki and Pedraza‐Martinez 2016, Besiou et al. 2014, Stauffer et al. 2016) as a type of lower bound to reflect that some assets may need to be assigned to specific locations. This can occur, for example, if the Red Cross shares the cost of a new trailer with a given community and agrees, as a result, to permanently place the trailer in that particular location.
Results
The two types of assets currently managed by the Red Cross are trailers (A
i1) and caches (A
i2), of which there are 62 (


The data available for calculating the three different components of Equation 1 varies significantly across the three parameters in this region: hazard likelihoods for each of the included hazards were consistently calculated on a 0–5 scale in Wyoming but each of these hazards was measured on a separate scale in Colorado; the county population data used for calculating exposure ranged from a low of 692 to a high of 655,044, and the raw social vulnerability scores covered a range from −8.69 to 6.23. To balance their contributions to the overall risk, each of the three components (hazard, exposure, and vulnerability) was normalized. Because all populations have some inherent vulnerability, a lower bound of 0.1 was used for the vulnerability measure. In addition, sixteen counties had a likelihood of zero that a given hazard would occur.
The values of the relative weights for trailers (


Given the exposure function discussed in Appendix A, with linear behavior up to x = 9 cache‐equivalent units and a maximum exposure level of m = 30 units, we have a corresponding weight of δ = 0.0333 for each individual cache. Trailers and adjacent trailers are then weighted at 0.1 and 0.0167, respectively. The maximum value in the linear portion of the function is 225, which allows us to cover 73% of all the county exposure values within this range. The resulting baseline risk values for the region, prior to allocating any assets, are shown in Figure 5a. The current asset allocation prescribed by the Red Cross provides a 60.04% reduction in average risk across the region (with respect to these baseline values), but it also results in excess assets being allocated to 49 of the 87 counties. This implies that it may be possible to achieve a more efficient and equitable solution by reallocating the existing assets.
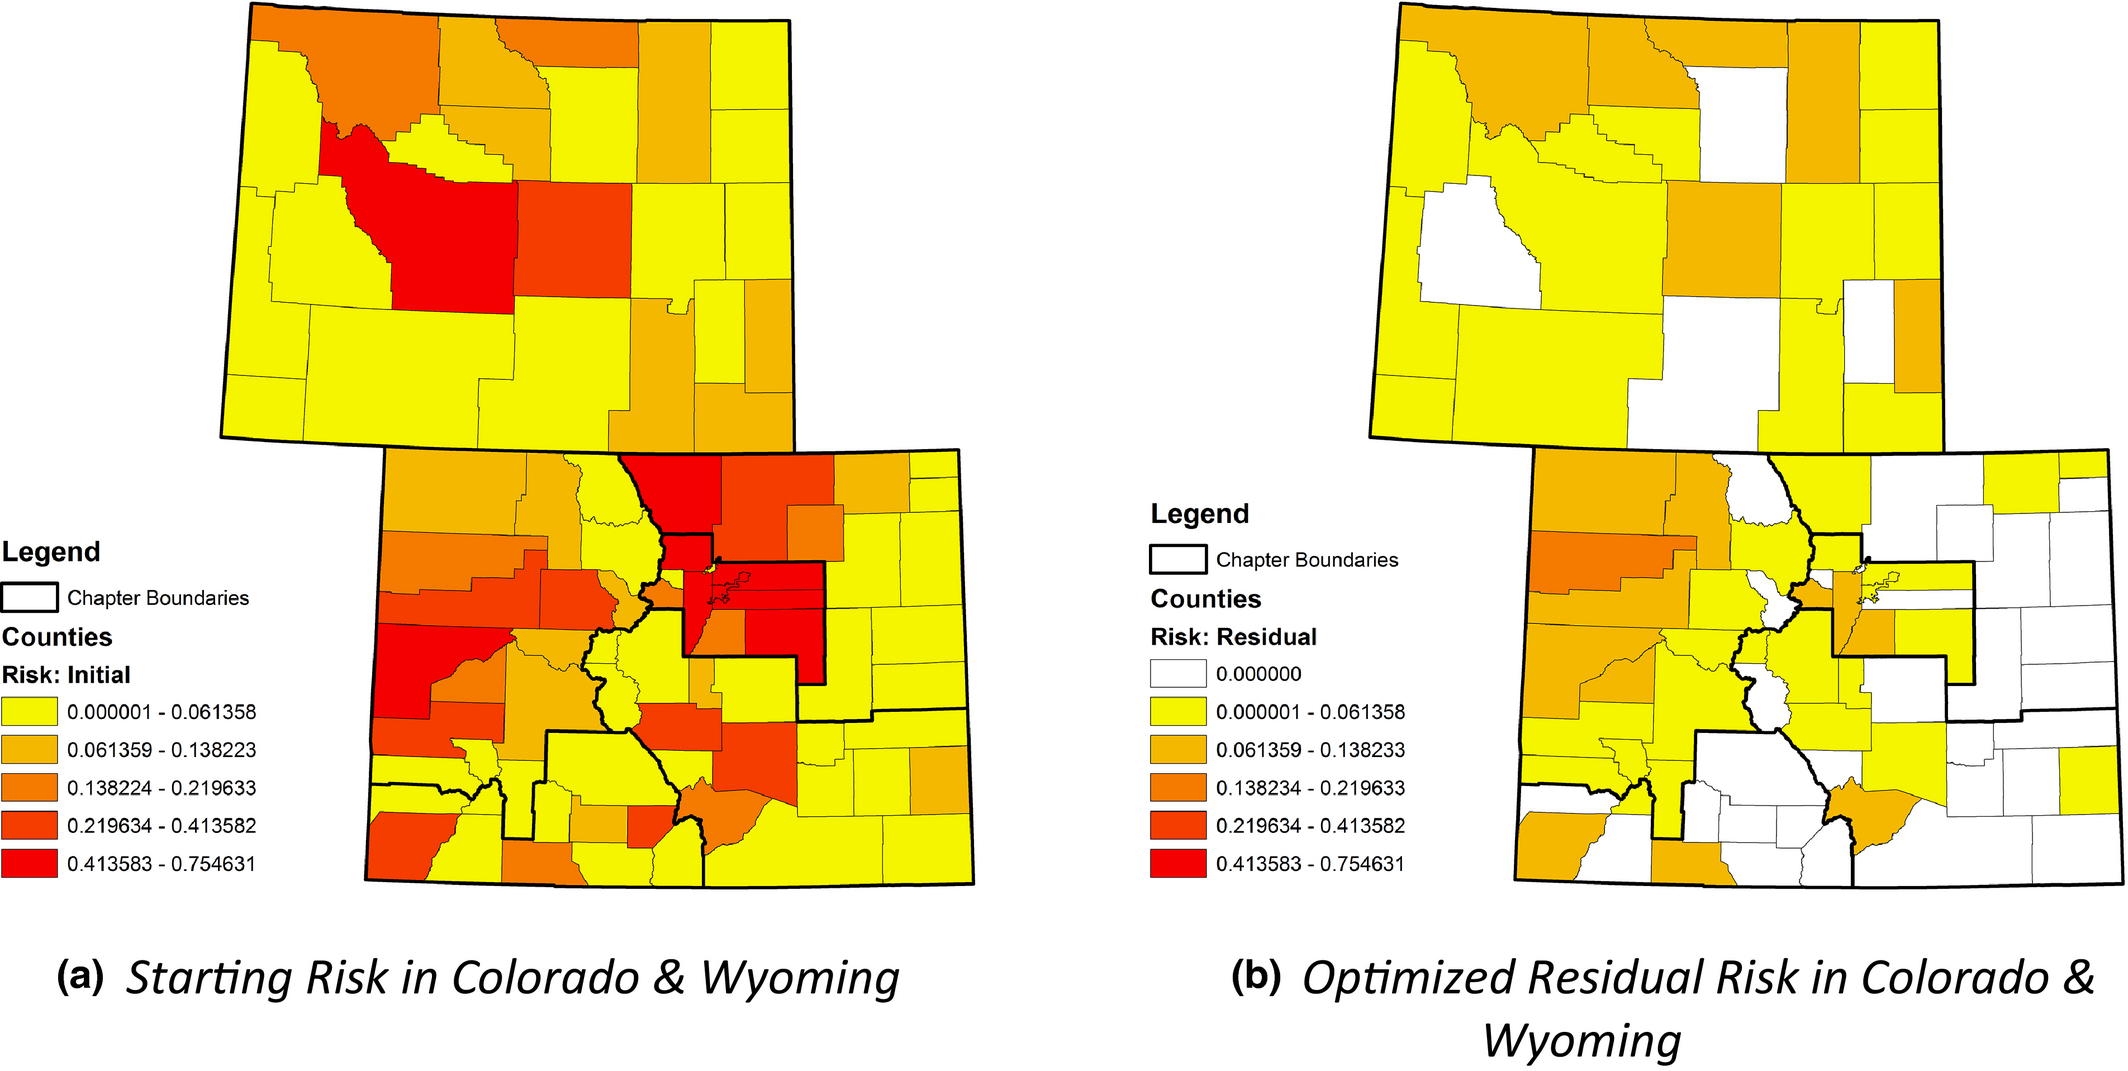
(a) Starting Risk in Colorado & Wyoming. (b) Optimized Residual Risk in Colorado & Wyoming [Color figure can be viewed at
Subsequently, when the optimization model is used to generate an improved allocation, the average risk reduction changes to 81.13%, an increase of more than 33% from the current allocation, and the maximum residual risk for any county in the region changes to 0.1476 from 0.5508. This maximum residual risk value is less than the residual risk of 10 different counties in the current allocation. The number of counties with excess coverage is reduced to 16, and all but three of these excess allocations are due to adjacent trailers. Figure 5b shows the residual risk in each county in the region after the allocations have been optimized. This indicates the improvements made on a county‐by‐county basis, including the 36 counties that now have full exposure coverage and a residual risk of zero.
Table 1 provides the current and optimized allocations for caches and trailers summarized by chapter, along with the total number of adjacent trailers in the region. It is easy to see that the optimal allocations for both the trailers and the caches are very different than what the current allocation provides. In the optimized allocation, the Central chapter received the most assets, including a substantial increase in trailers and a small decrease in caches. This corresponds to the higher average risk values found in these counties. Conversely, Wyoming loses eleven trailers but gains five caches. Part of the impetus for combining the Colorado and Wyoming chapters was that Colorado has been growing and needs additional assets, while Wyoming has traditionally had more assets than needed given the smaller exposure levels in the state. In discussing this reallocation of assets from Wyoming to Colorado, the Red Cross stated that they believed there would be little opposition to the change because the new allocation will provide more effective disaster relief for everyone in the region.
Trailer & Cache Allocations along with Residual Risk values by Chapter
Although an explicit upper bound constraint was not defined by the Red Cross, the maximum number of trailers placed in any county in the region was seven (El Paso County in the Southeast chapter), with only one other county receiving as many as five trailers. All other allocations were of four or fewer trailers per county. For caches, Eagle County in the Western chapter received six caches, while another county received five caches, and all other county allocations were of four or fewer caches. The number of counties without any direct assets allocated was 29, and only four of those counties were without an adjacent trailer, which means there was no risk reduction for these four counties. Although these values are slightly higher than the current allocation (20 and one, respectively), the new allocations do a better job of matching assets with needs.
Analysis and Discussion
In this section, we discuss several key points related to the application of the new asset pre‐positioning model. In particular, we take a closer look at issues of equity, the role of a permanent warehouse, and the impact of acquiring new assets, as well as the tradeoffs associated with considering seasonality and the effect of varying two of the most significant parameters (the relative asset weights and the sheltering percentage values). At the end of each subsection, we discuss the practical implications associated with applying the framework in other contexts, and we include some general takeaways that expand upon the specific results of the current modeling effort.
Equity
The model developed in section 4.3 implicitly provides vertical equity, as discussed in the literature survey, by ensuring that the neediest counties and sub‐regions receive assets, regardless of the size of their populations. In this section, we consider two alternate formulations of the model that more explicitly address the need for equity in different ways and we compare the results.
Our first alternative approach utilizes explicit equity constraints that ensure that each area is afforded some minimum level of coverage, providing a measure of horizontal equity across all locations. To apply this approach, we used the existing model structure introduced in section 4 with an additional constraint that required at least one asset to be placed in each county, thereby assuring at least minimal availability. The model itself determines what type of asset to place in each case, based on availability and degree of risk reduction needed.
The second alternative approach involves using a minimax objective function. Since a number of counties in the two‐state region experience 100% risk reduction in the optimized allocation, the maximum difference between any two risk values in this case is simply the maximum residual risk across all counties. In our particular problem setting, the minimax approach thus provides vertical equity by focusing first on addressing the needs of the higher risk counties.
Table 2 provides some key performance indicators for the original min‐sum model presented in section 4, as well as the model with the additional equity constraint, and the minimax model. Compared to the min‐sum model, in which 29 counties had no direct assets placed within them, the use of the equity constraint guarantees that all counties have at least one cache or trailer, which was the goal. However, with respect to the other key values, the equity constraint model has decreased performance overall, with lower average risk reduction and correlation with risk, as well as an increase in the maximum residual risk across all counties. The measure of correlation between assets and initial risk, in particular, indicates the extent to which the level of assets assigned to each county mirrors the amount of risk in that county and, thus, how well the model addresses the overall distribution of risk. The minimax model, in turn, reduces the maximum residual risk by more than 50% compared to the min‐sum model, which is substantial but expected given that this was the aim of the objective function. Again, however, we see decreases in the average risk reduction, in the correlation with risk, and in counties with full risk coverage, along with an increase in counties without assets, especially those that do not even have a trailer in a neighboring county. The correlation between the optimal asset allocations in section 4 and the two alternate models is fairly strong, but is higher with the equity constraint, which makes sense given that both use the min‐sum objective function.
Comparison of Alternate Equity Models
Although trade‐offs exist between the three models, the min‐sum model developed above provides the most appropriate approach for ensuring equity for several reasons:
First, when comparing the original min‐sum model with the model that uses equity constraints, it is important to remember that the risk‐based asset allocation problem is focused on offsetting the risk of future disasters, rather than fulfilling the immediate needs of an already affected population. Pre‐positioning an asset in a low risk location does not automatically guarantee that it will be used by that population, since a hazard may not actually strike that particular area. Utilizing an approach that targets higher risk locations such as the min‐sum model without equity constraints, therefore, makes it less likely that assets go unused and more likely that a greater amount of need can be met. This is particularly important when there are limited assets available, as is often the case with relief organizations such as the Red Cross.
Second, although the minimax approach directly targets the locations with the highest residual risk, it does not also explicitly attempt to reduce risk in locations with lower levels of residual risk. In the Red Cross example, the impact of this behavior can be seen in the number of counties whose risk was entirely addressed, which drops from 36 in the original model to only 20 in the minimax model. This implies a significant tradeoff between improving the maximum risk value and improving the risk values of the other counties in the region. If locations with small but very vulnerable populations have slightly less calculated risk than other locations, then an approach that addresses only the highest risk areas may not allocate enough resources to address their needs.
Third, the minimax model does not explicitly incorporate the corresponding impacts on adjacent locations since it only targets the highest risk locations regardless of where they are. The min‐sum model, however, does allow for considering the impacts of utilizing mobile assets in its assessment of the effectiveness of each allocation, when such assets are available, and it takes a broader view of where these assets can do the most good. By covering lower risk areas with assets that have been allocated to adjacent locations, other assets are freed up that could then be utilized more effectively in the higher risk areas. This ultimately allows for much more vertical equity than the other approaches because it directly places assets where they are likely to be needed most, while still providing a proportional amount of appropriate coverage for the lower risk areas.
Fixed Warehouse
One specific approach by which mobile assets could be freed up to address need in higher risk areas is to incorporate permanent warehouse locations into the direct distribution of the disaster relief assets. Such warehouses typically have the ability to store much larger stockpiles of materials, and they could potentially allow for the reallocation of a large number of mobile assets. The Red Cross in Colorado and Wyoming manages such a permanent warehouse in Denver, but it is currently only used to restock other locations, as necessary, within the first 72 hours of shelter openings.
In theory, the Denver warehouse could be used to directly support the Red Cross's efforts to open individual shelters. However, there are two specific reasons why the organization does not currently do so. First, the supplies in the warehouse are organized in such a way that it is significantly easier to restock specific items than it is to create complete shelter opening kits and, thus, gathering the correct set of supplies and assembling the kits is overly time‐consuming. Second, even if the Red Cross were able to construct a large number of kits relatively quickly, loading and delivering them to multiple, widespread shelter locations within an acceptable time frame would be challenging given the limited number of delivery vehicles that they have available.
It is important to recognize, however, that a different organization might choose to make use of such a warehouse to open specific shelters, or even that the Red Cross may wish to do so in the future if the necessary resources become available. To explore the potential impacts that this might have, we set a lower bound constraint that gave Denver at least n trailer‐equivalent units of assets for distribution. This, in turn, made n more trailers available from the existing set of assets across the two‐state region. We tested a range of values from the optimal allocation of five trailers up to a total of twenty trailers. We did not compare changes in risk as these new trailer‐equivalent assets increase the total number of assets available in the model, thereby decreasing residual risk.
At the optimized allocation of five trailers worth of material being stored at the Denver warehouse, given in section 4, the model places only 20% of the newly freed assets in the Central chapter (including Denver and its adjacent counties); thus, the percentage of assets placed in the other chapters is 80%. This relative priority for distributing assets to other chapters remains above 50% as additional available capacity is added to the warehouse, until at least eighteen trailers worth of material is available. This indicates that once the warehouse in Denver is expanded in the model, even though it is located in the major population center, the additional assets would be allocated outside of the Central chapter to address the higher risk and corresponding greater need in those other locations. As the number of assets continues to grow, these higher risk areas eventually have their needs covered and the allocations start to shift back to the Central region to address the needs of the population located there. The non‐monotonic behavior of the changes in allocations due to increasing the warehouse capacity reflects the effect of the adjacent trailers, and the differing impacts of the trailers and caches. Because an adjacent trailer or a cache may be sufficient to address all of the risk in an outlying county, keeping a trailer in a lower risk location where it can have an impact on a number of adjacent counties might lead to more overall risk reduction than would allocating that trailer directly to the area with the greatest need.
The general question of whether or not to include large fixed storage assets, such as a warehouse, in asset pre‐positioning decisions depends on several factors. First, both the location and the size of these fixed assets determine how much of an effect there could be on disaster relief efforts. For example, a fixed asset located far away from the most at‐risk populations would add little value to the overall risk reduction. Second, there must be sufficient resources available to ensure the effective and efficient retrieval, loading, and delivery of supplies within a short period of time, so as to guarantee that relief efforts are not delayed by relying on the warehouse to be a source of immediately deployable assets.
As an alternative to utilizing a large warehouse for direct distribution of assets, it may also be possible for the organization to purchase an equivalent amount of additional assets in the form of additional trailers and caches. This would provide more overall flexibility than increasing the available capacity of a fixed warehouse location. With this in mind, the next part of the discussion explores this possibility.
New Asset Acquisition
From the perspective of the Red Cross, one of the broader goals of their participation in this research effort was to help them identify counties that would benefit from the purchase of additional assets once the organization's existing assets have been allocated as effectively as possible. Because the organization's resources are limited, such new assets (and particularly new trailers) are typically procured either through the process of writing grants or by entering into cost‐sharing agreements with specific counties. It can be a significant investment in time and effort to acquire this additional capacity.
To better understand the value associated with making such an investment, two new sets of models were run. In each set of models, the number of assets of one type (cache or trailer) was held constant at the current existing level, while the number of assets of the other type was increased, incrementally, by 1 to 10 units. For each new combination, all assets of both types were subject to reallocation across the entire region, using the risk‐based asset allocation model developed in section 4.
The test results show that risk decreases at a constant rate with the addition of new caches and at a slightly decreasing rate with additional trailers. In each case, a new trailer has nearly four times as much risk reduction as a new cache because of its additional impact on adjacent counties. If eight or fewer additional caches are purchased, then the new caches are simply added to the existing allocations; however, if 9 or 10 caches are available, then a large number of caches are relocated (the correlation between the new cache placements and the optimal allocations from section 4 drops to 0.5817) and a few trailers are also reallocated (the corresponding correlation reduces to 0.9375). In contrast, purchasing just one new trailer more causes changes to the existing asset allocations, resulting in the cache correlation immediately dropping to 0.7240 along with a trailer correlation of 0.9779. As additional trailers are added, the correlations for trailer placements remain relatively steady at 0.9581 or higher, but cache allocation correlations vary dramatically and drop as low as 0.5104.
The most significant outcome of this testing is the result that the more flexible approach of adding 5 to 10 additional trailers to the model actually provides greater overall risk reduction than does using the fixed‐location warehouse in Denver to provide an equivalent amount of assets. The improvement in risk reduction is only 0.05% for five trailers, but it increases to 12.16% when 10 additional trailers are added compared to utilizing the warehouse with 10 trailers’ equivalence of capacity. Furthermore, when the optimal allocations are examined in each of these instances, the number of trailers allocated to Denver decreases from five to four over this range. This indicates that if the organization wants to invest in additional assets to better support opening shelters, then using the warehouse as a location from which to distribute those assets will be suboptimal.
The overall implication of these results is that the placement of any additional assets, as they become available, should be based on identifying the locations for which those assets would provide the greatest overall impact on risk reduction and future relief efforts. This may be done by recognizing that different types of assets can have varying amounts of influence based on their size and relative mobility. Furthermore, our findings show that investing in additional assets that can be distributed across different locations can be more effective than simply expanding a fixed location, such as a warehouse, even though both options have the potential to reduce risk.
The benefit of distributing additional assets to higher risk locations can also be observed in the context of managing earmarked assets. The Red Cross’ asset portfolio, for example, includes several trailers that must be allocated to specific counties because those counties purchased, or helped to purchase, those specific assets. When the corresponding earmark constraints on the locations of these trailers are removed, however, each of the trailers is reallocated elsewhere by the model. Some of the originally earmarked locations end up with marginally more residual risk whereas others stay the same due to new coverage from caches and adjacent trailers. Over the span of the entire region, however, removing the earmarking constraints explicitly improves the total amount of risk reduction that can be achieved by an additional 1.38%. This clearly indicates the relative value associated with not fixing the location of specific assets if, indeed, an organization actually has the capacity to procure those assets on their own.
Seasonality
It can also be important to have the ability to move assets within or across regions because the likelihood of natural hazards occurring can vary depending on the time of year. With this in mind, we may consider extending the risk‐based asset allocation problem to a seasonally‐adjusted model, in which assets are reallocated periodically over the course of each year. In Colorado and Wyoming, the likelihoods of wildfires, floods, and tornadoes remain more or less the same for spring, summer, and fall, but in the winter the likelihood of wildfires or floods is reduced by about 50% and the likelihood of tornadoes is effectively reduced to zero. Similarly, the winter storm constraint does not apply in the summer, although such storms are possible during the other three seasons, particularly between October and May.
We look at adjusting the original risk‐based asset allocation model to incorporate these modifications into separate seasonal models. The resulting models for Spring and Fall, which include both full hazard likelihoods and the winter storm constraint, are identical, while the Winter model includes the reduced hazard likelihoods and the Summer model has the winter storm constraints removed. Upon solving each of the three different seasonal models for the Red Cross example, it was found that the final asset allocations were identical for the Spring/Fall model and the Winter model, and that the allocations in the Summer model had a correlation of 0.8594 with the other models. This implies that the summer is the only season for which assets might need to be reallocated within this region.
Although the Red Cross considered implementing a seasonal approach in which assets were reallocated at the beginning and end of summer each year, they ultimately determined that it would be too difficult to accomplish this effectively. The limited number of people available for this task and the excessive amount of time that it would take to relocate a large number of assets twice a year were simply prohibitive given the Red Cross’ current circumstances. Combined with the fact that the asset allocations are identical in three of the four seasons and are strongly correlated with the summer results, the organization decided to adopt the Spring/Fall model. This is the model that was presented in section 4.4.
In general, it is important to recognize that tradeoffs exist between the gains in risk reduction that can be achieved by periodically reallocating assets, and the time and effort required to do so. Furthermore, organizations might make different choices under different circumstances to more effectively manage possible hazard occurrences. If a particular winter experienced well below average snowfall, then this would decrease the likelihood of floods in the spring and summer and increase the corresponding likelihood of wildfires. These changes would alter the underlying risk values for a number of different locations, and a relief organization may actually want to implement a new optimal solution in response. Similarly, if the risk‐based asset allocation model were applied within a region that experiences large‐scale periodic hazards like typhoons, then the expected impacts might be estimated early enough to allow for re‐running the model and then reallocating large numbers of assets as necessary. If the resources are available to perform such reallocations, and the added benefits are significant enough, then each of these situations can be supported by making appropriate adjustments to the underlying allocation model, and then re‐running it as necessary.
Sensitivity of Key Parameters
In addition to considering opportunities for generalizing the application of a new model, it is also important to vary some of the key assumptions under which the original model was developed to test its robustness. Most of the data used in the initial implementation of the risk‐based asset allocation model was derived from government sources and based on scientific or analytic methods, but several of the model's key assumptions were derived from the existing expertise of the Red Cross. These values are subject to some degree of uncertainty and may not conform to the input from other disaster response experts and organizations. The two assumptions made in this model implementation that have the greatest potential to vary from the current values and impact the results are the relative weights of the assets and the sheltering needs percentages.
Asset Weights
In order to examine the impact of the relative weighting scheme for the different assets, we tested a series of combinations of different weights. The original basis for the relative weights was developed through discussions with the Red Cross, with a cache providing the baseline value, trailers set at three times the value of a cache, and adjacent trailers set at one half the value of one cache. Because the Red Cross will only reallocate trailers, and not caches, in response to an actual disaster event, adjacent caches were given a weight of zero. Ultimately, each of these weights is largely dependent on the organization for whom the model is being implemented, with no one set of weights deemed “correct” from an analytical perspective.
To test the sensitivity of the chosen set of weights and explore the impact of potential changes to them, we varied the relative weights on the trailers and adjacent trailers while holding the cache weight at a constant value of one. The corresponding values tested for the trailer weights were 2, 3, 4, 5, and 6, and for the adjacent trailer weights the values were 1/4, 1/3, 1/2, 2/3, and 1. We then optimized the asset allocation model under each possible combination of these values, using the nonlinear exposure function presented in Equation (A2). The resulting mean difference in residual risk across all scenarios was 0.50%, with a standard deviation of 2.69% and a range from −3.46% to 5.25%. The correlation of asset placement across these 24 scenarios was 0.3277 for trailers, 0.8312 for caches, and 0.9126 for adjacent trailers. The results show that the differences in the relative weight for trailers causes the trailer placements to vary significantly and, yet, the high correlation of the adjacent trailer allocations implies that most of these trailer reallocations are taking place within specific chapters or geographic sub‐areas in the region.
These results also indicate that while the change in relative weights has an impact on the residual risk, the corresponding change in performance is typically small. Importantly, undervaluing the weight of trailers relative to caches has the greatest negative impact on risk reduction, but the relationship between trailers and adjacent trailers is also very important to monitor as the extreme values in both ranges taken together can have substantial impact.
As an additional consideration, we also addressed the possibility that the organization might actually want to consider reallocating caches to adjacent counties, as well as trailers, to help with opening shelters immediately upon the occurrence of a disaster. Setting the weight of an adjacent cache to be 1/6th that of a cache (to echo the corresponding values for trailers) increases the overall risk reduction in the original model from 81.13% to 85.22%. It does so, at least in part, by allowing the optimization routine to more precisely target the smaller values of residual risk in individual counties without the potential inefficiency of allocating a full cache or trailer. The resulting correlation between the final asset allocations in the two models is 0.9194, which indicates that incorporating the adjacent caches doesn't change the actual positioning of the caches and trailers too dramatically.
While it can be tempting to continuously fine‐tune the relative weights of different types of assets, the potential for strong correlations between optimal allocations when small changes are made is high and the pursuit of the “perfect” set of weights may require more effort than it does benefit. In addition, our findings show that undervaluing larger and/or mobile assets leads to less efficient allocations. This implies that in the absence of more specific information, slightly overvaluing mobile assets instead of undervaluing them would be a good heuristic for providing more vertically equitable solutions. Recognizing that there are differences in the relative values of different types of assets, particularly given the potential for mobile assets to be utilized in adjacent areas, is extremely important for appropriately characterizing risk reduction and achieving subsequent improvements in relief efforts.
The relative weights of assets can be based, at least in part, on those assets’ respective size and mobility; however, other parameters could have a less clear basis for generating initial estimates. The sheltering needs percentage is one such parameter that was included in the Red Cross’ asset allocation model. The following discussion provides a closer look at the derivation of this particular parameter and the validity of the assumptions that were made with respect to it.
Sheltering Needs
The sheltering needs factor was incorporated into the original model based directly on discussions with the Red Cross. They explicitly stated that the percentage of an evacuated or impacted population in a county that is expected to stay in the shelters is not 100%, with the actual percentage varying among counties. The values that we subsequently utilized to generate results for the Red Cross example were based on discussions with the disaster program managers for each chapter; these are the employees responsible for developing the shelter plans. The actual values provided by the managers ranged from 2% to 50%, with an average of around 11%. Lower values for the sheltering needs factor were more prominent in less populated counties and higher values were more prominent in more densely populated counties.
Previous research on shelter expectancy is scant, but the Federal Emergency Management Agency's Emergency Management Institute has an on‐line Fundamentals of Emergency Management course (FEMA 2016) that discusses sheltering expectancy with references to studies on this topic. In particular, Mileti et al. (1992) found that shelter expectancy averages 14.7% of the evacuated population, with a range from 5% to 20%. The values provided by the Red Cross for our particular problem have a lower average, but a much greater range, than this previous research indicates.
Because the Red Cross values are based to a great extent on historical behavioral differences over time between populations in rural and urban counties, we believe that they are a reasonable representation of the expected sheltering needs across the region. In general, however, it is important to recognize that such factors could potentially be susceptible to bias, whether conscious or unconscious, since assigning a lower value to a given county can result in fewer assets being allocated there. To test the impact of different sheltering needs values, therefore, we considered two alternative scenarios using the Mileti et al. (1992) findings to compare with the original model. In the first alternative scenario, the sheltering needs value in each county was set to a constant 14.7%. In the second alternative scenario, the values in each county were linearly rescaled to vary from 5% to 20%, increasing the values at the lower end of the range and decreasing the values at the upper end. Table 3 compares the results of the three models.
Comparison of Sheltering Needs Estimates
Changing the sheltering needs estimate also adjusts the original risk values from which the reductions are calculated, increasing the current risk by 17.8% for the constant sheltering needs scenario and decreasing it by 11% for the rescaled sheltering needs scenario. The average risk reduction values in Table 3 are relative to these adjusted initial risk values. The rescaled sheltering needs model improves the average risk reduction over that of the original Red Cross model, including slight decreases in counties without assets, while the constant percentage model generally performs less optimally, leaving many fewer counties with full coverage. The better performance of the model with the rescaled sheltering needs factor implies that having more precise information about the relative needs in each individual county can improve the effectiveness of the allocations, as expected. At the same time, however, the allocations generated by the two new scenarios are highly correlated with the optimal allocation of the original model. This serves to validate that the Red Cross’ specified sheltering needs values are reasonable alternatives to the values suggested by Mileti et al. (1992).
The results given in Table 3 imply that if expert opinion is unavailable, and there is insufficient historical data to be had, then a constant sheltering needs factor across all locations, such as that provided by Mileti et al. (1992) may still provide a reasonable outcome. More generally, however, the results indicate that even high‐level estimates of the differences in behaviors among locations can help to significantly improve the quality of the solution. This implies that even if an organization does not have access to a detailed model, it may still be able to improve the effectiveness of its pre‐positioning efforts simply by leveraging whatever knowledge it may have about the expected differences between the sheltering needs of different locations.
Conclusions
This research effort develops a new approach for allocating assets to prepare for multiple possible disaster events within a given region. The main contribution of the work is the introduction of a new risk‐based objective function formulation that uses the likelihood of different hazards, the exposure of the population to those hazards, and the underlying vulnerability of the population to determine the extent to which resource allocations can reduce disaster risk on a location‐by‐location basis. This objective function helps to ensure that such allocations will be made equitably because they are based on addressing risk and not simply on demand. In particular, the objective function will improve vertical equity because if two populations have the same hazard likelihood and level of exposure, then the more vulnerable population will be assigned more resources to offset its increased risk.
The risk‐based asset allocation approach also allows for quantifying the extended value of mobile assets, in terms of the effect that they can have on offsetting risk in adjacent locations. Pre‐positioning often takes place well before a disaster event occurs, and having the ability to identify the locations from which such assets can be reallocated most effectively provides important flexibility. Our analysis above shows that by appropriately weighting the potential contributions of these mobile assets in nearby locations, the lower‐risk areas can have their needs covered by adjacent assets and more direct relief can be provided to the more vulnerable and higher risk locations. The analysis also provides the insight that investing in additional mobile assets is likely to be more effective than simply expanding the capacity of a fixed location because such investment allows for targeting the higher risk locations more precisely. Furthermore, even though the Red Cross’ model only redistributes assets as a secondary option, the ability to assign a different value to movable assets should allow the general approach to be applied to other types of relief distribution problems as well.
Along with its theoretical contributions, this research effort also addresses recent editorial calls for empirically grounded, real‐world applications in the area of humanitarian disaster logistics (Pedraza‐Martinez and Van Wassenhove 2016, Starr and Van Wassenhove 2014). The project was initiated in collaboration with the American Red Cross in Colorado and Wyoming and is grounded in empirical data about the setting and the underlying process, resulting in a model that has real‐world applications and real potential to impact future disaster relief efforts. Working closely with the Red Cross allowed the project team to derive a number of important practical insights, including the need to support earmarking and the existence of tradeoffs between the costs and benefits of periodically reallocating assets. Overall, the Red Cross’ involvement in the effort lasted more than a year and the process of model development involved a number of iterations and refinements based on the organization's feedback.
The risk‐based asset allocation model was initially motivated by the specific needs of the Red Cross, but the modeling formulation as presented is general enough to be applied to other disaster and humanitarian relief contexts in which risk and/or the mobility of assets may play an important role. The approach could be useful to agencies such as the U.S. Forest Service and CAL FIRE who frequently pre‐position mobile cache vans to support establishing different bases of operations for fighting forest fires in the Western United States (California Wildland Fire Coordinating Group 2016, NICC 2018), or to organizations like the New York State Office of Health Emergency Preparedness who pre‐position medical emergency response caches to help mitigate the spread of infectious diseases such as anthrax (Committee on Prepositioned Medical Countermeasures for the Public 2012). The risk‐based formulation of the objective function, in particular, can be adapted to a wide variety of different problems in which a vulnerable population is exposed to a hazard and in which the impacts of that hazard on the population can be mitigated through the appropriate and equitable allocation of different assets. If detailed data about vulnerability is not available, or if the exposed population is considered to have a fixed level of vulnerability, then the original risk function could be replaced with one that simply combines the hazard likelihood with a generalized measure of the hazard's impact. Alternatively, if there are different types of vulnerability or exposure that need to be planned for, such as subpopulations with chronic health conditions or with specific dietary needs, then the risk function could be further differentiated to allow for incorporating different levels and types of demand at each location.
There are several other factors that provide support for extending the modeling approach presented above. First, the set of hazards considered can be adjusted to include those that are most likely to cause sheltering or relief activities in a particular region of interest. For example, along the southeastern coast of the United States or along the Gulf Coast of Mexico, the relevant natural hazards might include hurricanes but exclude winter storms. Second, if the region under consideration is within the United States, then the data necessary to calculate the SoVI factor is available from the U.S. Census Bureau and the hazard likelihood data is available from each state. Such data may not be as easy to access outside of the U.S., however social vulnerability data (e.g., Guillard‐Goncąlves et al. 2015, Hummell et al. 2016) and hazards data (e.g., EMSINA 2018, NDRRMC 2018) is also available for other regions. Finally, the exposure function, which is crucial for applying the model effectively, is relatively straightforward to adapt to different situations. As illustrated in Appendix A, a new exposure function can be developed by using regression to characterize and incorporate an organization's historical allocation behavior into a series of exposure classes. The resulting function can then easily be fine‐tuned by adjusting the parameters to fit the details of a new situation.
One of the limitations of the risk‐based asset allocation model is that it assumes all types of assets will address exposure in exactly the same way, even if the actual amount of exposure that each one addresses varies. This allows the model to use a linear combination of the number of units of each asset type to calculate the total amount of coverage available in a given location. To apply the model to situations in which functionally different types of assets are used to address different needs, the structure of the exposure function will need to be adjusted so that it can take more than one type of exposure into consideration at the same time.
Another limitation of the underlying allocation model is that it assumes a constant weight for all adjacent assets of each type, regardless of the hazard or location being considered. Considering the problem from a practical standpoint, however, there may be only limited routes between certain locations and these routes may be susceptible to damage during specific types of disaster events. Some locations may be more effective at redistributing assets than other locations, based on their relative accessibility, and a good opportunity for future research would be to look at extending the model to define multiple levels of adjacency when quantifying the contributions of adjacent assets.
In summary, although the new modeling approach was originally developed to help the Red Cross solve their current asset allocation problem, it has broader real‐world implications for improving disaster relief efforts in the future, for the Red Cross as well as for other relief organizations. Not only will it allow for more accurately pre‐positioning assets to reduce immediate suffering, but it will also save time and resources that could then be put toward other aspects of disaster response and relief operations. The Red Cross would like to continue developing and expanding this work in the future, taking into account the larger supply chain within which the region operates, as well as other considerations such as assignment of volunteers. However, they see this initial effort as a significant improvement of the most important task that they perform: locating relief assets in the right place to be deployed as quickly as possible.
Footnotes
Exposure function
Optimization Model
Acknowledgments
We thank the editors and three anonymous reviewers for their insightful feedback during this process, and the Fralin Life Science Institute at Virginia Tech for their additional support. This project would not have been possible without the participation of members of the Red Cross of Colorado and Wyoming, and we are grateful for their cooperation.