
Abstract
Related to several efforts by governments to attain United Nations Sustainable Development Goals, subsidy vouchers are used to provide monetary support to income‐eligible (IE) families who cannot afford child care. However, IE families are often unable to accept an offered voucher due to an inadequate supply of voucher‐accepting child care providers that best suit their needs. Child Care Resource and Referral agencies (CCR&Rs), which administer these programs, can influence the family's propensity to accept a voucher by investing funds both in outreach to increase the number of voucher‐accepting providers in each region, and in provider services to improve the service delivery to families. This study analyzes how a CCR&R should allocate its limited funds between these two types of activities to ensure equitable access to child care across the different regions of its service area. We show that it might be optimal for the CCR&R to invest more funds in outreach in the region with a lower proportion of IE families. This is especially true when: the external considerations (e.g., public transportation and infrastructure) in that region have a greater impact on a family's acceptance propensity; the marginal return of investment in outreach in that region is higher and abundant funds are available; the socioeconomic distress experienced by families in that region is significantly higher; or a large amount of funds is earmarked for outreach in that region. We contextualize our study for a CCR&R in Massachusetts and conclude that the proposed investment decisions can improve equity outcomes by 7.0%.
Keywords
Introduction
Child care is an important intervention for early childhood development, and provides valuable support to families with young children (Richter et al. 2017). Access to child care is considered critical to achieving a better and more sustainable future for all. As such, access to high‐quality child care directly affects the indicators of several United Nations Sustainable Development Goals (UN SDGs), which were adopted as “a universal call to action to end poverty, save the planet and improve the lives and prospects of everyone, everywhere." These goals include no poverty (SDG #1), quality education (SDG #4), gender equality (SDG #5), and reduced inequalities (SDG #10), among others. Past research has shown that providing access to high‐quality child care can help improve the long‐term outcomes of children from economically disadvantaged backgrounds. These outcomes include educational attainment, earning capacity, and reduced anxiety and depression (Barnett and Masse 2007, Herbst 2017). Furthermore, increasing the accessibility of child care helps parents in low‐income families maintain employment or attend school, which in turn helps them break the cycle of poverty and contribute to the economy (Hartmann et al. 2003). It also reduces barriers to work for mothers, who disproportionately leave the workforce when their families cannot find or afford child care (Parker 2015). The combination of these life‐altering benefits clearly indicates that access to affordable child care is a key enabler for the SDGs mentioned above.
While access to child care has these far‐reaching positive effects on children, families, and society, it is prohibitively expensive throughout the United States (U.S.). On average, families in the U.S. spend $10,000 per year on child care, which forms a substantial portion (e.g., as high as 60%) of their annual income (as reported by the Child Care Aware of America; CCAoA 2018). Also, on average, a family's child care expenses are 40% higher than the affordability threshold defined by the Department of Health and Human Services (CCAoA 2018). Among the member countries of the Organisation for Economic Cooperation and Development, the U.S. is the least affordable nation for child care for low‐income families, as measured by the percentage of family income (OECD 2018). Unable to access affordable child care, approximately two million parents in the U.S. are forced to make career sacrifices every year (Schochet and Malik 2017). Furthermore, CCAoA (2018) reports that the U.S. economy loses $28.9 billion in wages annually because low‐income families do not have access to affordable child care. Given these repercussions, unaffordable child care is considered not only a humanitarian crisis but also an economic crisis (Covert 2019, UNICEF 2020).
Child Care Subsidy Voucher Programs in the U.S.
To help people balance the demands of work, school, and parenting, the federal and state governments in the U.S. provide support to income‐eligible (IE) families through child care subsidy programs. 1 Moreover, child care subsidy voucher programs constitute the most significant proportion of the entire portfolio of the country's child care subsidy schemes (Schumacher et al. 2003). Overall, federal and state entities spend more than $20 billion annually on child care subsidy funding, providing 90% of it to voucher programs for IE families. This subsidization results in the provision of care to over 1.4 million children monthly (Rachidi 2017). Under these subsidy voucher programs, IE families have the freedom to choose any voucher‐accepting child care provider based on factors such as family structure, location, and other considerations. The voucher essentially assures a fixed amount of monetary support from the government to subsidize the fees at the voucher‐accepting child care provider.
For the administration and management of day‐to‐day operations of child care subsidy voucher programs, almost all the state governments in the U.S. (specifically, 47 states and the District of Columbia) partner with Child Care Resource and Referral agencies (CCR&Rs). These agencies are state‐funded not‐for‐profit organizations tasked with providing services to IE families and child care providers in their designated areas. A typical CCR&R provides the following services: adding families that are in need of subsidized child care to a centralized wait list; completing paperwork for families that are issued subsidy vouchers; increasing the supply of child care providers; supporting providers to ensure high quality of care; and collecting, analyzing, and disseminating child care data, among others. A CCR&R offers an available voucher to IE families on the wait list on a first‐come first‐served (FCFS) basis. Our study takes the perspective of a CCR&R and considers how the operational actions it takes (in the form of resource allocation decisions) affect societal outcomes of the child care subsidy voucher program in its service area.
Problem Description and Research Questions
Several practitioner reports emphasize the need to address the low quantity and low quality of voucher‐accepting providers in order to ensure that eligible families are able to access subsidized child care (Pilarz et al. 2016, Ullrich et al. 2019). Within the context of these supply‐related concerns, the fact that IE families are often unable to accept offered vouchers is noteworthy (CCAoA 2018). Two principal factors cause this inability to accept vouchers. First, a low number of voucher‐accepting providers that best suit IE families’ practical needs lead to a low propensity of IE families accepting the offered vouchers. For instance, some providers may not operate during nontraditional hours, despite the high level of need for child care during such hours within IE families (Anderson et al. 2005). Also, immigrant IE families without cars are less likely to enroll at providers outside their neighborhoods (Greenberg et al. 2016). Second, research has found that, since continuity and stability of child care are important factors for IE families, they often decline subsidy vouchers due to potential administrative hassles or errors (Isaacs et al. 2016, Speirs et al. 2015). For instance, Isaacs et al. (2016) state that a reduction of hassles faced by IE families at child care providers can significantly increase the chances that eligible families are able to accept offered vouchers.
Unable to accept the offered subsidy vouchers, such IE families continue to bear an avoidable financial burden. This burden could take the form of having to give up a job or drop out of school, using savings or retirement funds, or borrowing money at high‐interest rates to cover child care (Banerjee et al. 2017, Marshall et al. 2013). Furthermore, Malik et al. (2018) report a 3% lower maternal labor force participation in areas that have an insufficient number of voucher‐accepting providers, because mothers who would otherwise be able to accept and use vouchers cannot re‐enter the workforce. These studies underscore how IE families’ inability to accept available vouchers adversely impacts society by exacerbating economic and gender inequalities.
To reduce these negative impacts on IE families and society, CCR&Rs undertake two types of supply‐enhancing activities: outreach and provider services. As part of outreach, CCR&Rs invest funds in various activities to increase the number of voucher‐accepting providers across different regions of their service areas. The rationale of this approach is that the greater the number of voucher‐accepting child care providers in a specific region, the more likely an IE family in that region will have access to a provider that suits their needs. The outreach activities can include identifying and collaborating with local stakeholders, creating public–private partnerships that stimulate local provider participation in subsidy voucher programs, and organizing events to inspire corporate voices to speak up for promoting voucher acceptance among local providers.
As part of provider services, CCR&Rs dedicate funds to reduce several potential administrative and ancillary challenges that may prohibit parents from using a subsidy voucher at voucher‐accepting providers. CCR&Rs can signal and ensure better delivery of child care at voucher‐accepting providers in their areas by offering several provider services (Pilarz 2018). These services can include the following: assisting providers with accreditation and quality improvement programs; conducting centralized training sessions for providers on health and safety, child development, and effective business practices; creating professional development opportunities for providers’ workforce; and purchasing technological or software tools to streamline administrative processes such as reimbursements. Although these provider services require a significant upfront investment, they potentially benefit all the affiliated providers at a negligible additional investment. For instance, developing an online information repository, organizing webinars by industry experts on quality improvements, or purchasing a software package to automate exchange of information with providers will require a significant amount of investment by a CCR&R; however, this support will significantly improve service delivery at all providers in its area (see IDHS 2017). So, while the investment in provider services is typically made at a service area level (unlike the regional outreach investment), its positive benefits accrue across all regions in the area.
However, as with most nonprofit organizations (NPOs), CCR&Rs have a limited amount of funds to allocate to these two types of activities. The levels of investments dedicated to regional outreach and provider services activities influence the supply (in terms of quantity and quality) of voucher‐accepting providers, which leads to disparities in access to subsidized child care for the IE families residing in different regions of the service areas (Chaudry et al. 2011, Pilarz et al. 2016). For example, within the Western Massachusetts service area, the ratio of the number of voucher‐accepting child care providers to the number of children on the wait list differs greatly across different regions, with Hampshire County having the highest ratio (0.28) and Western Worcester having the lowest ratio (0.08). Furthermore, research finds that residents and businesses in certain localities (e.g., ones with higher educational levels, stronger shared identities, or close‐knit communities) are more pro‐social and, thus, are more likely to help in community projects (Bierhoff 2005, Putnam 2001). As a result, the marginal benefit of funds invested in outreach in those localities may be higher than in other localities. Moreover, there are region‐based differences in the socioeconomic burden of distress faced by IE families when they are unable to accept offered subsidy vouchers. For example, Smith and Adams (2013) find that families in rural regions face more challenges and pay more when making child care arrangements than their urban counterparts.
Equity or fairness is a measure that reflects the notion that “rewards, punishments, and resources should be distributed according to a combination of different criteria: merit, need, equality, and procedural" (Leventhal 1980). Ideally, a CCR&R will split its budget to offer provider services in its service area and to conduct outreach in the regions within the service area, such that an IE family in any region can accept the offered voucher to access subsidized child care (see, e.g., the CDBG Act of 2014 and the report by National League of Cities 2017). However, as noted above, families are often unable to accept offered vouchers, and the probability of acceptance may differ from one region to the other. This leads to disparities in the distress experienced by IE families across different regions when they are unable to accept offered subsidy vouchers. Thus, from an equity perspective, the allocation of the CCR&R's funds for provider services and outreach should minimize this inequity in the distress experienced by IE families. The presence of various regional asymmetries—including transportation infrastructure and regulatory environment, marginal return of outreach investment, and distress experienced by families—complicates the allocation decisions, and it becomes important to answer the following research questions: (i) What are the optimal levels of investment by a CCR&R toward outreach and provider services activities that minimize the inequitable societal burden across different regions of its service area?; and (ii) How is this optimal allocation affected by activity‐ and region‐specific characteristics?
Summary of Main Findings
This study provides answers to these research questions by developing an analytical model that incorporates details of the subsidy voucher offer process, and that captures the challenges faced by a CCR&R when allocating funds for its outreach and provider services activities. To capture the influence of scarce funds and region‐specific differences, we consider that the CCR&R has a fixed amount of funds and its service area comprises two types of regions. We develop a measure of the inequity in distress between the two regions of its service area. To do so, we relate the propensity of acceptance/rejection of the available subsidy voucher by IE families residing in each of those regions with various region‐based asymmetries. With this equity‐based objective, we solve the CCR&R's optimization problem to obtain the optimal levels of investment that minimize inequity, and analyze the impact of activity‐ and region‐specific differences on the optimal investment decisions.
We show that, when the marginal return of provider services investment is higher (lower) than the marginal return of outreach investment, the CCR&R should invest more (less) in provider services than in outreach. While, in general, investing more funds in outreach in regions with more IE families is optimal, this may not be the case when regional asymmetries are incorporated in the fund allocation problem. Specifically, a CCR&R should invest more funds in outreach in a region with a relatively lower proportion of IE families in the following situations: (i) when the external considerations (those exogenous to the CCR&R) in that region have a greater impact on the IE family's propensity of acceptance, (ii) when the marginal return of outreach investment in that region is higher, and abundant funds are available, or (iii) when the distress faced by IE families in that region is significantly higher.
We also extend our model and analysis to understand the impact of the infusion of additional funds earmarked for outreach in one region. The related analysis shows that a substantially large amount of such earmarked funds may crowd out a CCR&R's investment in outreach in the non‐earmarked region, irrespective of the relative proportion of the IE families in each region. Furthermore, we contextualize these insights within a practical setting using a case study of a service area in Massachusetts. Through this real‐world application of our model, we conclude that the proposed investment decisions can improve equity outcomes by approximately 7.0%. Notably, this estimated value of the improvement in equity outcomes is directly related to the SDG Indicator 4.2, which includes reducing inequity in “access to quality early childhood development, care, and pre‐primary education" for rural versus urban recipients (SDG 2017).
The remainder of the paper is organized as follows: Section 2 presents a review of the related literature. Section 3 describes the model of a CCR&R's resource allocation problem. The results are discussed in Section 4. Section 5 presents a case study based on a real‐world example of the CCR&R that operates in Western Massachusetts. Finally, Section 6 concludes the paper by summarizing our study and providing directions for future research.
Literature Review
There is a growing interest within the field of operations management (OM) to study various aspects of socially responsible operations (Besiou and Van Wassenhove 2015, Lee and Tang 2017). Our paper contributes to this emerging line of inquiry along three dimensions: outcome improvement in education and child care programs; resource allocation by NPOs; and supply‐side decisions in socially responsible operations.
Similarly, within the context of child care subsidy programs in the U.S., several reports by government agencies and media organizations have emphasized the importance of increasing the number of voucher‐accepting providers, better allocating limited funds for more outreach across different regions, and enhancing the participation of low‐income families, all to reduce the societal burden resulting from inequitable access to subsidized child care (DHHS 2016, Keith 2019, Williams 2020). In their review of the gap between practitioner needs and academic publications, Besiou and Van Wassenhove (2020) find that OM researchers have not paid much attention to the operational aspects of voucher programs. To the best of our knowledge, ours is the first study to analyze the impact of operational decisions on equity outcomes within subsidy voucher programs. Given resource constraints and region‐specific differences in contextual parameters, such operational decisions constitute a resource allocation problem for CCR&Rs.
In the context of child care subsidy voucher programs, while the demand for vouchers is known in the form of data collected by the government agencies, an IE family's acceptance of the available voucher can be influenced by investments of resources in supply‐side activities. Thus, we focus on the following distinguishing element of child care subsidy voucher programs: since some low‐income families cannot accept the vouchers offered to them (due to inadequate quantity and quality of the supply base), CCR&Rs can significantly reduce socioeconomic burdens through the investments in provider services and outreach activities.
Most NPOs depend on altruistic donations for their supplies of products or services, which leads to several limitations and challenges for NPOs when attempting to enhance their levels of supply (e.g., as studied in Arora and Subramanian 2019, Mehrotra and Natarajan 2020, Solak et al. 2018). With the exception of a study by Mehrotra and Natarajan (2020), most related studies in this stream do not consider other socially beneficial activities undertaken by NPOs, such as community outreach and partner development, to enlarge their supply of critical products or services. Mehrotra and Natarajan (2020) study the monetary incentive design problem of a healthcare provider in a developing country that has the goals of improving its delivery of services and encouraging more patients to seek care. Whereas, in the supply‐side decision problem considered in our setting, CCR&Rs need to allocate their limited financial funds between outreach and provider services activities (instead of offering monetary incentives) to increase the quantity and quality of service delivered to IE families in their service areas.
Overall, the review of the literature above underscores the importance of studying the supply‐enhancing investment decisions of CCR&Rs to improve outcomes for low‐income families and to benefit society. The scarcity of resources and the increased pressure to reach SDGs make a focus on examining the operations of humanitarian and nonprofit organizations necessary and timely (Besiou and Van Wassenhove 2020). In recent years, OM scholars have studied the equity outcomes of humanitarian aid delivery models (Ferrer et al. 2018, Gralla et al. 2014). While these studies focus on resource allocation problems within natural disaster settings, our study considers the resource allocation problem (and the salient trade‐offs) in child care subsidy voucher programs. Moreover, even though our study is motivated by a problem in a developed country, the regional asymmetries considered play similar roles in other voucher programs in developed and developing countries alike (Hatt et al. 2010, Ir et al. 2010). Therefore, this study sheds light on how the optimal allocation of funds across supply‐side activities can reduce inequitable access to subsidized services across different regions in a wide variety of pro‐social settings (see discussion in Section 6).
Model
In this section, we present our model of a CCR&R's allocation of funds between provider services and outreach activities in its designated service area. For these supply‐enhancing activities, the CCR&R has limited funds, denoted by F > 0. Next, we describe the key elements of the model in detail. (Table A1 in the appendix summarizes the key notation of this study.)
Region‐ and Activity‐specific Elements of Model


Progression of a Voucher Offered by the CCR&R to IE Families in Different Regions


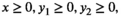
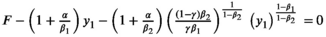
A function of the form of the Cobb–Douglas function,


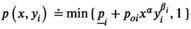


The CCR&R's Resource Allocation Problem
The CCR&R operates under the state mandate that allows it to go down the wait list on a FCFS basis until an IE family accepts an available subsidy voucher (MEEC 2019). This implies that one of the IE families on the list is able to access child care using the available voucher. In that regard, any feasible distribution of funds among its supply‐enhancing activities will generate a positive societal outcome (since the acceptance probability increases in x and


According to the World Health Organization, the term inequity refers to “avoidable or remediable differences among groups of people, whether those groups are defined socially, economically, demographically, or geographically" (WHO 2020). In our context, these differences arise when, because of CCR&R's levels of investments in each activity, an IE family in a given region is unable to accept an offered subsidy voucher. As per government regulations (the CDBG Act of 2014 and the CCDF Ruling 45 CFR 98.46(b) on September 30, 2016) and based on our interviews with experts in the field of child care subsidy voucher programs, the CCR&R must make operational decisions that ensure equitable access to affordable child care in different regions of its service areas. Moreover, several reports have underscored the need to address inequitable access to affordable child care across different parts of the nation (e.g., Malik et al. 2018).
Thus, the CCR&R should allocate its limited funds between x,


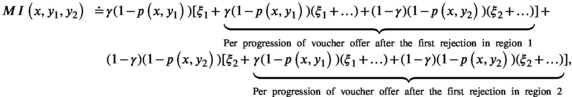

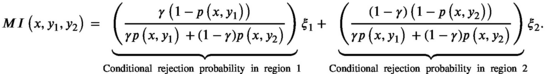
The terms within parentheses in Equation (1) capture the probability that an IE family in region i is unable to accept the offered voucher conditioned on the voucher being eventually accepted by an IE family in one of the regions. This implies that the expression for


In the next section, we analyze the CCR&R's optimal levels of investments in each activity, and investigate the effect of contextual parameters on these optimal decisions. Proofs of the main analytical results are presented in Appendix B. Also, additional technical details are available in the online companion. Throughout the rest of the paper, the analysis is restricted to those combinations of parameters that ensure the probability


Results
Proposition 1 shows the effects of activity‐specific characteristics on the CCR&R's optimal levels of investment in each activity. To highlight the relative role of provider services and outreach elasticities in the allocation decision, we initially consider situations with no regional differences (specifically,


The CCR&R's optimal levels of investment for 0 < α < 1 and 0 < β < 1 are:

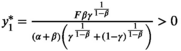
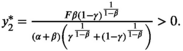


The analytical finding in Proposition 1 that the inequity‐minimizing split of funds depends on the relative magnitude of marginal returns is in line with the general view of the extant OM literature. As such, in practical terms, this finding is useful for NPOs that aim toward generating societal impact in resource‐constrained environments, a conclusion also noted by McCoy and Lee (2014) and Kotsi et al. (2019) in their baseline analyses of optimal investment decisions by NPOs. In our context, it is particularly important because most CCR&Rs neglect outreach activities in the presence of scarcity of resources (CCAoA 2018, p. 22). Proposition 1 shows that when α < β, it is optimal for the CCR&R to invest less in provider services than the total investment in outreach in regions 1 and 2. Moreover, when the provider services elasticity is below a threshold (

We next analyze the effects of various region‐based asymmetries on the CCR&R's optimal levels of investments—specifically, we consider region‐based asymmetries in: external environmental factors (Section 4.1); outreach elasticity (Section 4.2); IE family's distress (Section 4.3); and earmarking of funds for outreach in a region (Section 4.4). To simplify exposition and understand the pure effect of each asymmetry, we present our analytical findings by introducing one asymmetry in each subsection (with other factors considered to be symmetric). We later show in Section 5 that similar insights hold for a general setting.
Effect of Region‐based Asymmetry in External Environmental Factors
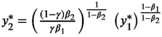
In this subsection, we study how differences in the external environmental factors in regions 1 and 2 (captured by the relative external environmental factor


Define


Proposition 2(i) shows that as


Also, in situations when


Furthermore, based on expressions for optimal outreach investments, we obtain that the optimal balancing ratio of the CCR&R's investments in outreach activities, that is,


Effect of Region‐based Asymmetry in Outreach Elasticity
In this subsection, we analyze the effect of asymmetry in outreach elasticities on the CCR&R's optimal investments. Our analysis reveals that, when

When the outreach elasticity is different for different regions, there exists a unique allocation strategy


Proposition 3 shows that, when the total amount of available funds increases (i.e., F increases), the CCR&R should increase its investment in outreach in the region with the higher outreach elasticity relative to the outreach investment in the other region. In contrast, when the provider services elasticity is high (i.e., α is large), it becomes optimal for the CCR&R to raise its investment in outreach in the region with the lower outreach elasticity relative to the region with the higher outreach elasticity. This is because, for a large α, the joint impact of investments in provider services and outreach activities on a family's acceptance probability would be higher when the levels of each investment are higher. This implies that the CCR&R would be able to overcome the adverse impact of smaller outreach elasticity in the region by investing more funds in outreach (in relative terms) in that region, when its provider services elasticity is high.
Another implication of asymmetry in outreach elasticities is that, under certain conditions, it may be optimal for the CCR&R to invest more funds in outreach activity in the region with a lower proportion of IE families. Specifically, when the CCR&R has a sufficiently high amount of funds (F), it should invest more funds in outreach in the region with a higher outreach elasticity, even when a higher proportion of IE families resides in the other region. 7 This finding can be explained as follows: When the CCR&R has an abundance of resources, the effect of higher marginal returns of investment in outreach is more dominant in reducing the overall inequity as compared to the effect of having a higher proportion of IE families (since F is large). As a result, in such scenarios, it is beneficial to invest more funds toward outreach in a region with a higher marginal return than in a region with a higher proportion of IE families.
Effect of Region‐based Asymmetry in the IE Family's Distress
In this section, we study the impact of asymmetry on the socioeconomic burden of the distress experienced by IE families in regions 1 and 2. Without loss of generality, we consider the situations in which

Consider α = β = 1/2, γ = 1/2,


Proposition 4 shows that a relative increase in the distress experienced by families in a particular region makes it optimal for the CCR&R to increase its investment in outreach in that region. This allows the CCR&R to increase the propensity of an IE family in such a region to accept an offered voucher, and, as a result, to minimize the adverse impact on the families in that region and on society. This finding also implies that, when the regional disparity in distress is large, it may be optimal for the CCR&R to allocate more funds to outreach in the region with the relatively higher socioeconomic burden of distress, even when the proportion of IE families in that region is lower. Consider that the majority of IE families reside in region 1. Then, per Proposition 4, it may be optimal for the CCR&R to invest a relatively higher amount of funds in outreach in region 2 as compared to region 1 when


Furthermore, we find that such a scenario (i.e.,


Effect of Region‐based Earmarking of Funds for Outreach Activity
In most humanitarian and nonprofit settings, additional funds that are made available by a donor agency may be earmarked for investment in a specific activity only (Pedraza‐Martinez et al. 2020). In our context, the CCR&R may receive funds that can only be invested in outreach in a certain region (Keith 2019). Without loss of generality, we consider the case in which the CCR&R receives δ>0 additional funds to invest exclusively in outreach in region 1. Accordingly, the CCR&R's resource allocation problem described in Section 3 can be modified by replacing the previous resource constraint (in Equation (3)) with the following two constraints:


Suppose δ > 0 units of additional funds are earmarked for outreach in region 1. Then, there exists a unique threshold


When the amount of earmarked funds is below the threshold


Another implication of the availability of the earmarked funds is that, when the amount of earmarked funds is substantially large, the CCR&R's optimal investment in outreach in the non‐earmarked region reduces. The intuition behind this implication is as follows: Recall that large amounts of investment in provider services and outreach in a region will lead to a significant improvement in the propensity of IE families to accept offered vouchers. As a result, with large amounts of earmarked funds for one region, the CCR&R can reduce the inequity outcomes in its area by increasing investment in provider services, even at the expense of investment in outreach in the other region. Thus, while additional funds always help reduce inequity outcomes, the funds earmarked for outreach in one region may crowd out the investment in outreach in the non‐earmarked region. This finding on the unintended consequences of earmarked funds is consistent with findings in the existing literature on counter‐productive effects of earmarked funds (Arora et al. 2020, Besiou et al. 2014). For instance, Besiou et al. (2014) show that earmarked funds for use in a specific zone can decrease the fleet size available for disaster response in the other zones.
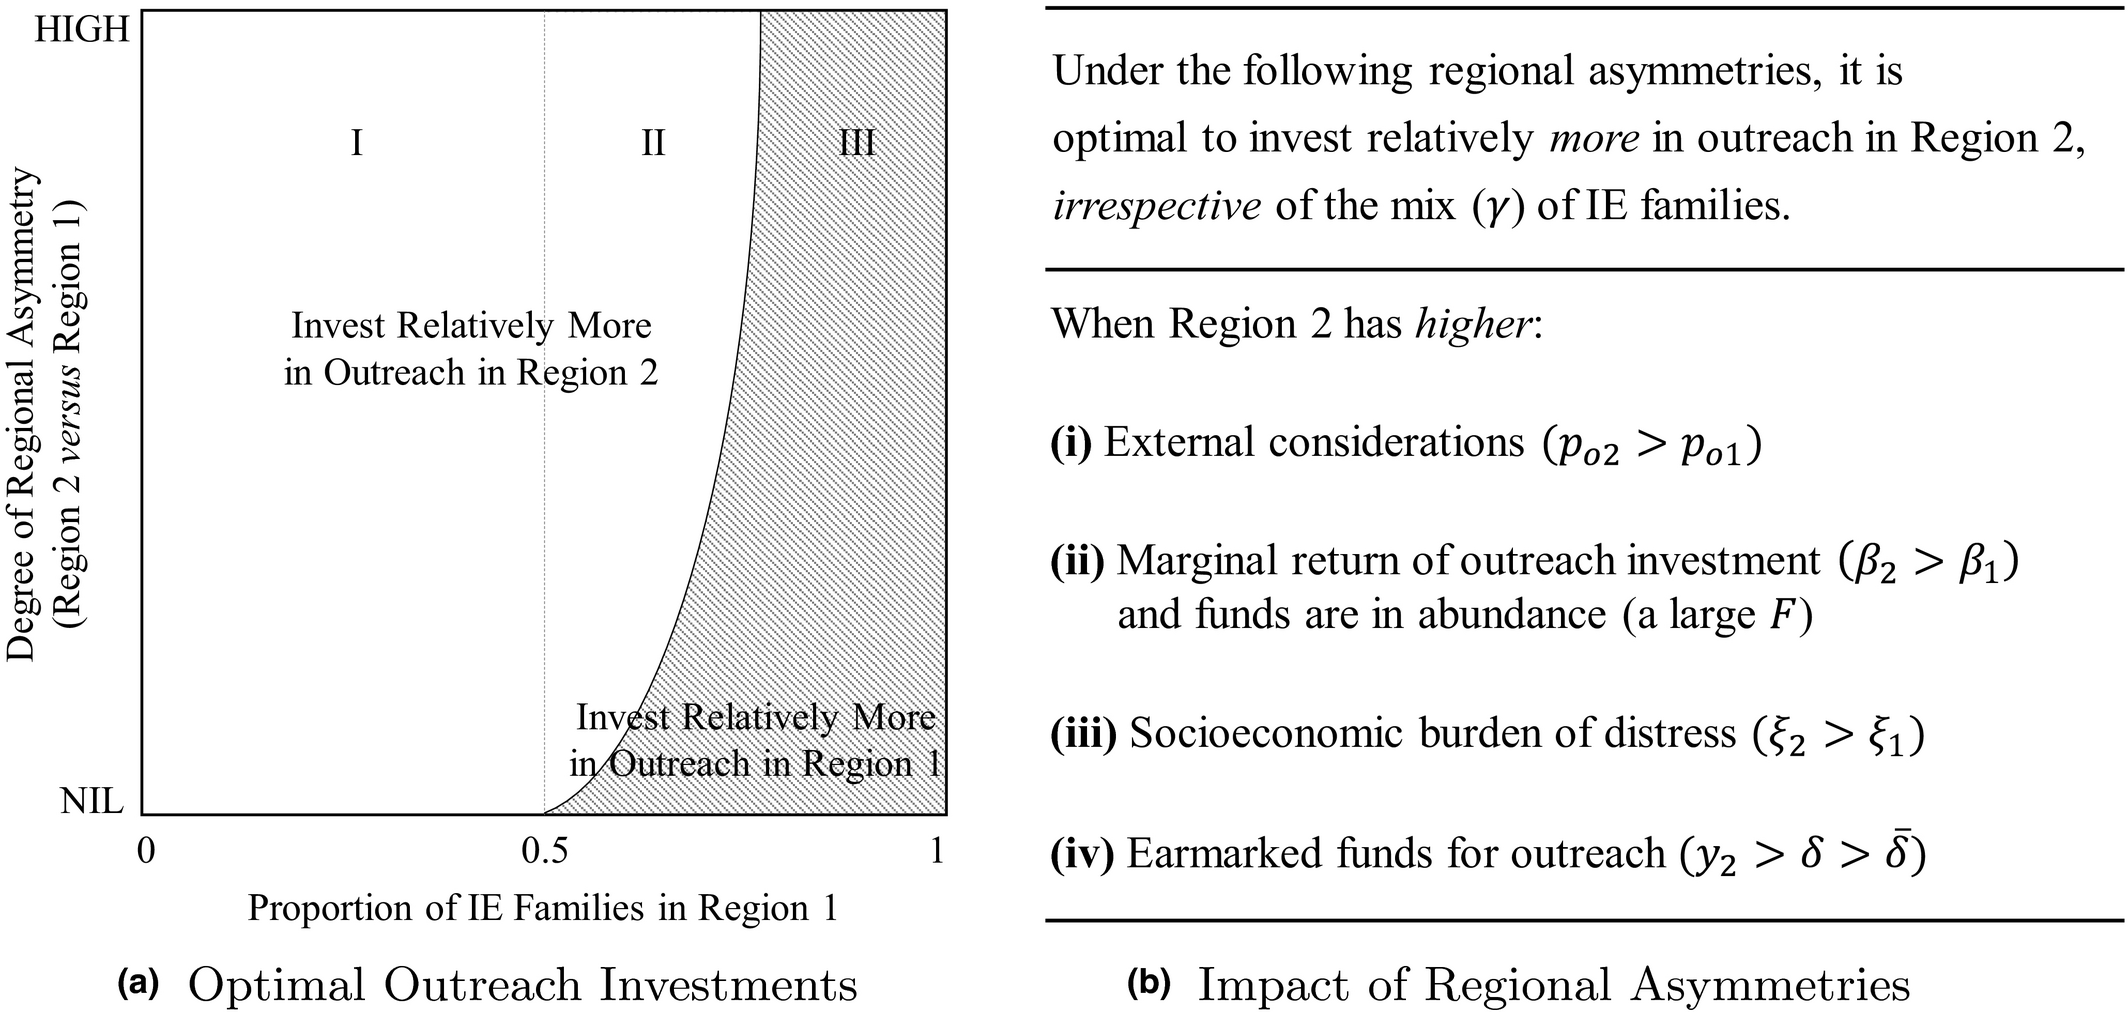
Key Takeaways for CCR&Rs
The external considerations (e.g., public transportation and infrastructure) in region 2 have a greater impact on a family's acceptance propensity; The rate of return of investment in outreach in region 2 is higher and funds are in abundance; The socioeconomic distress experienced by families in region 2 is significantly higher; or A large amount of funds is earmarked for outreach in region 2.
Additionally, portion II expands (and portion III shrinks) when the marginal return of investment in provider services is high, or when the baseline probability that an IE family accepts the offered voucher is high.
Practical Implementation and Case Study Based on a CCR&R in Massachusetts
In this section, we illustrate how the results discussed in Section 4 can apply in practice. We present a case study based on the real‐world example of the CCR&R operating in the Western Massachusetts service area. We use data collected from the U.S. Census Bureau, the child care literature, and our interviews with multiple officials (director and front‐line staff) at the CCR&R under study, to estimate values of the model parameters. Over a period of 2 years, we conducted 10 semi‐structured interviews with multiple field experts to elicit the CCR&R‐specific parameters.
Based on the U.S. Census Bureau's categorization of the U.S. landscape, we categorize the CCR&R's service area into three types of regions: urbanized (denoted by 1), urban clusters (denoted by 2), and rural (denoted by 3). Table 1 lists the considered values of parameters and the sources used to estimate them. The online companion presents a generalized optimization model (for n≥2 different types of regions) and describes the steps taken to estimate the model parameters.
Estimated Values of the Model Parameters for the Case Study
Notes
We also conduct sensitivity analysis by varying values of α from 0.25 to 0.85, 


Optimal Investment Decisions for the CCR&R in Western Massachusetts
We solve the optimization problem by using the estimated parameters to compute the optimal levels of investments in provider services and outreach activities. We find that the optimal amounts of investment are as follows: $180,681 for provider services 


Notably, while the ratio of the distress faced by IE families scaled by the proportion of IE families and the external environmental factors in regions 3 and 1 


Sensitivity Analysis of the CCR&R's Optimal Investments with Respect to Model Parameters
The estimate of the provider services elasticity α is based on the relationship between increments in funding provided to the team focusing on provider services and the increase in the chance of an IE family accepting an offered voucher. The plots in Figure 3(a) depict changes in the CCR&R's optimal investments with respect to the required increment in investment of funds toward the service team to improve the acceptance chances from 1/5 to 1/4, which we refer to as the provider services return factor. Naturally, the optimal investment in provider services is reduced when the provider services return factor increases (because α decreases as a function of this factor). Interestingly, we find that a higher portion of freed up resources (due to reduction in The estimate of outreach elasticity The estimate of distress


We also perform sensitivity analysis by varying the amount of additional funds (δ) that are earmarked for conducting outreach in the rural region. We find that, when δ is greater than $52,000, the optimal outreach investment in the rural region 


Value of Optimal Allocation of Funds
To quantify the value of the proposed optimal allocation of funds, we calculate the percent value reduction in inequity outcomes by comparing values of the inequity measure under both the optimal and the current fund allocation strategies. The CCR&R currently allocates only 10% of the total working hours of an existing employee (working at a wage rate of $15.44 per hour). Considering 2080 working hours in a year, the CCR&R's investment in outreach in its rural region (denoted by, say, 


As emphasized in SDGs, such a reduction in inequity in access to child care, especially for children in low‐income families, plays a pivotal role in determining the future performance of the children and the lowering of the socioeconomic burden (EAC 2016). In particular, SDG #4 emphasizes the need to address equity issues related to opportunities provided to rural children. In that regard, the estimated value of the improvement in equity outcomes in the CCR&R's service area is related to the SDG Indicator 4.2, which includes reducing inequity in “access to quality early childhood development, care, and pre‐primary education" for rural versus urban recipients (SDG 2017). Furthermore, the magnitude of benefit of the proposed optimal allocation of funds should motivate all CCR&Rs (nearly 700 of them in the U.S.) to utilize this study to estimate the model parameters and calculate their optimal levels of investment in provider services and outreach in their service areas.
Conclusion and Future Research
In this study, using an equity‐based objective, we analyze how a CCR&R should allocate its limited funds between its regional outreach activities and the provider services it offers in its service area. Our model‐based analysis shows that it is important for the CCR&R to take into account regional asymmetries—including differences in transportation infrastructure and regulatory environment, marginal return of outreach investment, and distress experienced by families—when balancing its investments in outreach across different regions. In summary, we offer the following key takeaway for managers at CCR&Rs: In the presence of regional differences, it can be beneficial to invest more funds in outreach in a region even when that region has a relatively lower proportion of IE families. We also contextualize our study for a CCR&R in Massachusetts and demonstrate that the proposed investment decisions can improve equity outcomes by approximately 7.0%.
Most recently, the COVID‐19 pandemic has underscored the need to ensure equitable access to affordable and high‐quality child care in order to facilitate a safe and robust reopening of the economy. As a result, CCR&Rs should appropriately allocate their funds to offering provider services, such as cleaning and sanitation and other safety‐related programs, and to conduct outreach, especially in rural regions (Johnson‐Staub 2020, Williams 2020). We view this study as the first step in exploring the operational complexities on the supply side of child care subsidy voucher programs. At a broader level, this study can also help any organization administering and operating subsidy voucher programs in other pro‐social settings to allocate its limited funds across different supply‐enhancing activities optimally.
Across the globe, as a means of attaining SDGs, subsidy vouchers have become a widely accepted form of providing support to beneficiaries who do not have access to affordable essential services (e.g., child care, housing, and maternity care). It is worth noting that several other voucher programs exhibit similar supply‐side concerns. Hatt et al. (2010) and Ir et al. (2010) provide empirical evidence on families’ inability to accept maternity care vouchers offered to low‐income households in Bangladesh and Cambodia, respectively. The commonly stated reasons for such low acceptance probabilities are the inadequate number of service providers in different regions and the low quality of service delivery by the voucher‐accepting providers. Furthermore, given that region‐based socioeconomic and demographic differences play a similar role in these related contexts, the insights generated here pertaining to the effects of regional asymmetries will be particularly useful to balancing investments in outreach activities across different regions.
Our study can be extended for future research in the following directions. First, while we consider an equity‐based objective (with efficiency only captured implicitly through marginal returns), future research can consider a multi‐objective structure that explicitly combines equity and efficiency. For example, a multi‐objective problem setup that considers social benefits and operational costs of various supply‐enhancing interventions can help understand the effect of other efficiency related factors on the investment decisions. Also, we consider the mandated FCFS allocation policy and, accordingly, our equity‐based measure captures the resulting disparities between the families in different regions in terms of the likelihood of acceptance of an offered voucher. Future research can consider alternative allocation policies, wherein it might also be meaningful to capture disparities within the families in each region by using, say, a combination of mean waiting time until acceptance and the likelihood of acceptance. Finally, we believe capturing the interplay between demand‐ and supply‐side factors will be valuable to further improving societal outcomes.
Footnotes
A. Notation
B. Proofs of Propositions
Acknowledgments
This work has been supported by the University of Massachusetts Amherst Public Service Endowment Grant Award Number P1PSEG000000033. The authors appreciate Sara Garvin of New England Farm Workers’ Council for her time and insights on the practical aspects of the context under study. The authors also thank the special issue editors, a senior editor, and three anonymous reviewers for their valuable suggestions, and Sripad Devalkar and Beril Toktay for their helpful feedback on earlier drafts.
Each state or territory in the U.S. sets an eligibility criterion for families to qualify for obtaining support through child care subsidy programs. This criterion is typically income based; for instance, in Massachusetts, the eligibility criteria state that the family's household income should be below 50% of the state median income (MEEC ![]() ).
).
Due to budgetary constraints, state agencies typically fund a fixed number of vouchers. A voucher is made available for offering to an IE family only when an existing voucher‐utilizing family's placement is terminated for failure to meet any eligible requirements (MEEC 2019, Pilarz et al. ![]() ). From the CCR&R's perspective, availability of a voucher is unknown, whereas the number of vouchers being utilized in its area remains at a fixed level.
). From the CCR&R's perspective, availability of a voucher is unknown, whereas the number of vouchers being utilized in its area remains at a fixed level.
Our numerical studies show that insights obtained by using other functional forms that capture diminishing returns (e.g., exponential functions) are qualitatively similar to the ones obtained by using the Cobb–Douglas function.
It is possible that the CCR&R may possess knowledge only on the probability distributions of the elasticities α and
In an extension in the online companion, we analyze the CCR&R's fund allocation problem using a max–min fairness objective. Based on the preliminary analysis, we find that effects of the region‐specific characteristics on the optimal investments are qualitatively similar under both proportional and max–min notions of fairness.
We characterize these conditions for a special case when either
We obtain these values of the percentage improvement in inequity outcomes by using uniform distributions for the model parameters. As a robustness check, we instead use censored normal distributions for these model parameters, and find that the CCR&R can improve the inequity outcomes, on an average, by 5.6%, with a 95% confidence interval of [4.7%, 6.5%]. Furthermore, the magnitude of improvement (7.0% or 5.6%) is consistent with the improvement estimate of yearly societal benefits (in the range of 6.0‐10.0%) in the study by Heckman (![]() ), which focuses on the effectiveness of child development programs, such as birth‐to‐five and preschool programs.
), which focuses on the effectiveness of child development programs, such as birth‐to‐five and preschool programs.