
Abstract
This article examines how the rise of immigration and its associated racial and ethnic changes relate to gentrification. In the decades following the 1965 Hart-Celler Act, gentrification has occurred more in cities with high levels of immigration and in neighborhoods with higher levels of immigrants. These relationships, however, vary by the ways in which a city is racially segregated and by the extent to which its immigrant population has been incorporated. Using crime data, surveys, and new gentrification measures, this article compares Chicago, a highly segregated city and predominantly Hispanic immigrant destination, with Seattle, a predominantly white city with high levels of Asian immigration. The findings show that immigration and its correlates have distinct and evolving relationships with neighborhood changes that are embedded in the racial and immigrant histories of each city, and that gentrification perpetuates racial and ethnic inequality in both cities.
Over the past several decades, many city neighborhoods that had experienced population and socioeconomic declines during the mid-twentieth century underwent reversals. Numerous studies have sought to explain this phenomenon, commonly known as “gentrification,” but few have examined the role of immigration in it. Since the passage of the 1965 Hart-Celler Act, which relaxed prior immigration restrictions, Asian and Hispanic populations have increased dramatically in the United States, particularly in a handful of cities that initially served as major destinations for these groups. The influx of these new residents drastically reshaped the character and racial and ethnic compositions of the neighborhoods in which they settled.
Gentrification—middle- and upper-class residents’ movement into and renewal of neighborhoods that had experienced disinvestment and decline (Smith 1998, 189)—is a process of residential selection, where households, state and corporate actors, and institutions make decisions to invest in neighborhoods. Several studies have shown that in addition to neighborhood characteristics such as school quality, housing values, the prevalence of crime, and the availability of amenities, racial and ethnic composition is an important factor in residential selection (Charles 2003). The racial and ethnic changes to neighborhoods that come with the influx of Asians and Hispanics may attract gentrification by satisfying gentrifiers’ preferences for “diversity” (Zukin 1987) or by providing favored alternatives to predominantly black, low-income neighborhoods, consistent with a racial order of residential preferences persistently found in surveys (Charles 2003). The arrival of new immigrants to these declining neighborhoods can spur local economic growth through an increased demand for housing and services, entrepreneurship, and crime declines (Kirk and Laub 2010; Lee 2002; Muller 1993; Winnick 1990), stabilizing areas and potentially making them more desirable candidates for gentrification.
In this article, I present empirical evidence documenting the relationship between immigration and gentrification from 1970 to the present. Understanding how immigration and its associated racial and ethnic changes are related to gentrification sheds light on how processes of neighborhood change are associated with broader trends of neighborhood racial inequality. Hwang and Sampson (2014) demonstrated that the share of blacks and Hispanics attenuated the degree to which neighborhoods gentrified by 2009 among Chicago neighborhoods that had shown signs of gentrification in 1995 or neighborhoods that were adjacent to those showing signs of gentrification. These findings challenge the thesis that Hispanics had a positive effect on gentrification, but they only refer to recent trajectories of gentrification in a city with large and established black and Hispanic populations. I build on this prior work by extending my inquiry to 1970, when early waves of immigration and gentrification were first taking place, and across twenty-three U.S. cities. Then, I focus on two major cities with distinct racial and immigrant compositions—Chicago and Seattle. Using these two cases, I highlight the role that broader contextual features play in shaping how racial and ethnic changes associated with immigration operate differently in relation to gentrification. I conclude with a discussion of the findings and their implications for understanding urban inequality.
How Immigration Shapes Gentrification
Revitalization
Motivating my research are four perspectives on possible linkages between immigration and gentrification. According to the revitalization perspective, the drastic rise in immigration beginning in the late 1960s, and the associated growth of Asian and Hispanic populations provided a demographic renewal to declining urban neighborhoods (Winnick 1990). Having low residential and commercial rents and high vacancy rates, these neighborhoods regained a demand for housing, commercial businesses, and amenities with the arrival of new populations, consequently revitalizing these once-declining neighborhoods (Lin 1998; Muller 1993; Vigdor 2014). While not directly connected to gentrification, the revitalization perspective suggests that immigrants contributed to the economic improvement and stability of low-income neighborhoods. As a result, these neighborhoods may have become more attractive candidates for gentrification.
Neighborhood “quality”
Additional studies point to the changes that immigrants bring to characteristics associated with the quality of neighborhoods that may attract gentrification. Recent findings show a negative relationship between the in-migration of immigrants to neighborhoods and violent crime (MacDonald, Hipp, and Gill 2012). Yet immigrant concentration is also associated with lower levels of collective efficacy and greater residential instability—characteristics associated with higher levels of crime and disorder (Sampson, Morenoff, and Earls 1999). While the mechanisms responsible for this negative immigrant-crime relationship are not yet well understood, lowering crime levels, particularly violent crime, may have made neighborhoods more likely to gentrify (Kirk and Laub 2010).
Race-based residential preferences
At the same time, the influx of immigrants (particularly Asians and Hispanics) over the past 50 years has altered the racial and ethnic compositions of neighborhoods. Scholarship on residential selection finds that a racial hierarchy exists in which people generally favor white neighbors the most, black neighbors the least, and Asian and Hispanic neighbors in the middle (Charles 2003). Using vignettes and video-computer-assisted self-interviews, research shows that whites’ out-group prejudice toward blacks and Hispanics drives residential preferences beyond factors such as social class and crime (Krysan et al. 2009; Lewis, Emerson, and Klineberg 2011). While such prejudice exists, it may take the form of implicit biases or stereotyping toward minorities and minority neighborhoods rather than explicit racial prejudice, such that residents perceive more crime and disorder in neighborhoods with greater shares of blacks and Hispanics, independent of poverty and actual crime rates (Ellen 2000; Quillian and Pager 2001; Sampson and Raudenbush 2004). Therefore, among low-income neighborhoods, the growth of Asian and Hispanic neighborhoods or the influx of Asians and Hispanics to black neighborhoods may make neighborhoods more desirable candidates for gentrification relative to predominantly black neighborhoods, though less so for Hispanics. Such patterns are also consistent with qualitative accounts of gentrifiers’ taste for racial and ethnic diversity (e.g., Zukin 1987), but these accounts suggest that both white and black neighborhoods with Asian or Hispanic growth are more likely to gentrify than white and black neighborhoods with no racial change. Nonetheless, evidence of rising nativism in more recent years contradicts this view (Sanchez 1997) and suggests that these compositional changes would make neighborhoods less likely to gentrify.
Context of incorporation
Last, the structure of race relations and the history of immigration in cities may also affect how immigration influences gentrification. Immigration flows have been unevenly spread among cities. Through the latter half of the twentieth century, immigration was largely concentrated in only a handful of cities and also diverged between Asians and Hispanics (Flippen and Kim 2015). In traditional immigrant destinations, native residents may be more comfortable with immigrants given that they have settled in these cities for longer periods of time and would therefore elicit less negative responses in residential selection processes (Hall 2013). But in these settings, Asians and Hispanics might also be more likely to move to coethnic neighborhoods rather than serving as pioneers in declining neighborhoods. On the other hand, disadvantaged minority groups with long-standing histories in cities may foster reputations and stigmas that would affect residential selection. Where ethnic enclaves are not yet established, however, the racial and ethnic changes associated with immigration increase the availability of heterogeneous neighborhoods, which in turn may encourage higher mobility into these neighborhoods (Crowder, Pais, and South 2012) while satisfying gentrifiers’ preferences for diversity.
Framework and Approach
Taken together, the existing research proposes various pathways through which immigration might influence the trajectories of gentrification in low-income neighborhoods. While population changes may bring economic improvements and crime declines that can make neighborhoods more likely to gentrify, they may also bring declines in neighborhood cohesion and stability, which can make neighborhoods less likely to gentrify. In addition, immigration alters the racial and ethnic composition of neighborhoods that may be more or less favorable to gentrifiers depending on the larger context into which they arrive.
To assess the immigration-gentrification relationship, I first document the relationship between foreign-born, Asian, and Hispanic populations and gentrification during the late twentieth century using census data from 1970 to 2000 and field surveys of gentrification conducted from 1994 to 2001. This timeframe allows me to assess the influence of the initial rise of immigration following the 1965 legislative changes in the wake of urban decline. Second, I focus on two cities—Chicago and Seattle—and use more detailed and recent data on neighborhood characteristics from crime records, neighborhood surveys, and recent measures of observed gentrification to examine the relationships between immigration-fueled racial, ethnic, and nativity changes and neighborhood trajectories in the last two decades. By the 1990s, Hispanics and Asians had become established in particular destinations, and gentrification arguably began to take a new form, becoming more widespread and rapid (Hackworth and Smith 2001). Both Chicago and Seattle have experienced substantial immigration since 1965, but this immigration has been predominantly Hispanic in Chicago and predominantly Asian in Seattle. By focusing on two cities with distinct racial and immigrant compositions, I examine how the relationship between immigration and neighborhood trajectories varies by the broader context in which neighborhood changes take place.
Early Pathways of Gentrification in the United States
Gentrification field surveys
I use field surveys conducted by geographers Daniel J. Hammel and Elvin K. Wyly from 1994 to 2001 in twenty-three U.S. cities as measures of early waves of gentrification. Measuring gentrification across multiple neighborhoods has been notably difficult. Most large sample studies of gentrification use census- or administrative-based variables to measure gentrification, but these strategies lack direct indicators of neighborhood upgrading and are unable to distinguish gentrification from other forms of neighborhood ascent. In particular, census-based strategies neglect the distinctly visible changes to the urban landscape that are inherent to gentrification.
Hammel and Wyly (1996; see also Wyly and Hammel 1999) addressed this issue by surveying previously low-income and thus “gentrifiable” census tracts—those having median incomes below the citywide median in 1960 in the Northeast and Midwest and in 1970 in the South and West. 1 They reviewed scholarly research, city planning documents, and local press to develop a list of gentrified neighborhoods and triangulated these sources with block-by-block field surveys conducted once in each city, in which raters walked through neighborhoods documenting visible evidence of housing reinvestment and class turnover, giving particular attention to structural improvements and new construction. They categorized census tracts as gentrifying if they had a minimum of one improved structure on a majority of blocks and at least one block in the tract with at least one-third of the structures improved, and gentrifiable tracts without visible signs of reinvestment or renewal were considered ungentrified. 2 While census variables associated with higher socioeconomic status correlated well with gentrifying tracts, about 10 percent of tracts would have been incorrectly classified as gentrified when using only these census variables to predict gentrification (Hammel and Wyly 1999). The final database consists of 2,087 “gentrifiable” census tracts with nonzero populations of which 359 were gentrifying; 2,968 tracts were not gentrifiable. Although I cannot detect when gentrification began in these tracts, census data show that gentrifying tracts had relatively higher socioeconomic indicators as early as 1970. Thus, it is likely that the majority of these tracts had been gentrifying for many years prior to Hammel and Wyly’s investigation.
Immigration and gentrification across cities
Table 1 lists the twenty-three cities surveyed by Hammel and Wyly (1996), categorized into three levels of immigration and the average probabilities of tract gentrification for each of these categories. Immigration levels are based on the share of foreign-born residents in the city relative to national averages from 1970 to 2000. The average probability of gentrification was much higher in cities with relatively high levels of immigrants compared with cities with lower shares of immigrants.
Average Probability of Gentrification across Cities by Immigration Levels
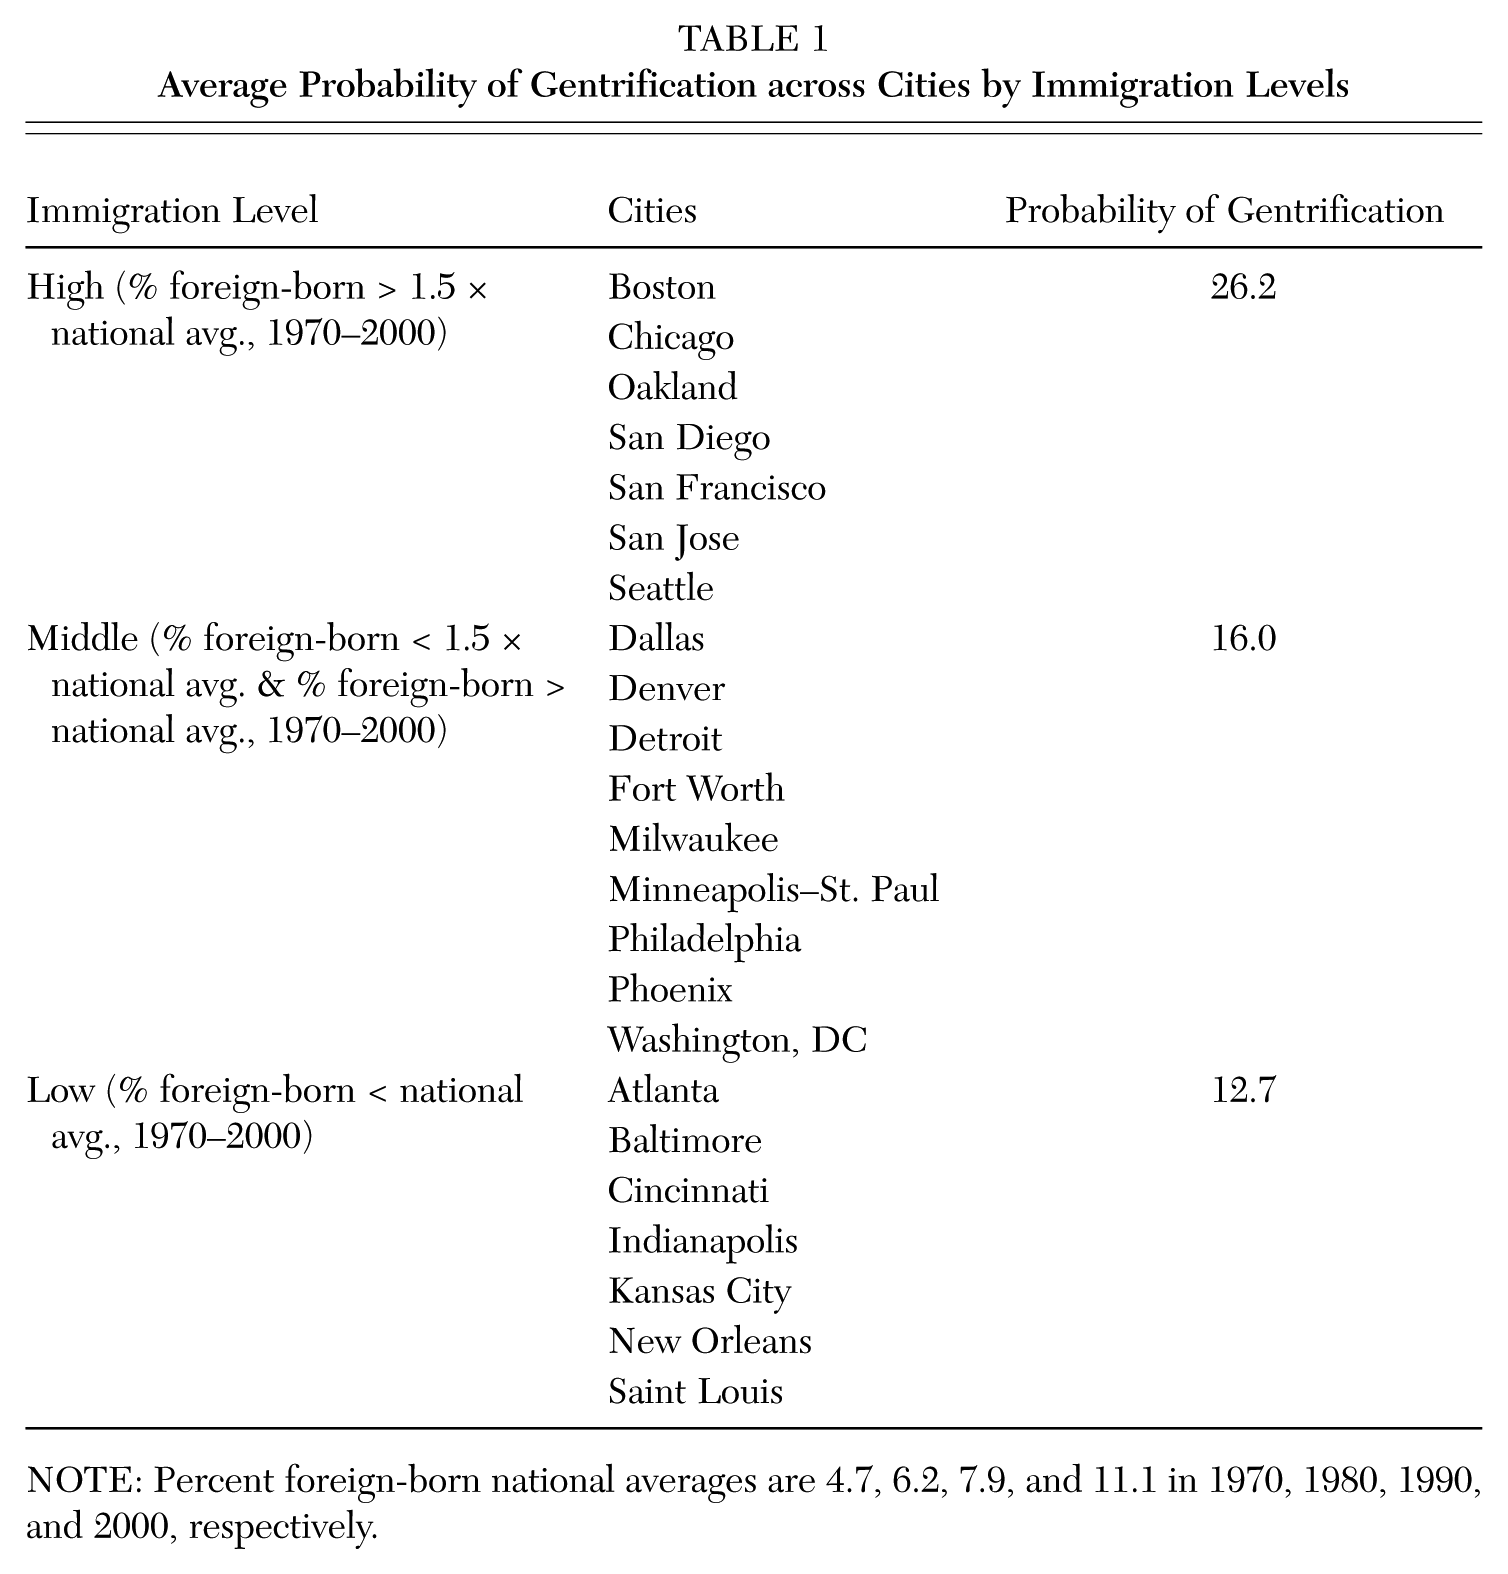
NOTE: Percent foreign-born national averages are 4.7, 6.2, 7.9, and 11.1 in 1970, 1980, 1990, and 2000, respectively.
Immigration and gentrification across neighborhoods
Next, I assessed the relationship between immigration and gentrification at the neighborhood level. I used logistic regression models predicting the likelihood that a neighborhood was gentrifying by the time of the field survey on the foreign-born population (logged) in the first model and populations (logged) of racial and ethnic groups in the second model. I use separate models for nativity status and racial and ethnic groups because census data before 2007 do not separate nativity status by race and ethnicity, and the Hispanic and Asian populations are highly correlated with the foreign-born population since 1970. Models 3 and 4 include interaction terms with the black population to test whether the racial and ethnic changes that these residents brought to low-income, black neighborhoods are associated with gentrification. I also controlled for socioeconomic status (poverty rates, logged household income) and residential stability (ownership rates, vacancy rates, percent over 65 years old, percent living in the same residence five years ago), as well as unobserved differences between cities using fixed effects models.
Table 2 presents results predicting the likelihood of gentrification using census data linearly interpolated to 24 years prior to the gentrification field survey—the longest period of time for which census data are available for all twenty-three cities. 3 The results show that foreign-born, Asian, and Hispanic residents are positively associated with the likelihood of gentrification, even after accounting for the preexisting differences in socioeconomic status and residential stability. Moreover, these effects are greater relative to blacks and stronger in neighborhoods with higher black populations. Alternative models show that Asians and Hispanics have smaller effects relative to whites and no effects in neighborhoods with higher white populations, which suggests that a racial hierarchy of residential selection is also at work.
Regression Results with City Fixed Effects Predicting Gentrification on Nativity, Race, and Ethnicity
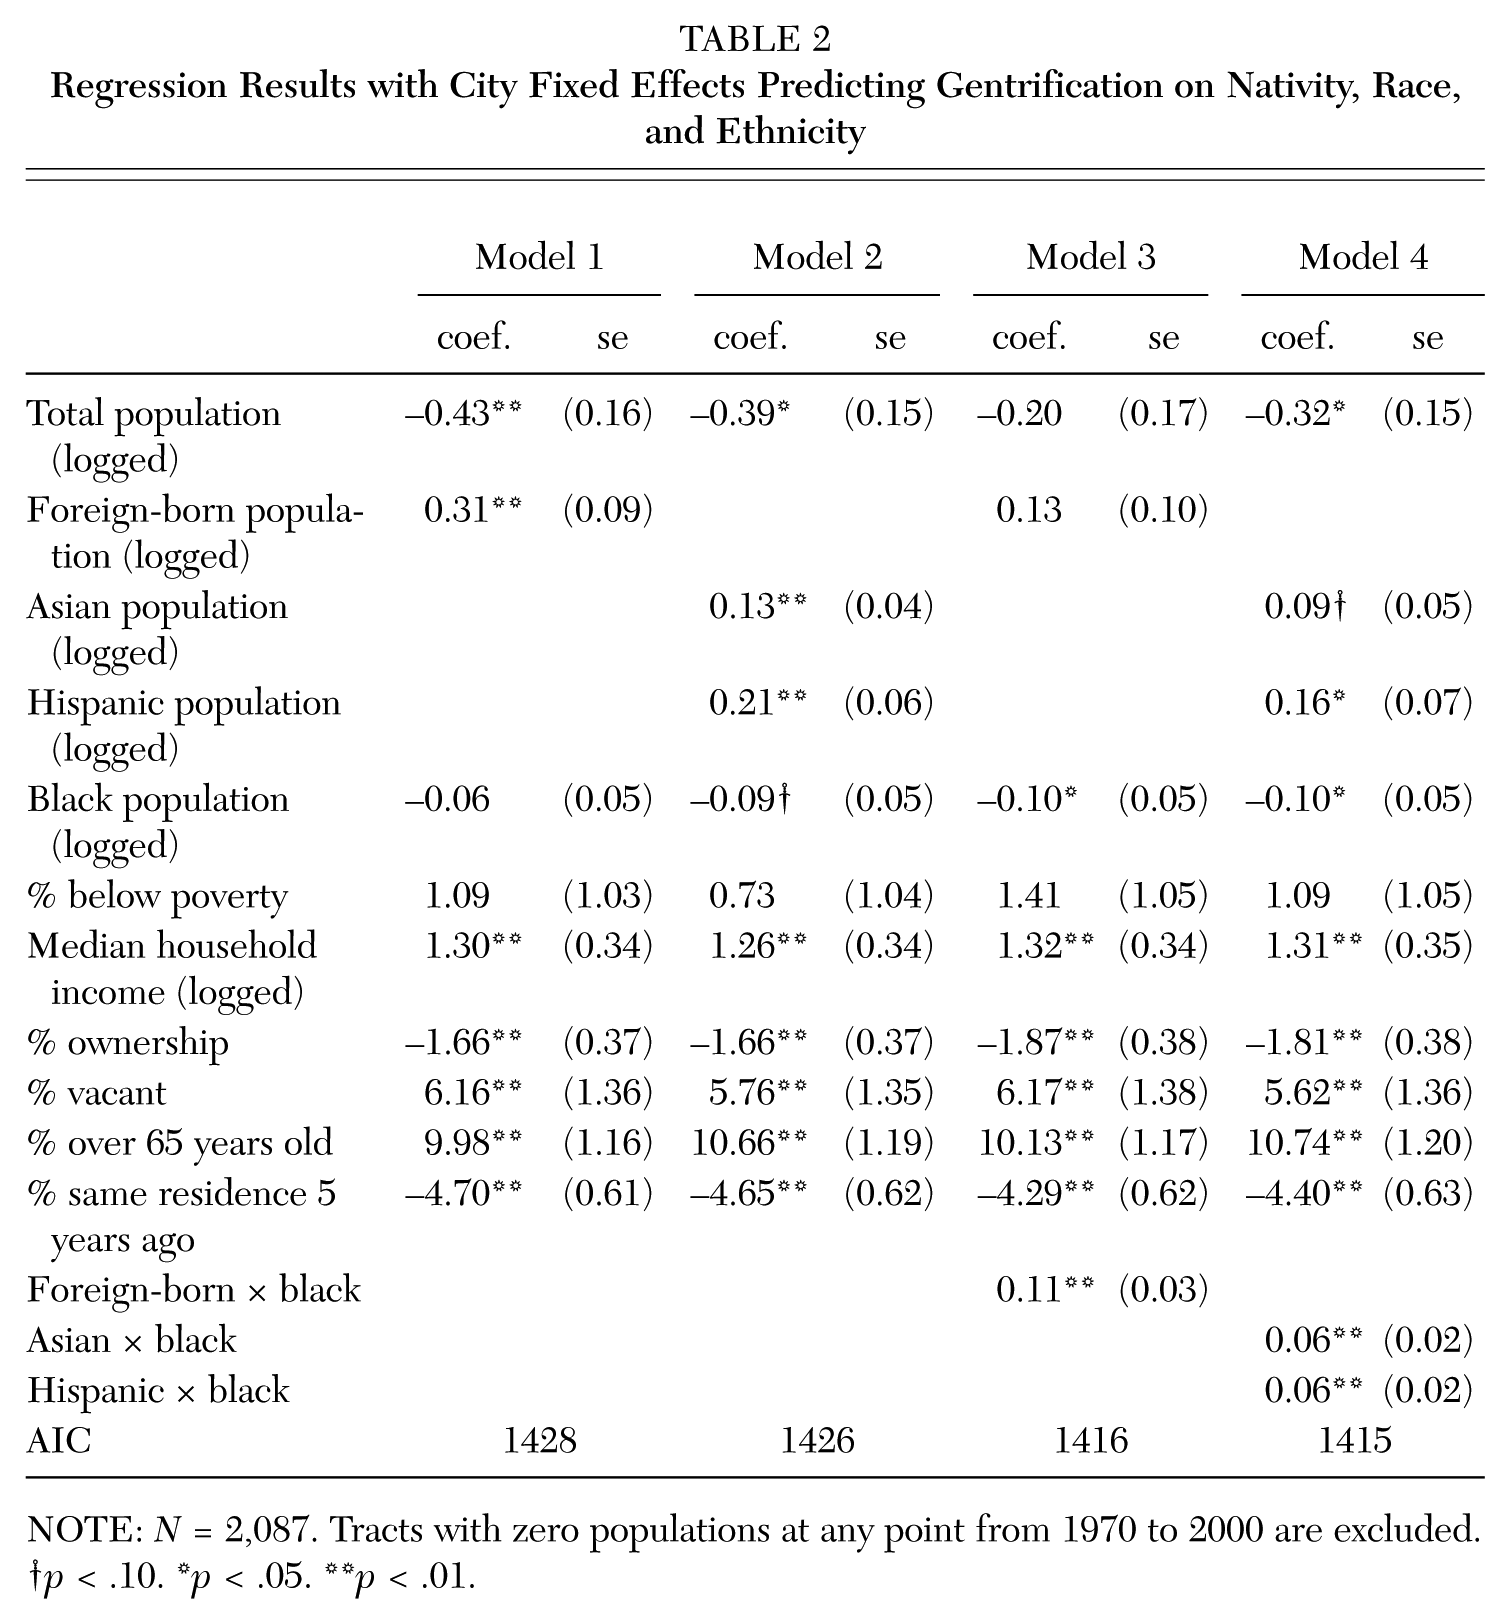
NOTE: N = 2,087. Tracts with zero populations at any point from 1970 to 2000 are excluded.
p < .10. *p < .05. **p < .01.
The Context of Immigration and Gentrification: Past and Present Pathways
While immigration and its associated racial and ethnic changes played a role in earlier waves of gentrification across the twenty-three cities, the results show that there are differences among cities. In the following analysis, I examine two cities with high immigration levels but distinct immigrant and racial compositions—Chicago and Seattle. First, I briefly describe the demographic history of these cities and present descriptive statistics for tracts that were gentrifying and those that were not by the time Hammel and Wyly surveyed them. Then, I describe additional data used to assess the relationship between immigration and neighborhood change more closely. Finally, I use these data to examine how immigration and its related racial and ethnic changes are associated with neighborhood characteristics and trajectories of gentrification in recent years.
Chicago
Throughout the twentieth century, Chicago served as a traditional destination for immigrants and continues to do so today. Since the 1965 legislative changes on immigration, Chicago has served as a major destination for both Hispanics and Asians, but Chicago’s immigrants have been predominantly Hispanic. Over half of Chicago’s foreign-born population is from Latin America, with only 20 percent from Asia. As the third largest destination for Puerto Ricans in the United States and a traditional destination for Hispanic immigrants, Chicago has experienced dramatic increases in its Hispanic population. In 1970, Chicago was approximately 60 percent white, 30 percent black, 7 percent Hispanic, and less than 1 percent Asian. The white and black populations have both steadily declined and each comprise less than one-third of the city’s population today. The share of Hispanics, however, has increased to more than 28 percent, of which 41 percent are foreign-born and 13 percent are Puerto Rican. The share of Asians has also increased substantially but comprises less than 6 percent of the population. In contrast to Hispanics, nearly 70 percent of Chicago’s Asian population is foreign-born. Moreover, Chicago’s Hispanic population is more socioeconomically disadvantaged than its Asian population, as reflected by poverty rates of 24 and 18 percent and median household incomes of $41,700 and $56,700, respectively. Nearly 60 percent of Asians in Chicago have at least a bachelor’s degree, but only 12 percent of Hispanics do.
Despite Chicago’s racially and ethnically diverse population, it has had persistently high levels of residential segregation by race. In 2012, the tract-level share of blacks was negatively associated with the tract-level shares of whites, Hispanics, Asians, and foreign-born residents, displaying correlations of −0.71, −0.58, −0.33, and −0.71, respectively. Nonetheless, following nationwide trends, its segregation levels have been slowly declining as its neighborhoods have become increasingly diverse (Rugh and Massey 2014).
Seattle
Like Chicago, Seattle has had a substantial share of foreign-born residents since 1965. However, it has primarily served as a major destination for Asian immigrants. Over half of Seattle’s foreign-born population is from Asia, while only 12 percent are from Latin America and about 10 percent are from East Africa. Seattle boasts one of the highest shares of Asians among major cities (14 percent), and nearly 65 percent of them are foreign born. Moreover, relative to Chicago, Seattle does not have a large presence of either blacks or Hispanics. Its share of Hispanics has increased nearly threefold since 1970 but was still only 6 percent by 2012. In 1970, Seattle was more than 86 percent white. Over time, this share has declined but is still high compared with other major cities (66 percent). Its share of blacks has remained between 7 and 10 percent over the last 40 years. Despite decline and a lack of growth in the shares of whites and blacks in Seattle, respectively, the population counts of these groups has increased in recent decades, as Seattle’s overall population has continued to grow since 1980, whereas Chicago has been experiencing overall population decline for the last 50 years.
In contrast to Chicago, the gap between Hispanics’ and Asians’ socioeconomic status in Seattle is not as large, with Hispanics being relatively more advantaged and Asians relatively less advantaged than their Chicago counterparts. More than 36 percent of Seattle’s Hispanic population has at least a bachelor’s degree, compared with 47 percent of Asians, and the median household income for Hispanics and Asians is $48,100 and $52,000, respectively. The poverty levels are also closer, with Hispanics and Asians having poverty rates of 21 and 18 percent, respectively. While Seattle’s segregation levels are far lower than Chicago’s, its African American population is primarily concentrated in the southeastern section of the city. Due to the lower shares of blacks, however, these neighborhoods are generally more heterogeneous. Moreover, unlike Chicago, Seattle’s foreign-born, Asian, and Hispanic populations are much less segregated from the city’s blacks, exhibiting positive tract-level correlations of 0.56, 0.45, and 0.36, respectively. Instead, these three groups are highly segregated from the city’s white population, with correlations of −0.89, −0.84, and −0.50, respectively.
Early gentrification in Chicago and Seattle
Table 3 presents the average tract characteristics in 1970 and 2000 for gentrifiable tracts with nonzero populations from 1970 to 2000 that remained ungentrified and for those that were gentrifying by the time of the field surveys (which were conducted in 1995 in Chicago and in 1998 in Seattle). Only 41 of Seattle’s populated tracts, about one-third, but 363, or two-fifths, of Chicago’s populated tracts were gentrifiable. In 1970, tracts that eventually gentrified in both cities had much greater shares of whites and college-educated residents on average. In Chicago, their Hispanic populations were similar to those in ungentrified tracts, and their shares of Asians and foreign-born residents were greater. In Seattle, however, tracts that eventually gentrified had lower shares of blacks, Hispanics, Asians, and foreign-born residents compared with tracts that remained ungentrified. These descriptive results suggest that immigrants, particularly Asians, were associated with earlier waves of gentrification in Chicago but that all minority groups were negatively associated with gentrification in Seattle. Moreover, socioeconomic disparities between the average ungentrified tract and the average gentrified tract were much greater in Chicago by 2000. Although tracts that eventually gentrified had higher income levels and more highly educated residents as early as 1970, they had similar poverty rates, higher vacancy rates, and lower residential stability. By 2000, the socioeconomic differences between gentrifying and ungentrified tracts grew wider, and the relationship reversed for vacancy rates.
Average Characteristics for Gentrifiable Census Tracts in Seattle and Chicago, 1970 and 2000
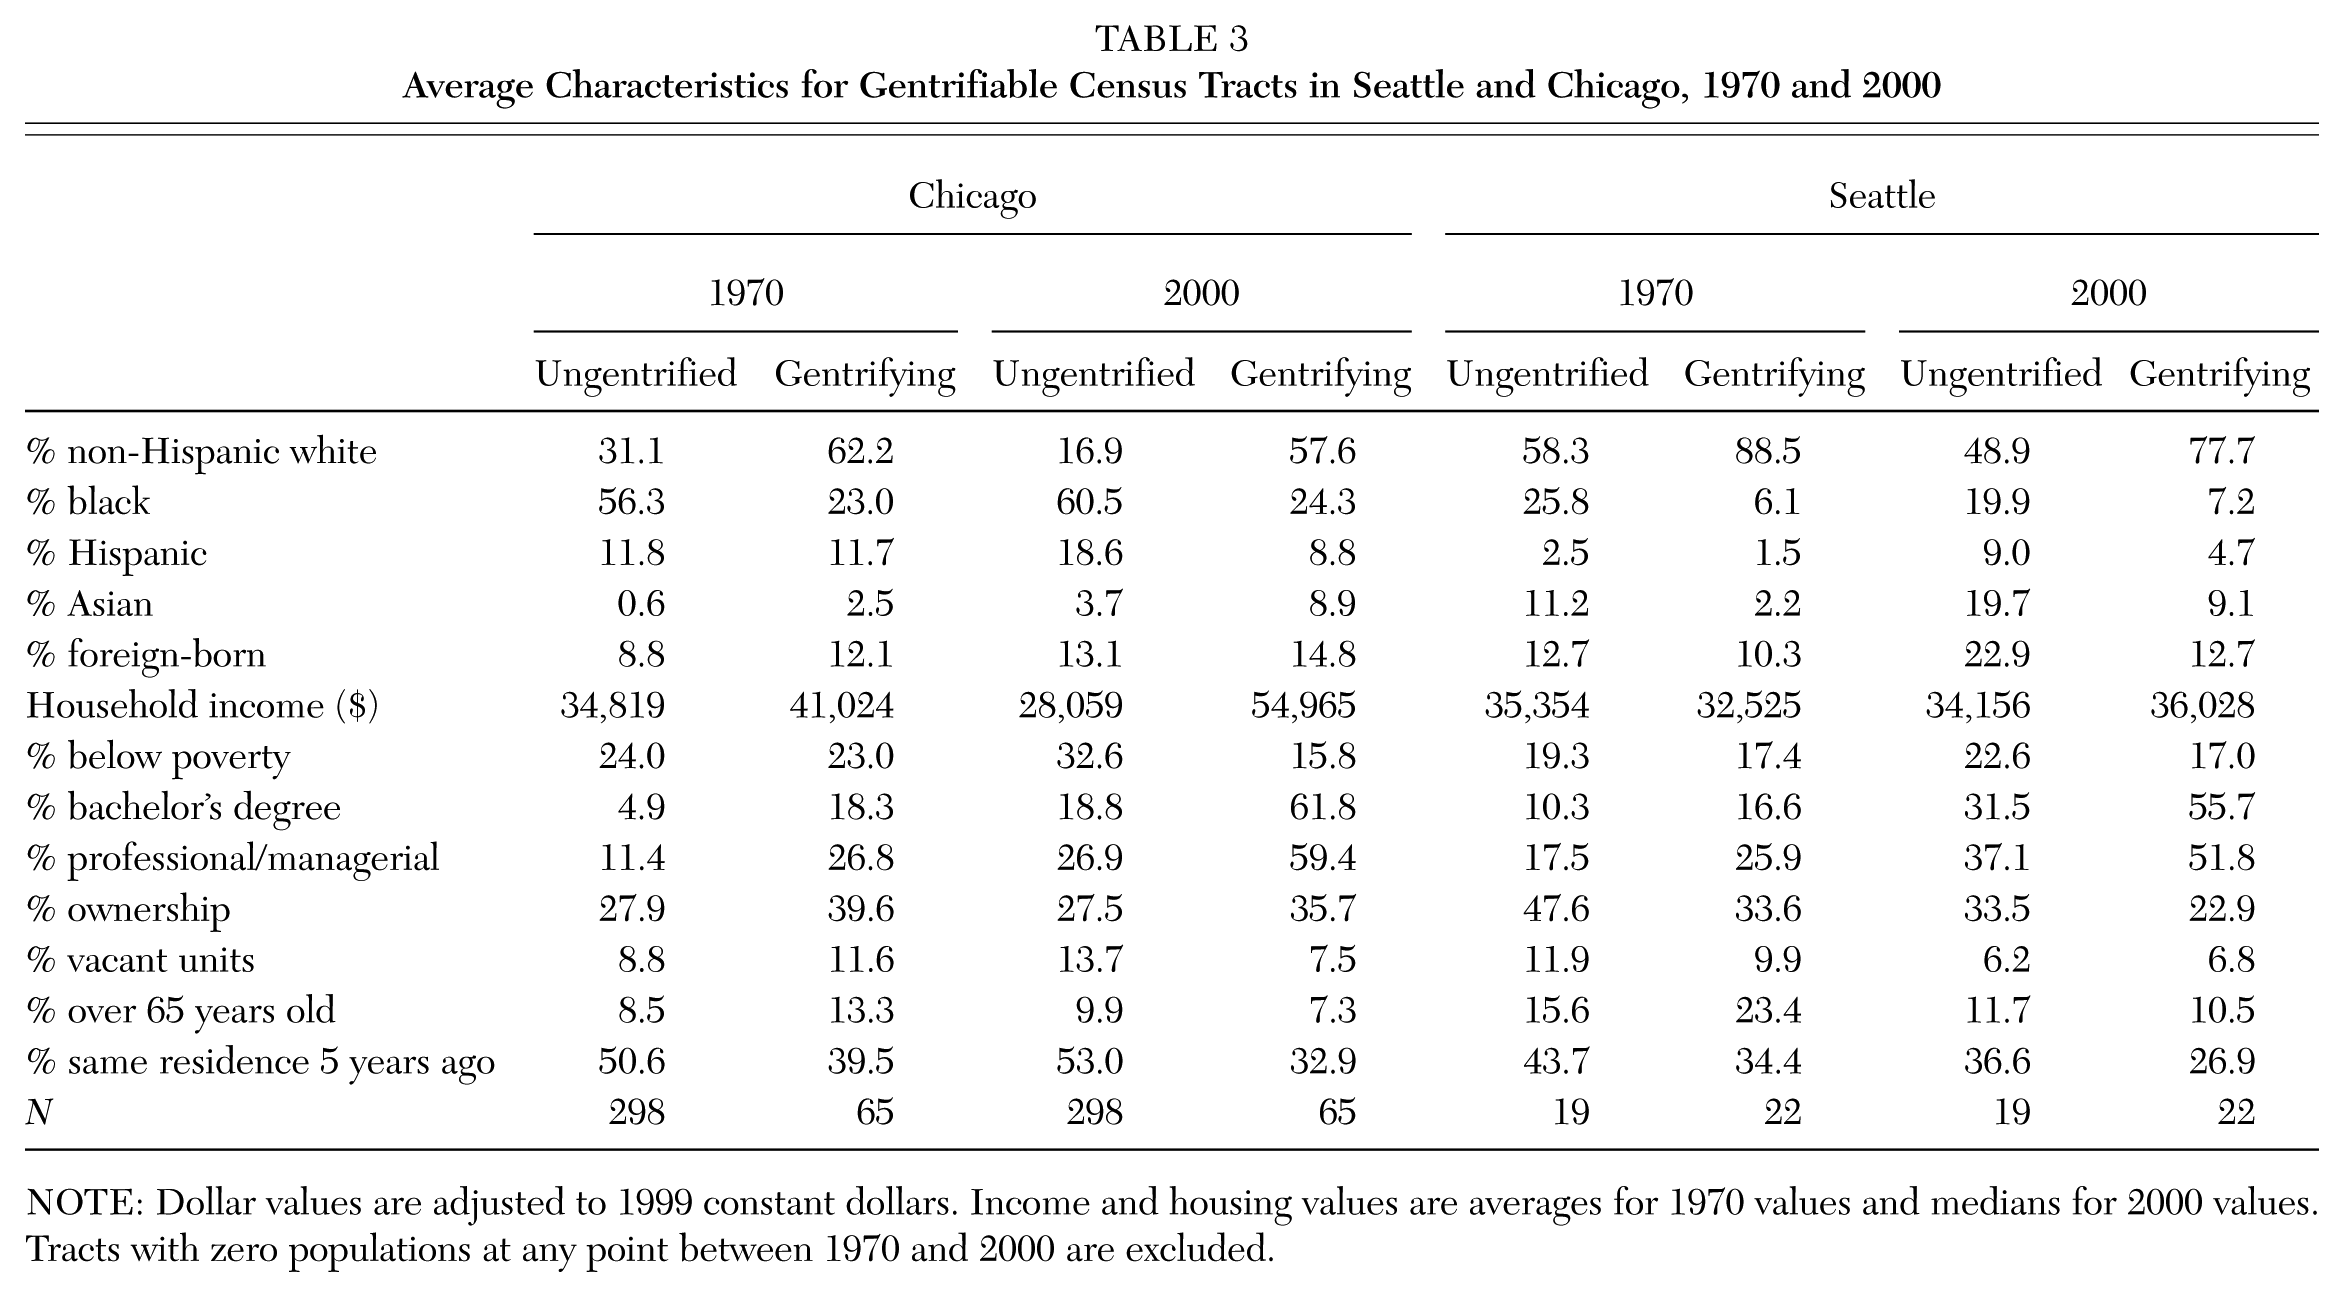
NOTE: Dollar values are adjusted to 1999 constant dollars. Income and housing values are averages for 1970 values and medians for 2000 values. Tracts with zero populations at any point between 1970 and 2000 are excluded.
Additional data sources
Crime reports
In both cities, I used reported homicides and burglaries compiled from the Chicago Police Department and the Seattle Police Department, respectively. 4 Rates are per 100,000 residents, and I used three-year averages because crime data are highly variable from year to year.
Chicago Community Adult Health Study (CCAHS)
The CCAHS was a survey conducted from 2001 through 2003 with a stratified, multistage, probability sample of 3,105 adult Chicago residents. It was designed to understand the relationship between neighborhood contexts and health. I drew from the community survey component, which asked individuals various questions about their neighborhoods. Following prior analyses (e.g., Sampson and Raudenbush 2004), I constructed a tract-level measure for collective perceptions of disorder based on questions asking residents how much the following items were a problem in the neighborhood: teenagers causing a disturbance, litter, graffiti, vacant areas, drinking in public, and selling/using drugs. In addition, I constructed a measure for informal social control based on questions about the perceived likelihood of neighbors taking action if children were skipping school, defacing a building, not showing respect, and fighting; or would organize to keep a local fire station.
Seattle Neighborhoods and Crime Survey (SNCS)
The SNCS was a survey of 4,904 adults across Seattle conducted from 2002 to 2003, in which 2,200 of the respondents were from a stratified random sample. The survey was intended to examine neighborhood social organization and criminal violence. Using responses from the random sample, I constructed similar tract-level measures as in the CCAHS, but the perceived disorder measure does not include questions on drinking in public or selling/using drugs because the survey did not include these questions, and the informal social control measure does not include a question about organizing to save a local fire station. In the results presented, I use standardized measures for the response scales in each city.
Google Street View Gentrification Observations (GGO)
The GGO project was designed to measure the degree to which neighborhoods have gentrified, using a systematic social observational approach of street blocks that draws on Google Street View. Google Street View is free, is fully accessible to the public, and provides nearly full-rotation panoramic views at the street level that are updated every one to four years, giving viewers the virtual experience of walking down the street. This approach to measuring gentrification builds on Wyly’s and Hammel (1999) work, which showed that the visible features of gentrification are not always properly identified using census-based measures. Indeed, the visible aspects of gentrification express the social transformation of a neighborhood and offer a way to observe a process that is facilitated by a complex combination of actors. In addition, visible signs of neighborhood reinvestment further facilitate upgrading.
The GGO data span 2,096 and 1,000 block faces—single sides of street segments—in Chicago and Seattle, respectively, using images captured in 2009–12. The project focused on trajectories of gentrification and therefore assessed a stratified random sample of blocks in census tracts that were either identified as gentrifying in Hammel and Wyly’s field surveys or were adjacent to these tracts and were below the citywide median income at any point between 1960 and 1990. These adjacent tracts were included in the study to consider the spread of gentrification over time. Coders surveyed all block faces of the sampled blocks. Collectively, the GGO data cover 42 tracts in Seattle and 144 tracts in Chicago, which comprise about one-third of Seattle’s tracts and one-sixth of Chicago’s tracts.
The survey instrument was designed to capture various observable aspects of theoretically driven measures associated with gentrification in a neighborhood: (1) housing structures that are either older and well-maintained, newly constructed, or rehabilitated; (2) new public investments (e.g., new bus stops) or large-scale developments (e.g., high-rise luxury condos); (3) visible beautification efforts (e.g., lawn décor); and (4) the lack of disorder and decay (e.g., no graffiti). These characteristics provide conceptually sound measures of visible neighborhood transformations consistent with my working definition of gentrification, and they encompass aspects of gentrification beyond demographic changes, such as commercial and aesthetic changes and public investment. Each characteristic was measured with two to three indicators. Details on the instrument, interrater reliability, and a coding guide are available online. 5 I constructed a scale for the degree of gentrification in each census tract using the average scores for each of the four multi-item measures. The final score is intended to capture a neighborhood’s stage in a life cycle of neighborhood change from decline to renewal to class turnover (c.f., Hoover and Vernon 1959). For more methodological details, see Hwang and Sampson (2014).
Neighborhood “quality” and perceptions
Using crime reports, community survey data, 1990 and 2000 U.S. Census data, and 2005–9 American Community Survey five-year estimates, 6 I examined how changes in the immigrant, Asian, and Hispanic populations are associated with neighborhood characteristics described earlier that may relate to gentrification. Table 4 presents average measures for various neighborhood characteristics in Chicago’s and Seattle’s gentrifiable tracts and the percent of tracts that were gentrifying when Hammel and Wyly observed them. The table compares gentrifiable tracts in the lowest third and highest third of each city’s share of foreign-born, Asian, and Hispanic residents in 2000, as well as tracts with no growth (loss or no change) and tracts in the highest third of each group’s population change from 1990 to 2009.
Average Characteristics by Immigrant, Asian, and Hispanic Populations and Change for Chicago’s and Seattle’s Gentrifiable Tracts
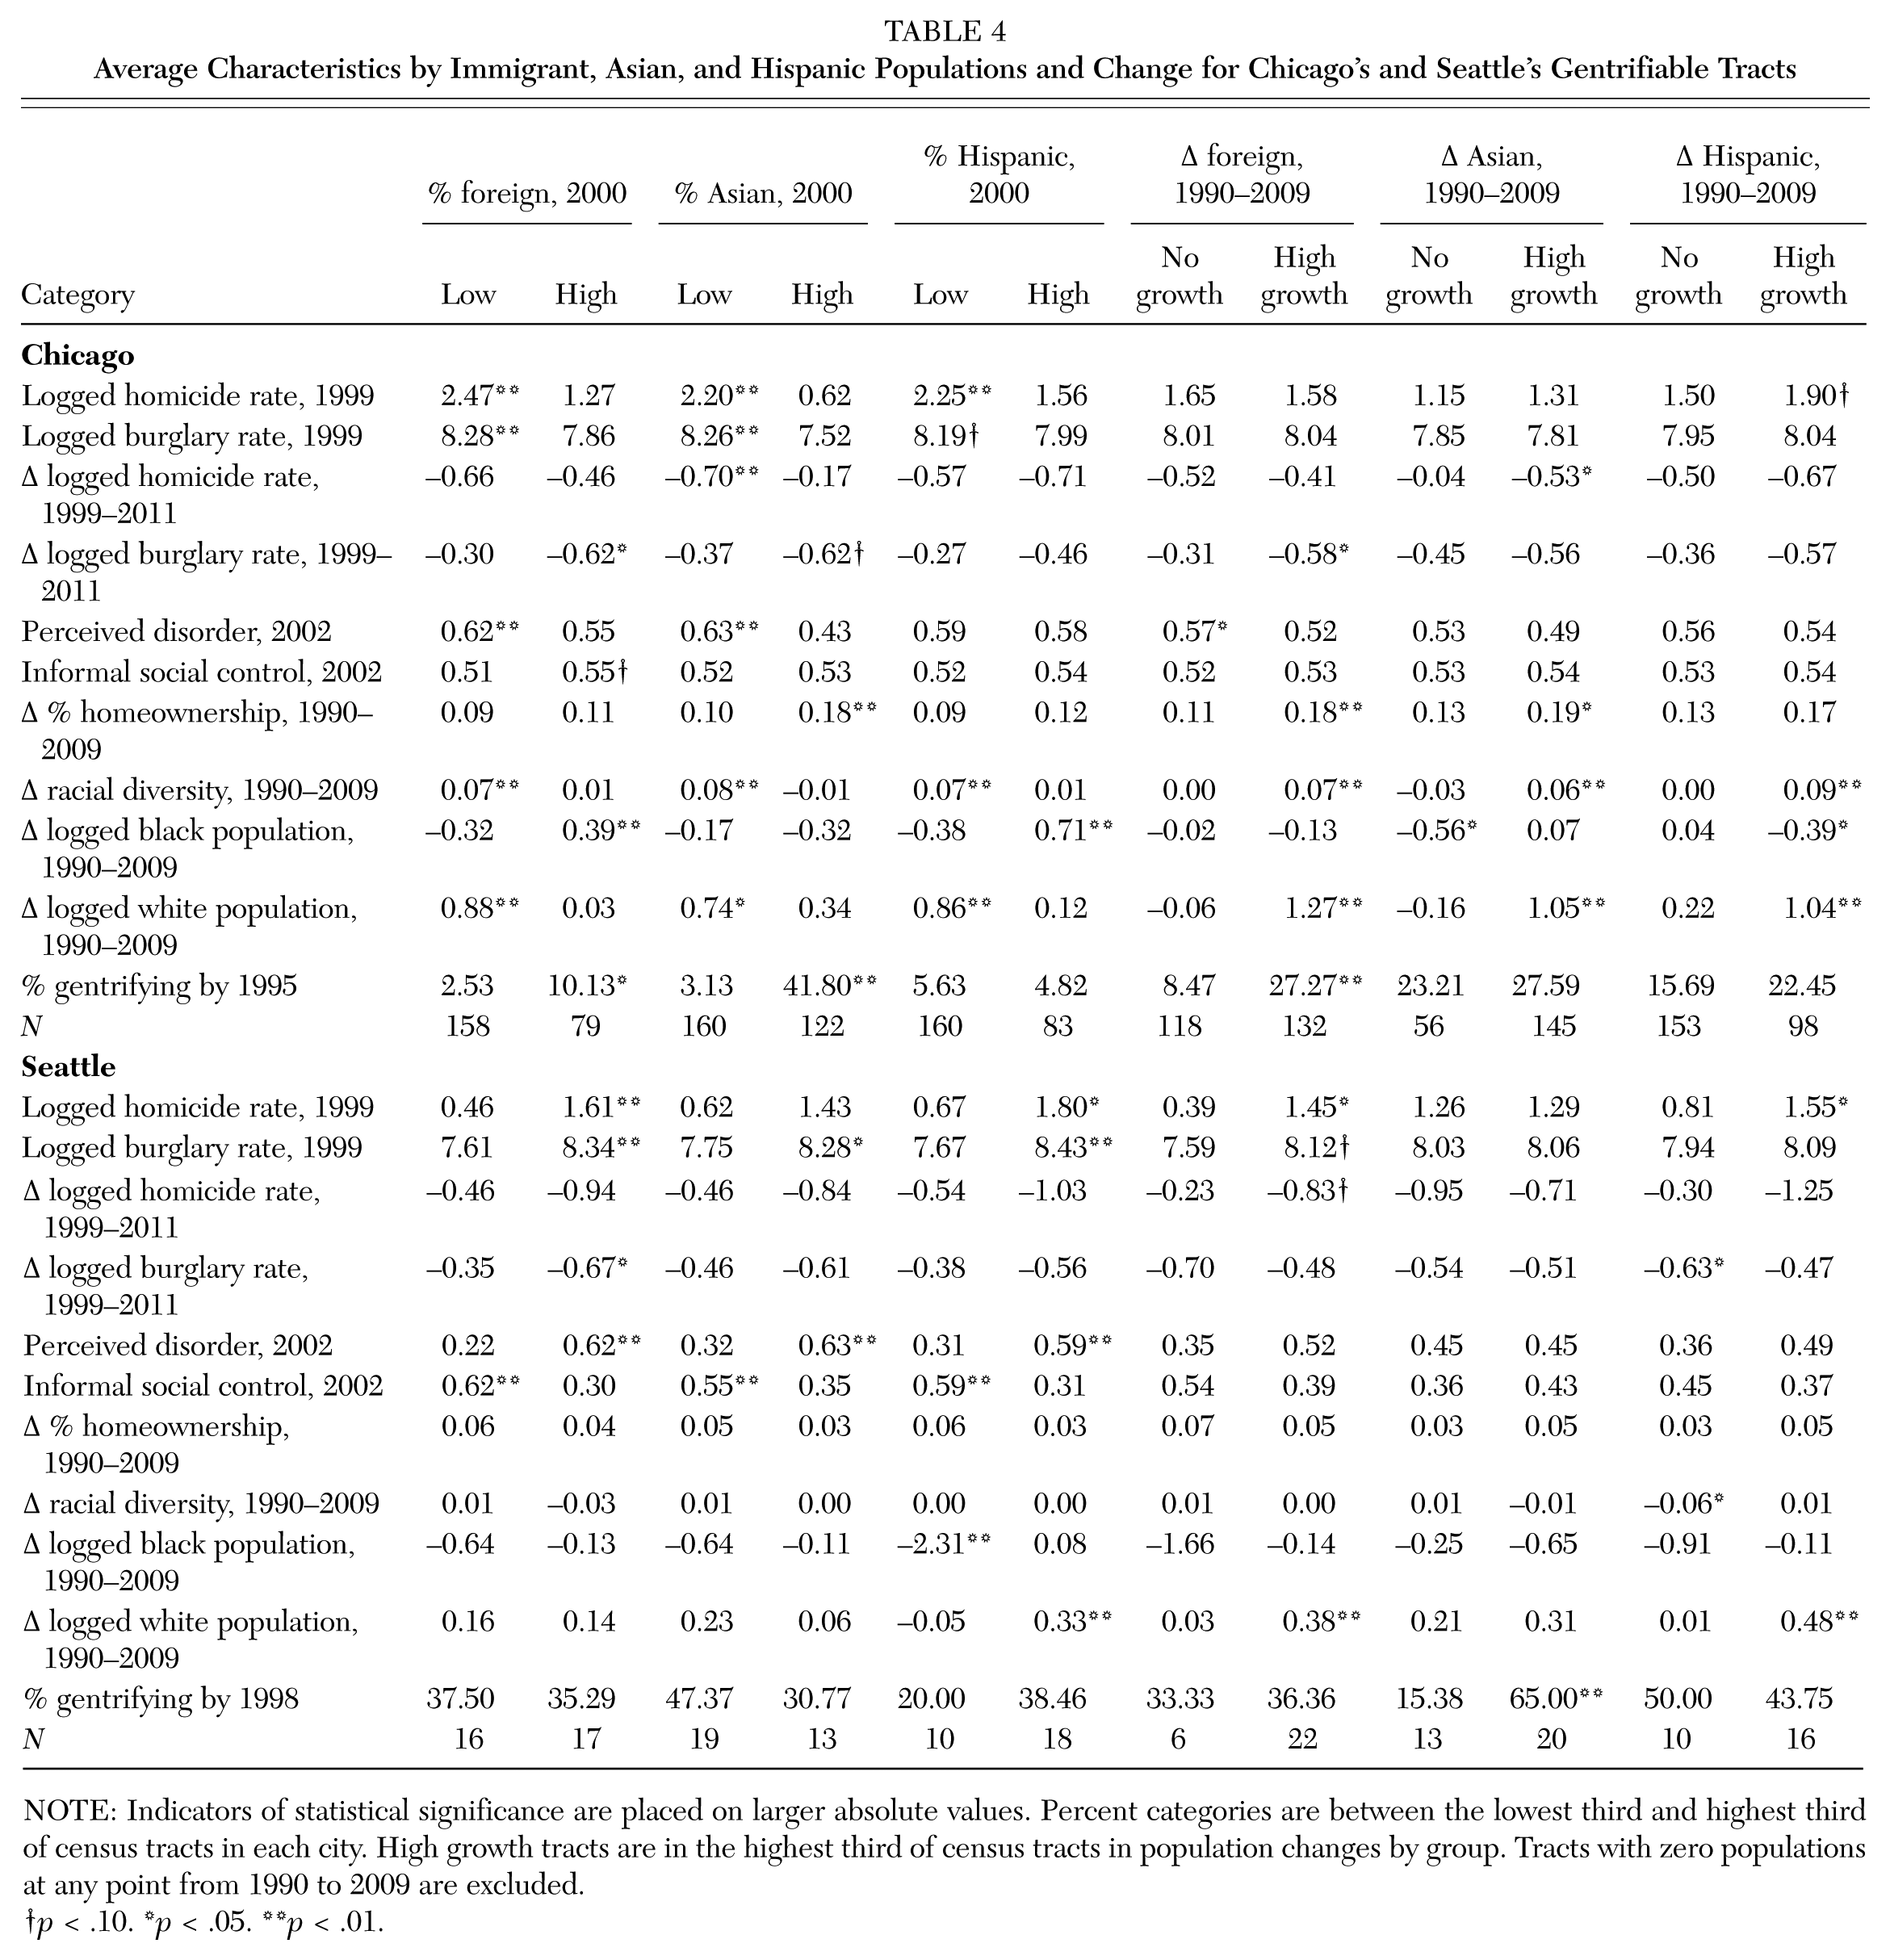
NOTE: Indicators of statistical significance are placed on larger absolute values. Percent categories are between the lowest third and highest third of census tracts in each city. High growth tracts are in the highest third of census tracts in population changes by group. Tracts with zero populations at any point from 1990 to 2009 are excluded.
p < .10. *p < .05. **p < .01.
In Chicago, crime and perceived disorder are higher in tracts with low shares of all of these groups, but in Seattle, crime and perceived disorder are substantially higher in tracts with high shares of all groups and high levels of immigrant and Hispanic growth. Moreover, high Asian growth is associated with larger declines in crime rates in Chicago but not in Seattle. Nonetheless, tracts with high shares of immigrants had greater declines in burglary rates over the subsequent decade in both cities. In Chicago, the lowest levels of crime and perceived disorder are actually found among tracts in the middle levels of the foreign-born and Hispanic distributions. Given that the foreign-born and Hispanic populations are generally segregated from predominantly black neighborhoods in Chicago but not in Seattle, these middle-range tracts tend to have higher shares of whites, and the lower-range tracts tend to have higher shares of blacks. Thus, neighborhood-level crime and perceived disorder are associated with predominantly black and Hispanic neighborhoods in Chicago but with all nonwhite and nonnative neighborhoods in Seattle. See the online supplement for correlates by black and white population and changes. 7
Average levels for informal social control and residential stability, both reflecting neighborhood collective efficacy, show that Chicago tracts with high levels of immigrants are associated with higher levels of social control. In addition, tracts with high levels of immigrant and Asian growth saw increased homeownership in Chicago. By contrast, Seattle neighborhoods with high levels of all three groups had lower levels of informal social control.
Racial changes are also associated with varying levels of these populations but differ by city. In highly segregated Chicago, high immigrant growth is associated with increased racial diversity, and tracts with low levels of each group in 2000 experienced greater increased diversity. Neighborhoods with high immigration and Hispanic levels also had larger increases in their black populations and smaller increases in whites. High growth in all three groups was associated with the greater growth of whites in Chicago. Seattle’s tracts with low levels of these groups experienced large declines in their black populations, and tracts with higher shares of Hispanics and high levels of immigrant and Hispanic growth experienced larger increases in whites. Thus, areas with rising immigrant populations or low levels of immigrants and Hispanics are associated with white influx in Chicago, but in Seattle, where Asians are the larger immigrant population, greater increases in whites occurred in neighborhoods with relatively higher shares of Hispanics and in neighborhoods with high levels of immigrant and Hispanic growth.
Finally, tracts that gentrified by the 1990s had higher levels of foreign-born and Asian residents in 2000 and higher levels of immigrant growth in Chicago and higher levels of Asian growth in Seattle. Altogether, these results suggest that immigrant groups without established local concentrations are associated with gentrification, and other neighborhood “quality” characteristics do not necessarily map onto gentrification, particularly in Seattle.
Trajectories of gentrification
I next examine how immigrants, Hispanics, and Asians are associated with neighborhoods’ recent trajectories of gentrification using the gentrification measures created with Google Street View. Therefore, this analysis only examines tracts that had gentrified according to Hammel and Wyly’s field observations or tracts that were adjacent to them and low-income at any point from 1960 through 1990. Figure 1 presents maps of Chicago and Seattle and the gentrification stage scores for these tracts. Tracts with bolded outlines were gentrifying when Hammel and Wyly observed them. The overall gentrification stage scores averaged to 0.68 (sd = 0.07) in Seattle and 0.65 (sd = 0.11) in Chicago. Seattle’s higher levels of gentrification and less variation are likely due to the fact that Seattle’s older housing stock is relatively newer, with 39 percent of its housing stock built since 1970 compared with 23 percent in Chicago. Thus, Seattle’s share of older housing that is visibly well maintained is higher. Moreover, Seattle’s housing market also suffered to a lesser degree during the recession: in 2008, the foreclosure rate in the Chicago metropolitan area was nearly three times the rate in the Seattle metropolitan area.
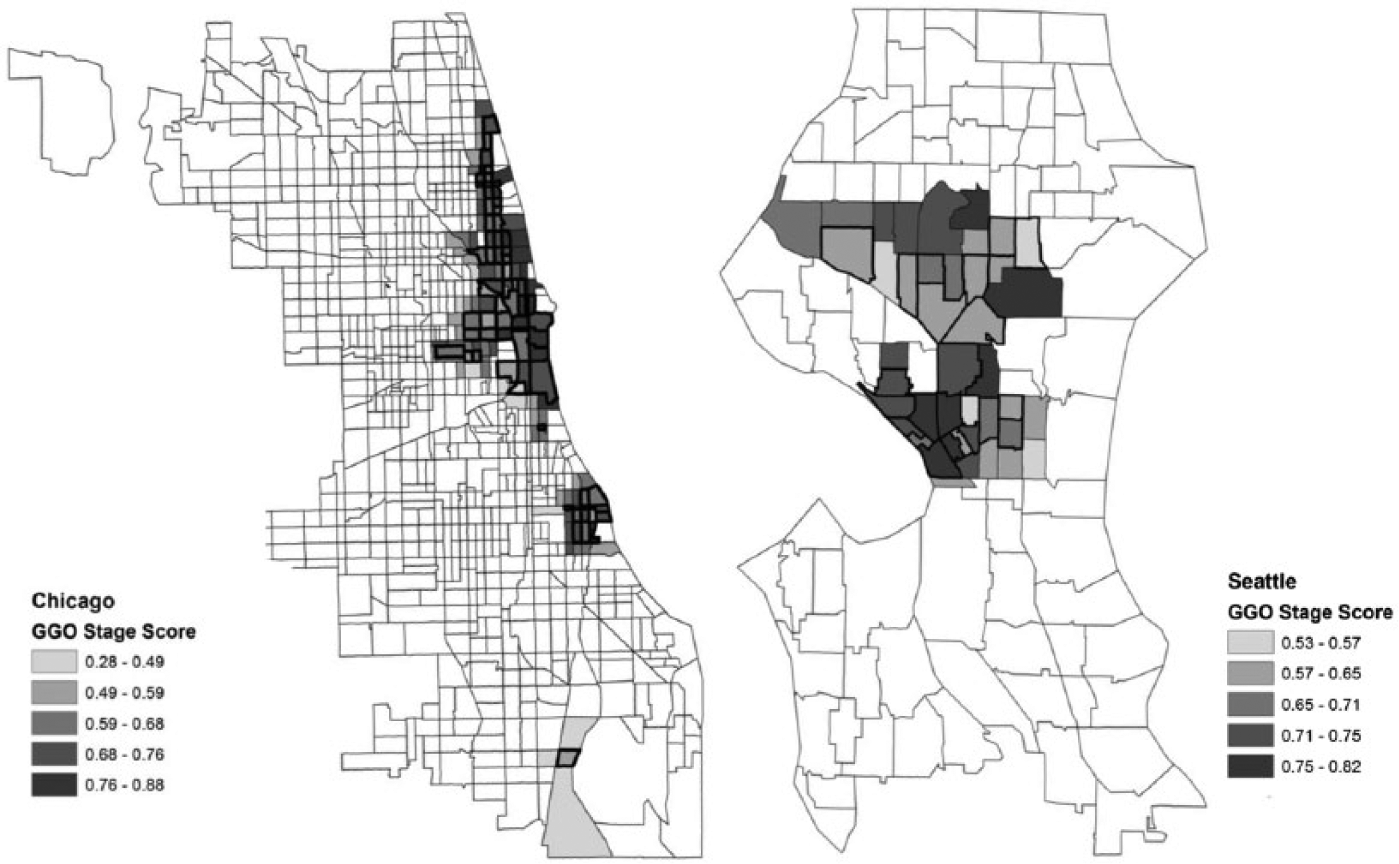
Maps of Chicago and Seattle by Gentrification Stage Scores
Table 5 shows how the overall gentrification stage scores correlate with racial, ethnic, and nativity characteristics of census tracts from 2000 and changes from 2000 to 2009. In 2000, the census began providing data on race and ethnicity by nativity. The bivariate correlations in both cities reveal a racial ordering such that the share of whites has the strongest positive association and the share of blacks has the strongest negative association with gentrification levels. In both cities, Hispanics also have a negative association with gentrification levels. Although tracts with large shares of Asians in Chicago were associated with gentrification across all gentrifiable tracts, Asians are not associated with gentrification levels in either city among gentrifying tracts and their adjacent tracts. Moreover, there are distinctions between native and foreign-born blacks in both cities and native and foreign-born Hispanics in Seattle.
Correlations between Gentrification Stage Scores and Race, Ethnicity, and Nativity
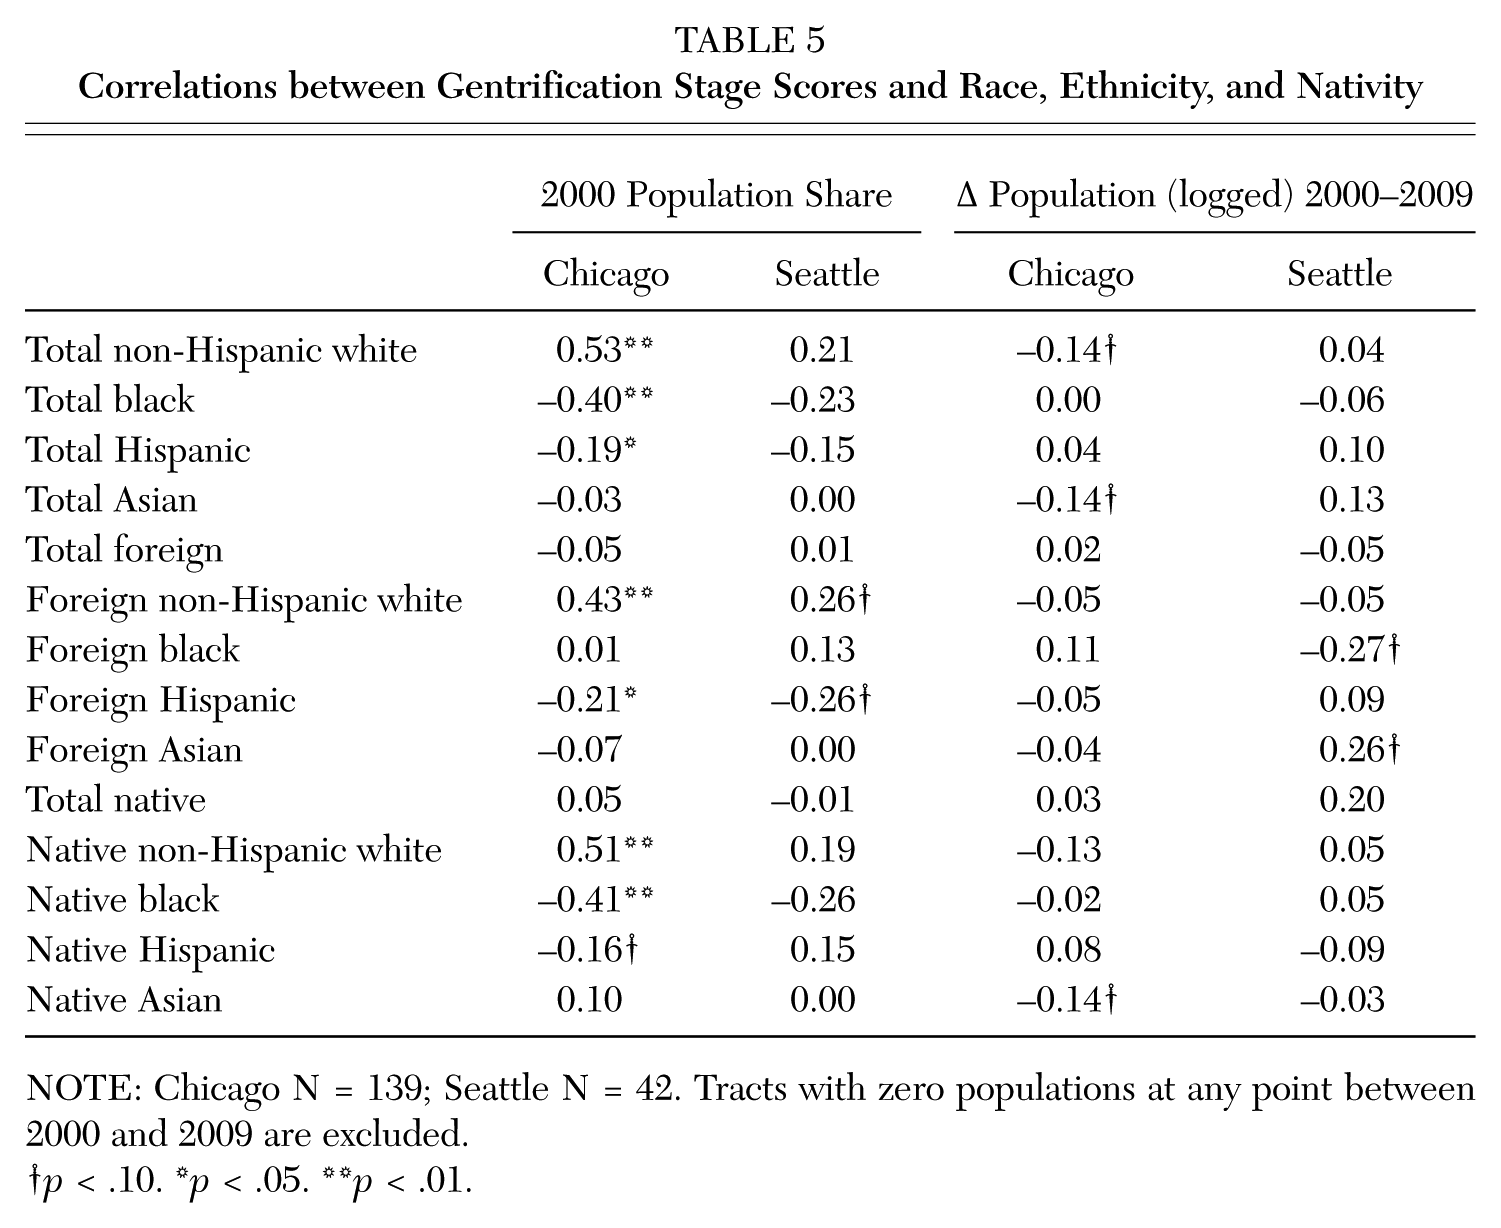
NOTE: Chicago N = 139; Seattle N = 42. Tracts with zero populations at any point between 2000 and 2009 are excluded.
p < .10. *p < .05. **p < .01.
Population changes are weakly correlated with gentrification levels for most groups. Nonetheless, changes in the native-born white and Asian populations are negatively associated with gentrification levels in Chicago, which may reflect an increasing diversity among these tracts. Changes in foreign-born blacks, who comprise a far greater share of the foreign-born population in Seattle than in Chicago, were negatively associated, and changes in foreign-born Asians were positively associated with gentrification levels in Seattle. In both cities, however, the native and foreign-born populations for each racial and ethnic group tend to concentrate in similar areas, though less so in Seattle.
As a last step, I examined these relationships after accounting for the degree to which these neighborhoods had gentrified according to Hammel and Wyly’s field surveys and the simultaneous racial, ethnic, and nativity changes occurring in these neighborhoods. I used weighted least squares regression models in which the dependent variable is the gentrification stage score and weights are the square root of the number of blocks observed using Google Street View in each census tract, thus accounting for variation in the amount of coded data for each tract. To examine differential effects between cities, I also include interaction terms in all models for the main racial, ethnic, and nativity variables and a dummy variable indicating that a tract is in Seattle. Figure 2 displays the estimated effects and 95 percent confidence intervals for each city based on models estimating the association of groups by race, ethnicity, and nativity with the trajectory of gentrification. The estimated effects for the racial, ethnic, and nativity variables represent the change in the gentrification stage score given a one standard deviation change in the respective independent variable. The models are as follows: (1) 2000 nativity composition; (2) 2000 racial and ethnic by nativity composition; (3) 2000–2009 nativity composition changes; and (4) 2000–2009 changes in racial and ethnic composition by nativity. See the online supplement for distribution details for each variable and full regression tables. 8
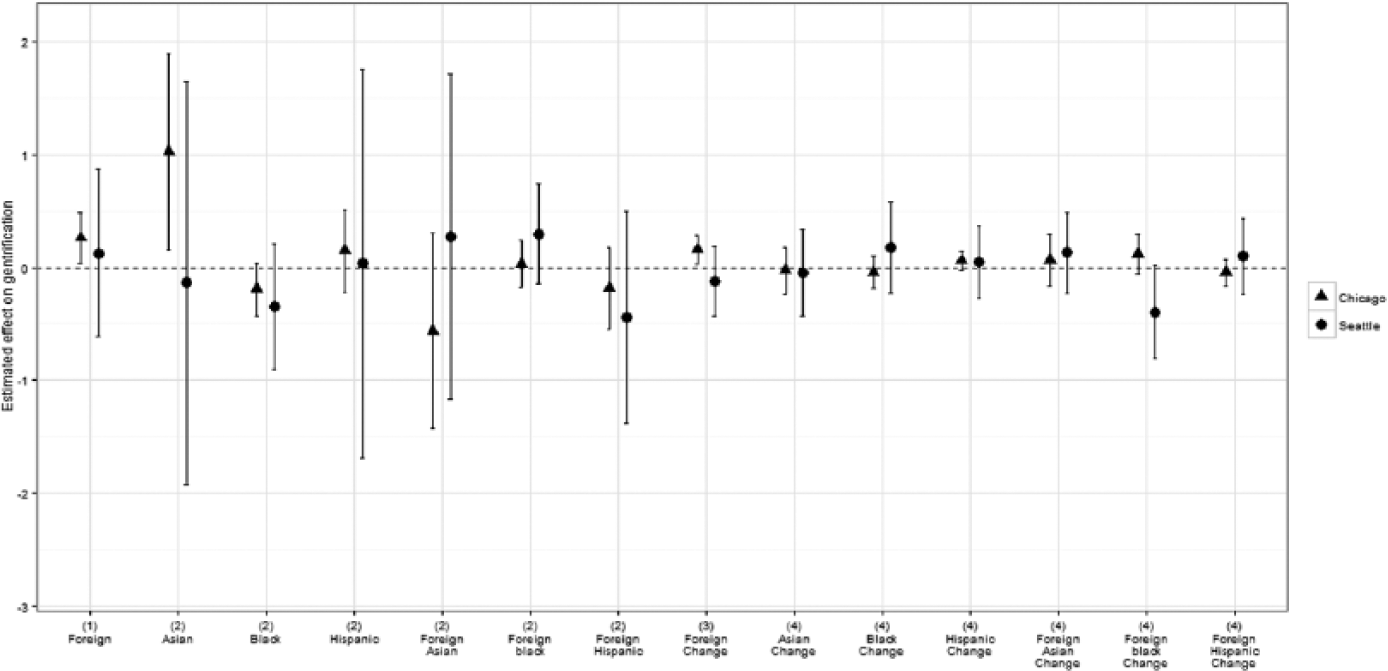
Regression Results and Confidence Intervals Predicting Gentrification Stage Scores
The results from the first model show that the 2000 foreign-born population is positively associated with the degree to which neighborhoods gentrified over the next several years in Chicago. In the second model, the Asian population in Chicago, but not in Seattle, predicts continued upward trajectories of gentrification. Results for other racial, ethnic, and nativity groups are not statistically significant. 9 The third model, which examines changes in the foreign-born population over time, shows that increases in the foreign-born population are also associated with the degree to which neighborhoods have gentrified over the last several years in Chicago. In the final model, in contrast to Chicago, changes in the foreign-born black population in Seattle are negatively associated with the trajectory of gentrification. Overall, once I account for the prior degree to which neighborhoods had gentrified during the 1990s and other population changes, the results show that foreign-born and Asian populations are positively associated with the degree of gentrification in Chicago. Moreover, the degree of gentrification is positively associated with declines of foreign-born blacks in Seattle.
Conclusion
This article demonstrates that immigration and its associated racial and ethnic changes are linked to gentrification, but this relationship is structured by the broader racial and immigration contexts of the cities in which these changes take place. Nationally, cities with higher levels of immigration had greater rates of gentrification. At the neighborhood level, the early arrival of immigrants, Hispanics, and Asians was associated with subsequent gentrification, and these effects were stronger in neighborhoods with larger shares of blacks. In Chicago, a city with high levels of residential segregation by race and high levels of Hispanic immigration, foreign-born residents and Asians were associated with early waves of gentrification and more positive neighborhood characteristics compared with black and Hispanic neighborhoods. In recent decades, however, Hispanics have become negatively associated with gentrification in Chicago: while Hispanics may have contributed to the initial stability of these neighborhoods, their continued rapid growth in the city may have resulted in ethnic enclaves to which new arrivals are more likely to move. In Seattle, a predominantly white city but with high levels of Asian immigration, nonwhite and nonnative immigrants were negatively associated with gentrification and characteristics of neighborhood quality. In recent decades, foreign-born residents, Hispanics, and Asians were not associated with the degree to which neighborhoods gentrified, but neighborhoods that gentrified to a greater degree had greater declines in their foreign-born black populations.
Although the findings presented in this article are preliminary, they suggest that racial hierarchies of inequality operate and adapt in contexts of change. The durability of neighborhood inequality and the persistence of poor, minority neighborhoods are dominant trends in most major American cities, and the patterns documented here show how gentrification unfolds along similar lines that have governed this residential stratification. Despite the rise of gentrification over the last several decades, black neighborhoods in highly segregated cities such as Chicago, particularly those not impacted by immigration, are the least likely to experience reinvestment and renewal. Even among neighborhoods that showed signs of gentrification during the 1990s or were adjacent to them, these neighborhoods are least likely to continue on upward trajectories. In predominantly white but diversifying cities such as Seattle, nonwhite/nonnative neighborhoods were least likely to gentrify; among neighborhoods that gentrified or were adjacent to them, foreign-born blacks attenuated the continued upward trajectories of these neighborhoods. Thus, the order of gentrification from one of simply whites and natives over nonwhites and nonnatives in Seattle became increasingly similar to that found in Chicago, as racial and ethnic distinctions among foreign-born residents formed.
As city leaders hope for urban revitalization through gentrification and efforts to attract immigrants, understanding the implications that these changes have for residential segregation and racial and ethnic inequality are necessary considerations to ensure that the truly disadvantaged do not continue to be left behind. In one sense, the findings provide hope for low-income, minority neighborhoods that experience influxes of immigrants and increased racial diversity, by showing that they can attract reinvestment and renewal. For the minority neighborhoods that remain in decline, policy interventions are crucial. The evidence is strong on the detrimental effects of concentrated poverty on both individual life chances and the costs on society. Disadvantaged minority neighborhoods need substantial and sustained targeted reinvestment that provides opportunities, resources, and institutions for their residents and that simultaneously protects against the loss of affordable housing as these neighborhoods improve. Based on past trends, reliance on market-based forces such as gentrification without strong policy interventions will inevitably perpetuate and perhaps worsen racial inequality.
Footnotes
NOTE:
This research was supported by the National Science Foundation Graduate Research Fellowship (Grant No. DGE-1144152) and the NSF-IGERT Multidisciplinary Program in Inequality and Social Policy at Harvard University (Grant No. 0333403).
Notes
Jackelyn Hwang is a PhD candidate in sociology and social policy and a doctoral fellow in the Multidisciplinary Program in Inequality and Social Policy at Harvard University. Her research examines the relationship between racial and ethnic inequality and neighborhood change in U.S. cities.
References
Supplementary Material
Please find the following supplemental material available below.
For Open Access articles published under a Creative Commons License, all supplemental material carries the same license as the article it is associated with.
For non-Open Access articles published, all supplemental material carries a non-exclusive license, and permission requests for re-use of supplemental material or any part of supplemental material shall be sent directly to the copyright owner as specified in the copyright notice associated with the article.