
Abstract
This article reviews the contributions of the Panel Study of Income Dynamics (PSID) to the study of intergenerational mobility. The PSID enables researchers to track individuals as they form new households and covers many dimensions of socioeconomic status over large portions of the life cycle, making the data ideal for studying intergenerational mobility. Studies have used PSID data to show that the United States is among the least economically mobile countries among advanced economies. The PSID has been instrumental to understanding various dimensions of intergenerational mobility, including occupation; wealth; education; consumption; health; and group differences by gender, race, and region. Studies using the PSID have also cast light on the mechanisms behind intergenerational persistence.
A fundamental question of American society is whether economic opportunity is equally available to all its citizens. Do all children, irrespective of their parents’ socioeconomic status, have the same chances of achieving lifetime economic success? Or are there disparities in economic opportunity that persist from generation to generation? Researchers asking that question 50 years ago would have very little to say, as there was no data source—no nationally representative intergenerational sample—that would allow for a fully satisfactory answer. However, with the introduction of the Panel Study of Income Dynamics (PSID) in 1968, along with other data sources, we have learned a great deal about intergenerational persistence and intergenerational mobility in the last few decades.
In recent decades, a broad consensus has emerged that intergenerational income mobility is actually relatively low in the United States, especially when compared with other advanced economies (e.g., Corak 2013). This suggests that the view of America as a highly mobile society and a “land of opportunity” may be unwarranted. In this article, I discuss how the PSID has been instrumental in shaping this perception, both because it has provided data essential to relevant analyses and because it has led to many critical methodological breakthroughs that, over time, have helped to shape this modern view about intergenerational income mobility.
The PSID has been invaluable to this literature because it is (1) intergenerational, following family members as they form new households; (2) longitudinal, following individuals over many years and covering broad swaths of the life cycle; (3) very rich, collecting detailed information on socioeconomic status, including information on income, occupation, education, health, and family structure; and (4) long-running—the PSID is now 50 years old. It is precisely these dimensions of the data that have enabled researchers to overcome many of the challenges in accurately measuring socioeconomic status in multiple generations. Better measurement, in turn, has led to a revised view of American mobility. Prior to the advent of national longitudinal data like that of the PSID, mobility researchers often relied on nonrepresentative samples that used retrospective reports of parent socioeconomic status and typically had to rely on data from a single point in time to proxy for lifetime status.
In this article, I review a wide variety of contributions made by researchers using the PSID to the broader study of intergenerational mobility, including other dimensions of socioeconomic status such as occupation, wealth, education, consumption, and health. There have also been many studies related to gender, race, geography, and time trends to list a few. For many of these studies, the unique nature of the PSID data has been critical. Figure 1 illustrates the recent rapid growth of published academic papers using the PSID that contain the terms “intergenerational mobility” or “social mobility” in the title. 1 Prior to 2000, there were only a handful of such published papers. Since 2010, however, there have been nearly forty.
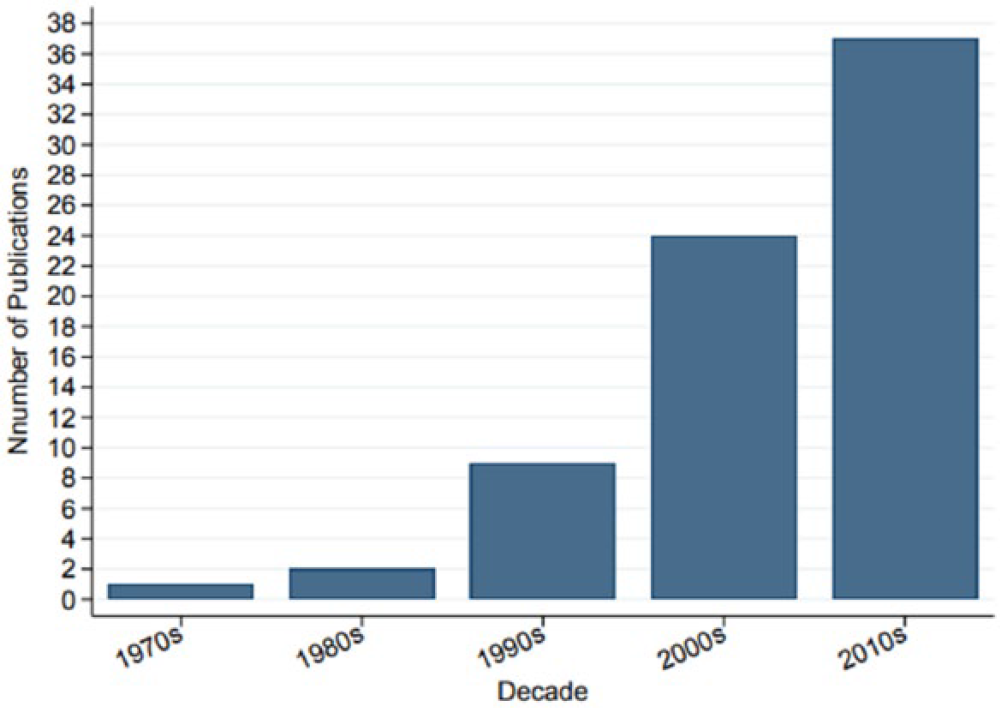
Mobility Terms in Academic Papers That Use PSID, 1970s–2010s
Surveying the literature on intergenerational mobility also highlights some of the key advantages and disadvantages of using the PSID compared to other datasets. Doing this is especially relevant given the new administrative data sources that have become available in an emerging era of “big data.” While on one hand, the PSID has relatively small samples and is subject to sample attrition, on the other hand, it starts with a representative sampling frame and asks many detailed questions that might have no significance for administrative purposes (e.g., tax collection) but are absolutely critical for research and policy purposes. Important questions about family structure, parenting behavior, educational investments, health, wealth, race, and ethnicity are typically absent from administrative sources unless researchers are fortuitous in their ability to link to other sources. Researchers using the PSID to study intergenerational mobility, on the other hand, have been able to exploit individual-level data on educational attainment to show that investment in human capital is critically important to economic mobility and worthy of attention in public policymaking.
Furthermore, since the PSID now goes back 50 years, it continues to retain a comparative advantage for studying intergenerational mobility over tax data that has only been stored and digitized more recently. Indeed, the use of administrative data has led some researchers to overstate the level of intergenerational mobility in the United States (Mazumder 2016). Overall, then, there remains an incredibly valuable role for the use of intergenerational survey data and, in particular, for the long-running panel data available in the PSID for many of the most salient questions about our society. In the coming decades, I suspect that researchers will find it increasingly important to use survey data in combination with administrative data to meet research challenges.
Evolution of Estimates of Intergenerational Income Mobility in the United States
In this section, I illustrate how the PSID has been instrumental in overcoming the key methodological challenges to estimating intergenerational income mobility. 2 I begin by describing one key measure of intergenerational income mobility. I then turn to a review of some of the influential studies in economics and how they have led to an evolution in the literature’s view of the rate of income mobility in the United States.
Intergenerational income elasticity (IGE)
The most widely used approach to studying intergenerational income mobility is to estimate the degree of income persistence across generations. When intergenerational income persistence is very high, then this implies that income mobility is low. In the economics literature, the most commonly used measure is the IGE. 3 The IGE is the estimate of β obtained from the following regression:
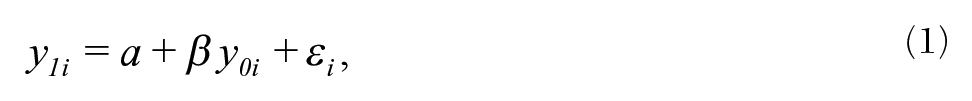
where y1i is the log income of the child’s generation and y0i is the log of income in the parents’ generation. 4 If, for example, the IGE is 0.2, then this would imply that approximately 20 percent of existing income gaps between families would be expected to persist to the next generation and that these gaps would largely disappear within three generations. In contrast, an IGE of 0.6 paints a dramatically different picture of mobility, where income differences persist for five or six generations (Mazumder 2005b). 5 Where exactly the United States and other countries lie on this spectrum has been a central question in the intergenerational income mobility literature.
Implications of better data and methods on mobility estimates
The earliest studies put the IGE in the United States at around 0.2, which implies relatively rapid mobility. A seminal study in this literature by Solon (1992), however, fundamentally reshaped the debate. Solon showed that the estimates in previous studies were heavily downward biased because they typically relied on using only a single year of income to proxy for parents’ permanent or lifetime income. 6 Using just a single year of income contains a significant amount of noise due to measurement error and year-to-year “transitory” fluctuations. If instead one uses multiyear averages of parent income, estimates of the IGE rise considerably, as the noisy component of parent income is averaged away, and the measure now more accurately reflects permanent income.
Solon’s (1992) paper used PSID data for the empirical analysis because, by the mid-1980s, some of the children who were in the original PSID households in 1968 had entered adulthood and their income could be observed. The PSID, of course, had also collected their parents’ income over multiple years, so Solon could produce new and better estimates of the IGE. Using up to five-year averages of fathers’ income, Solon concluded that the IGE in the United States between fathers’ and sons’ income was 0.4 “or higher.” Table 1, which reproduces Table 2 in Solon, shows the IGE estimates as the time average of fathers’ income is gradually increased. In the same issue of the American Economic Review in which Solon’s article was published, Zimmerman (1992) reached a similar conclusion by using longitudinal data from the National Longitudinal Survey (NLS). Since that time, many papers across a wide number of countries have relied on using multiyear time averages to produce estimates of the IGE. 7 Several cross-country studies, starting with Björklund and Jäntti (1997), have compared U.S. rates of intergenerational mobility using the PSID to analogous estimates from other countries. 8 The consensus is that intergenerational mobility in the United States is relatively low compared to other advanced economies (Corak 2013).
Estimates of the IGE from Solon (1992)
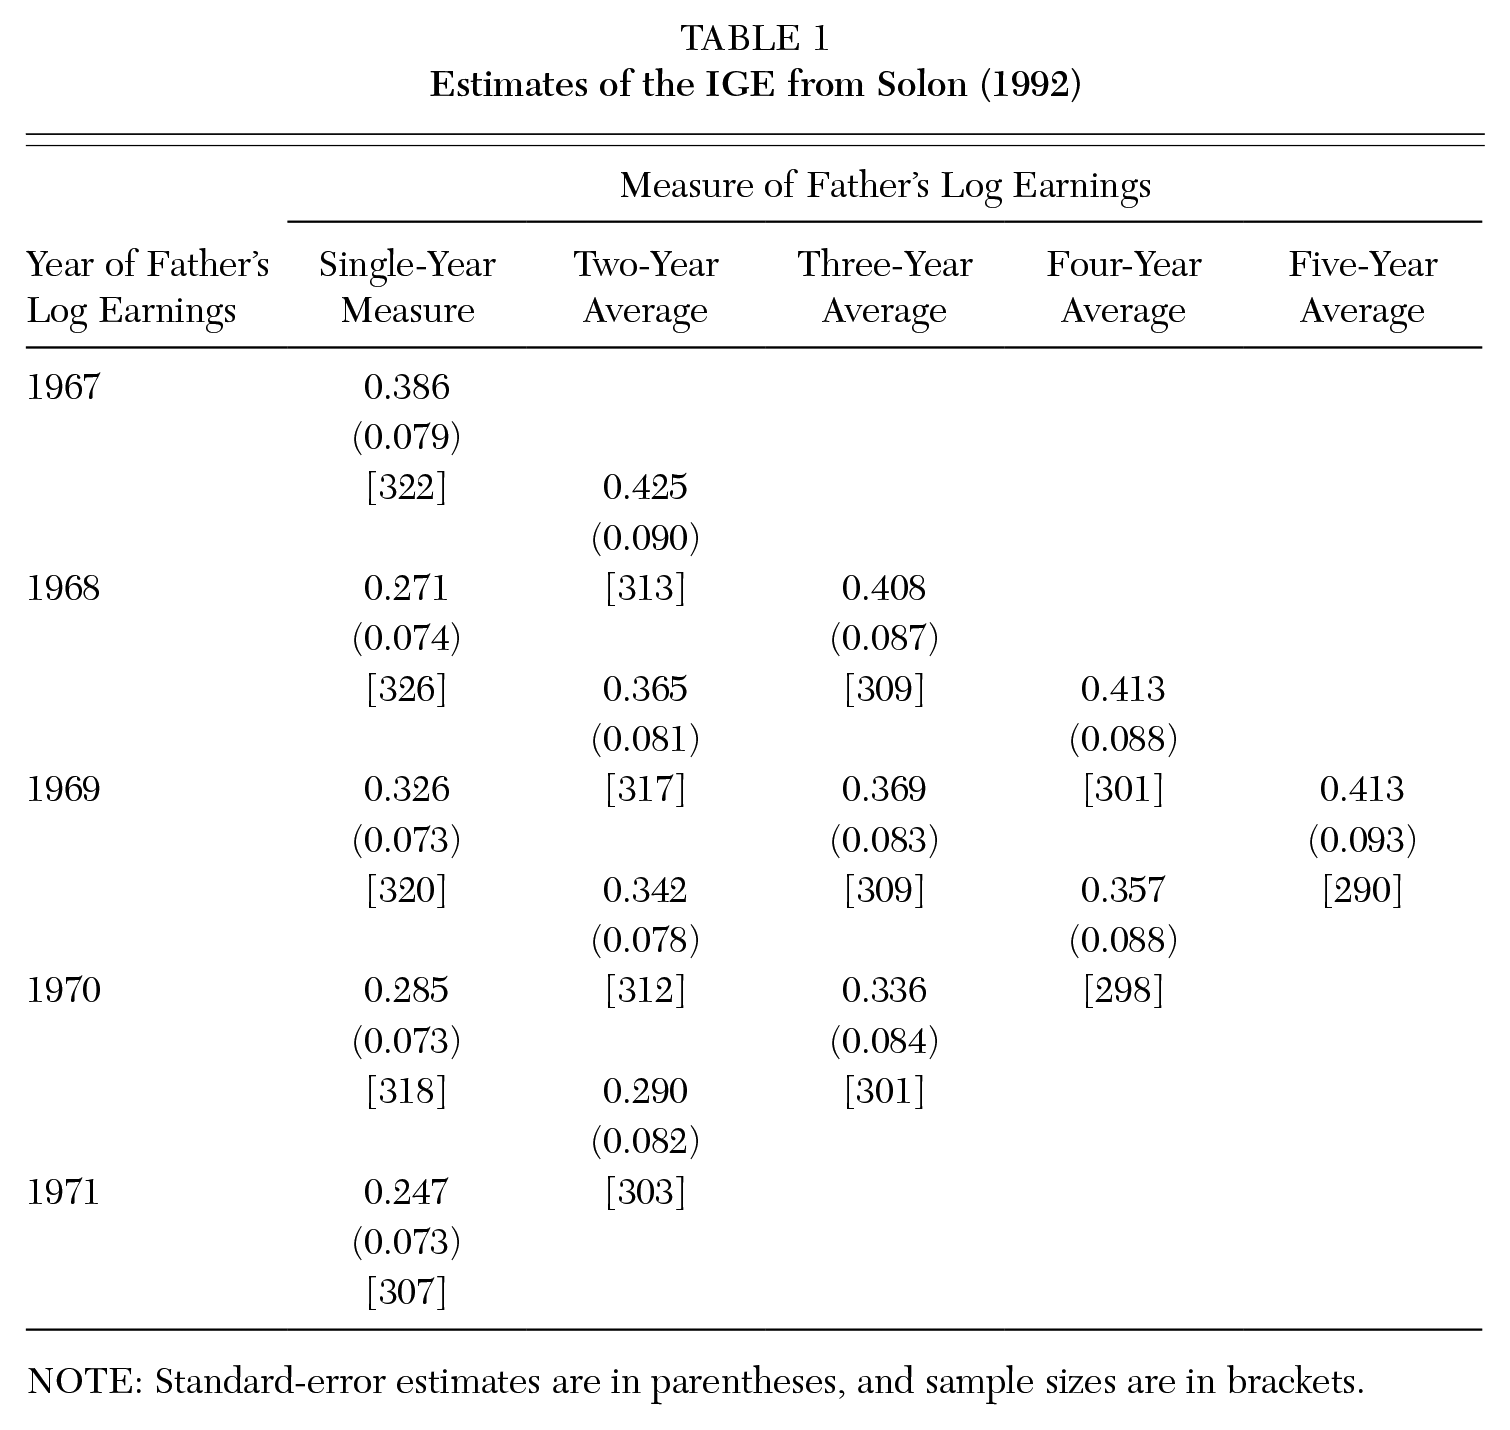
NOTE: Standard-error estimates are in parentheses, and sample sizes are in brackets.
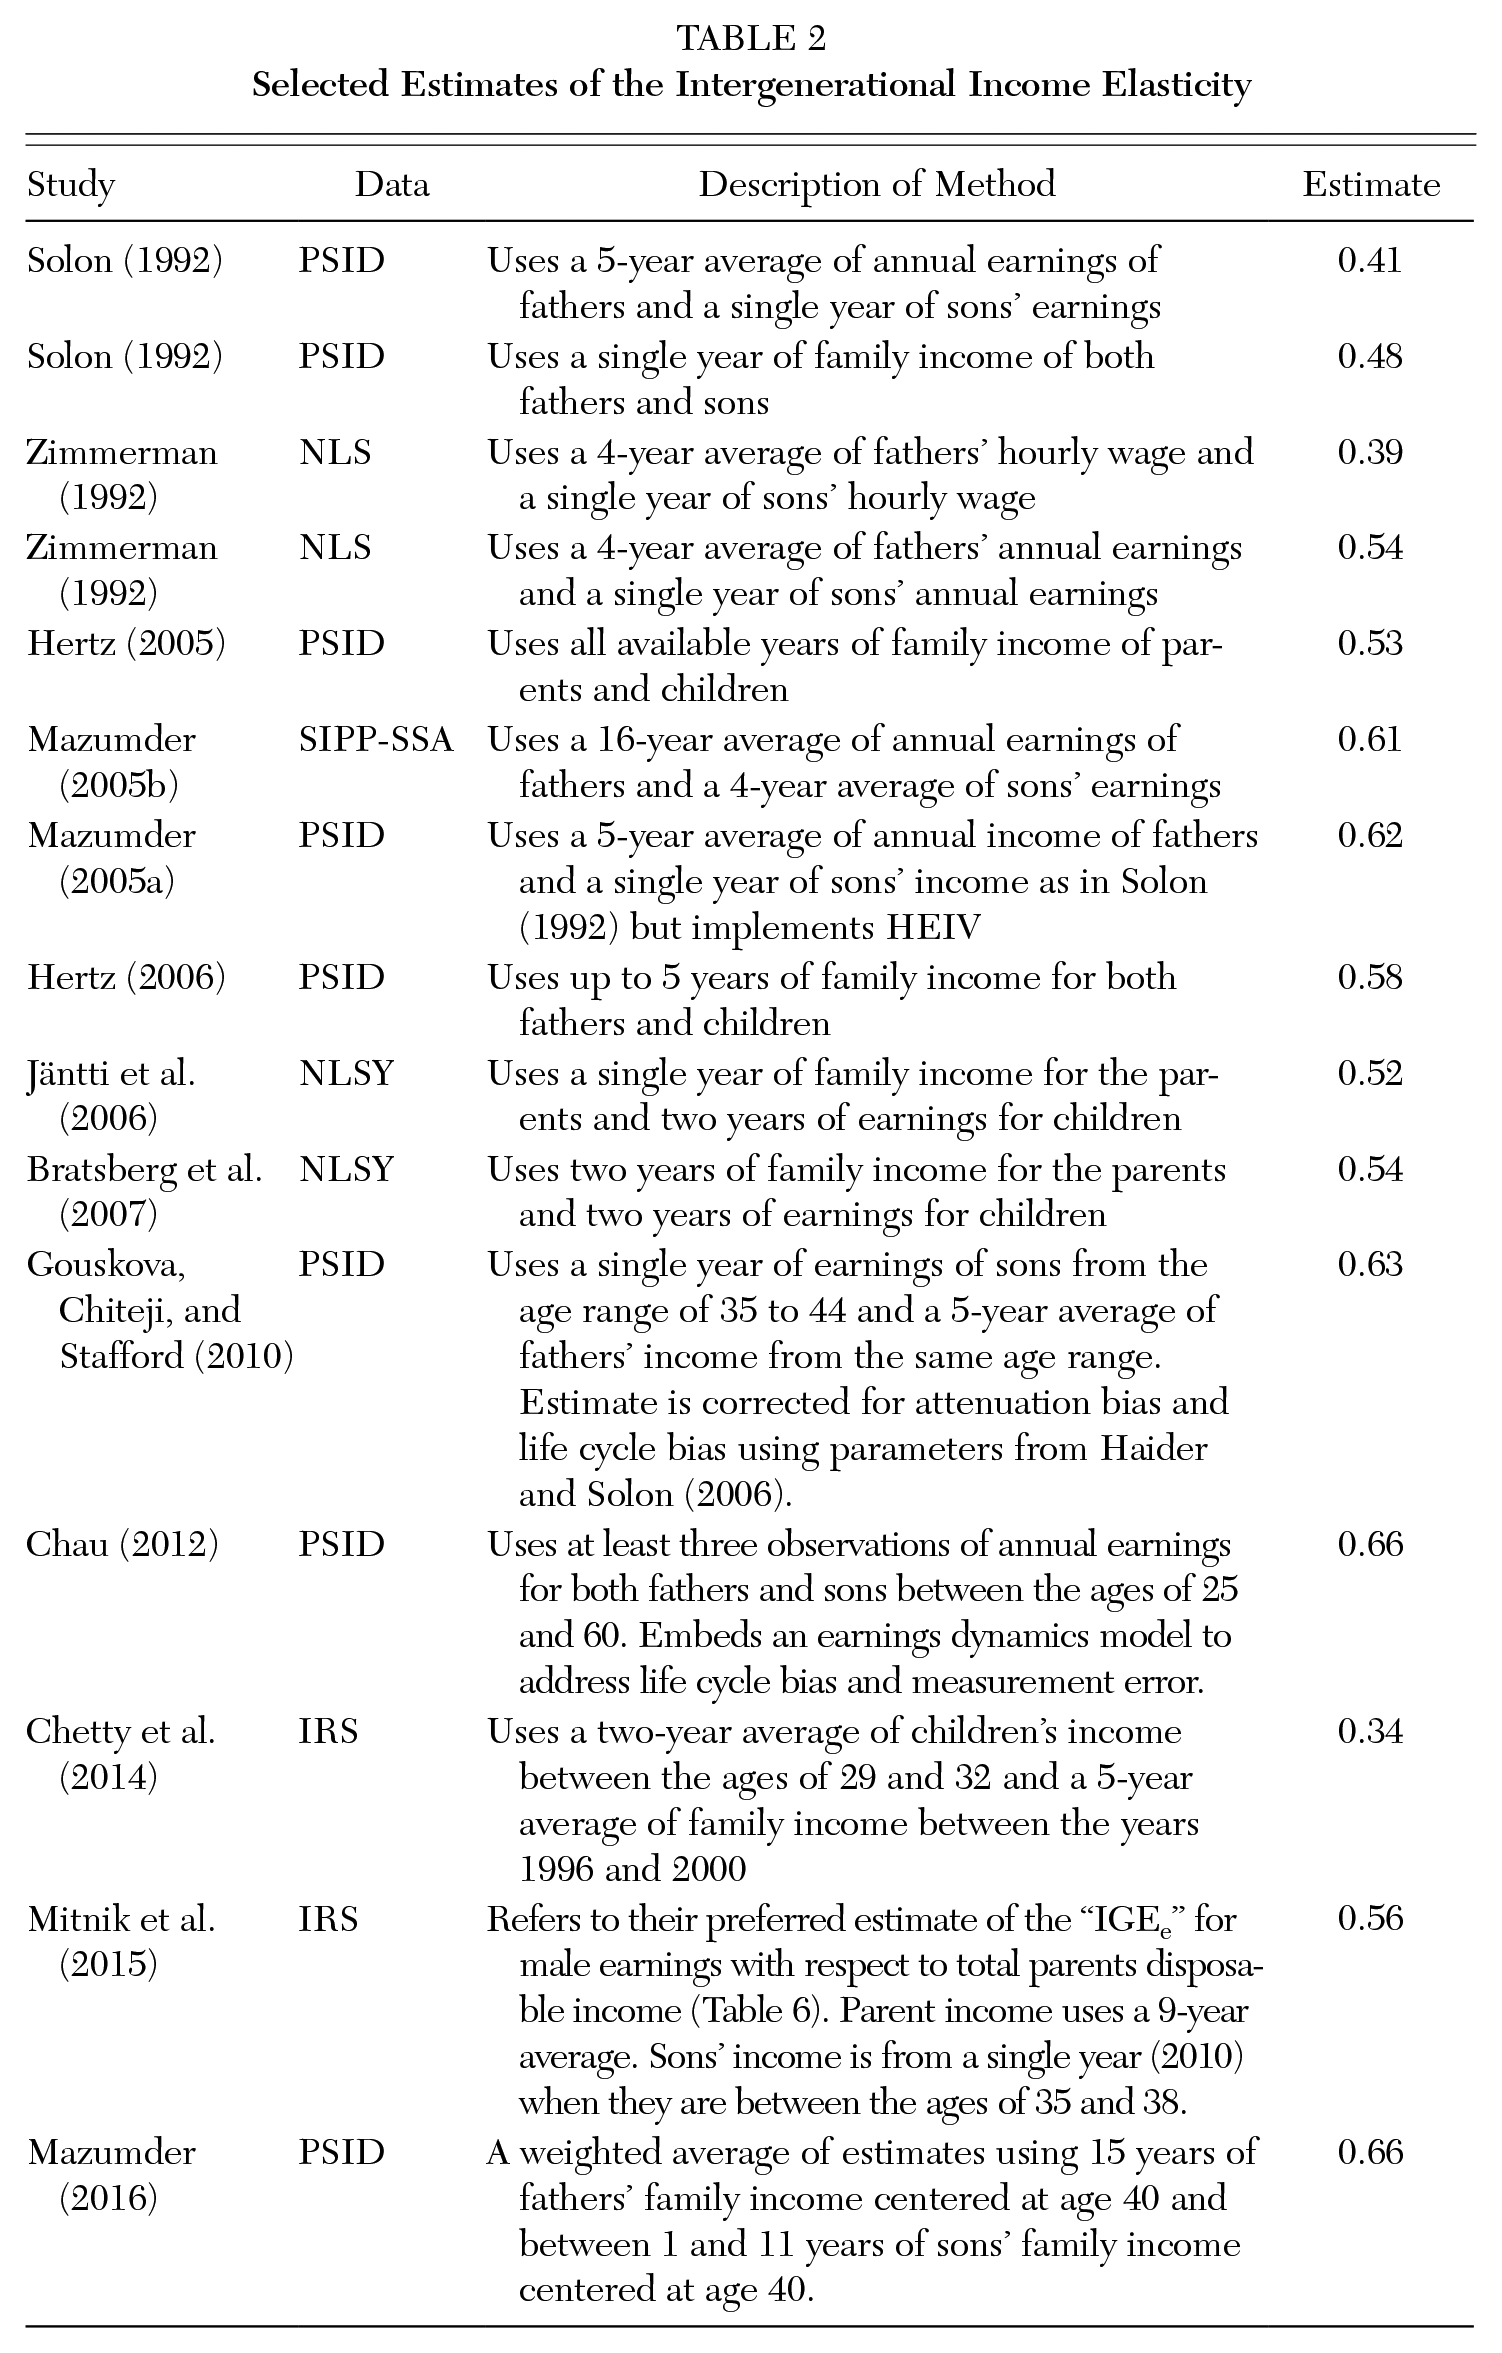
Selected Estimates of the Intergenerational Income Elasticity
Researchers have further expanded upon data and measurement issues since Solon (1992). Mazumder (2005b), using data from the Survey of Income and Program Participation (SIPP) linked to Social Security administrative earnings records, showed that even using five-year averages could lead to considerable downward bias since the transitory component of the earnings variance can persist over many years. Mazumder (2005b) estimated the IGE in earnings to be around 0.6 when using up to 16-year averages of fathers’ earnings. In a separate article using the PSID, Mazumder (2005a) replicated Solon and used a correction technique, heteroscedastic errors-in-variables (HEIV), to address the bias from using relatively short time averages and estimated the IGE to be around 0.6. 9 A number of papers using both the PSID and other datasets have estimated the IGE with respect to family income to be around 0.5 or higher. 10
Another strand of the literature on intergenerational mobility highlights a phenomenon known as life cycle bias (e.g. Jenkins 1987; Solon 1992; Grawe 2006; Böhlmark and Lindquist 2006; Haider and Solon 2006). Here, the idea is that because of heterogeneity in life cycle earnings profiles, estimates that are produced using the income of children when they are particularly young can lead to severely downward biased estimates of the IGE. 11 This is because children who end up with high lifetime income often have relatively low income at young ages. One rule of thumb that largely overcomes this life cycle bias is to measure children’s income at an age close to 40 (Haider and Solon 2006).
In a recent article, Mazumder (2016) estimates the IGE using long time averages of parent income in addition to dealing with life cycle bias. Taking advantage of the very long panel length and life cycle coverage of the PSID, Mazumder uses up to 15-year averages of fathers’ income and centers the time averages of income in each generation at age 40. Mazumder estimates the IGE in family income to be even greater than 0.6. Figure 2 plots the IGE estimates from Mazumder (2016) as progressively longer time averages are used for fathers’ income. Two other articles using other approaches to handle these biases with the PSID also reached similar conclusions. Gouskova, Chiteji, and Stafford (2010), using the PSID, produces a bias-corrected estimate of the IGE of 0.63 by using estimates of the degree of life cycle bias from Haider and Solon (2006). Chau (2012) attempts to correct for life cycle bias by embedding an earnings dynamics model in addition to utilizing long time spans of income data and also estimates the IGE to be higher than 0.6.
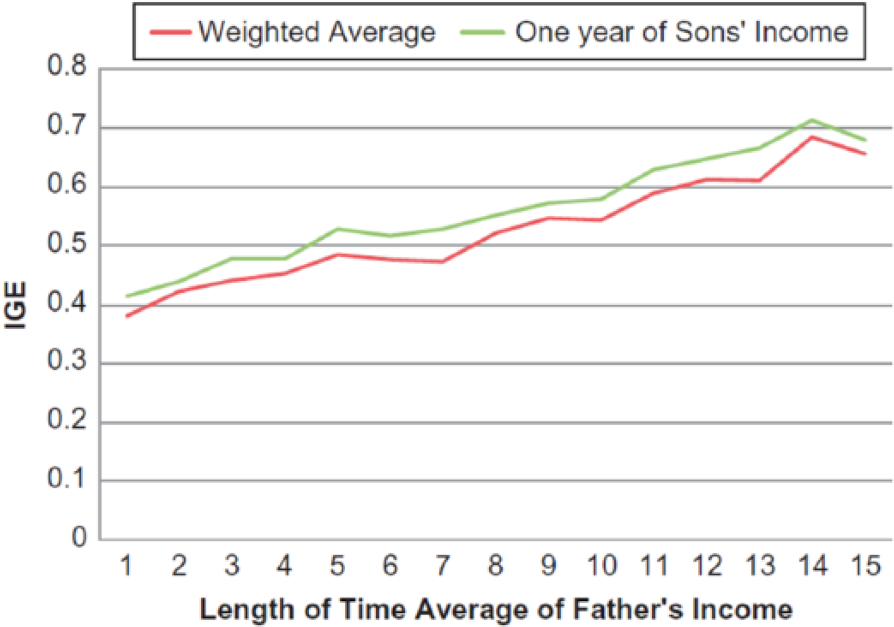
Effects of Time Averaging on Father-Son IGE in Family Income
Pitfalls of administrative tax data
One anomalous finding is the IGE estimate of just 0.34 from the highly influential study of Chetty et al. (2014), which used population-wide data culled from IRS tax records. 12 What is especially surprising about this low estimate is that one might have expected that IGE estimates derived from administrative data would be even higher than those produced using survey data like that from the PSID. This is because administrative data would presumably be more accurate than self-reported survey responses and thereby reduce attenuation bias.
So, what explains why the estimates are so much lower than what has been found in other studies? Mazumder (2016) shows that Chetty et al.’s (2014) low IGE estimate is due to some fundamental limitations with the currently available IRS data used to construct their intergenerational sample. The underlying problem is that their data begin only in 1996 and end in 2012, thereby covering just 17 years, compared to the nearly 50 years of coverage in the PSID. Therefore, to construct an intergenerational sample, Chetty et al. focus on cohorts born from 1980 to 1982. This allows them to observe their parents’ income from 1996 to 2000, when the children are between the ages of 15 and 20, and their own income as adults in 2011 and 2012 when they are between the ages of 29 and 32.
Their conclusions, therefore, are problematic. First, the age at which the children’s income is observed is still relatively young and still prone to significant life cycle bias according to the results shown in Haider and Solon (2006). Moreover, the particular years chosen are ones in which unemployment is quite high and so many children report zero income, thereby making the log-log specification sensitive to how one chooses to handle the zero income observations. In contrast, had Chetty et al. (2014) observed a wider period of the life cycle during the children’s prime earnings years, for example, covering the ages of 35 to 45, they would have been able to overcome both these problems. Second, parents’ income is also measured for only a short period (five years) and at a relatively late period in life when many fathers are well into their 50s. Previous studies have shown that a substantial share of the variance in income at these ages are due to transitory fluctuations (Mazumder 2001; Baker and Solon 2003), which leads to substantial attenuation of the IGE relative to what would be found if one used lifetime income for the parents (Haider and Solon 2006; Mazumder 2005b). Third, studies have shown that administrative data can sometimes lead to worse measurement error than survey data, particularly at the bottom end of the income distribution (e.g., Abowd and Stinson 2013; Hokayem, Bollinger, and Ziliak 2015). This may explain why Chetty et al. (2014) report that their IGE estimate rises to 0.45 when they trim their sample to include only families between the 10th and the 90th percentile of the parent income distribution. Figure 3, taken from Mazumder (2016), provides a visual representation of an ideal intergenerational dataset and contrasts this with the data limitations of the IRS data.
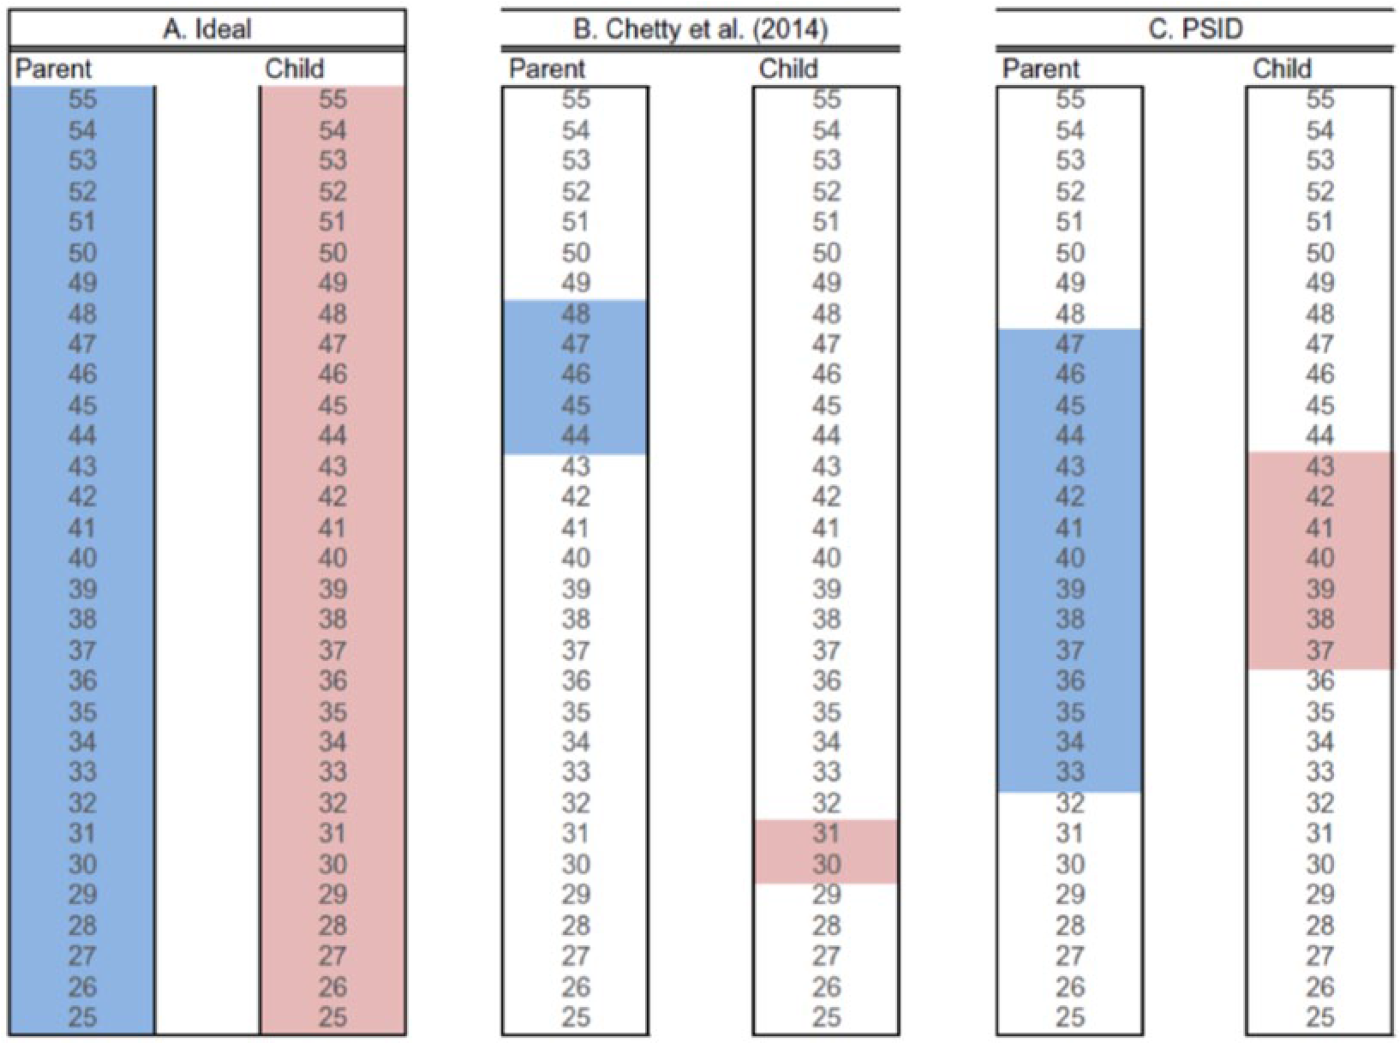
Comparison of Life Cycle Coverage across Different Intergenerational Samples
Mazumder (2016) then conducts some empirical exercises to validate this explanation. He uses the much larger panel length of the PSID to show that one can essentially mimic the much lower IGE estimates found in Chetty et al. (2014) with survey data by imposing the same data restrictions. Mazumder finds that if he measures children’s adult income using a two-year average when they are between the ages of 29 and 32 and uses just a five-year average of fathers’ income centered at age 46, then the estimates range from 0.28 to 0.33 depending on the sample. These estimates are quite close to what Chetty et al. (2014) find. 13 Consistent with these findings are the results in Mitnik et al. (2015), who use a different IRS sample that includes up to nine years of parent income and observes children’s income between the ages of 35 and 38. Mitnik et al. obtain estimates of the IGE ranging from 0.55 to 0.74.
Summary of the IGE in income in the United States
In my view, the best estimate of the IGE for the United States is around 0.6. This result has now been obtained in a number of studies using a variety of data sources and methodological approaches including several studies using the PSID. Table 2 presents a selected summary of estimates of the IGE along with the data source and method used. To recap, studies that produce estimates of around 0.6 include Mazumder (2005b) using the SIPP matched to Social Security Administration (SSA) administrative earnings records; Mazumder (2005a) using the PSID; Gouskova, Chiteji, and Stafford (2010) using the PSID; Chau (2012) using the PSID; Mitnik et al. (2015) using IRS data; and Mazumder (2016) using the PSID.
Other Topics in the Study of Intergenerational Mobility
In addition to the literature on intergenerational income mobility described above, the PSID has made an important contribution to other literatures as well. Below, I highlight some studies that use the PSID to study topics including: occupation, wealth, education, consumption and health; differences across subgroups of the population (gender, race and region); time trends in intergenerational mobility; sibling correlations and mutigenerational correlations; and the pathways underlying intergenerational persistence.
Occupational mobility
Modern studies of intergenerational mobility were pioneered by sociologists who focused on measures of occupational status. 14 Many of these studies have used survey data such as the Occupational Change in a Generation (OCG) and the NLS. Similar to the earlier income mobility literature, these studies have typically focused on occupation-based measures at a particular point in time, or age. However, research by Kambourov and Manovskii (2008) using the PSID shows that individuals are changing their occupation much more often over the life course in recent decades. This suggests that it may be important to measure occupational mobility over longer periods and at different ages. Mazumder and Acosta (2015) exploit the long panel dimension of the PSID to measure intergenerational mobility in occupational prestige using up to 15 years of information on occupation. They find that, as with income, intergenerational persistence in occupational prestige rises as one takes longer time averages. In contrast to the income mobility literature, however, the highest estimates of occupational persistence are found when fathers are in their late career. 15 Such an analysis would be extremely difficult, if not impossible, to do with any other data source.
Wealth mobility
Another important aspect of economic status is wealth. Wealth provides a measure of accumulated income so it may be an especially useful gauge of available economic resources. Wealth can be critical for families in their ability to invest in children’s human capital. Wealth is also easily transmitted across generations though inter-vivos transfers and end-of-life bequests. However, data on wealth are much more difficult to obtain than income, and prior to the PSID, studies of U.S. wealth mobility relied on unrepresentative samples. For example, one of the earliest studies of intergenerational wealth mobility (Menchik 1979) used historical probate records among parents and children who died in Connecticut.
All modern studies of intergenerational wealth mobility in the United States that I am aware of have used the PSID. Starting in 1984, the PSID has asked respondents about their assets every five years and then in every wave since 1999. The first studies using the PSID found relatively low intergenerational associations but relied on measuring child wealth at relatively young ages. Charles and Hurst (2003) estimate the intergenerational elasticity in wealth to be 0.37. Conley and Glauber (2008) produce an even lower estimate of 0.28. Mulligan’s (1997) estimate is 0.32. Measuring wealth later in the life cycle, Pfeffer and Killewald (2015, 2018) produce estimates of the intergenerational elasticity and rank-rank correlations that are generally slightly higher than 0.4. It will be interesting to see if these estimates rise further as more PSID respondents are followed into even later ages in the coming decades.
What is notable is how few studies of intergenerational wealth mobility exist around the world. Even in the Nordic countries, which have produced many studies of intergenerational income mobility, only a few articles have examined wealth mobility and even these may not cover all forms of wealth. 16 This is, in large part, because administrative data sources like tax registers only contain information on wealth if it is relevant for tax purposes. This is also why there is no study on intergenerational wealth mobility in the United States using IRS data. The PSID overcomes this limitation.
Educational mobility
Intergenerational persistence in educational attainment provides another useful measure of mobility since it captures a key dimension of human capital that translates into economic success. Hertz et al. (2007) conduct a particularly impressive analysis of intergenerational educational mobility across forty-two different countries. They describe a number of practical advantages to using years of education as a measure of mobility: it is asked in nearly all major household and labor force surveys, it is a relatively unambiguous concept, and it is generally fixed after early adulthood. For their U.S. analysis, they use the PSID and find that the correlation coefficient for the United States is 0.46—similar to the range of estimates from Couch and Dunn’s (1997) analysis using the PSID. In a recent analysis of time trends in educational mobility, Hilger (2017) uses the PSID in addition to a variety of other U.S. survey datasets and concludes that educational mobility has declined beginning around 1980.
Consumption mobility
A few studies have estimated intergenerational mobility with respect to consumption, including Mulligan (1997), Aughinbaugh (2000), and Charles et al. (2014). 17 Mulligan (1997) makes the important point that from the point of view of economic theory, consumption may be preferable to income since agents derive utility from consumption. Mulligan uses a series of questions from the PSID on consumer expenditures on a few categories of nondurables to derive estimates of intergenerational persistence in consumption of between 0.5 and 0.6. Aughinbaugh produces estimates that are sometimes even higher, ranging from 0.5 to 1 depending on the specification. In contrast, Charles et al. obtain an estimate of 0.29 of the rank correlation in consumption, but they measure consumption for both generations in the same years but at different points in the life cycle. In each case, the estimates are only slighter higher to comparable estimates of income persistence.
Although the PSID data on consumption are limited, 18 it is difficult to imagine any other kind of data source successfully capturing measures of expenditures for two generations. Credit card data hold promise, but one would ideally need the full range of cards used by individuals in two generations. Even then, researchers would ideally want to validate such estimates to linked data on surveys containing traditional measures of consumption.
Health mobility
In economics, there is a growing recognition of health as a key component of human capital and a determinant of socioeconomic status. For obvious reasons, longevity is arguably a fundamental indicator of lifetime utility. Therefore, it may be somewhat surprising that few studies have attempted to investigate intergenerational mobility with respect to health. 19 However, health is notoriously difficult to measure as it is an inherently latent concept. In a recent article, Halliday, Mazumder, and Wong (2018) use the PSID’s questions on self-reported health status to estimate a series of measures of intergenerational mobility. They find that the United States has higher health mobility than income mobility. For example, they report that intergenerational association in permanent health status is about 0.2 to 0.3, which is much lower than the income estimates discussed earlier of around 0.5 or higher. They suggest that social institutions and policies are more effective at disrupting intergenerational health transmission than income transmission.
Halliday, Mazumder, and Wong (2018) also explore heterogeneity in health mobility and find strong evidence of differences by race, region, and health insurance coverage. They also use a unique and rich set of data from the PSID’s 2013 Childhood Retrospective Circumstance Study (CRCS) on childhood variables to show that close to 40 percent of intergenerational persistence in heath can be explained by childhood circumstances.
In the absence of an intergenerational survey dataset like the PSID, it is difficult to imagine how a study like Halliday, Mazumder, and Wong (2018) would be feasible in the United States. There is no administrative data that exist in the United States that contain health records for two generations of families for a nationally representative sample.
Intergenerational income mobility of women
Many studies of intergenerational income mobility have focused exclusively on men’s income. This is largely because of men’s historically higher rates of labor market participation compared to women (Chadwick and Solon 2002). One of the first articles to focus on women was by Chadwick and Solon (2002), who considered broader measures of income that include spouse earnings and women who may not participate in the labor market. They found somewhat weaker transmission of income among women than men and also that assortative mating plays an important role in the intergenerational transmission process.
An important element in widening the analysis to include women was to use broader measures such as family income. This can be done much more easily with a longitudinal household level survey like the PSID than with administrative data sources like IRS data. First, all sources of income can be asked about in survey data. In the IRS data, for example, only certain transfers that happen to be relevant for tax purposes are tracked, so one cannot put together a measure of family income that includes all sources. Second, the PSID tracks family relationships over time, so one does not have to rely on defining families based on a single point.
Racial differences in intergenerational mobility
In the United States the topic of race always figures prominently in any discussion of inequality and opportunity due to the historic legacy of slavery and segregation. The early studies of intergenerational income mobility did not address racial differences, in part because of small sample sizes. Over the last 10 to 15 years, however, a few studies have focused much more attention on the topic and have documented the striking racial disparities in mobility. Hertz (2005) was the first to comprehensively analyze racial gaps in intergenerational mobility. Using the PSID, Hertz showed that blacks were much more likely than whites to stay in the bottom quintile of the income distribution and much less likely to move up the income distribution over a generation.
A number of other studies have built upon Hertz’s work and further validated this finding. Bhattacharya and Mazumder (2011) and Mazumder (2014) also document striking racial gaps in both upward and downward mobility using the National Longitudinal Survey of Youth (NLSY), and the SIPP matched to Social Security administrative earnings data. They also introduce new rank-based measures of mobility and decompose the sources of the racial disparity. Mazumder (2016) shows that most of the gaps in upward and downward mobility can be accounted for by factors apparent by adolescence and captured by test scores. Using the PSID, Fox (2016) finds that wealth plays an important role in influencing upward mobility of whites and downward mobility of blacks.
Geographic differences in intergenerational mobility
One of the most influential articles on intergenerational mobility was by Chetty et al. (2014). This study was primarily about documenting geographic differences in intergenerational mobility across commuting zones in the United States by using millions of tax records. However, Chetty et al. were not the first to show that there were regional differences in intergenerational mobility across the United States. Hertz (2008) used the PSID to document a new method for studying group differences in intergenerational persistence. In an application of his method, he demonstrated that persistence was lowest in the West and highest in the South.
Trends in intergenerational mobility
One active topic of research that has not yet been resolved is whether there have been major changes in intergenerational mobility in the United States over time. For instance, with the rise in inequality starting around 1980, there has been speculation that perhaps intergenerational mobility may have fallen. This is an especially challenging question as intergenerational mobility is an inherently backward-looking concept. The most recent cohorts for which we can currently produce estimates of intergenerational persistence free of the biases discussed previously would have been born in the 1960s up through perhaps the mid-1970s. These cohorts would be in their mid-40s or 50s by 2015, and researchers could be confident in obtaining a long multiyear average of their income over several years of their prime earning years. Policy-makers and the popular press likely are more concerned about the mobility prospects of children growing up today whose experienced rates of intergenerational mobility will not be realized until the middle of the twenty-first century.
A few published studies using the PSID have attempted to address the question of trends in mobility, including Mayer and Lopoo (2005), Hertz (2008), and Lee and Solon (2009). The latter two studies, which used a wide range of PSID cohorts, conclude that there is no evidence of a change in trend. 20 In contrast, a few recent studies using PSID data (Hartley, Lamarche, and Ziliak 2016; Justman and Krush 2013; Justman, Krush, and Millo 2017) show evidence of a striking increase in intergenerational income persistence. A number of other studies using other data sources covering longer and/or earlier time periods also point to a decline in intergenerational mobility (Aaronson and Mazumder 2008; Davis and Mazumder 2017; Hilger 2017).
This may ultimately be a topic for which the PSID can only make limited contributions. First, the relatively small sample size for any given birth cohort make it difficult to estimate statistically significant differences. Second, since the PSID began in 1968, it is most useful for estimating the intergenerational persistence for cohorts born in the 1950s and later. These cohorts only reach their midcareer in the 1990s and later. This may limit the data’s ability to conclusively determine trends that would have affected earlier birth cohorts or for prime-age individuals in the labor market prior to the 1990s.
Sibling correlations and multigenerational correlations
There have also been influential studies using the PSID on broader questions of how family background explains socioeconomic differences—studies that extend beyond looking solely at the influence of parents. These include sibling correlations and multigenerational correlations. The sibling correlation provides an omnibus measure of the overall importance of a wide variety of factors common to growing up in the same family, including parenting practices, school quality, and neighborhood amenities. Reviews of the literature can be found in Solon (1999) and Schnitzlein (2014). Solon et al. (1991) was an important early study that exploited the panel dimension of the PSID to use multiple years of income of siblings to reduce attenuation bias. They estimated the correlation among brothers in annual earnings to be as high as 0.45. Later studies using the PSID by Björklund et al. (2002), Mazumder (2011), and Schnitzlein (2014) also found very similar estimates, as did Mazumder (2008) using the NLSY79. Mazumder (2011) and Halliday and Mazumder (2017) have also extended the sibling correlation approach to examine health outcomes using the PSID data. These studies generally show that the shared components of family background among siblings include much more than just the parental influences captured by intergenerational associations alone.
There is also growing recognition in the literature that there may be important mobility processes that are ignored by just focusing on transmission across one generation. Several studies have exploited the fact that the PSID now extends beyond just two generations to examine multigenerational processes with respect to education (Pfeffer 2014a, 2014b; Song 2016; Song and Mare 2017), occupation (Hertel and Groh-Samberg 2014), income (Wightman and Danziger 2014), and wealth (Pfeffer and Killewald 2018). 21 As a whole, these studies demonstrate that we may gain a deeper and more accurate understanding of socioeconomic mobility by looking beyond just two generations.
Mechanisms behind intergenerational persistence
Over the years, a number of studies have used the PSID to investigate the sources behind intergenerational persistence in the United States. One important theme is the role of education. Eide and Showalter (1999), for example, found that controlling for sons’ education reduced the intergenerational earnings correlation. Torche (2011) uses a number of datasets and explores the importance of education for both occupational and income mobility and finds that there is a U-shaped pattern to the importance of parental influence by education level. Intergenerational associations are lower among the college educated than those with less than college, but then increases among those with advanced degrees.
Other studies have examined a broad range of characteristics in the PSID. Hertz (2006) included a large number of variables, including personality characteristics, habits and behaviors, religion, occupation, and savings and concluded that the central channels by which economic status is transmitted across generations is through education, race, health, and state of residence. Mason (2007) used measures of family values in addition to traditional measures of social class and found that both explained some portion of racial differences in intergenerational mobility.
Advantages and Disadvantages of the PSID for Studying Intergenerational Mobility
Given the growing number of new data sources, including administrative data, that have become available to researchers, it is useful to consider the pros and cons of the PSID for research on intergenerational mobility. The fundamental advantage of the PSID is that the data now extend back 50 years. It therefore covers large portions of the life course for many cohorts of children, with rich information on their parents. The breadth of content of the repeated survey questions enables researchers to construct very long panels of information on key attributes of socioeconomic status, such as income, occupation, health, and wealth. It is the precisely the very long panel length that enables researchers to reduce biases stemming from short-term measures and poor coverage of the life cycle that are currently an issue with administrative data.
Moreover, the PSID asks many questions that are critical for research purposes but are completely unnecessary for administrative purposes. While administrative tax data are ideal for capturing annual measures of income that are relevant for tax purposes, they typically ignore other forms of socioeconomic status such as education, hours of work, consumption, health, wealth, and non-tax-related forms of income, all of which are addressed in the PSID. Administrative data sources may also cover a different universe than the universe that a nationally representative household survey like the PSID is explicitly designed to represent. Survey data also can pinpoint a richer set of family relationships than those defined based only on dependency status for tax purposes. Finally, the PSID is easily accessible to the research community, and the results are therefore easy to reproduce and make the studies more transparent. In contrast, at the moment it is much more difficult for the vast majority of researchers to obtain highly confidential administrative data.
Of course, there are other longitudinal household survey data that also have valuable information for intergenerational analysis. The NLSs are the most prominent example. Their main advantage relative to the PSID is that they follow a much larger sample of a fixed set of birth cohorts. For example, the NLSY79 has tracked children from 1979 through 2016 who were born between 1957 and 1964 where the oldest respondents are now nearly 60 years old. Their main disadvantage relative to the PSID is that they collect much less detailed information on the parent generation, and much of what they do collect is retrospective and subject to recall error. However, an important emerging source for intergenerational analysis is the CNLSY (Children of the NLSY79), which links the detailed information on mothers in the NLSY79 to their children and continues to track the children into adulthood.
A key disadvantage of the PSID is its relatively smaller sample, particularly when compared to administrative data. This limits the value of the PSID for exploring heterogeneity across small subgroups of the population. Another potential disadvantage is sample attrition. For example, studies using the PSID (e.g., Solon 1992; Mazumder 2016) have shown large declines in the size of intergenerational samples once one tries to increase the number of years of observation. Some studies have argued that the biases from attrition are not severe (e.g., Fitzgerald 2011). Schoeni and Wiemers (2015) argue that the nature of attrition by income status likely leads to an underestimate of the degree of intergenerational persistence. A third disadvantage is measurement error, as respondents will not always accurately respond to survey questions or may choose not to respond. This is a growing concern with the general downward trend in survey response rates (Meyer, Mok, and Sullivan 2015).
These are real concerns that cannot be ignored. Therefore, researchers need to use various approaches and robustness checks to address concerns about bias. At the same time, these concerns need to be traded off against the many advantages to using the PSID for intergenerational analysis. Going forward, researchers studying intergenerational mobility should consider using multiple types of data. Each data source may have different strengths and weaknesses and, when used in conjunction, can produce complementary analyses. Mixed results that are only produced with one type of data, but not another, can still play a valuable scientific role by forcing researchers to better understand their data sources.
Recommendations for the PSID
An extremely valuable resource for researchers would be greater linkages between the PSID and other data sources under secure protocols that continue to protect respondent confidentiality. For example, linkages to birth records, health records, school records, government programs (e.g., Medicaid, Food Stamps), credit bureau data, banking records, and income tax records would dramatically improve the value of the data. Such linkages would facilitate much more research on both exposures that may influence intergenerational processes as well as allow researchers to study new outcomes. In addition, with such linkages in hand, researchers could better understand the potential problems with both survey and administrative data and consider ways to combine them to produce the most robust results concerning intergenerational mobility.
There are many ways in which PSID data linked to administrative data could improve inferences from both data sources. Links to administrative records would allow researchers to better understand the importance of attrition in the PSID and to improve methods to correct for bias. On the other hand, self-reported data from the PSID on the income of non–tax filers may better allow us to understand what happens when tax data are missing. In addition, tax records are not ideal for identifying family relationships since they rely on whether children are claimed as dependents for tax purposes at a point in time. With the increasing complexity of family arrangements in the United States, the ability to track all the parental figures over the life course may loom as a major challenge in intergenerational mobility research going forward and one in which the PSID can play an important role.
Footnotes
Notes
Bhashkar Mazumder is a senior economist and research advisor in the economic research department at the Federal Reserve Bank of Chicago and the executive director of the Chicago Federal Statistical Research Data Center.