
Abstract
People with disabilities face substantial barriers to sustained employment and stable, adequate income. We assess how they and their families fared during the long economic expansion that followed the Great Recession of 2007 to 2009, using data from the monthly Current Population Survey (CPS) and the March CPS annual income supplement. We find that the expansion bolstered the well-being of people with disabilities and, in particular, their labor market engagement. We also find that federal disability benefits fell during the expansion. On balance, our results suggest that sustained economic growth can bolster the labor market engagement of people with disabilities and potentially reduce their reliance on disability benefits.
People with disabilities face significant barriers to sustained employment and stable, adequate income. Severe physical or cognitive impairments often prevent work and can lead to persistent or permanent receipt of government assistance via disability benefit programs. Less severe impairments may not completely preclude work but nonetheless sharply limit it. As such, people with disabilities often struggle to maintain labor market engagement and obtain adequate incomes for themselves and their families. In other words, people with disabilities face challenges to leading comfortable “working-class” lives.
In this article, we examine the economic status of people with disabilities since the Great Recession of 2007 to 2009. We focus in particular on whether their relative economic status and labor market engagement improved during the subsequent sustained expansion and historically tight labor market reached near its end. Research has found this to be true for other disadvantaged groups, although not all (Aaronson et al. 2019; Akee, this volume; Finlay and Mueller-Smith, this volume). Trends and cyclical patterns in the status of people with disabilities are important in part because of the costs of federal disability benefit programs. Past research suggests that rising incidence of disability claims in prior decades reflects adverse labor market developments and the rising value of disability payments relative to wages (Case and Deaton 2015; Autor and Duggan 2003). Declining disability benefit claims and program participation in recent years suggest that this trend may have been offset or reversed by the long expansion.
We conduct our analyses using data on self-reported disability status from the monthly Current Population Survey (CPS) and the CPS Annual Social and Economic Supplement (ASEC). We also use administrative data on applications and awards for receipt of federal disability benefits, specifically Social Security Disability Insurance benefits (SSDI) and Supplemental Security Income (SSI).
Our results indicate that the overall well-being of people with disabilities improved substantially during the most recent economic expansion (as suggested in Shambaugh and Strain, this volume), particularly in comparison with their more limited gains during the 1990s expansion. Our analyses of state panel data indicate that strong labor market conditions that led to increases in overall labor force participation substantially bolstered labor market engagement for people with disabilities relative to those without. We also examine applications and awards for receipt of federal disability benefits and find that they respond to changes in aggregate economic conditions but show somewhat less responsiveness to changes in economic conditions at the state level.
The monthly CPS data extend through late 2020 at the time that this article was written. We, therefore, undertake a partial, initial assessment of the effects of the COVID-19 pandemic and recession on people with disabilities. The crisis to date has not undermined the relative labor market engagement of people with disabilities, and we do not observe increased applications for disability claims, although delays in the processing of those claims could be a key explanation for this finding.
Disability Definitions and Trends
CPS disability data
To conduct our analysis of self-reported disability, we use microdata from the Basic Monthly CPS, the source of U.S. official household labor force statistics. The CPS collects a host of labor force and demographic data. To focus on disability during prime working years, we restrict our CPS analyses to individuals between 25 and 61 years of age. This range represents a slight expansion of the conventional prime-age range of 25 to 54 years of age, thereby incorporating more individuals who report disability late in their working lives but whose employment choices are not directly affected by eligibility for conventional Social Security retirement benefits.
We construct our primary measure of disability using self-reported status from the CPS six-question disability sequence. Collected consistently since mid-2008, the six-question sequence is a series of disability-related questions that is posed to all survey respondents when they enter their four-month CPS sample rotations. Following standard practice, we identify respondents as having a disability if they answer “yes” to at least one of the six questions from the sequence.
As a second measure of disability, since 1981 the March CPS survey has included a question about work-limiting disabilities for all household members. We rely less heavily on this measure because in 2015 the wording of the question shifted from current disability status to disability experienced at any time in the prior year, creating a sharp, discontinuous increase in reported disability midway through our analytical timeframe. We therefore use the six-question sequence to identify people with disabilities in the main analysis. However, we use the work limitation question for supplemental analyses of disability patterns in the 1990s, as discussed in the next section. 1
To measure economic well-being, we use detailed earnings and income data from the CPS ASEC, a supplement administered along with the basic monthly survey in March and adjacent months. The ASEC asks respondents what their earnings and income were during the prior calendar year, so our earnings and income tabulations refer to the prior year rather than the survey year.
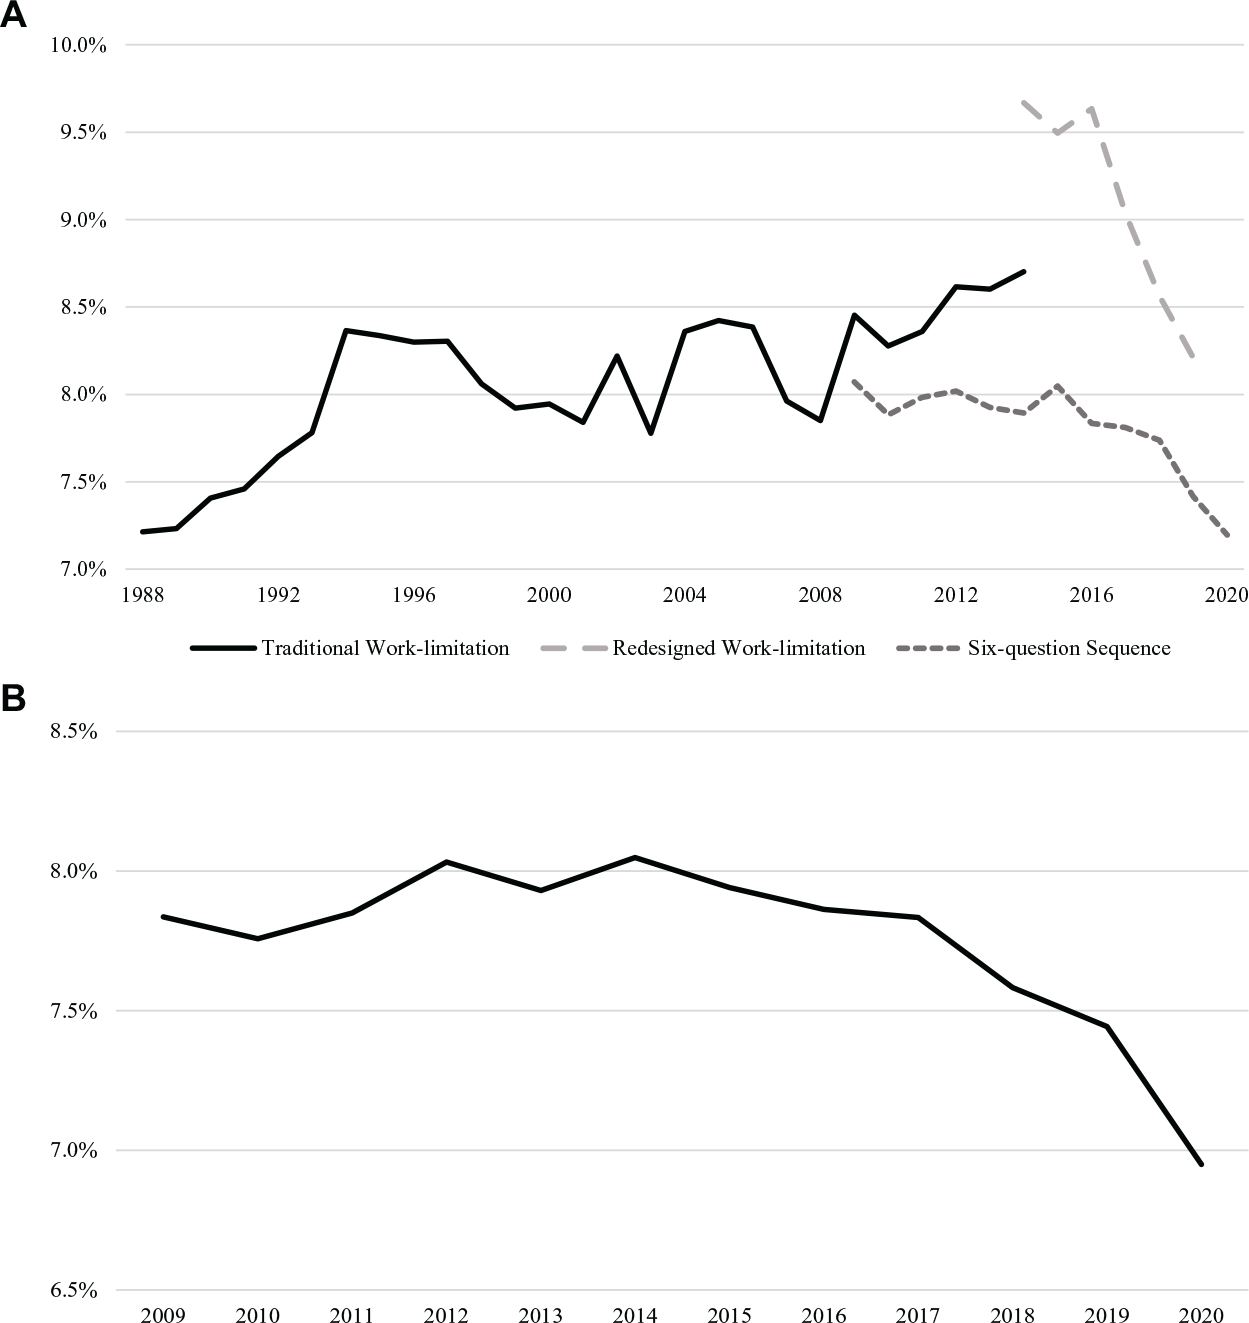
Figure 1 displays disability incidence based on the measures we discussed. Panel A compares the incidence of disability based on the monthly CPS six-question measure and the prior (“traditional”) and current work-limitation measures in the ASEC (all calculated from the March survey data). Self-reported disability ranges from about 7 to 10 percent of the population age 25 to 61, depending on the specific measure and year. The redesigned ASEC work-limitation measure, based on disability status in the preceding calendar year, yields higher rates of self-reported disability than does the earlier ASEC measure or the six-question sequence, which both reflect disability status at the time of the survey. Compared with other sources, disability incidence measured in the CPS tends to be lower than in panel surveys such as the Panel Study of Income Dynamics (PSID) and the Survey of Income and Program Participation (Meyer and Mok 2019). 2 However, self-reported disability in the CPS generally exceeds disability incidence as measured by beneficiary counts for the SSDI and SSI programs. 3
Disability Incidence in the CPS
Panel A of Figure 1 also shows that disability incidence calculated from the six-question sequence and traditional work limitation measures diverged during the early part of the recovery from the Great Recession, with little change for the former and an increase for the latter. However, both the six-question measure and the redesigned work limitation measure show a decline in disability incidence after 2014, as the economic expansion gained momentum and the labor market tightened. This pattern raises the possibility that self-reported disability status responds to economic conditions. Note, however, that the decline continued in 2020, when the labor market weakened substantially due to the COVID-19 pandemic. The ongoing decline in self-reported disability is even more apparent in panel B of Figure 1, which displays disability incidence calculated from annual averages of the twelve monthly surveys (rather than just the March survey as in panel A). Other factors beyond economic conditions may be contributing to the recent decline in reported disability—for example, the recent easing of the U.S. opioid epidemic (Currie and Schwandt, this volume), which may reduce self-reported disability associated with opioid dependence.
Trends in relative economic status of people with disabilities
We now turn to a comparison of economic status indicators between people with disabilities and people without disabilities.
It is important to note first that although people with disabilities have low employment rates, their broader economic status tends to place them among the working class according to common definitions. For example, a large fraction of people with disabilities in our samples lack a college education and are in the bottom half of the distribution of household income. For this reason, and to maintain acceptably large sample sizes for our analyses, we do not trim our sample to conduct analyses based on a specific definition of the working class. Rather, our sample should be thought of as representing a broad distribution of people with disabilities, knowing that the large majority of them would fall into conventional conceptions of the working class.
Table 1 lists a set of key indicators of employment status and well-being for the years 2009 and 2019, along with the change between those two years, for people with disabilities and people without disabilities aged 25 to 61. The long expansion following the Great Recession produced substantial benefits for people with disabilities and people without disabilities alike. For both groups, the employment to population ratio rose meaningfully, the unemployment rate dropped sharply, and individual earnings and family income rose substantially in real terms. The improvements were generally similar for the two groups. The exception is mean earnings when we include nonearners. When we include nonearners, mean earnings are similar for the two groups, which suggests that people without disabilities entered the earnings sample at the lower end of the earnings distribution. This finding is confirmed by the greater gains for people with disabilities at the 10th and 25th percentiles of earnings relative to people without disabilities.
Outcome Measures by Population before and after Recovery
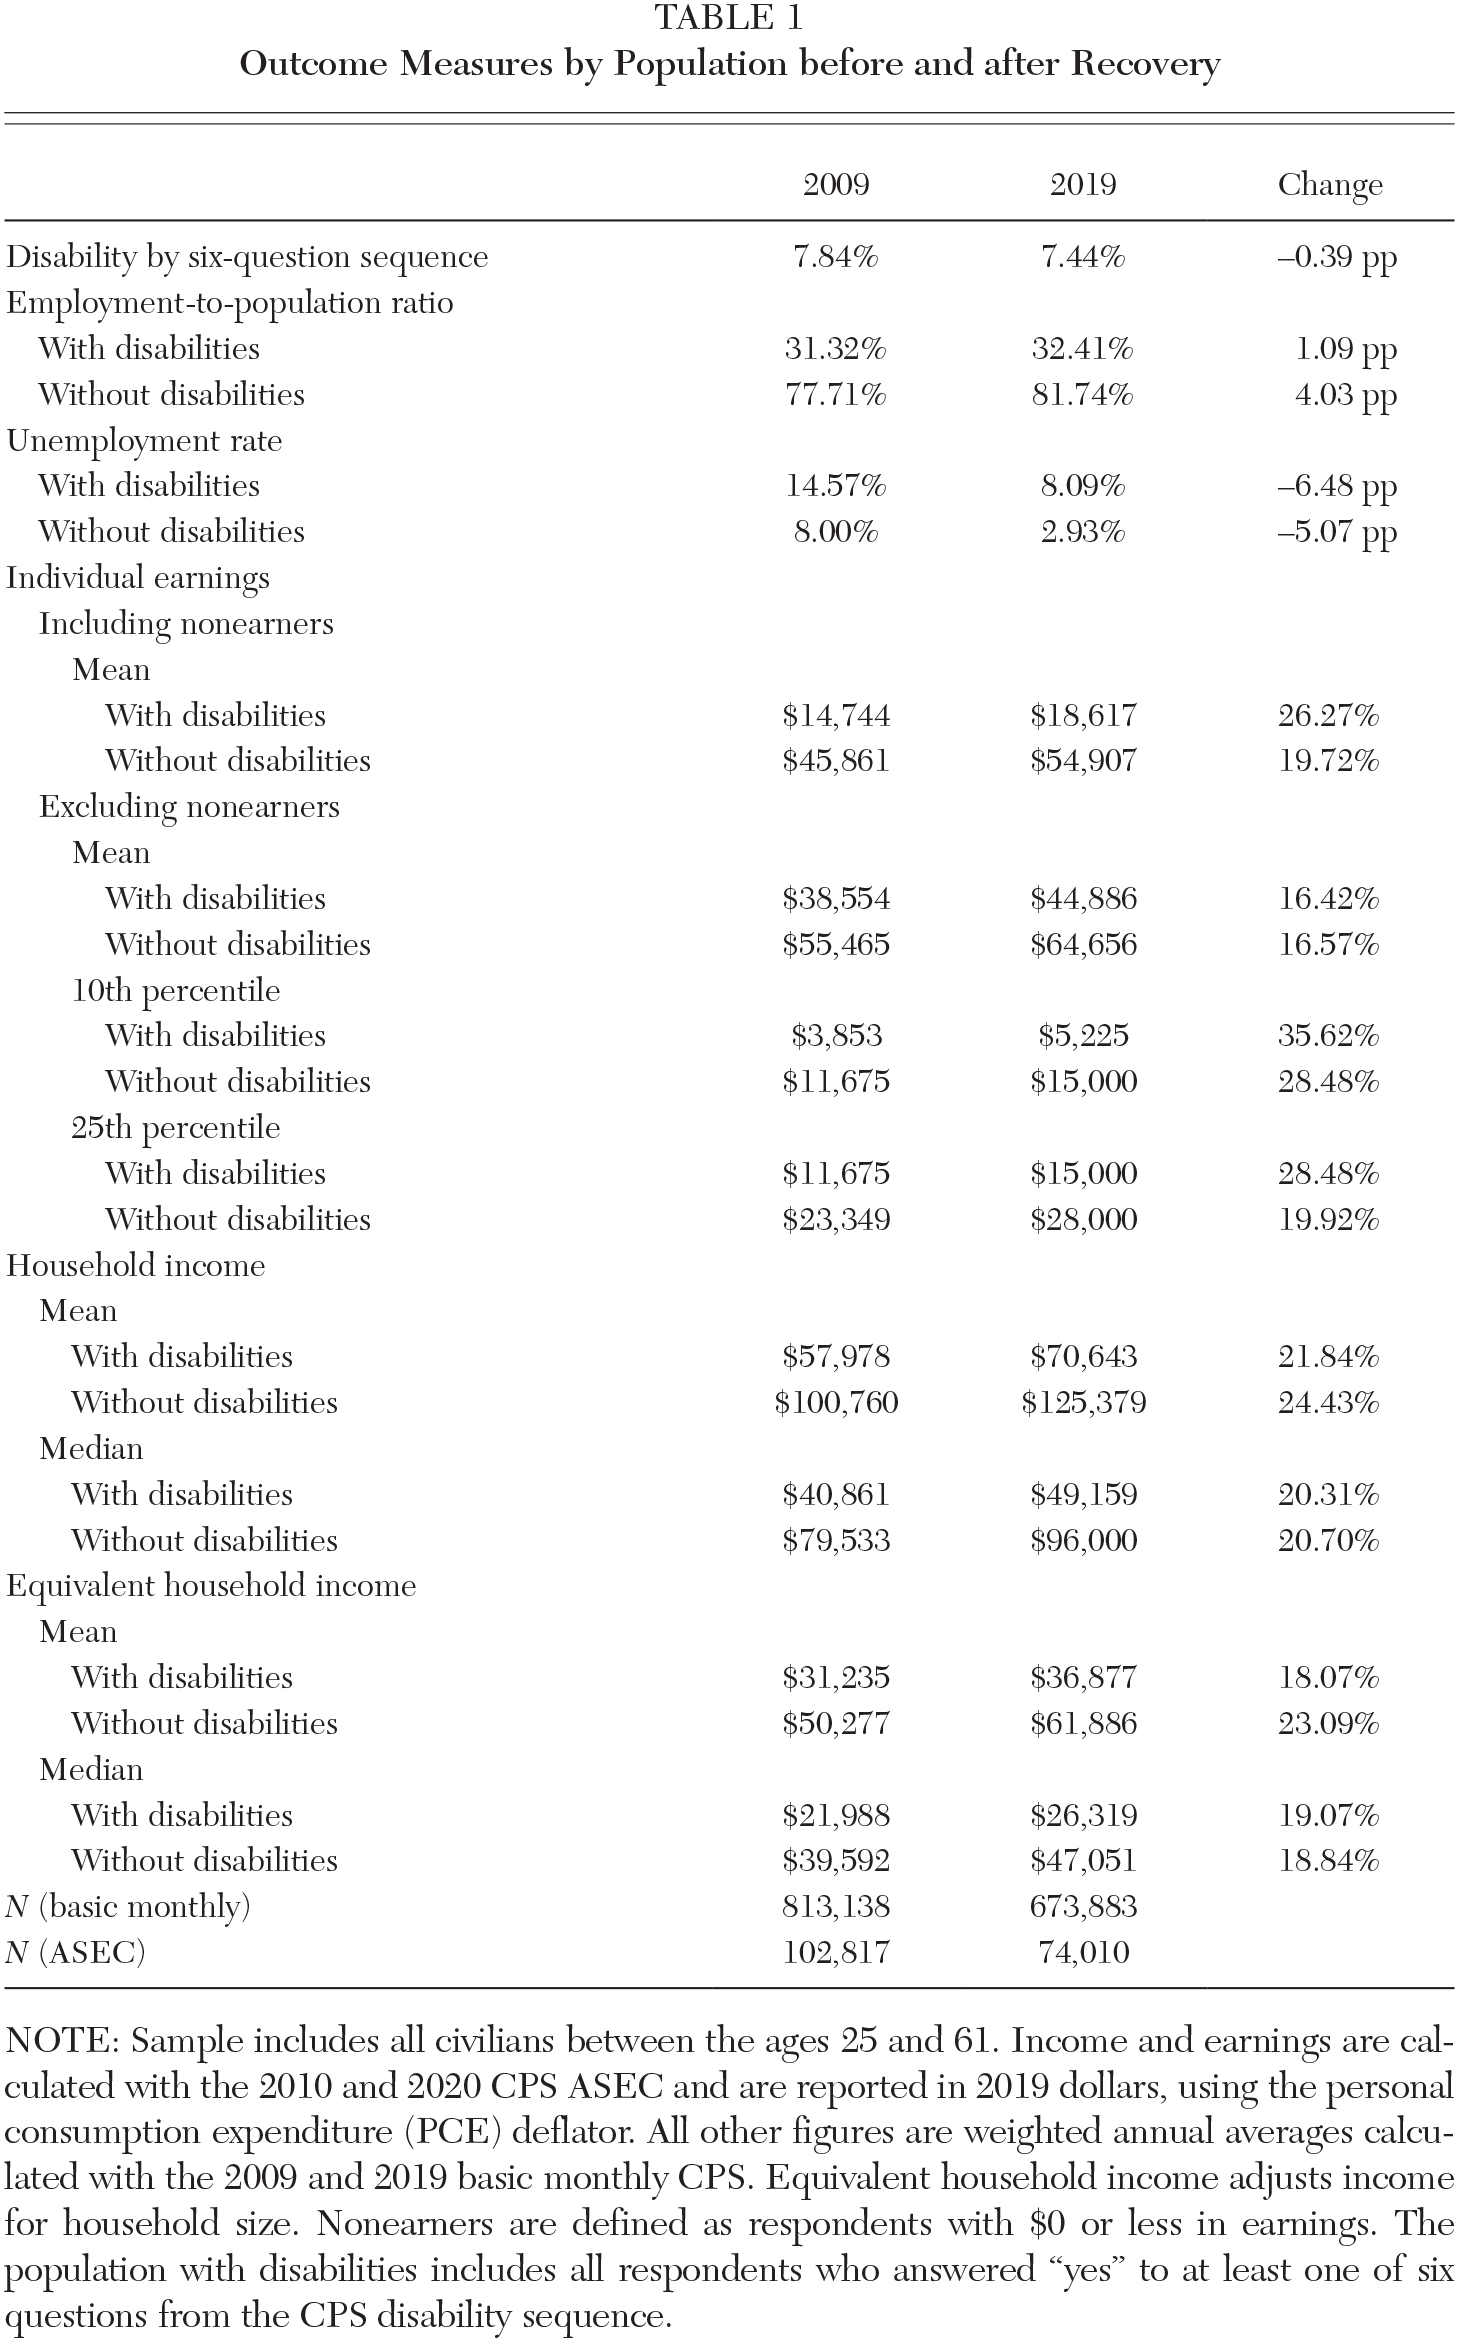
NOTE: Sample includes all civilians between the ages 25 and 61. Income and earnings are calculated with the 2010 and 2020 CPS ASEC and are reported in 2019 dollars, using the personal consumption expenditure (PCE) deflator. All other figures are weighted annual averages calculated with the 2009 and 2019 basic monthly CPS. Equivalent household income adjusts income for household size. Nonearners are defined as respondents with $0 or less in earnings. The population with disabilities includes all respondents who answered “yes” to at least one of six questions from the CPS disability sequence.
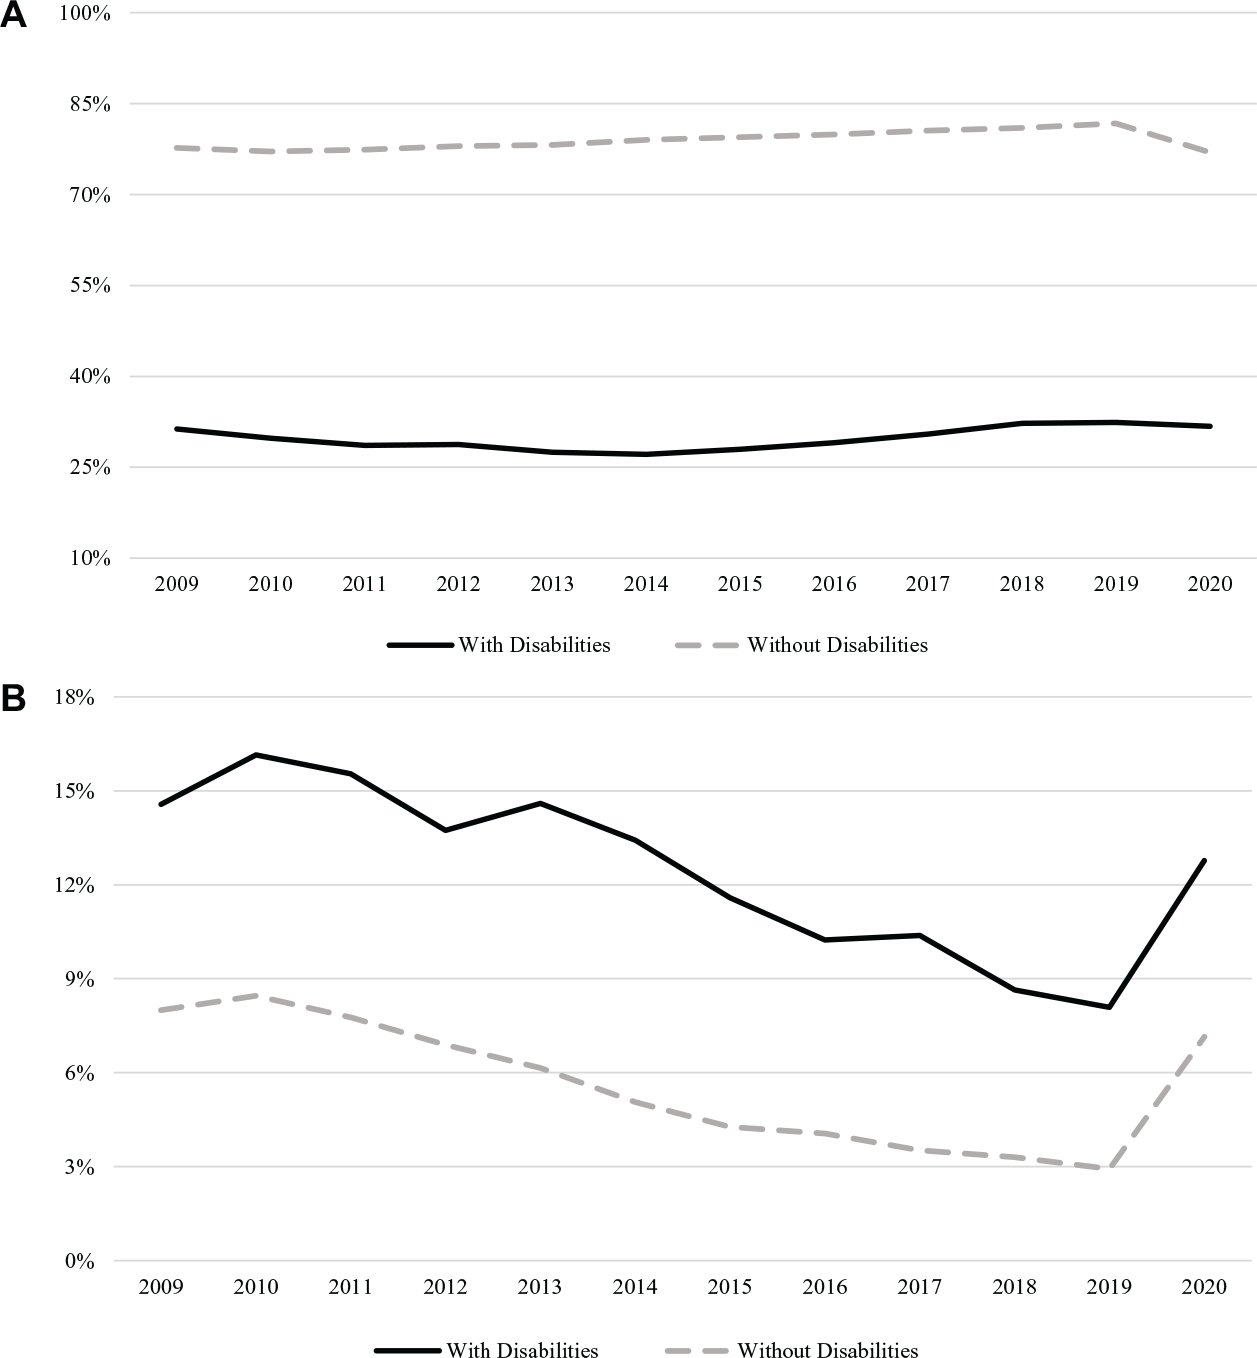
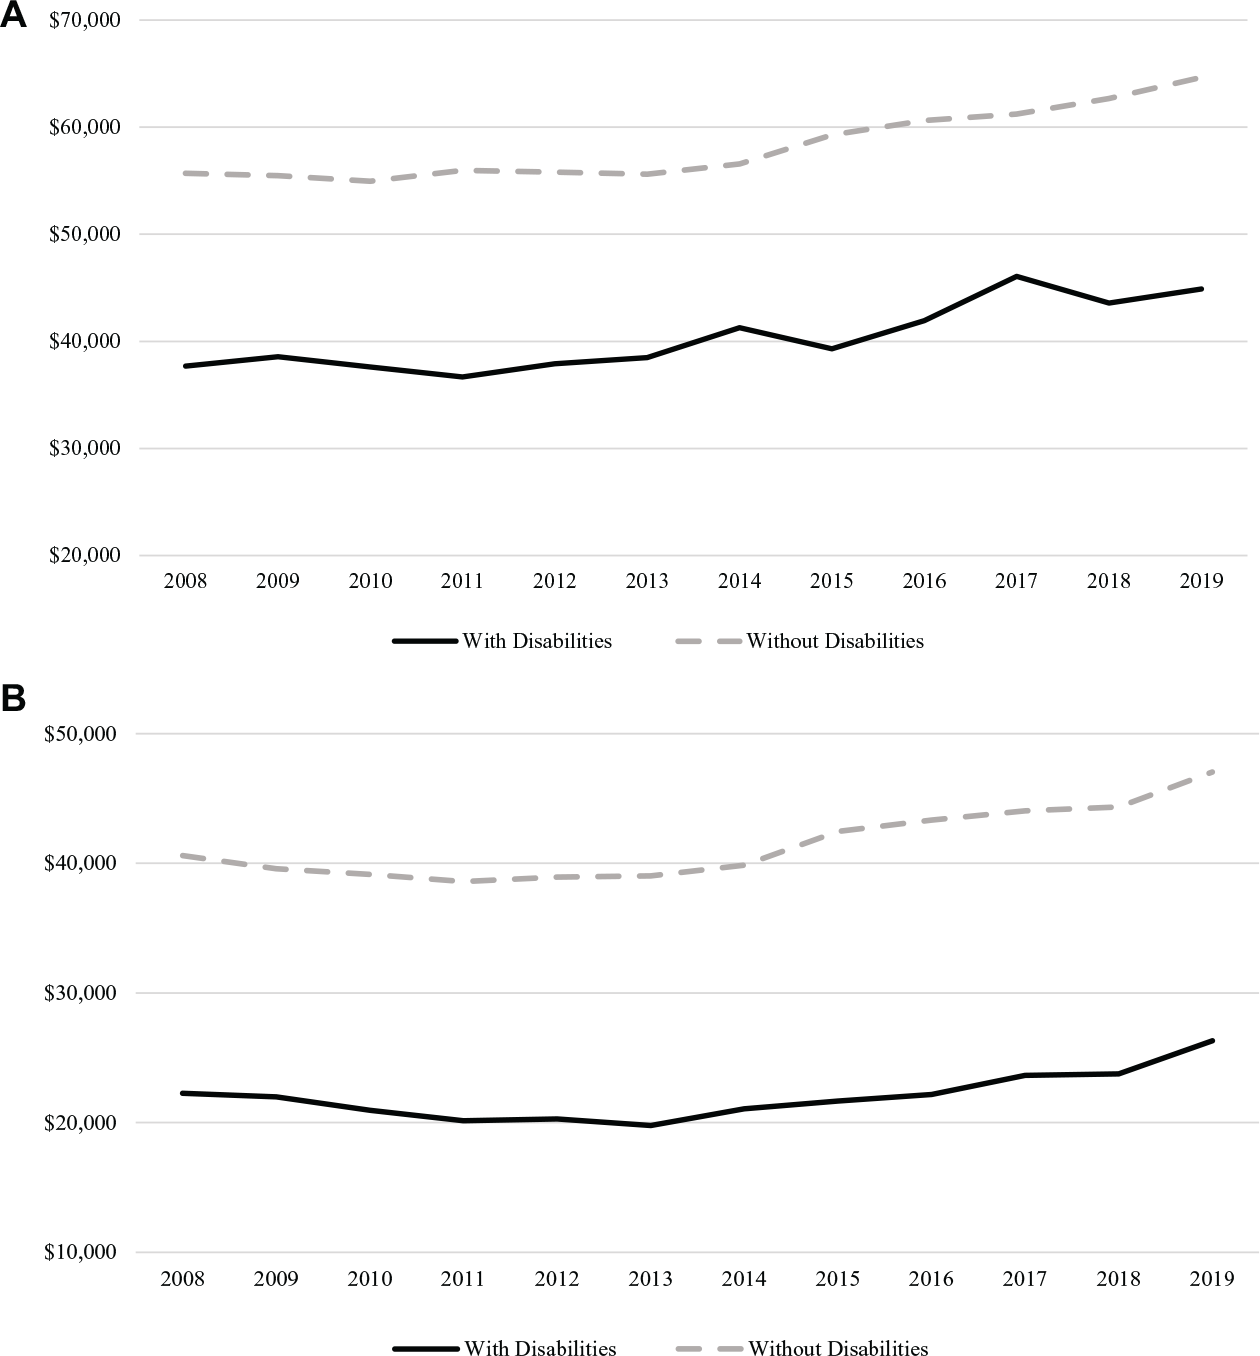
While Table 1 shows similar gains for people with disabilities and people without disabilities over the past decade, it reveals nothing about the pattern of changes within those timeframes. Those patterns are displayed for selected indicators in Figures 2 and 3. 4 The labor force, earnings, and income series displayed generally show either steady gains or stagnation followed by a pronounced pickup starting around 2014. These patterns are similar for people with disabilities and people without disabilities. Also, Figure 2 shows no deterioration in the relative employment and unemployment rates of people with disabilities in 2020, despite the severely adverse impact of the COVID-19 pandemic on labor market conditions and general well-being. 5
Labor Market Status and Disability
Earnings and Income, by Disability
It is informative to compare the experience of people with disabilities during the recent expansion to their experience during the 1990s expansion, which was nearly as long as the more recent expansion and produced a similarly tight labor market. Accordingly, Table A1 in the appendix reproduces Table 1 for the period 1991 to 2000, using the work limitation measure available in the ASEC during that period. 6 Appendix Table A1 shows that people with disabilities generally fared poorly during the 1990s, particularly by comparison with the solid improvements enjoyed by people without disabilities. A more detailed comparison of the two periods is beyond the scope of this article. However, earlier research documented the limited gains for people with disabilities in the 1990s and attributed it in part to the restraining impact of the 1990 Americans with Disabilities Act (ADA) on employers’ willingness to hire people with disabilities, along with rapid expansion of the SSDI program during that decade (Burkhauser, Daly, and Houtenville 2001; Acemoglu and Angrist 2001; Autor and Duggan 2003). By contrast, our finding of substantial gains for people with disabilities during the past decade is consistent with recent findings for other disadvantaged groups. 7
Cyclical Patterns in Disability Status and Employment/Income
The descriptive time-series evidence discussed in the previous section is suggestive but not definitive regarding cyclical effects on the relative economic status of people with disabilities. To conduct more formal analyses, we formed a state-by-year panel dataset for the fifty states plus the District of Columbia, which provides substantial additional variation in economic conditions that we can leverage for estimation. 8 This dataset includes annual observations for the years 2009 to 2019, using the complete set of twelve monthly CPS files for disability incidence and labor force statistics and the CPS ASEC for annual earnings and income data (income data for 2020 were not available at the time that this article was written).
To get a sense of the variation in the data, Figure 4 shows scatter plots for the relationship in 2019 between state unemployment rates and (1) disability incidence in panel A and (2) the employment-to-population ratio of people with disabilities relative to people without disabilities in panel B. 9 As indicated by the fitted lines, disability incidence is higher and relative employment of people with disabilities is lower in states with higher unemployment rates. The position of individual states is largely mirrored in the two panels of Figure 4. For example, high-unemployment states such as West Virginia and Mississippi also tend to have high incidence of disability and low relative employment rates for people with disabilities, with the opposite pattern evident for low-unemployment-rate states such as Colorado and Virginia.
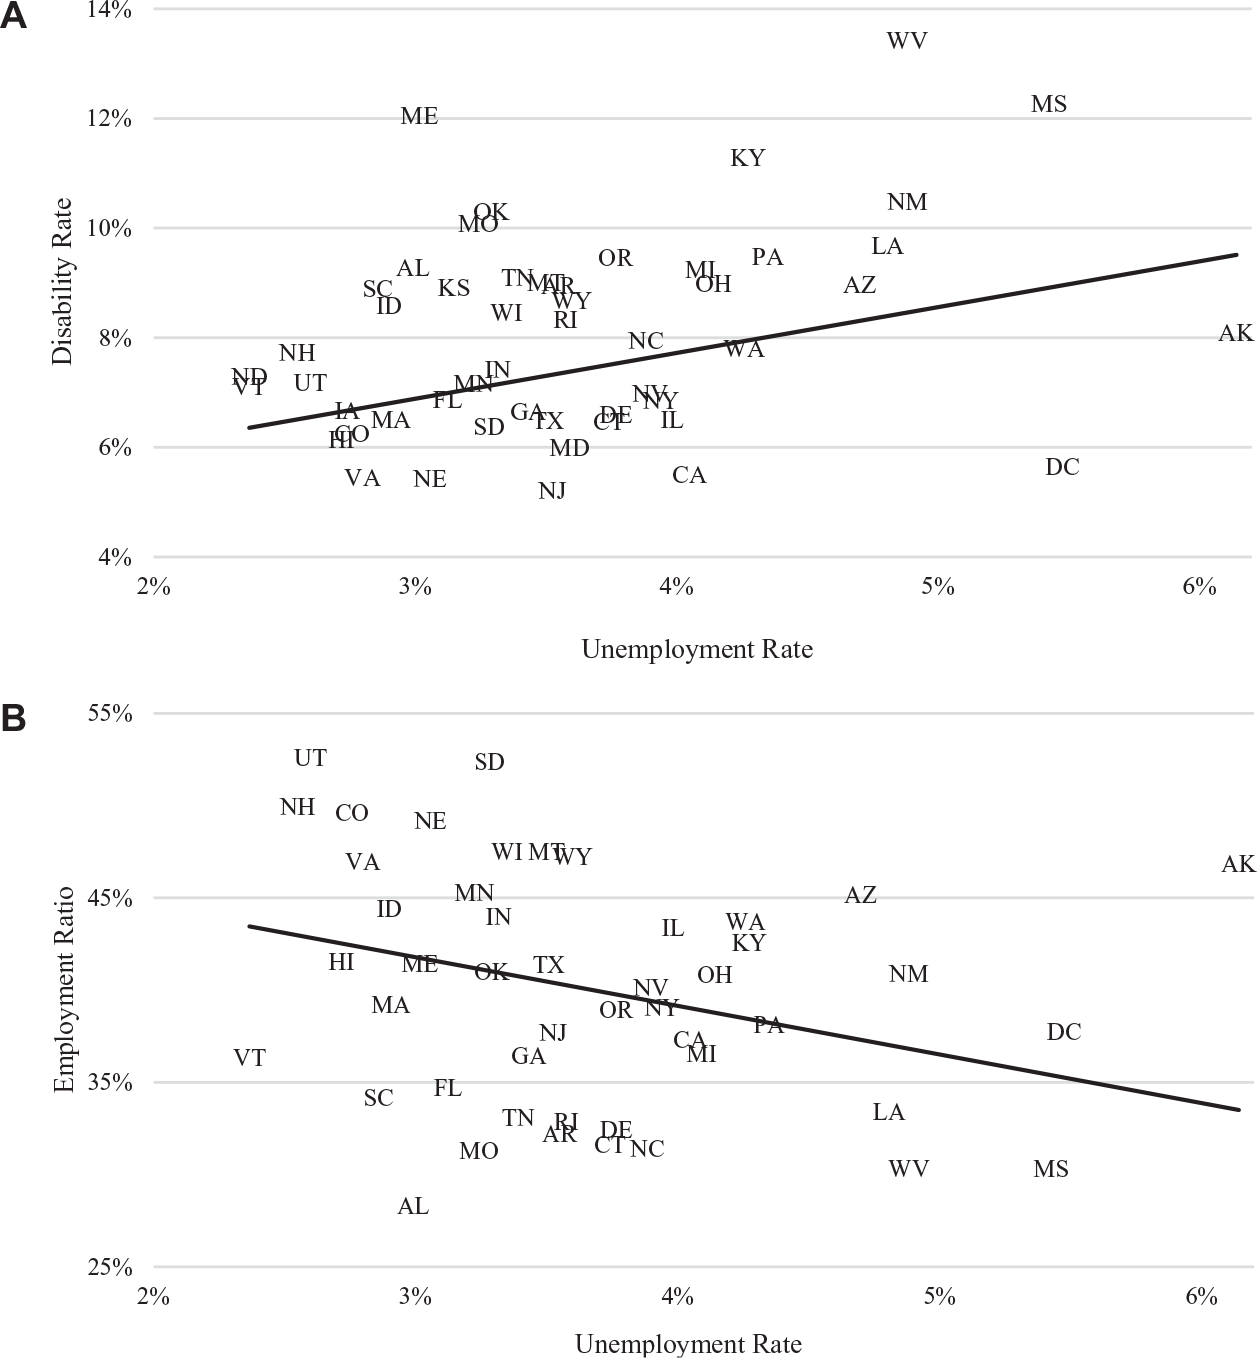
Disability and Employment/Population Ratio vs. Unemployment Rates
For more formal results, we estimate regressions of the following form, using our state panel data:

where Y represents the dependent variables described next, and s and t index state and time (year). 10
We are primarily interested in the estimated coefficient β, which reflects the effects of various measures of state labor market conditions (L), as described here. We also account for a set of other relevant time-varying state variables (Xst), specifically a vector of age-by-gender population shares. 11 We include state fixed effects (φs) in selected specifications as discussed, and all specifications include a complete set of year indicators (δt).
Table 2 reports regression results for the estimated cyclical effect β. Following Figure 4, panel A uses the state unemployment rate as the measure of cyclical labor market conditions or slack. The 2019 cross-section regression results in columns 1 and 4 confirm the patterns evident in Figure 4. The average marginal effects indicate large impacts of differences in state unemployment rates on disability incidence and relative employment rates for people with disabilities. The estimate in the first column of panel A indicates that disability incidence varies across states essentially in tandem with unemployment rates. The estimate in column 4 indicates that relative employment rates of people with disabilities are higher by nearly 3 percentage points for each percentage point reduction in the unemployment rate; this is a large effect but plausible by comparison with the wide variation in relative employment rates for people with disabilities in our sample. 12 These estimated effects are qualitatively similar but substantially smaller in magnitude for the full panel specification in columns 2 and 5, and they are quite small and statistically insignificant in the specifications that include state fixed effects (columns 3 and 6). The reduced size of the estimates in the full panel compared with the 2019 cross-section suggests that persistent unmeasured features of state economies and populations cause states with high unemployment rates to also have high disability incidence and low relative employment rates for people with disabilities.
Regression Results: Disability Incidence and Employment Ratio
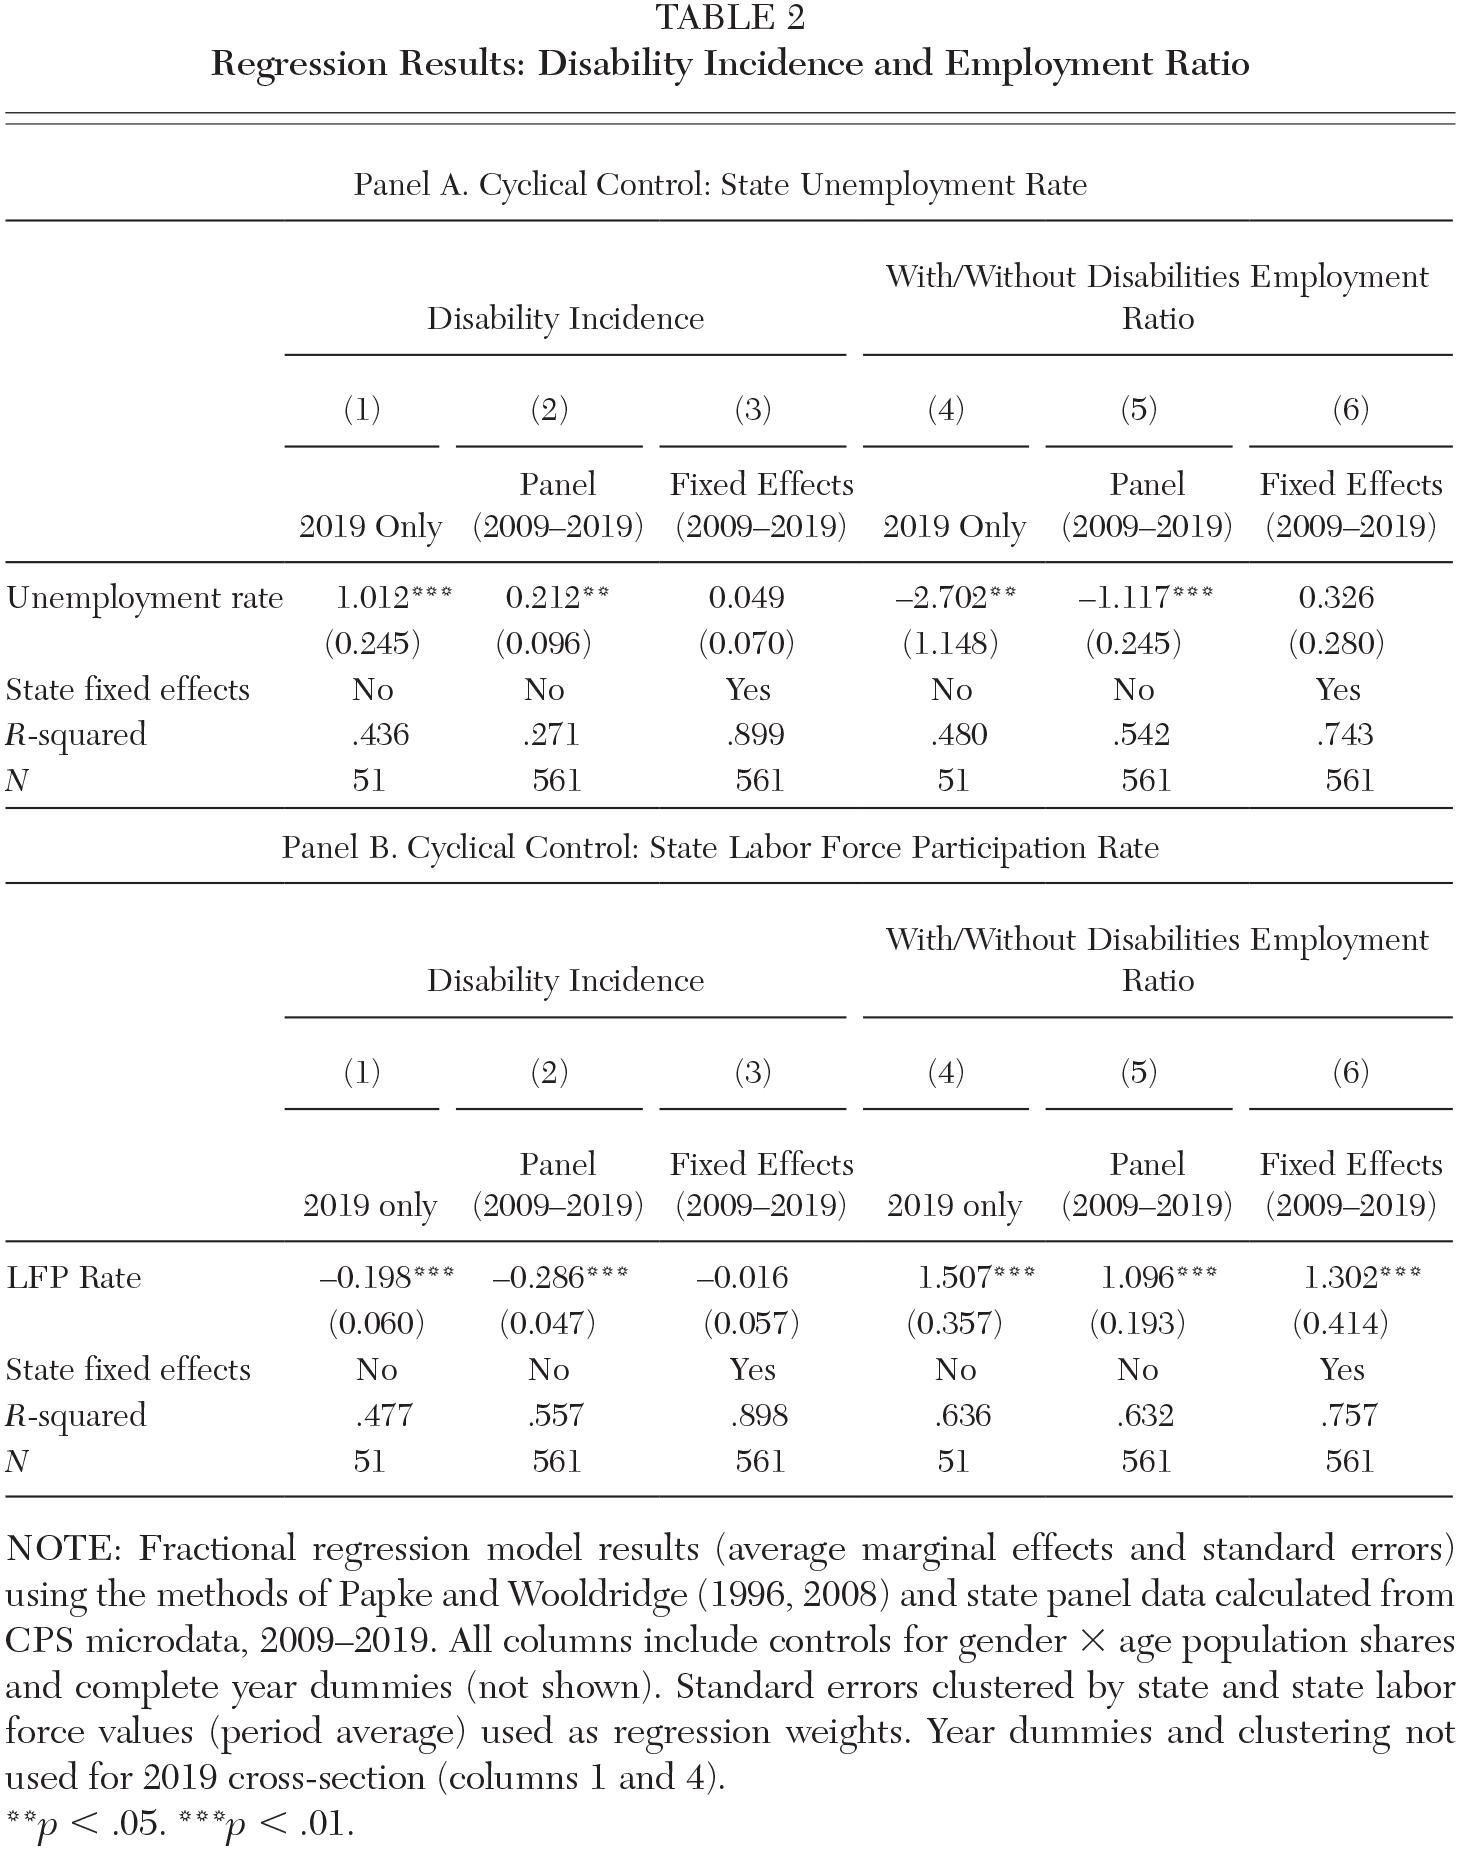
NOTE: Fractional regression model results (average marginal effects and standard errors) using the methods of Papke and Wooldridge (1996, 2008) and state panel data calculated from CPS microdata, 2009–2019. All columns include controls for gender × age population shares and complete year dummies (not shown). Standard errors clustered by state and state labor force values (period average) used as regression weights. Year dummies and clustering not used for 2019 cross-section (columns 1 and 4).
p < .05. ***p < .01.
Given the sharp decline in labor force participation (LFP) during the Great Recession and subsequent slow recovery, LFP may be a better indicator of labor market strength or slack than the unemployment rate (Faberman et al. 2020). In panel B of Table 2, we therefore replace the unemployment rate with the state labor force participation rate (age 16 and older). As expected, the LFP variable produces opposite signed coefficients relative to the unemployment variables, because high LFP (unemployment) indicates a strong (weak) labor market. Importantly, the estimated coefficient on the LFP variable remains large and statistically precise in the column 6 regression for relative employment rates, which includes state fixed effects. We place greatest emphasis on the fixed-effects specification. In these specifications, the coefficient of interest is likely to reflect a true cyclical relationship rather than underlying state characteristics—for example, industry and labor force composition or institutional features of state labor markets—that vary little over time but cause some states to have both weaker labor markets and less favorable outcomes for individuals with disabilities. The estimated effect in column 6 of panel B (Table 2) is quite large: a one-standard-deviation difference in the LFP rate over our 2009 to 2019 sample frame (about 3 percentage points) is associated with more than a one-half-standard-deviation difference in the relative employment rate for people with disabilities.
We also estimated the same specification for the broad set of income and earnings variables discussed earlier and listed in Table 1. We found very little evidence that these measures of the relative economic well-being of people with disabilities respond to variation in labor market slack and hence do not list those results here. 13
Overall, our analyses using state panel data indicate that the labor market engagement of people with disabilities relative to people without disabilities is affected by labor market conditions, particularly labor force participation rates. This finding likely reflects unique cyclical movements in LFP rates during the most recent business cycle, including a sharp decline and subsequent recovery for prime-age workers, which makes it a useful metric for assessing overall labor market health (Faberman et al. 2020).
Disability Benefit Program Participation
Bolstering the employment engagement of people with disabilities may reduce their reliance on government disability benefits. In this section, we build on the results in the preceding section by assessing patterns in the use of disability insurance programs (SSDI and SSI) over the past decade.
SSDI pays benefits to individuals with extensive work histories who develop a severe work-limiting disability. Because SSDI receipt tends to be persistent or permanent, and hence costly, the application process is extensive and often entails lengthy delays. SSDI protection is buttressed by SSI, which provides payments to lower-income adults and children with disabilities regardless of work history, as well as to lower-income people aged 65 or older, typically on a temporary basis. 14
The majority of individuals who receive disability insurance benefits are not in the labor force. However, trends in program use are relevant for understanding labor market outcomes for individuals with disabilities because current decisions about disability program use have a large effect on future labor market status and thus economic outcomes: once an individual is awarded a disability benefit, they tend to stay on the program and permanently leave the labor force. 15 If changes in labor market conditions influence the use of disability insurance programs, a recovery or recession can have lasting impacts on the economic well-being of people with disabilities (see e.g., Maestas, Mullen, and Strand 2015, 2018; Stapleton et al. 1998).
One reason that labor market conditions would be expected to affect disability insurance program use is that recessions increase the relative attractiveness of disability insurance relative to the outside option of staying in the labor force. Market wages may fall, and for the unemployed, so does the probability of finding a job. The prediction that an erosion of the outside option encourages disability insurance program use has been documented in a number of studies (see, e.g., Autor and Duggan 2003; Black, Daniel, and Sanders 2002). The pattern of applications to the disability insurance programs over time, shown in Figure 5, fits this story. Applications appear to follow the cyclical pattern in the unemployment rate. 16
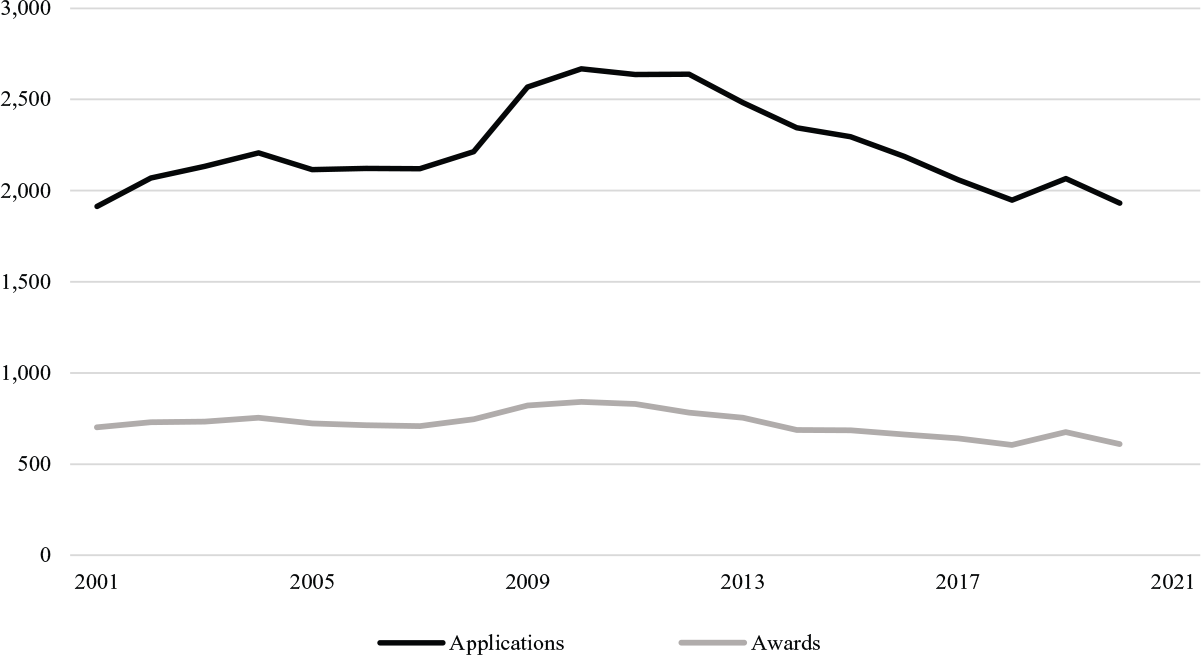
Initial Claims for Disability Insurance: Annual SSDI and SSI Applications and Awards in Thousands
To quantify the relationship between disability insurance program use and labor market cyclicality, we use state-by-month panel data aggregated to an annual frequency. These data are from the Social Security Administration (SSA) and represent state Disability Determination Service workloads from October 2000 through December 2020. This dataset gives applications, determinations, and allowances for the SSDI and SSI programs, and we sum the data across these programs in our analysis. 17
We use these data to estimate state panel regressions that are identical to those described in the preceding section, but with measures of disability program participation as the dependent variables: specifically, the application rate (applications per ten people ages 25 to 64) and two definitions of the award rate (awards per ten people ages 25 to 64, and the number of awards per determination).
Our main results in Table 3 yield two general conclusions: some cyclicality exists in disability insurance program use, and time-invariant differences between states have substantial explanatory power. Generally, our findings are consistent with existing research. The results in the first two columns show that applications for disability insurance tend to rise with unemployment rates (consistent with prior work, such as Maestas, Mullen, and Strand 2015, 2018). However, adding state fixed effects (column 2) reduces the magnitude of the relationship substantially, an indication of the importance of persistent effects of state labor market or institutional features. We find that a 2.5-percentage-point (roughly one standard deviation) difference in state unemployment rates is associated with an increase in the application rate of about 0.013 in column 1 and just under 0.01 when fixed effects are included in column 2. These are modest effects relative to the mean application rate of about 0.185 and the standard deviation of about 0.058.
Regression Results for Disability Program Applications/Awards—Main Results

NOTE: Fractional regression model results (average marginal effects and standard errors) using the methods of Papke and Wooldridge (1996, 2008) and state panel data calculated from SSA state agency monthly workload data, 2009–2019. Data include all SSDI and SSI initial claims (excluding SSI child claims). Population age 25 to 64 used as the denominator in (1) - (4). All columns include controls for gender × age population shares and complete year dummies (not shown). Standard errors clustered by state and state labor force values (period average) used as regression weights.
p < .05. ***p < .01.
Turning to initial awards, we do not find a cyclical pattern in awards as a fraction of the population (despite the aggregate time series in Figure 5 seeming to suggest one). However, we do find that the award rate measured as the number of awards per determination is cyclically sensitive, as also documented in the existing research we have already noted. 18 Our results show that a 2.5-percentage-point increase in the unemployment rate is associated with about a 0.023 (just over a third of a standard deviation) decline in the award rate (which has a mean of 0.347). This estimate is substantially offset by the inclusion of state fixed effects in column 6, which reduces the magnitude of the coefficient by more than half and eliminates its statistical significance. These findings are broadly consistent with the interpretation that when labor markets weaken, the marginal applicant is less likely to qualify for disability programs. 19
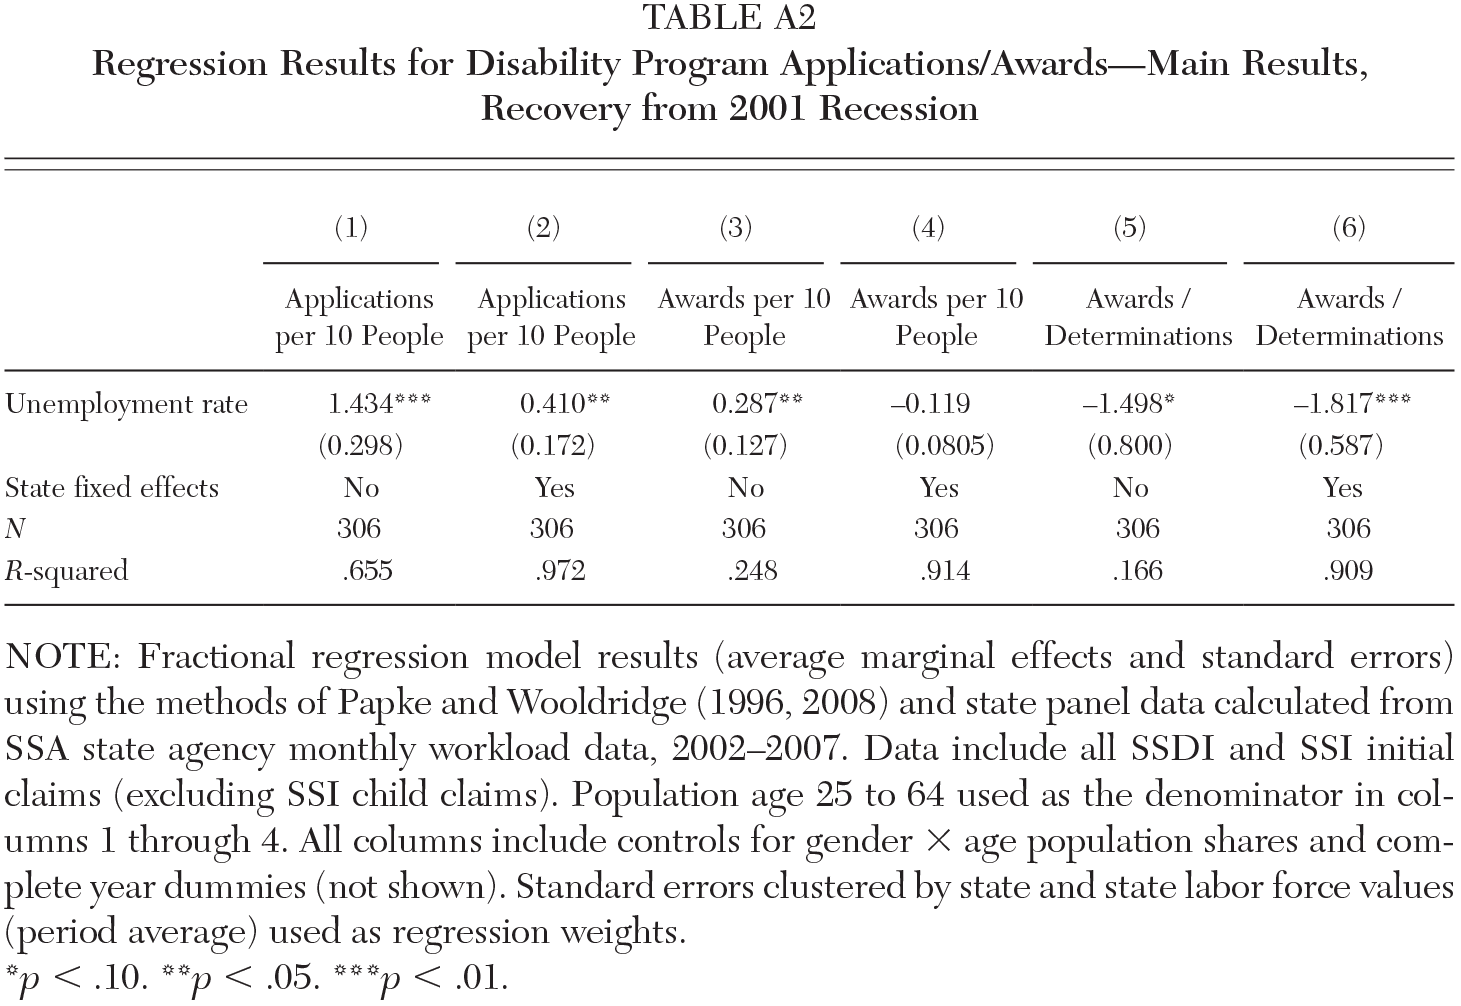
Data limitations prevent a comparison to the 1990s expansion, but we can examine these same relationships during the (shorter) expansion that followed the 2001 recession. During this recovery, we find similar but slightly stronger evidence of cyclicality in disability program use (see Table A2 in the appendix). This finding suggests that the cyclicality we find in the recovery following the 2007 to 2009 recession likely represents a general relationship between disability program use and labor market conditions rather than unique features of that recovery.
Our findings indicate that applications for disability insurance programs rose during the 2007 to 2009 recession. The majority of individuals ultimately awarded benefits likely left the labor market permanently. The permanence of these labor market exits may, in aggregate, limit the benefits of long economic expansions for people with persistent disabilities: as noted above, once they enter the program, they typically do not exit later.
The data for the COVID-19 recession thus far show that through December 2020 a sharp decline in applications and awards occurred, although this could reflect SSA office closures and backlogs (see the footnoted discussion of Figure 5). Simple cross-sectional correlations across all states and months in 2020 are inconclusive and do not show evidence of significant correlations. Whether there will be a rise in applications as a result of the COVID-19 recession is yet to be determined.
Discussion and Conclusion
Our analyses of the employment and economic status of people with disabilities since the Great Recession yields some encouraging findings. We find consistent and robust evidence that the long labor market expansion, which caused a notable increase in prime-age labor force participation rates in recent years, bolstered the labor force engagement of individuals who self-identify as having a disability. We also find somewhat weaker evidence that the long expansion led to reduced entry into government disability programs. Combined, these results suggest that sustained economic expansions can help to improve the well-being of people with disabilities and reduce their reliance on public support programs. Slower population aging may already be easing the growth in disability benefit rolls (Liebman 2015). Our results suggest that a sustained economic expansion following the COVID-19 crisis could contribute to further improvements in the economic well-being of people with disabilities.
Supplemental Material
sj-docx-1-ann-10.1177_00027162211022693 – Supplemental material for The Economic Status of People with Disabilities and Their Families since the Great Recession
Supplemental material, sj-docx-1-ann-10.1177_00027162211022693 for The Economic Status of People with Disabilities and Their Families since the Great Recession by Timothy M. Smeeding, Jenifer Romich, Michael R. Strain, Leila Bengali, Mary C. Daly, Olivia Lofton and Robert G. Valletta in The ANNALS of the American Academy of Political and Social Science
Footnotes
Appendix
Regression Results for Disability Program Applications/Awards—Main Results, Recovery from 2001 Recession
| (1) |
(2) |
(3) |
(4) |
(5) |
(6) |
|
|---|---|---|---|---|---|---|
| Applications per 10 People | Applications per 10 People | Awards per 10 People | Awards per 10 People | Awards / Determinations | Awards / Determinations | |
| Unemployment rate | 1.434*** | 0.410** | 0.287** | –0.119 | –1.498* | –1.817*** |
| (0.298) | (0.172) | (0.127) | (0.0805) | (0.800) | (0.587) | |
| State fixed effects | No | Yes | No | Yes | No | Yes |
| N | 306 | 306 | 306 | 306 | 306 | 306 |
| R-squared | .655 | .972 | .248 | .914 | .166 | .909 |
NOTE: Fractional regression model results (average marginal effects and standard errors) using the methods of Papke and Wooldridge (1996, 2008) and state panel data calculated from SSA state agency monthly workload data, 2002–2007. Data include all SSDI and SSI initial claims (excluding SSI child claims). Population age 25 to 64 used as the denominator in columns 1 through 4. All columns include controls for gender × age population shares and complete year dummies (not shown). Standard errors clustered by state and state labor force values (period average) used as regression weights.
p < .10. **p < .05. ***p < .01.
Note:
The views expressed in this article are solely those of the authors and are not attributable to the UCLA Anderson Forecast, the Federal Reserve Bank of San Francisco, or the Federal Reserve System.
Notes
Leila Bengali is an economist at the UCLA Anderson Forecast, part of the UCLA Anderson School of Management. Her research includes work in the fields of labor economics, public finance, and behavioral economics.
Mary C. Daly is the president and CEO of the Federal Reserve Bank of San Francisco. As a voter on the Federal Open Market Committee, she helps to set American monetary policy that promotes a healthy and stable economy. Her research is primarily in labor economics, with a recent focus on increasing inclusion throughout the economy.
Olivia Lofton is a research associate in the Economic Research Department at the Federal Reserve Bank of San Francisco. She regularly provides research support to staff economists and has served as a coauthor on publications examining labor market issues.
Robert G. Valletta is associate director in the Economic Research Department at the Federal Reserve Bank of San Francisco. His research is primarily in the field of labor economics, including topics such as unemployment, income inequality, and the impacts of public support programs on labor market outcomes and well-being.
References
Supplementary Material
Please find the following supplemental material available below.
For Open Access articles published under a Creative Commons License, all supplemental material carries the same license as the article it is associated with.
For non-Open Access articles published, all supplemental material carries a non-exclusive license, and permission requests for re-use of supplemental material or any part of supplemental material shall be sent directly to the copyright owner as specified in the copyright notice associated with the article.