
Abstract
The potential spillover effects of the United States’ opioid epidemic on children’s educational outcomes have received surprisingly little attention from researchers. Accordingly, this study leverages national datasets of county-level opioid prescription rates and public school students’ third- to eighth-grade academic achievement to provide the first analysis of associations between community opioid prevalence and children’s learning rates. We find that students in counties with higher community opioid presence learn more slowly than peers in counties with low community opioid presence, both in aggregate and across different racial, ethnic, and socioeconomic groups of students. Moreover, within states we observe a small significant negative association between community opioid presence and student learning rates. This association is similar in rural and nonrural communities. These findings underscore the urgency of conceptualizing the opioid epidemic as a community-level crisis, with potentially long-lasting implications for children’s future educational attainment and life outcomes.
The U.S. is in the midst of an opioid addiction and overdose crisis. Between 1999 and 2010, prescription opioid sales quadrupled; and between 2000 and 2014, the country experienced a 200 percent increase in the rate of overdose deaths involving opioids (Centers for Disease Control and Prevention 2011; Rudd et al. 2016). The crisis has disproportionately hit specific counties and states, with some areas of the country being showered with more than 100 opioid pills per resident per year (Eyre 2020; Humphreys et al. 2022). As a point of reference, evidence suggests that ten to fifteen opioid pills are sufficient for recovery from most surgical operations, meaning that these communities were experiencing an influx of opioid pills that would cover treatment for seven to ten surgeries per resident per year (Hill et al. 2017).
The adverse impacts of the crisis have been documented in many domains, but surprisingly little attention has been directed to understanding how the opioid crisis has affected children’s educational outcomes. Adverse childhood experiences such as parental drug use can negatively affect life outcomes, including academic performance (Jimenez et al. 2016). Children of opioid-addicted individuals have increased risk of emotional issues, behavioral problems, and poor social skills, which contribute to poor academic performance (Peisch et al. 2018). In addition to this direct link between parents and children, community drug use in the child’s broader social environment outside the home is also linked to detrimental outcomes for children (Wolf et al. 2016). Understanding whether and to what extent student learning has been disrupted by the opioid epidemic is a hugely important, surprisingly understudied topic.
Two recent papers have shown that various measures of the opioid crisis are associated with lower levels of academic achievement. Darolia, Owens, and Tyler (this volume) find strong correlations between counties that have high drug-related mortality rates and counties with worse test score outcomes among third- and eighth-grade students. Although the authors find that, overall, mortality rates are more strongly associated with test scores in nonrural counties, among rural counties they observe that these relationships are stronger in areas with higher mortality rates and higher degrees of geographic isolation for third-grade students. Cotti, Gordanier, and Ozturk (2020) link 11 years of prescription data in South Carolina to third- through eighth-grade test scores over the same period, finding that increased prescription rates are associated with a reduction in White students’ test scores both at the individual level and at the aggregate county level, particularly among rural households. We complement this prior work by examining a new component of academic performance: learning rates.
Relative to academic achievement as measured by test scores, which has been used to evaluate students and schools for decades, student learning rates represent a novel educational outcome. Whereas test scores portray student performance at a given point in time, learning rates capture the amount students learn over time. In other words, learning rates represent the amount that students’ achievement levels improve from year to year. This measure of annual student growth is regarded by researchers as a better measure of school’s contribution to learning than achievement levels, particularly since achievement levels are known to be highly correlated with socioeconomic status (SES) and other aspects of students’ home lives (Atteberry and McEachin 2020; Reardon 2019). The widespread adoption of learning rates as a relevant outcome in recent years has been spurred in part by the Every Student Succeeds Act (ESSA), which was passed in 2015 and requires states to collect multiple measures of student performance in addition to achievement (Barone 2017). As of 2020, forty-three states and the District of Columbia now include growth measures in their publicly available school report cards, with an additional five states planning to incorporate such measures in the future (Data Quality Campaign 2019).
Our interest in using this measure is twofold: first, we hope to observe whether the opioid crisis is associated with student learning from year to year; and second, we hope to explore how the crisis is associated with a more school-centric measure of academic performance than previous work has used. Using this measure of educational performance, we address the following central research questions:
How do average learning rates differ for students in counties with high distribution rates of prescription opioids compared to counties with low distribution rates of prescription opioids? Do these patterns vary by race, ethnicity, or SES?
Across all counties, is community opioid presence associated with student learning rates, adjusting for community demographics and educational context? Do these patterns vary by subject, race, ethnicity, SES, or rurality?
To investigate the link between the opioid crisis and learning rates, we analyze test score data from the Stanford Education Data Archive (SEDA, version 4.1), which includes nearly 430 million standardized test scores from all U.S. public school students for academic years 2008–2009 through 2017–2018. SEDA provides the average annual learning rate for every county in America by calculating the linear grade slope on average achievement across grades three through eight within cohorts; this provides a measure of how much the average student learns annually from third through eighth grade. Following Reardon (2019), we conceptualize these aggregate learning rates as indices of educational opportunity in middle childhood—particularly opportunities to learn provided by local elementary and middle schools. Although, like achievement levels, learning rates are likely influenced by family resources, neighborhood characteristics, the availability of afterschool programs, and other local conditions, learning rates more closely reflect the contribution of local schools given the central role of schooling in teaching math and reading skills for this age group (see Reardon [2019] for additional details on this conceptualization). Unlike average test scores, children’s aggregate learning rates are only weakly correlated with community-level SES and racial/ethnic composition; indeed, the factors underlying variability in children’s learning rates remain largely unknown (Drescher et al. 2022; Reardon 2019).
To these data, we merge prescription opioid distribution data from the Drug Enforcement Administration’s Automation of Reports and Consolidated Orders System (ARCOS). This database tracks the path of every single prescription opioid pill sold in the U.S., by shipment date, from manufacturers and distributors to every pharmacy in the country. Using these data, we derive the annual per-person rate of prescription pills distributed by pharmacies in a county (see the Data section for more details). Throughout this article, we refer to this measure as community opioid presence because it reflects the number of prescription opioid pills physically distributed within a community.
Using these data, we describe differences in student learning rates between counties with low levels of prescription opioid presence and counties with high levels of opioid presence. We examine whether these associations vary for students from different socioeconomic and racial/ethnic groups, and additionally map the geography of community opioid presence against student learning rates to explore the overlap of these factors across the country. We then utilize a precision-weighted regression model to describe the national association between community opioid presence and student learning rates, focusing on within-state variation. Although overall patterns of student learning rates are weakly linked to community SES and racial/ethnic composition, these relationships vary geographically (Drescher et al. 2022; Reardon 2019). We thus investigate whether opioid presence explains variation in the learning rate above and beyond sociodemographic differences among U.S. counties. Given the known relation between school context and learning rates (Atteberry and McEachin 2020; Reardon 2019), we also explore whether the relation between opioid presence and learning rates remains after accounting for numerous factors relating to educational context, such as per-pupil expenditure and student-teacher ratio. We describe the results of this model both in aggregate and for specific subjects and specific groups of students. Finally, we examine whether the relation between opioid presence and learning rates is moderated by rurality.
Opioids and Child Development
Excessive opioid supply and opioid addiction in a community may influence children’s access to educational opportunity and academic learning through multiple pathways highlighted in alcohol and drug environmental models (Gruenewald et al. 2013; Peisch et al. 2018). To date, a sizable corpus of research has examined the neurobiological consequences of prenatal chemical exposure to opioids among children born to opioid-using mothers. Past studies have documented longitudinal associations between prenatal opioid exposure and reduced cognitive, language, psychomotor, and health outcomes evident at infancy (Kim et al. 2021; Lee, Woodward, and Henderson 2019; Lee et al. 2020; Nygaard et al. 2015, 2017; Pac et al., 2023). Further, such work has found that cognitive disparities between prenatally exposed and nonexposed children not only persist but may in fact increase as children grow into middle childhood and adolescence (Nygaard et al. 2015). Similar patterns have emerged regarding social-emotional outcomes, with investigations showing that opioid-exposed children have significantly greater emotional and behavioral difficulties relative to their nonexposed peers across multiple time points (Jaekel et al. 2021; Nygaard et al. 2016) and that such difficulties worsen as children age (Jaekel et al. 2021). Children’s social-emotional challenges are known to translate into learning difficulties (e.g., Durlak et al. 2011).
Opioid prescription rates may also influence children’s academic trajectories through postnatal exposure to psychosocially adverse and chaotic home environments. Both nationally and across communities in Tennessee, Pennsylvania, and California, higher opioid prescription, usage, and mortality rates have been linked with greater risk of child abuse, neglect, and unintentional injury (Chapman, this volume; Morris et al. 2019; Sumetsky, Burke, and Mair 2020; Wolf et al. 2016). Relatedly, studies have found positive associations with overall child removal rates in California (Quast, Bright, and Delcher 2019) and removal rates for parental neglect in Florida (Quast, Storch, and Yampolskaya 2018). Among children whose parents use substances, those whose parents use opioids may be disproportionately vulnerable to involvement with child welfare relative to those whose parents use other substances (e.g., alcohol, amphetamines, and sedatives; Moreland et al. 2021). Given widely documented negative associations of child maltreatment (e.g., Romano et al. 2015) and foster care placement (e.g., Bruskas 2008) with children’s educational outcomes, opioid-related increases in such experiences would be expected to harm children’s opportunities for academic growth.
Even among children who do not experience maltreatment or entry into foster care, opioids may increase their vulnerability to other indices of poorer-quality home environments that affect their learning. Similar to other substances, greater opioid prevalence may increase risk for neglectful caregiving behaviors through impaired parental decision-making, reduced supervision, decreased parental warmth, and less responsive parent-child interactions (Luthar and Sexton 2007; Romanowicz et al. 2019; Slesnick et al. 2014). In light of the importance of stable home routines and secure parent-child attachments for children’s development and learning (e.g., Osher et al. 2020), opioid-related disruptions to these key processes would likely negatively influence children’s academic growth. Moreover, at least one study has linked maternal opioid use to children’s reduced participation in early childhood education (Kim et al. 2021). Given the benefits of high-quality preschool for children’s future academic trajectories (e.g., Phillips et al. 2017), lower participation may also exert negative effects. Finally, the opioid epidemic has been linked to increases in proportions of children raised in family structures that tend to be less stable (e.g., unmarried parents, single-father-headed households; Caudillo, Villarreal, and Cohen, 2023), which in turn may have adverse implications for children’s educational opportunities (e.g., Brown 2010).
Regardless of whether a child lives with opioid-using adults, high opioid prescription rates can also harm children’s educational opportunities through pathways in their broader community environments. For example, heightened prevalence of opioids in children’s neighborhoods may increase their exposure to intoxicated adults while decreasing their exposure to positive role models, both of which could plausibly interfere with learning opportunities and motivation (e.g., Hurd, Zimmerman, and Xue 2009). Disruptions to community-level factors known to protect against child maltreatment and boost academic learning, such as social cohesion and social control, may further undermine children’s academic development (Maguire-Jack and Showalter 2016). Attending school alongside children experiencing opioid-related problems may reduce the quality of learning even among children who do not experience such challenges. Because drug crises often victimize whole communities, not just individual households, it is essential to understand the aggregate impacts of opioids on children’s educational outcomes.
Community Opioid Prevalence and Children’s Educational Outcomes
Only two studies to our knowledge have directly linked the ravages of the opioid epidemic to the academic progress of children in affected communities. Using population-level national data, Darolia, Owens, and Tyler (this volume) noted strong negative relations between county-level drug-related mortality and standardized third- and eighth-grade test scores. However, as the authors acknowledge, their emphasis on deaths may overlook nonfatal negative effects of opioid use; moreover, they were unable to distinguish between opioid and nonopioid drug fatalities. Cotti, Gordanier, and Ozturk (2020) examine county-level increases in opioid prescription rates in South Carolina, finding a negative association with White students’ third- to eighth-grade test scores; no such association was found for non-White students. Nevertheless, it remains unknown whether community-level opioid prescription rates are associated with children’s academic growth on a national scale. Better understanding of this relation could allow for more targeted efforts to address disruptions caused by the crisis in schools.
In light of past work suggesting that the epidemic may disproportionately affect families of certain racial/ethnic and socioeconomic backgrounds relative to others (Case and Deaton 2020; Guy 2017; Humphreys et al. 2022; Oluwoye et al. 2020), we examine whether links between opioid presence and learning rates differ by students’ race, ethnicity, SES, and rurality. On balance, the extant literature suggests that opioid-related effects on child outcomes may be concentrated among White households (Cotti, Gordanier, and Ozturk 2020; He, Phillips, and Sedivy 2020; Monnat, this volume; Quast, Storch, and Yampolskaya 2018), with some evidence that Native American households are particularly vulnerable as well (He, Phillips, and Sedivy 2020; Monnat, this volume). Although few prior studies to our knowledge have examined whether opioid-related effects on children’s achievement vary by SES, we explore potential heterogeneity by SES in light of evidence that the epidemic has disproportionately harmed lower-SES communities in terms of both opioid exposure and mortality (Case and Deaton 2020; Friedman et al. 2019). There is some evidence of heterogeneity by rurality as well (Darolia, Owens, and Tyler, this volume; Cotti, Gordanier, and Ozturk 2020).
There are multiple within-school pathways through which community opioid presence may affect children’s educational outcomes. To start, scholars have documented the consequences of the opioid epidemic for teachers’ stress and well-being, noting the dearth of resources and training provided to educators in opioid-affected communities (Anderson, Troilo, and Tack 2019; Steketee 2020; Welby 2019). For example, in surveys of more than two thousand educators in West Virginia, Anderson, Troilo, and Tack (2019) found that more than 70 percent reported “emotional exhaustion, cynicism and a lack of personal accomplishment related to the changing classroom dynamics created by the opioid crisis.” Given widely documented relations between teachers' stress and turnover rates (e.g., Sass, Seal, and Martin 2011), as well as the negative consequences of teacher stress and turnover for children’s academic development (Hagermoser Sanetti et al. 2021), opioid-related teacher stress would be expected to harm students’ classroom learning. Relatedly, educator perspectives attest to the impacts of the epidemic on classroom functioning in the form of increased student absences, heightened student hunger and tiredness, and more students with unmet mental health needs (Litvinov 2019)—all factors known to depress educational outcomes (Ginsburg, Jordan, and Chang 2014; Steyer et al. 2022; Suldo et al. 2014). Finally, prenatal opioid exposure has been connected to higher rates of special education diagnoses and provision of special education services among school-age children (Fill et al. 2018). Given the elevated costs associated with these services, it is plausible that they have exerted additional pressures on districts’ already stretched budgets, reducing funds available for other critical school needs (Morgan and Wang 2019).
Learning Rates
Despite its potential to contribute novel information about children’s educational opportunities and outcomes beyond average test score performance levels, the extant literature on national learning rates remains small. As previously noted, aggregate learning rates are not strongly associated with community SES or racial/ethnic composition (Reardon 2019). Among rural school districts, however, the extent to which learning rates are correlated with community demographics varies greatly from one region of country to the next (Drescher et al. 2022). Notably, learning rates are not correlated with average academic achievement in third grade, implying that early- and middle-grade educational opportunities may be distinct dimensions of local educational opportunity structures (Reardon 2019). However, Drescher and colleagues (2022) observe a negative relationship among rural districts, positing that rural schools—particularly smaller ones—may be limited in their ability to provide challenging, differentiated instruction to support high-achieving students, and must prioritize their efforts on ensuring that all students meet a minimum level of proficiency.
Johnson, Kuhfeld, and Soland (2021) analyze heterogeneity in learning rates between different racial and ethnic groups of students using data from a large sample of schools that includes 25 percent of all public schools in the U.S. in academic year 2016–2017. Their paper found that while rural White students are growing faster than the national average for White students, rural Black, Hispanic, and Native American students are growing slower than the national average of their respective groups. Additionally, one online report has explored learning rates specifically among Native American students, finding substantial heterogeneity in learning rates for such students in communities across the country (Fahle and Reardon 2021). Against this nascent backdrop, we explore whether the nation’s opioid epidemic offers any hereunto unexamined explanatory power for community-level student learning rates, in the aggregate as well as by student race, ethnicity, and SES.
Data
Education data
Our education data come from SEDA (version 4.1), which reports nationally standardized measures of student achievement and learning rates for nearly every school, district, and county in the U.S., including measures disaggregated by student race/ethnicity and socioeconomic group. SEDA is based on assessment data from the EDFacts database at the U.S. Department of Education, which annually collects third- through eighth-grade standardized assessment results in mathematics and English language arts (ELA) from all fifty states and Washington, D.C. Following collection from EDFacts, achievement score estimates are linked to a common scale using the National Assessment of Educational Progress (NAEP) math and reading scales, enabling comparisons of achievement scores across the nation (Reardon, Kalogrides, and Ho 2019; Reardon et al. 2019). Estimates from SEDA v4.1 span academic years 2008–2009 through 2017–2018, including scores from approximately 430 million assessments. In addition, SEDA v4.1 includes standard errors for these estimates. Further details on SEDA’s construction are available from SEDA v4.1 technical documentation (Fahle et al. 2021).
The outcome of interest in this article is learning rate estimates. As noted, this measure is the linear grade slope on average achievement across grades three through eight within cohorts, representing how much the average student learns each year from third through eighth grade. To better understand the practical significance of this measure, note that multiplying this average annual rate by five produces the total growth of the average student between leaving third grade and finishing eighth grade. Estimates for learning rates are standardized and expressed in terms of standard deviations of the national student-level test score distribution. Thus, a county with a learning rate score of zero sits at the average of the national distribution. To interpret the magnitude of this measure, we also note that nationally, the average student’s score improves by about 0.33 standard deviations (SDs) per grade. Thus, a county with a learning rate of 0.033 SD indicates that the average student in that county is learning roughly 10 percent faster than the national average. Over the five years from third to eighth grade, a student in this county learns 5.5 grade levels of material—half of a grade level more than the national average. Although these measures can be biased if there is systematic in- or out-migration of high- or low-achieving students from a district or school, Reardon and colleagues (2019) find that these measures are, on average, unbiased and are highly correlated with average learning rate measures based on student-level longitudinal data.
Covariates
We include two categories of covariates that are provided by SEDA. Our county-level demographic controls consist of each county’s average SES and racial/ethnic composition. SEDA uses American Community Survey (ACS) data to construct SES estimates by taking the first principal component of six variables: median family income, proportion of adults with a bachelor’s degree or higher, household poverty rates, proportion of adults that are unemployed, proportion of households receiving Supplemental Nutrition Assistance Program benefits, and proportion of households with children that are headed by a single mother (see Fahle et al. [2021] for further details). For racial/ethnic composition, SEDA derives the proportion of Asian, Black, Hispanic, Native American, and White students in each county by aggregating school-level data drawn from the Common Core of Data. Our second category of controls, educational context, are similarly derived from the Common Core of Data (Fahle et al. 2021). These measures include the percentage of all students in each county with special education status, the percentage of all students in each county with English language learner (ELL) status, the percentage of all students in each county eligible for free or reduced-price lunch (FRPL), the percentage of grade three though eight students enrolled in charter schools, the pupil-teacher ratio in the average student’s school, the per-pupil expenditure in the average student’s district, and the total county enrollment of students in grades three through eight.
To explore whether we see moderation by rurality, we include a measure indicating the proportion of students in the county attending rural schools. SEDA utilizes urban-centric locale codes sourced from the National Center for Education Statistics (NCES), which are geographic indicators that categorize every U.S. school according to their proximity to densely populated areas. NCES categorizes schools within this framework according to the community in which the school is physically located and categorizes districts according to the locale type assigned to the majority of its students. For this reason, some students attend rural schools that are located in nonrural districts (and vice versa). Using this measure, we categorize as “rural” all counties where over 70 percent of students attend a rural-designated school. This categorization results in 957 rural counties and 2,080 nonrural counties. This urban-centric measure differs from the Economic Research Service’s commonly used Rural-Urban Continuum Codes (RUCC) in that it is both more granular and closer aligned to the educational experience of students (Drescher et al. 2022). However, we include RUCC-based categorizations of rural counties in addition to our preferred measure to check the sensitivity of our results and to make them comparable to other papers. Using this alternate measure, we first categorize as “rural” all counties that are labeled by the RUCC as “Nonmetro,” which results in 1,884 rural (nonmetro) counties and 1,153 nonrural (metro) counties. We then create a stricter definition, categorizing as “rural” only the 556 counties that are labeled by the RUCC as “Nonmetro – completely rural.” Under this final specification, the remaining counties are considered nonrural.
Opioid data
To SEDA we merge opioid distribution data from the Drug Enforcement Agency’s ARCOS. Ordinarily restricted for government use, data for years 2006 to 2012 were released to the public in 2019 as a result of a court order; in January 2020, data for 2013 and 2014 were released as well. We use a version of ARCOS that was cleaned, summarized, and released by the Washington Post. This version focuses on two prescription opioids, oxycodone and hydrocodone, because they are shipped in much higher quantities and diverted at far higher rates than other prescription opioids (Rich, Sánchez Díez, and Vongkiatkajorn 2019). The Washington Post has reported extensively on the distribution of pain pills throughout the U.S. based on this data, revealing “a virtual opioid belt of more than 90 counties” stretching across West Virginia, Tennessee, Virginia, and Kentucky (Higham, Horwitz, and Rich 2019; Washington Post 2020).
We generate a nine-year average pill-per-capita rate by pooling county pill counts across all nine years of the available data (2006–2014); we repeat this process for ACS five-year county population estimates provided by the Washington Post. We divide the resulting total pill counts by the total population estimates, thereby deriving the average pill-per-capita rate for each county in our sample. The resulting rates are standardized such that a one-unit increase in pill rate is equivalent to a one-SD increase, or twenty-three pills per person. We use these pill rates as our measure of county opioid presence. We prefer this operationalization of opioid presence over opioid-related mortality rates because it better captures the nonfatal aspects of the epidemic. Similarly, we prefer this measure over prescription rates because we assume the point of distribution (pharmacies) is more closely tied to the community of use than the point of prescription receipt (doctor’s offices), especially in rural communities and other health professional shortage areas.
Methods
We first provide estimates of the average learning rates in counties with high pill rates (“high-pill counties”) and counties with low pill rates (“low-pill counties”) for students in different racial, ethnic, and socioeconomic groups. For these estimates, we weight SEDA’s pooled learning rate estimates by the per-grade enrollment of each group: these estimates reflect the average learning rate of students from a given racial, ethnic, or socioeconomic group who live in a high-pill county or low-pill county. Second, we map county pill rates against county learning rates to understand the geographic distribution of both variables and examine the extent to which these rates correlate with one another.
Finally, we fit a precision-weighted regression model to estimate the conditional associations between average learning rates and pill rates, controlling for outlying counties in the top 1 percent of pill rates, county covariates, and state fixed effects. The models take the form

where Ŷcs is the estimated average learning rate in county c and state s, averaged across academic years 2008–2009 through 2017–2018; pcs is the average pill rate in county c and state s, averaged across years 2006 to 2014; ocs is a dummy variable indicating outlying counties in the top 1 percent of pill rates to account for rightward skew in the pill rate;
Results
We start by generating descriptive statistics of our sample, which includes all U.S. counties for which SEDA learning rate estimates, covariate data, and opioid data are available (Table A1). These 3,037 counties represent 96.8 percent of all U.S. counties and 99.9 percent of all U.S. public school students (excluding Puerto Rico). We observe an average county pill rate of 39 pills per person, with a lot of variation across counties (SD = 23.01). This large amount of variation appears to be driven by the quartile of counties with the highest pill rates, where some communities have experienced an annual influx of opioids as large as 301 pills per person (mean = 68.91, SD = 23.09). Even among our quartile of “low-pill” counties (mean = 15.85, SD = 6.36), we observe opioid rates higher than any other country on earth (Humphreys 2017).
We additionally provide descriptive statistics of our 759 high-pill counties and 760 low-pill counties (Appendix Table A2). We observe that high-pill counties have higher proportions of White students and dramatically lower community SES as compared to low-pill counties, which is consistent with prior research (Friedman et al. 2019). Notably, high-pill counties have lower proportions of students enrolled in rural schools than low-pill counties (48 percent and 67 percent, respectively). Among counties where over 70 percent of students attend rural schools, the average pill rate is 33.1 pills per person—21 percent lower than the pill rates in less rural counties. We note that this measure represents the proportion of students in the county attending rural schools, not the number of students in a rural county. This is an important distinction, since the population of students attending rural schools is different from the population of students attending rural districts or living in rural counties (Drescher et al. 2022). Bearing these important distinctions in mind, we add the commonly used county RUCC designations to compare pill rates between counties in a manner comparable to prior work. When dividing counties into the broadest two categories of “metro” and “nonmetro,” we observe the pill rates are only 4.2 percent higher in nonmetro counties. When dividing counties into three categories (metro, nonmetro micropolitan, and nonmetro rural), we actually find that rural counties have the lowest average pill rates (see Appendix Table A3).
We next compare learning rates between students in these counties to answer our first research question: how do average learning rates differ for students in counties with high pill rates compared to counties with low pill rates, and do these patterns vary by race, ethnicity, or SES? Table 1 reports the mean values for learning rates for the average student in low-pill counties compared to the average student in high-pill counties. The first row of Table 1 shows that the average student in a low-pill county annually learns at a rate 0.012 SD faster than the average student in a high-pill county (p < .001), amounting to an additional 0.06 SD of growth between third and eighth grade. Put another way, when compared to the national average, students in low-pill counties are learning 5.02 grade levels of material over five years, whereas students in high-pill counties are learning 4.96 grade levels of material over five years. This pattern holds within each racial/ethnic group. Native American students in low-pill counties are annually learning at a rate 0.018 SD faster than their counterparts in high-pill counties. Economically disadvantaged students in low-pill counties are annually learning at a rate 0.013 SD faster than their counterparts in high-pill counties, with a similar difference observed between non–economically disadvantaged students.
Learning Rates by Student Group, Weighted by Enrollment
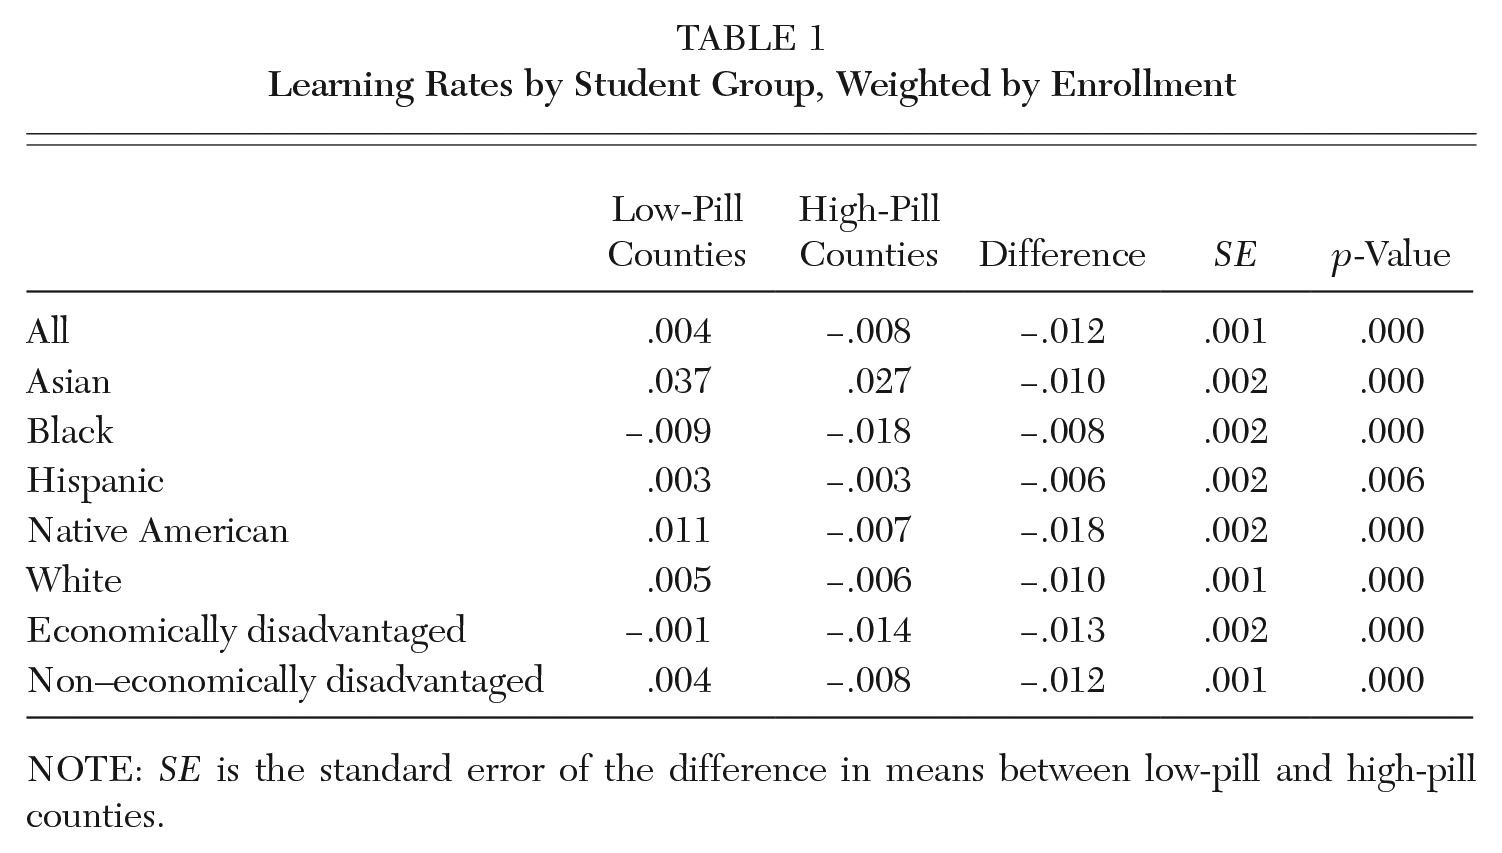
NOTE: SE is the standard error of the difference in means between low-pill and high-pill counties.
Before turning to our final research question, we explore regional variation in learning rates and opioid pill rates. We construct a map that displays the intersection of pill rates and learning rates across the county (Figure 1). Similar to Darolia, Owens, and Tyler (this volume), we use darker shading to indicate more distressed regions of the country: areas with both higher pill rates and lower learning rates. Conversely, counties with lighter shading have lower pill rates and higher learning rates. For example, most counties in Florida are impacted by both high pill rates and relatively low learning rates, whereas most counties in Wisconsin have the opposite pattern. The Appalachian Belt and large swaths of the Southeast are particularly distressed, although Tennessee remains a notable exception due to its high learning rates. We additionally observe troubling pockets in Maine and throughout the West. Visualizing the geography of our data provides helpful context for creating a national model. In particular, distressed counties do not appear to be randomly distributed throughout the country, but are concentrated in particular regions and states.
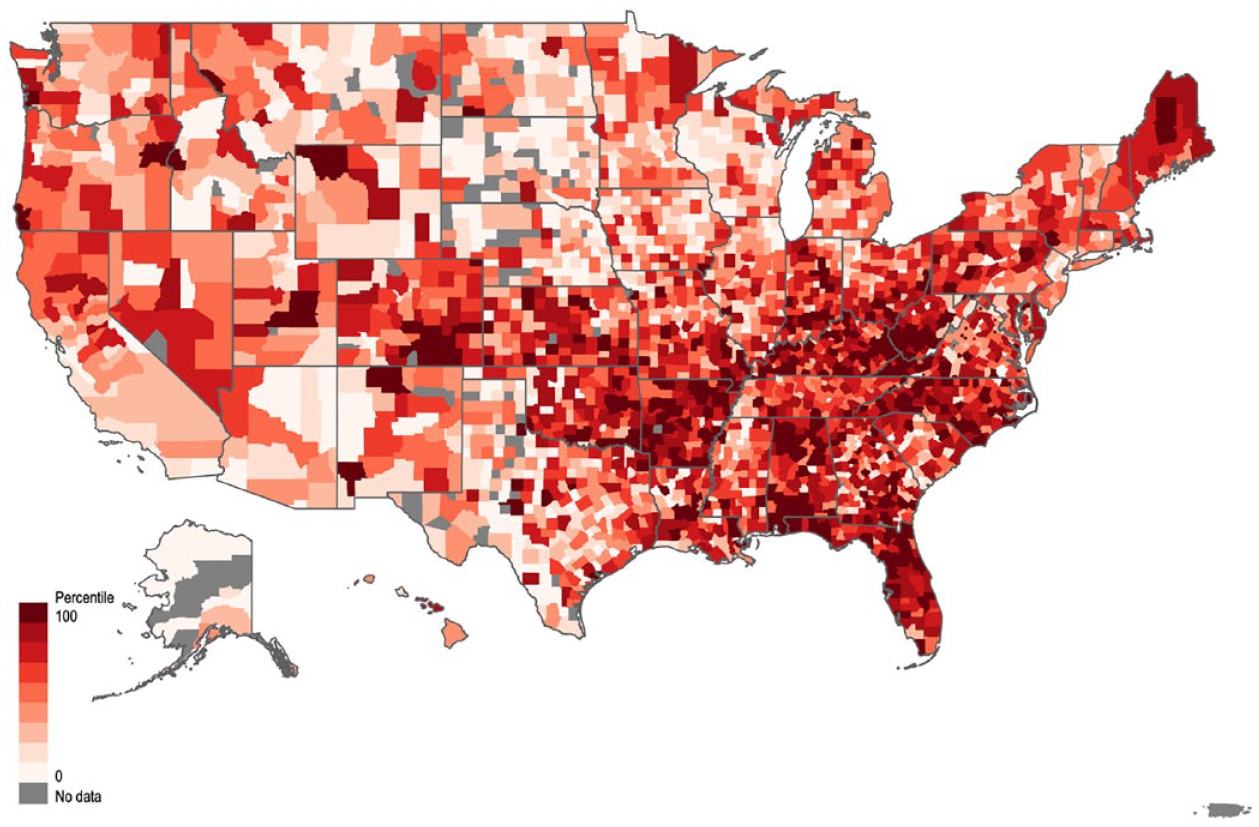
Geography of Student Learning Rates and Opioid Pill Rates in U.S. Counties
Our final research question asks whether there is a nationwide association between community opioid presence and student learning rates, net of community characteristics. Given the state-level patterns in learning rates and pill rates observed in Figure 1, we focus on within-state variation.
The first model in Table 2 describes the unconditional association between average county pill rate and average county learning rate. Column 1 shows that a one-unit increase in pill rate is associated with a 0.0025 SD decrease in learning rates (p < .01). This means that for every increase of twenty-three pills per person, students in the county learn 0.0125 SD less between grades three through eight than their peers in other counties. We add county SES and racial/ethnic composition in our second model to determine whether the relationship between pill rate and learning rate is attributable to county sociodemographic differences. We find that the coefficient reduces by 12 percent (b = –.0022, p < .01), suggesting that the negative relationship we observe may be mediated at least in part by demographic differences in counties. Finally, we add a number of educational context measures to explore whether the relationship between pill rate and learning rate may be attributable to differences in the learning environment. Our coefficient of interest reduces an additional 23 percent (b = –.0017, p < .05), suggesting that the relationship may be operating partially through the educational context.
Associations between County Opioid Presence and Student Learning Rates
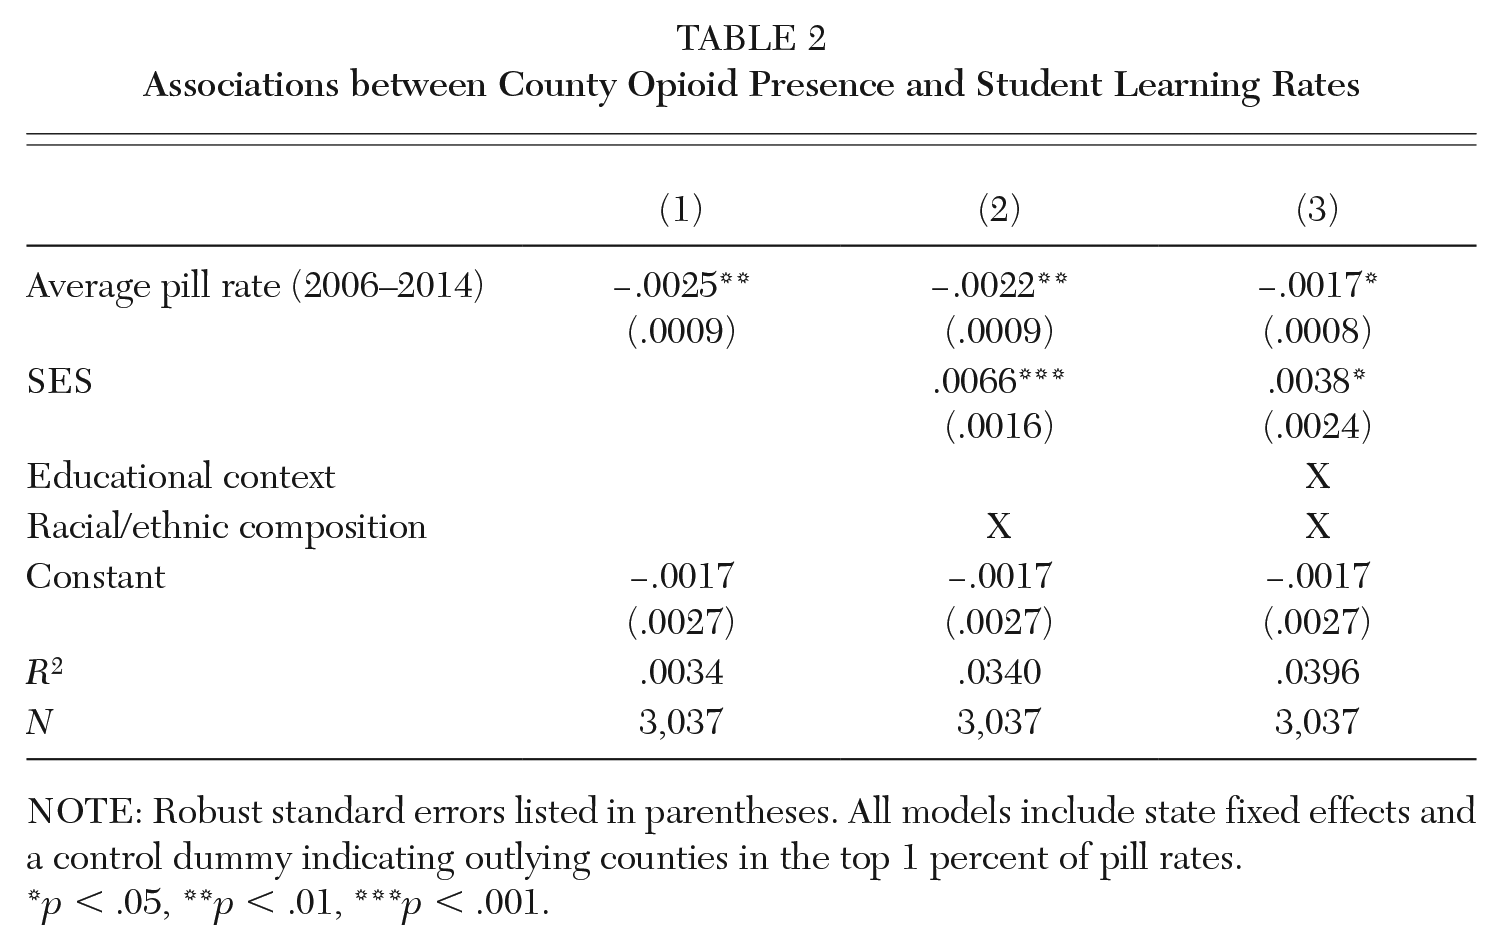
NOTE: Robust standard errors listed in parentheses. All models include state fixed effects and a control dummy indicating outlying counties in the top 1 percent of pill rates.
p < .05, **p < .01, ***p < .001.
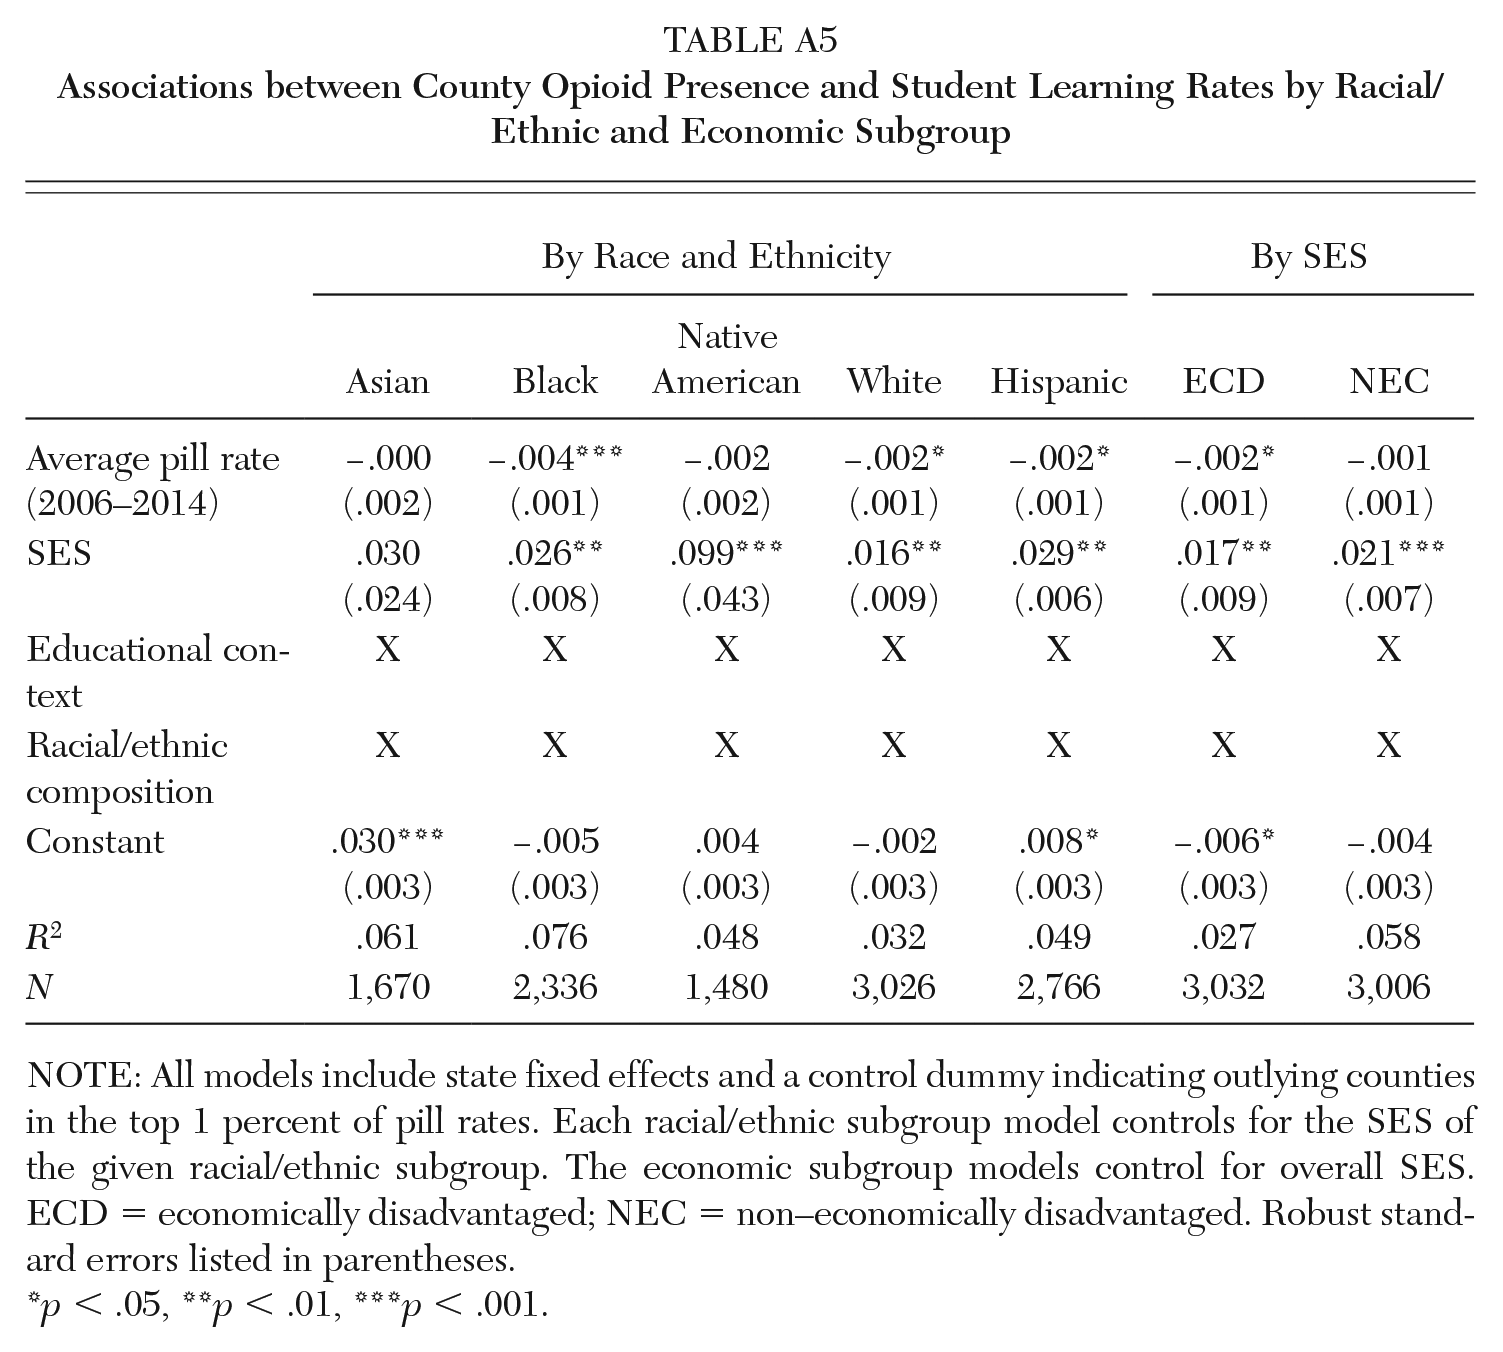
We explore patterns in much greater detail by running our preferred model by subject and by student group (Table 3). To do so, we utilize group-specific learning rates calculated by SEDA, which are only available in counties with student populations large enough to provide reliable estimates (Fahle et al. 2021, 39). For this reason, each group-specific model is drawn from a different sample of counties. Note, for example, that the model for Native American students relies on just 1,475 counties, whereas the model for White students relies on 3,021 counties. Using these results, we find that community opioid presence is more strongly associated with students’ learning rates in math than in ELA for Black, White, and Hispanic student groups and across socioeconomic groups. The strongest association between opioid presence and math scores is for Black students: for this group, a one SD increase in pill rate is associated with a 0.005 decrease in learning rates (p < .001). Our models for Native American and Asian students are not statistically significant. Overall, we note only small differences in learning rates between different student groups (to review by-subject results pooled across all students, see Appendix Table A4; to review by-group results pooled across subjects, see Appendix Table A5).
Associations between County Opioid Presence and Student Learning Rates by Racial/Ethnic and Economic Subgroup and by Subject
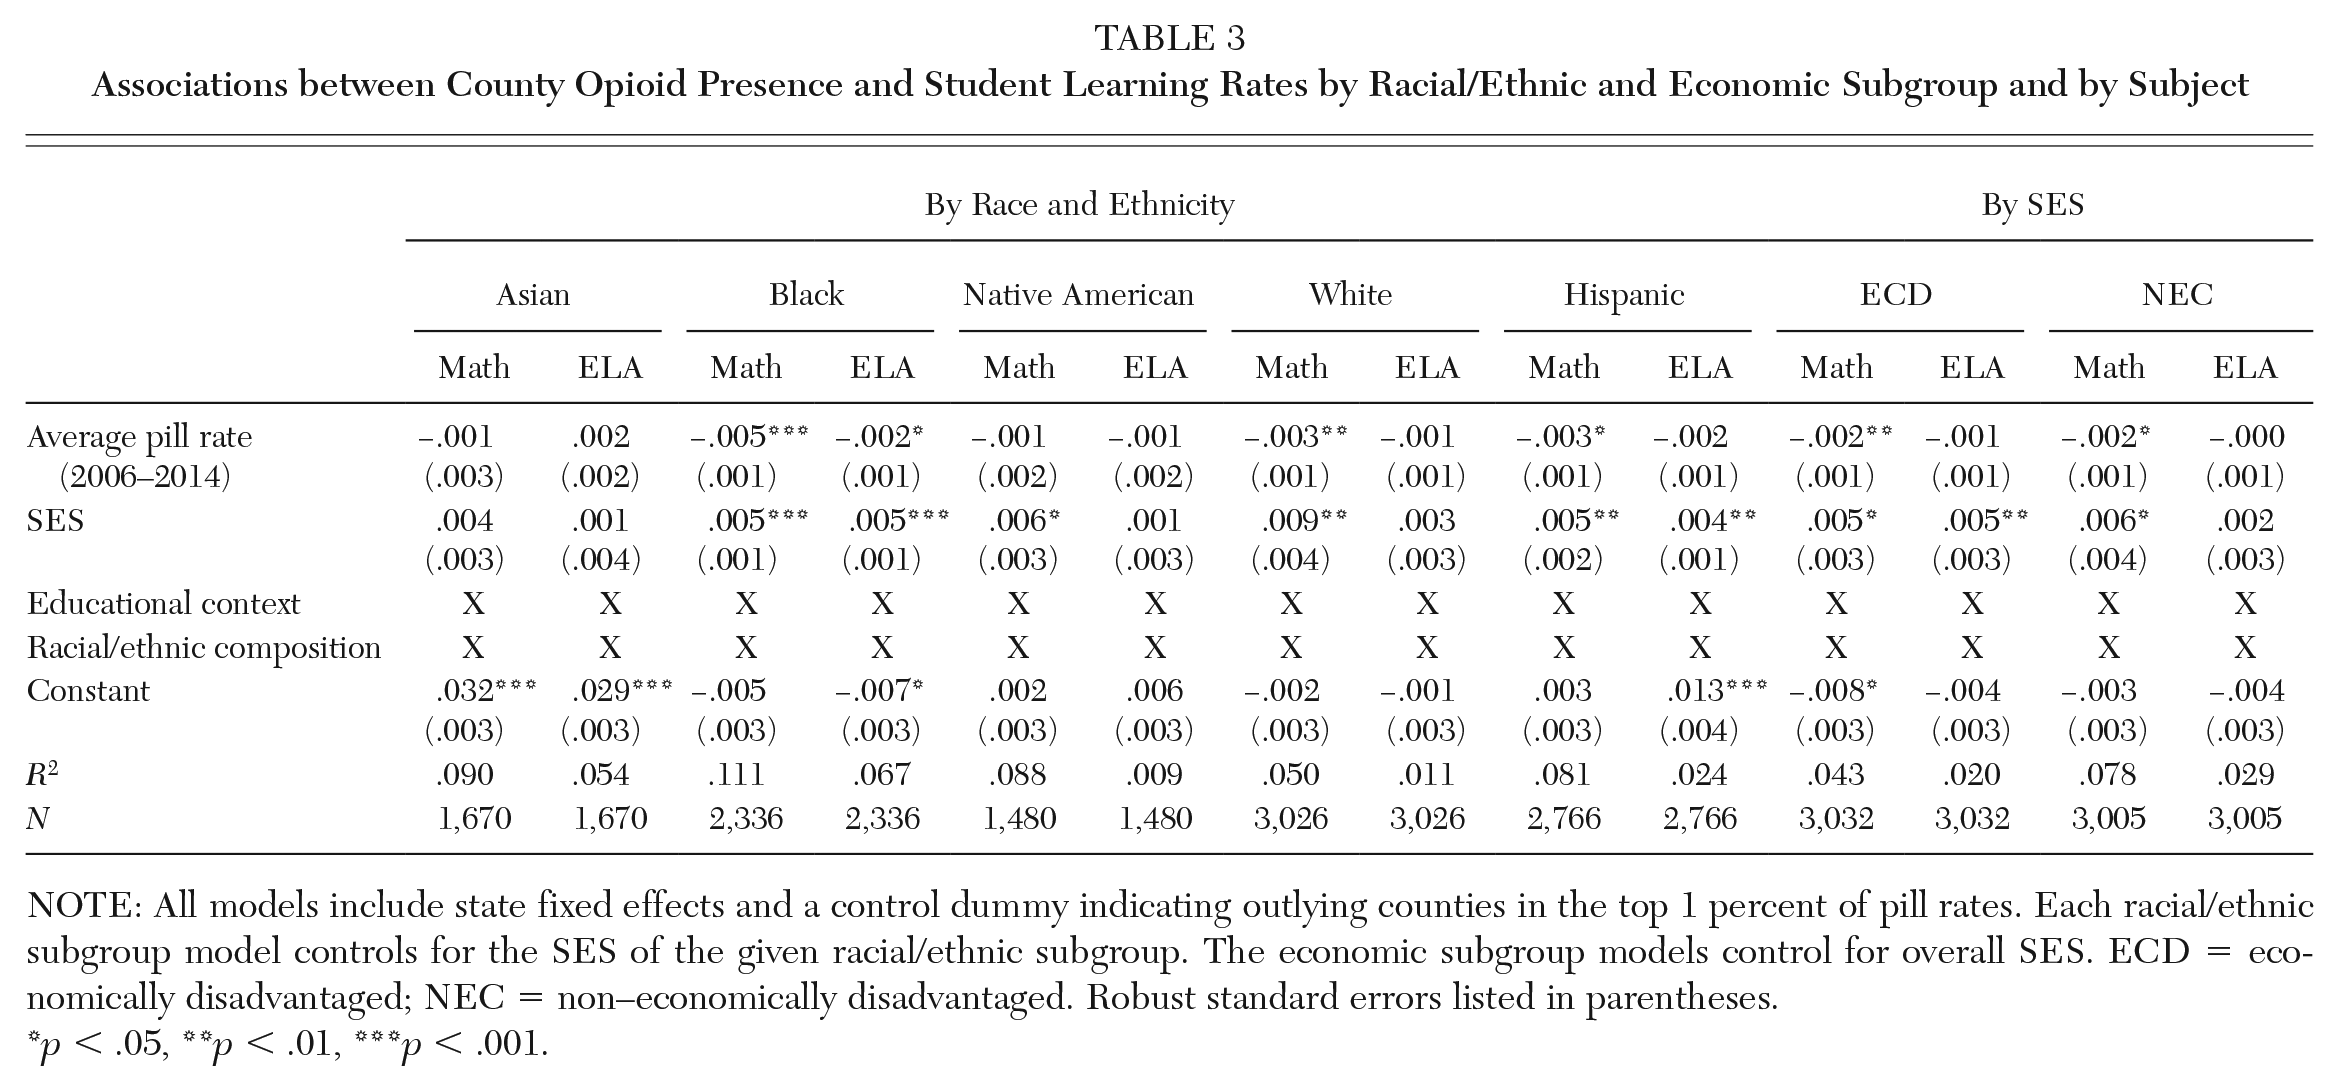
NOTE: All models include state fixed effects and a control dummy indicating outlying counties in the top 1 percent of pill rates. Each racial/ethnic subgroup model controls for the SES of the given racial/ethnic subgroup. The economic subgroup models control for overall SES. ECD = economically disadvantaged; NEC = non–economically disadvantaged. Robust standard errors listed in parentheses.
p < .05, **p < .01, ***p < .001.
Finally, we test whether the relationship between opioid presence and learning rates differs across rural and nonrural counties by interacting rurality with pill rates. We find that the interaction term is not significant and there is no moderation of the relationship between pill rates and learning rates (Table 4, column 1). These results are robust to differing definitions of rurality. Across all three rural moderation models, the coefficient for pills is similar to those observed in Table 2. Overall, we find no evidence that being in a rural county affects the relationship between pill rates and learning rates.
Associations between Opioid Presence and Learning Rates, Moderated by Rurality
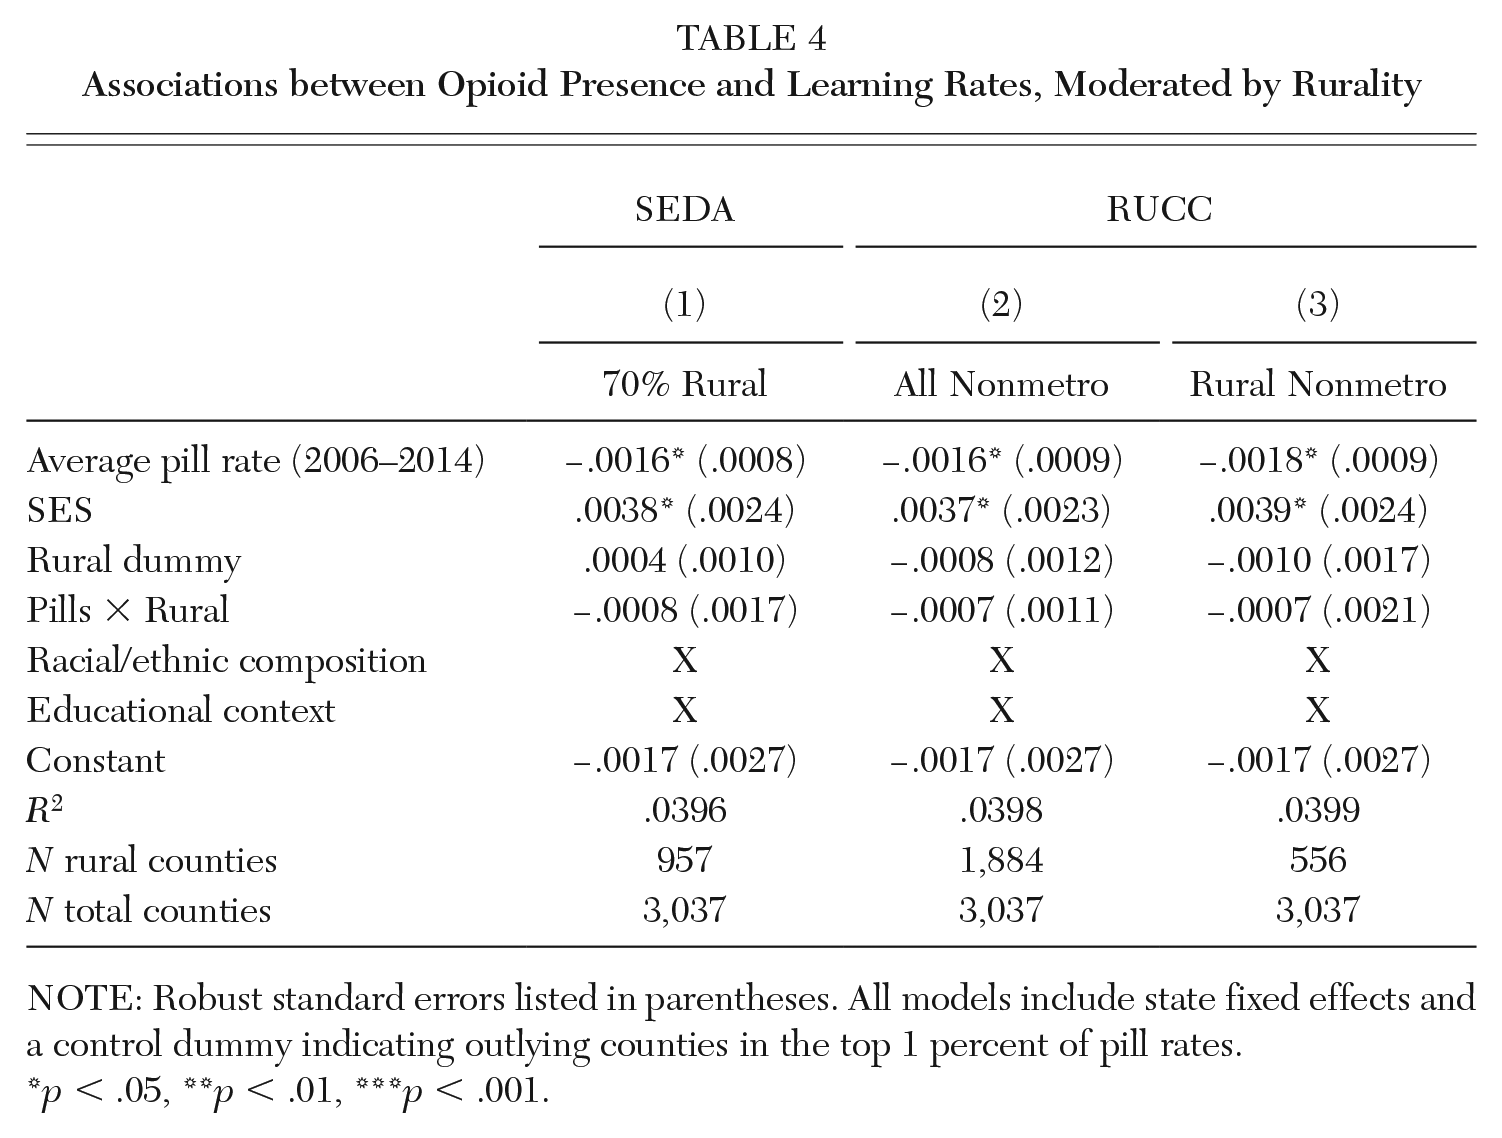
NOTE: Robust standard errors listed in parentheses. All models include state fixed effects and a control dummy indicating outlying counties in the top 1 percent of pill rates.
p < .05, **p < .01, ***p < .001.
Discussion
We believe this is the first national study to examine the link between community opioid presence and student growth rates. Using data from SEDA and the Drug Enforcement Agency’s ARCOS, we found noteworthy associations between community opioid presence and children’s learning rates.
First, students in counties with high levels of community opioid presence are learning at modestly slower rates than peers in counties with low levels of community opioid presence. This is true whether we focus on all students or specific racial/ethnic and socioeconomic groups of students. Overall, the average student in a low-pill county annually learns at a rate 0.012 SD faster than the average student in a high-pill county. While this difference is statistically significant, it is also modest: average student achievement improves by 0.33 SD per year, so the overall difference is about 4 percent of the average learning rate. We see the largest difference in learning rates for Native American and economically disadvantaged students. When compared to the national average, for example, Native American students in low-pill counties are learning 5.06 grade levels of material over five years, whereas Native American students in high-pill counties are learning 4.97 grade levels of material over five years.
Second, we observe in our national models a small negative relationship between county opioid presence and student learning rate. In our simplest model, a twenty-three pill per person increase is associated with a 0.0025 SD slower annual learning rate, or 0.0125 SD lower total growth over five years. This association is partially explained by differences in county SES and racial/ethnic composition, suggesting that the relation between opioid presence and learning rates could be operating in part through out-of-school pathways—pathways that may disproportionately affect some student groups more than others. Potential out-of-school pathways include opioid-related disruptions in the home, such as through impaired parental decision-making and reduced supervision, as well as opioid-related disruptions in the community, including reduced social cohesion and less exposure to positive role models (Maguire-Jack and Showalter 2016; Hurd, Zimmerman, and Xue 2009).
Our analyses show that the association is further explained by educational context, suggesting that a possible link could be operating through in-school pathways as well. These context variables include the proportion of students with special education status, the proportion of students with ELL status, the proportion of FRPL-eligible students, the percentage of grade three through eight students enrolled in charter schools, the average pupil-teacher ratio, the average per-pupil expenditure, and the total county enrollment of students in grades three through eight. Potential in-school pathways include instability in the classroom, including hungry, tired students and stressed, overextended teachers (Steyer et al. 2022; Anderson, Troilo, and Tack 2019). This may also reflect increased pressure on school budgets in direct response to the crisis, including increased needs for special education services and mental health services, which may divert funds from expenses that enhance opportunities to learn, such as enrichment activities or classroom assistants (Fill et al. 2018; Morgan and Wang 2019).
Third, our results show that community opioid presence is more strongly associated with learning rates in math than reading. Prior work has suggested that math skills are more influenced by in-school factors than reading skills, so this finding further suggests that the association between opioid presence and learning rates is partially operating through in-school factors (e.g., Ma and Klinger 2000). We observe this pattern in the aggregate as well as across most student groups. That this pattern is true for most student groups is noteworthy given that prior work focusing on achievement found associations only for White students (Cotti, Gordanier, and Ozturk 2020). Notably, the national relationship between opioid presence and learning rates is not significant for Native American students. While this may appear in contrast with our cross-sectional findings that directly compare learning rates between low-pill and high-pill counties, it is important to note that there are other differences between these counties that could be driving heterogeneity in learning rates for Native American students. For example, low-pill counties have much higher community SES than high-pill counties, which could influence Native American learning rates, on average, more than it influences other student groups.
Finally, we find that the relationship between community opioid presence and student learning rates does not differ between rural counties and nonrural counties. In addition, we find that counties with the highest levels of opioid presence have lower proportions of students attending rural schools than counties with the lowest levels of opioid presence. In fact, pill rates are not significantly higher in rural counties for any of our specifications of “rural.” Although this pattern may initially appear in contrast with prior work, we note that such work has identified that the percentage of patients prescribed an opioid was higher in rural than in urban areas (García et al. 2019); the aggregate number of pills distributed to rural areas was not necessarily higher. Similarly, although opioid-related mortality has grown faster in rural counties than nonrural counties, opioid-related mortality is geographically heterogenous and, in fact, higher in urban counties on average (National Center for Health Statistics 2021; Rigg, Monnat, and Chavez 2018). It is important to note that while predominantly rural states have experienced some of the earliest and deepest impacts of the opioid crisis, the epidemic’s influence on learning and schools may be more broadly felt.
The patterns we observe build upon prior work by examining a new dimension of educational performance: learning rates. Because this measure of student growth is generally believed to more accurately reflect student learning in schools than achievement levels, we hope that this article can provide more insight into how the opioid crisis may be affecting student learning in the classroom. We expect that the small negative relationship we observe nationally might vary significantly across communities that have experienced the epidemic to differing degrees of severity, particularly in hard-hit states like West Virginia. West Virginia University’s Project TRAIN has surveyed teachers throughout the state, finding that teachers feel underprepared for students arriving at school more worried about “survival” than learning. Their work indicates that there are several school-based needs that can be addressed through policy and everyday practice, including increased staff support via counselors and social workers and access to trainings on topics such as the effects of addiction on families and classroom strategies for engaging with affected children (Project TRAIN, n.d.). State policymakers and district-level school officials should work together to address these needs. In addition, current and upcoming litigation brought against pharmaceutical and marketing companies by school districts are an important tool for addressing the epidemic’s effect on U.S. public schools. Such litigation is relying on research linking in utero opioid exposure to increased rates of students who need costly special education services; future causal research may enable districts to seek compensation for children not only exposed in utero, but also those exposed to community opioid presence throughout childhood.
In addition to these in-school pathways, our conceptualization of student growth asserts that, like achievement levels, learning rates are influenced by students’ social conditions as well. Policies and other actions that address the underlying social conditions are likely as important to improving academic performance as school-based responses. This could be tackled through federal, state, and local prevention efforts to reduce prescription opioid use and subsequent community-level child harm. For example, the federal government could vastly expand access to the most effective forms of substance use disorder treatments through care providers employed by the Veterans Health Administration (U.S. Department of Veterans Affairs), Military Health System (U.S. Department of Defense), Indian Health Service (U.S. Department of Health and Human Services), and Community Health Centers (U.S. Department of Health and Human Services).
This article has several limitations. One is that we cannot assume there are causal mechanisms underlying the different patterns we see between learning rates of students in high-pill and low-pill counties; we are merely describing associations. Another is that the patterns we describe apply to grades three through eight, so we cannot speak to the trends in learning rates drawn from earlier or later grades, which may differ from what we observe. Future scholarship should examine the predictive utility of county opioid rates for other educational outcomes, such as academic achievement, as community opioid presence may exert its strongest influence on educational outcomes that are more closely linked to underlying social conditions. Additionally, it may be the case that the influence of opioid presence on learning rates could vary temporally, affecting younger children more strongly than older children (Shonkoff et al. 2012). Finally, although our measure of opioid presence has important advantages, it is also limited to the extent that pills move across county borders. It would be worthwhile to investigate whether other measures of opioid presence in a community, such as overdose rates, explain additional variance in learning rates beyond prescription pill rates. These types of analyses will be important for continuing to highlight the spillover effects of the opioid crisis on children in the U.S.
Footnotes
Appendix A
Associations between County Opioid Presence and Student Learning Rates by Racial/Ethnic and Economic Subgroup
| By Race and Ethnicity | By SES | ||||||
|---|---|---|---|---|---|---|---|
| Asian | Black | Native American | White | Hispanic | ECD | NEC | |
| Average pill rate (2006–2014) | −.000 (.002) |
−.004***
(.001) |
−.002 (.002) |
−.002*
(.001) |
−.002*
(.001) |
−.002*
(.001) |
−.001 (.001) |
| SES | .030 (.024) |
.026**
(.008) |
.099***
(.043) |
.016**
(.009) |
.029**
(.006) |
.017**
(.009) |
.021***
(.007) |
| Educational context | X | X | X | X | X | X | X |
| Racial/ethnic composition | X | X | X | X | X | X | X |
| Constant | .030***
(.003) |
−.005 (.003) |
.004 (.003) |
−.002 (.003) |
.008*
(.003) |
−.006*
(.003) |
−.004 (.003) |
| R 2 | .061 | .076 | .048 | .032 | .049 | .027 | .058 |
| N | 1,670 | 2,336 | 1,480 | 3,026 | 2,766 | 3,032 | 3,006 |
NOTE: All models include state fixed effects and a control dummy indicating outlying counties in the top 1 percent of pill rates. Each racial/ethnic subgroup model controls for the SES of the given racial/ethnic subgroup. The economic subgroup models control for overall SES. ECD = economically disadvantaged; NEC = non–economically disadvantaged. Robust standard errors listed in parentheses.
p < .05, **p < .01, ***p < .001.
Correction (April 2023):
Article updated online to correct the acronym SEDA, and some grammatical errors in the text. The URLs for Anderson, 2019; Data Quality Campaign, 2019; and Quast, 2018 have been updated in the references.
NOTE: This article would not have been possible without the assistance of Sean Reardon and Demetra Kalogrides. We thank Sam Owens for his assistance with the distress map. The research described here was supported by a grant from the Institute of Education Sciences (R305B140009) and by the Robert Wood Johnson Foundation through the Health Policy Research Scholars fellowship award. The opinions expressed are those of the authors and do not represent views of the Institute of Education Sciences, the U.S. Department of Education, the Board of Trustees of the Leland Stanford Junior University, or the Foundation.
Jessica Drescher (
Lily Steyer (
Carrie Townley-Flores (
Keith Humphreys (