
Abstract
We review the literature on the expansion of the Child Tax Credit in 2021, as it relates to food and financial hardship among households with children in the U.S. Extant scholarship consistently finds that receipt of the expanded tax credit is associated with an increase in food purchases and declines in food insufficiency and food insecurity. The effects of the tax credit expansion also vary by the socioeconomic characteristics of families. There are important differences, though, in effect sizes across studies, indicating that data sources, timeframe of analysis, and the way in which food hardship is measured all matter to the accurate estimation of effects. The effect of the credit on financial hardship is less conclusive, with the literature finding generally insignificant effects on measures such as difficulty paying rent or bills.
Keywords
In 2021, 12.5 percent of households with children were classified as food insecure (Coleman-Jensen et al. 2022). This means that at some point during the year, these households were unable to acquire adequate food for one or more household members. Despite 2021 coinciding with the height of the COVID-19 pandemic in terms of hospitalizations and deaths, food insecurity among households with children decreased in 2021 from 2020. In 2020, 14.8 percent of households with children were food insecure. Further, food insecurity among households with children was lower in 2021 than it was before the start of the COVID pandemic in 2019, when 13.6 percent of those families were food insecure. This same pattern holds for another measure of food hardship: food insufficiency, a measure that captures whether households sometimes or often did not have enough to eat. In 2019, 3.6 percent of households with children were food insufficient, 3.9 percent in 2020, and down to 3.2 percent in 2021. Other measures of household hardship follow a similar trend. Households with children were approximately 18 percent less likely to have problems paying their rent, mortgage, or utility bills in 2021 compared to 2020 (Karpman et al. 2022).
This decline in household food and financial hardship may be attributed to expansions in the social safety net as the government sought to combat the economic downturn brought on by the pandemic. In this article, we focus on one important change to the social safety net, the expansion of the Child Tax Credit (CTC). The CTC expansion, passed as part of the 2021 American Rescue Plan (ARP), increased the maximum credit, made the credit fully refundable (the tax credit was paid to families even if it exceeded the amount of taxes that the families owed) and available to nonworkers, and was offered as advanced monthly payments from July to December 2021. In January 2022, the CTC reverted to its pre-ARP values and structure.
The expansion sparked a flurry of research on the immediate impacts of the CTC on food and financial hardship, which we summarize in this article. Collectively, the research finds that the CTC expansion was successful in alleviating food hardship. Specifically, CTC receipt is associated with an increase in food purchases (Hamilton et al. 2022; Roll et al. 2021; Zippel 2021), a decline in food insufficiency among households with children (Bouchelle et al. 2022; Bovell-Ammon et al. 2022; Parolin et al. 2021; Perez-Lopez 2021; Shafer et al. 2022), and declines in food insecurity among households with children (Karpman et al. 2022; Pilkauskas et al. 2022; Rook et al. 2023). For financial hardship, research on CTC receipt has found small and statistically insignificant effects in terms of alleviating difficulty paying for housing and utility costs (Karpman et al. 2022; Pilkauskas et al. 2022) and usual household expenses (Parolin et al. 2021; Perez-Lopez 2021).
The effects of the CTC expansion vary by socioeconomic characteristics of families, such as income (Bouchelle et al. 2022; Bovell-Ammon et al. 2022; Hamilton et al. 2022; Karpman et al. 2022; Parolin et al. 2021) and race and ethnicity (Hamilton et al. 2022; Parolin et al. 2021). There are also important differences among the studies in terms of the measurement of food hardship, the time frame of analysis, and the data source. Moreover, these differences make comparisons of the current CTC literature to previous studies challenging.
Given the prevalence and importance of research on the relationship of the expanded CTC to food insecurity and financial hardship in the U.S., this article provides a comprehensive guide to what we have learned and to the significance of those findings. First, we discuss the multiple ways in which food hardship can be measured, pointing out the ways in which measurement can change, depending on the data sources and population samples that researchers use. We then summarize the existing literature on the CTC and food hardship. Next, we examine of the relationship of the CTC to financial hardship. We then lay out the ways in which recent estimates of the CTC on food hardship compare to previous estimates of the effects of income and program participation on the same measures. We conclude by discussing the importance of the CTC to food and material hardship in a broad context, highlighting areas where further research is needed.
Measuring Food Hardship
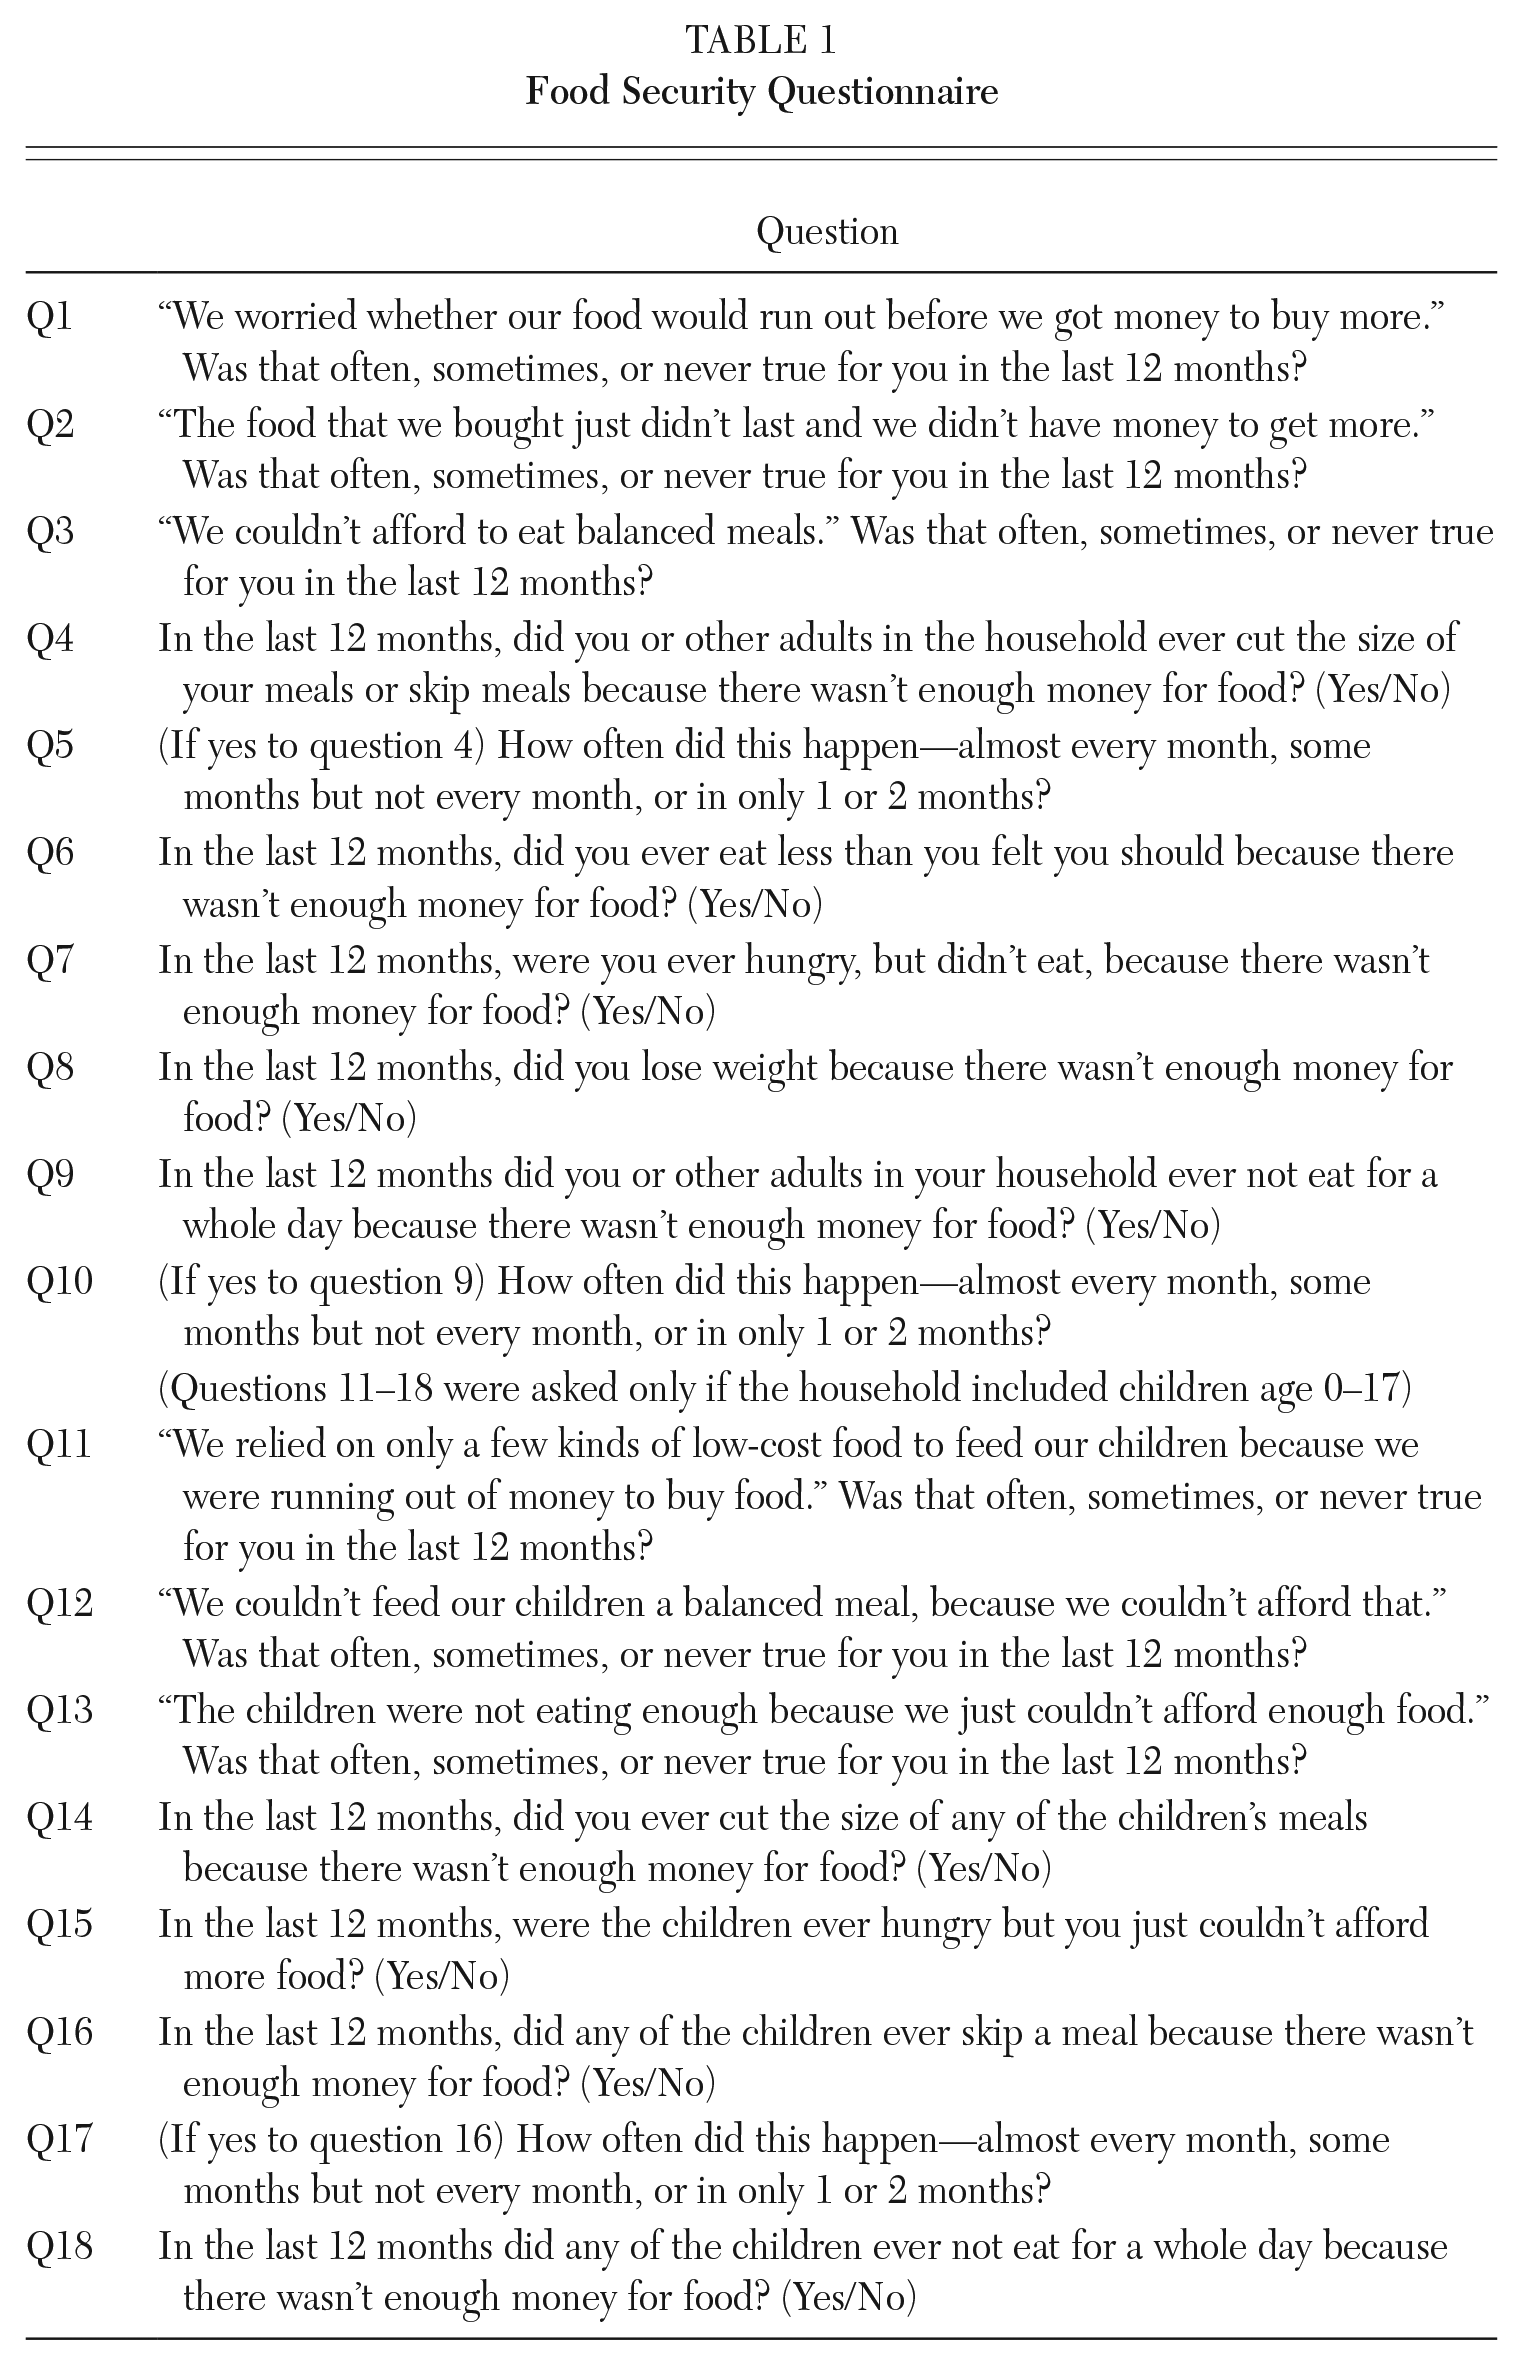
Official food security statistics are reported annually by the U.S. Department of Agriculture (USDA) as derived from the Current Population Survey (CPS) Food Security Supplement (FSS). The FSS is administered every December by the U.S. Census Bureau as a supplement to the monthly CPS labor force survey. Household food security is determined by the number of affirmative responses to an 18-item questionnaire for households with children under the age of 18 and a subset of 10 questions for those households without children. The questions measure a wide range of food hardship indicators, ranging from relatively mild conditions, such as worry that food might run out, to more severe indicators, such as skipping meals. To distinguish between hardship and dieting or fasting, the conditions are stipulated to result from financial constraints. The FSS covers both the 12 months prior to the December survey, as well as the immediate 30 days prior, with official statistics based on the 12-month reference period. The full 12-month questionnaire is shown in Table 1. Households are classified as food insecure if they respond affirmatively to at least three questions.
Food Security Questionnaire
An alternative measure of food hardship in the CPS FSS is known as food insufficiency, which captures the adequacy of food in the household. Specifically, households are asked, “Which of these statements best describes the food eaten in your household—enough of the kinds of food (I/we) want to eat, enough but not always the kinds of food (I/we) want to eat, sometimes not enough to eat, or often not enough to eat?” Although not stated explicitly, the implied reference period for the question is the previous 12 months. Households that respond that they sometimes or often do not have enough to eat are classified as food insufficient. Though it is not included in official USDA annual reports, the food insufficiency question is important in determining the universe of individuals surveyed in the FSS to reduce respondent burden. If households respond in the affirmative to the above question, or if household income is below 185 percent of the federal poverty line (FPL), or if they report running short of money to afford food in a separate question, then they are included as part of the sample universe for the FSS.
Trends in food insecurity and food insufficiency among households with children in the CPS FSS are shown in Figure 1, dating from 2001 to 2021. In an average year, rates of food insecurity are about three and a half times higher than rates of food insufficiency (17.1 percent versus 4.8 percent), reflecting the fact that food insufficiency captures a more severe form of food hardship. Both measures experience a surge during the Great Recession and don’t return to prerecession levels until 2017. The spikes due to the COVID pandemic and its immediate decline are also clear.
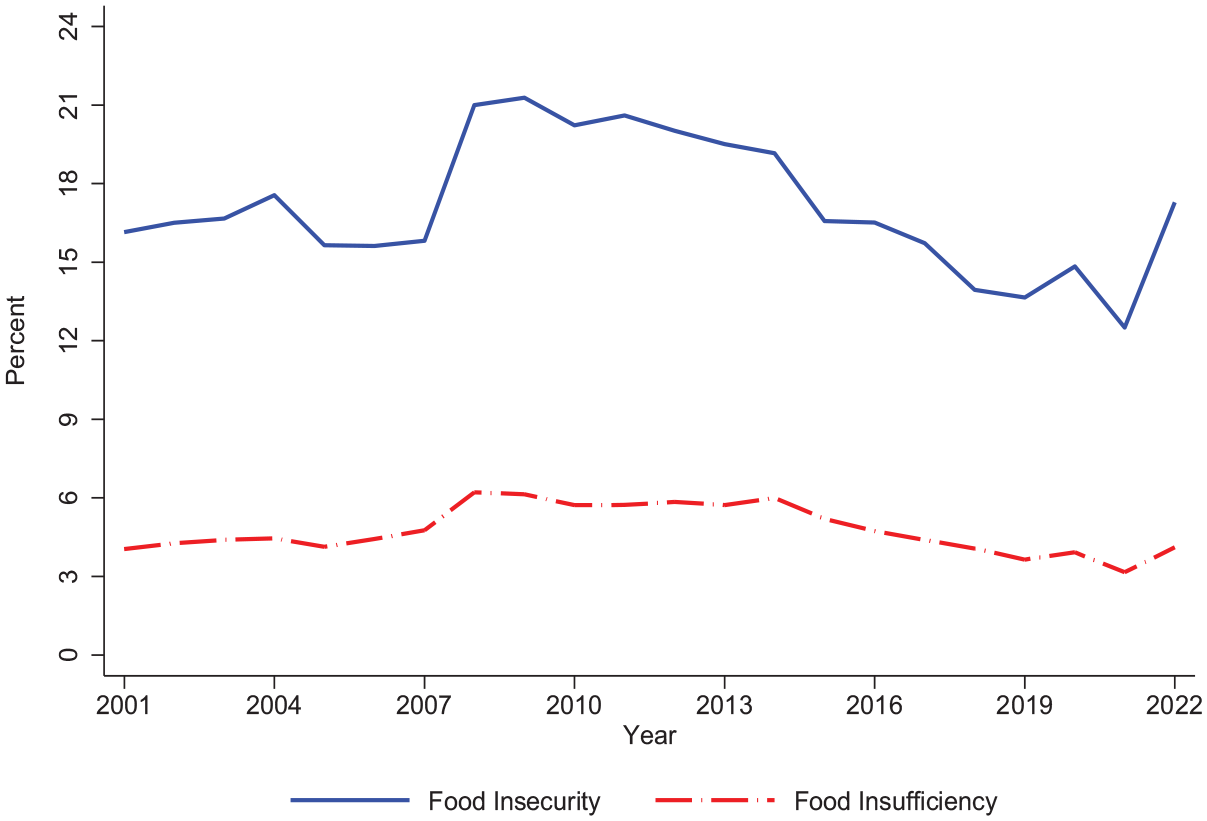
Food Insecurity and Insufficiency among Households with Children—CPS FSS
The FSS is fielded in whole or in part in numerous social surveys beyond the CPS, including the Panel Study of Income Dynamics, the National Health Interview Survey, the National Health and Nutrition Examination Survey, among others. Each of these surveys has been used to study food insecurity among children (for a survey, see Gundersen and Ziliak 2014). However, while official food-security statistics come from the CPS FSS, it and other existing surveys were ill-suited to provide up-to-date information on household well-being during the pandemic. To address this challenge, the U.S. Census Bureau launched the Household Pulse Survey in April 2020. The Pulse is fielded weekly and is designed to collect information on pandemic disruptions using a 20-minute online survey to minimize respondent burden. As such, food hardship information in the Pulse is limited to just the food insufficiency measure instead of the full 18-item FSS questionnaire. Additionally, the Pulse asks respondents about their food insufficiency over the past seven days, compared to the prior 12 months in the CPS FSS.
Figure 2 shows weekly levels of food insufficiency from January 6, 2021, to December 9, 2022, using the Pulse. The survey weeks June 23, 2021, and December 29, 2021, are highlighted to show food insufficiency immediately prior to the expanded CTC payments and the end of the expanded payments, respectively. Figure 2 shows an immediate decline in food insufficiency after the expanded CTC payments are available. However, rates increase steadily from wave 37 (September 1, 2021) to wave 47 (June 29, 2022), which coincides with the dramatic increase in food prices experienced during this time, as well as the expiration of many modifications made to unemployment insurance during the pandemic. Figure 2 also shows that food insufficiency rates are much higher in the Pulse than in the CPS. In 2021, the average prevalence of food insufficiency among Pulse households with children was 12.1 percent, compared to just 3.2 percent in the CPS. Indeed, food insufficiency levels in the Pulse more closely resemble food insecurity levels in the CPS. Though the Pulse was crucial for collecting immediate information on household well-being and is the source of most of the evidence to date on the effects of the expanded CTC on child food hardships, there is a concern of nonresponse bias affecting household food insufficiency levels in the Pulse (Peterson et al. 2021).
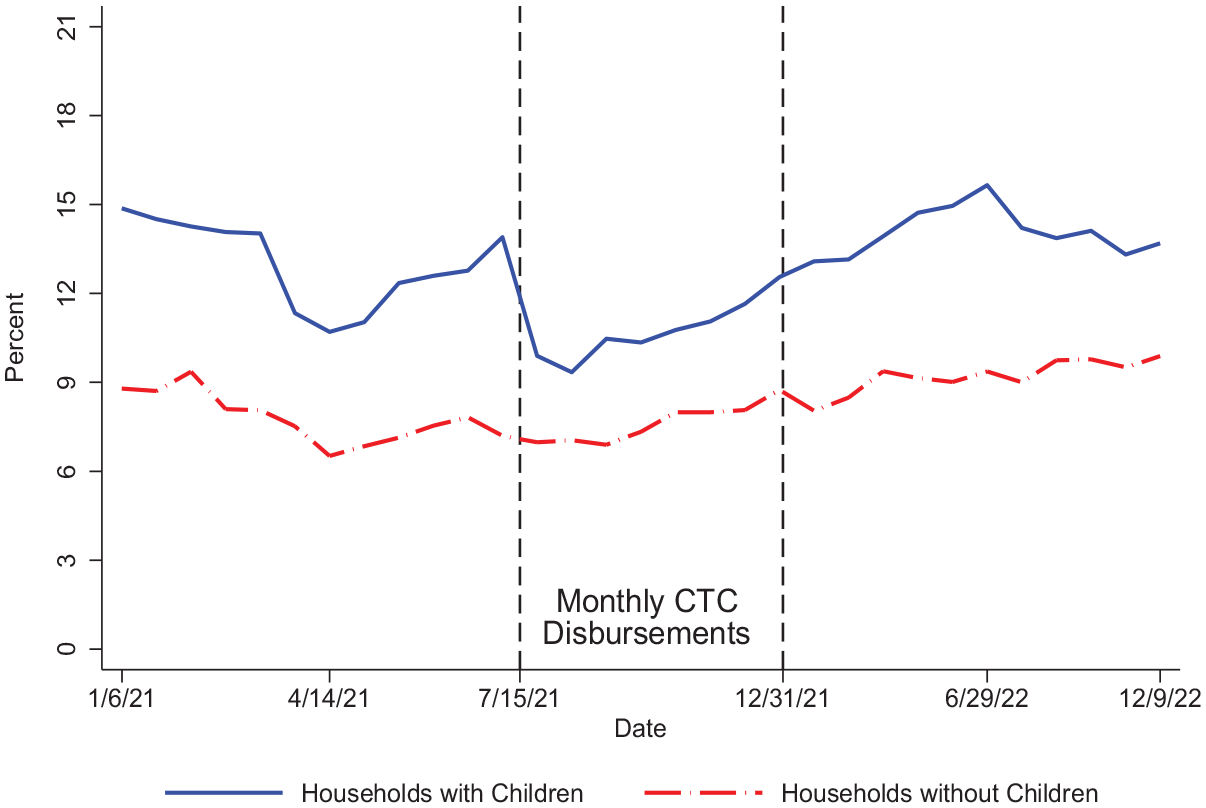
Food Insufficiency among Households with and without Children—Pulse
Beyond the binary indicators of food insecurity and insufficiency as measures of food hardship, the CPS collects information on food expenditures, whether current spending is sufficient to meet food needs and, if not, how much more (or less) could be spent on food each week to meet needs. These metrics are comparatively underutilized in the CPS and yet can offer additional insights into the financial strains within the household (Gundersen and Ribar 2011; Moellman 2020).
On the left axis of Figure 3, we present trends in the share of households with children reporting that they need more food to meet needs; on the right axis, we report the real equivalized dollar amount of additional weekly spending required to meet needs. Dollar amounts are in 2021 terms, based on the Personal Consumption Expenditure Deflator and equivalized using the modified Organisation for Economic Co-operation and Development (OECD) scale that assigns a value of 1 to the first adult, 0.5 to each additional adult and each child aged 14 and older, and 0.3 to each child aged 13 and under. The left panel shows the two series for all households with children in the FSS, and the right panel is for food-insecure households with children. Even though food insecurity and insufficiency fell in 2021 as demonstrated in Figure 1, the share of households stating they needed to spend more to meet needs increased as did the equivalized dollar amount. The right panel shows that the level reporting that they need to spend more is at least three times higher among food-insecure households with children than among households with children overall, and the dollar amount of unmet need is about five dollars higher per equivalized adult. This finding suggests that for a more complete understanding of the effect of the CTC on food hardship, it is necessary to move beyond headline statistics of food insecurity.
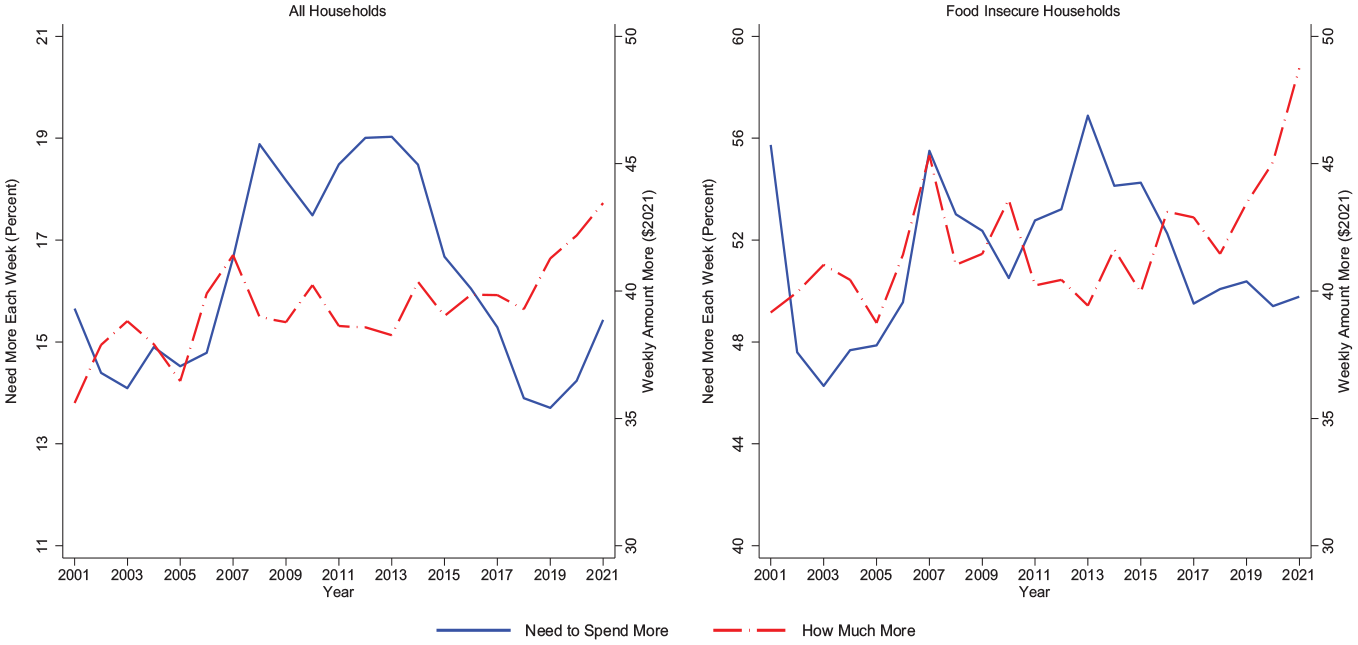
Share of Households with Children Needing to Spend More to Meet Food Needs and the Equivalized Real Amount
The Child Tax Credit and Food Hardship
Given the time lag in the CPS FSS, many studies examining the effect of the expanded CTC used the timelier Pulse survey. Before the FSS was made available, researchers could use the Pulse to track the responsiveness of food hardship to the implementation and expiration of the expanded CTC. However, as noted above, this also constrained researchers to focus primarily on measures of food insufficiency. While Schanzenbach and Pitts (2020) and Ziliak (2021) incorporated both the CPS FSS and the Pulse to analyze food insufficiency, their analyses predated the CTC expansion. As described in more detail below, the research that does analyze the effect of the implementation of the expanded CTC on food insufficiency found the additional resources allowed households to improve access to food and reduce overall levels of food insufficiency by about 25 percent and levels of food insecurity by a more modest, but substantial, 15 percent, with larger effects for low-income households and households headed by racial or ethnic minorities.
The parameter of interest of the studies reviewed here generally seeks to identify either an average treatment on the treated effect (ATT) or an intent-to-treat effect (ITT). If the study compares effects for those who received higher benefits (either through increased payments, new eligibility, or new take-up) to those who did not receive higher benefits (either through no change in benefit levels, ineligibility, or lack of take-up), the ATT is identified. Alternatively, if the study compares those who were exposed to the CTC expansions (whether received or not) to those who were not exposed (generally through eligibility criteria), the ITT is identified. Much of the causal work employs some version of a difference-in-differences identification strategy that compares groups affected by the CTC expansions (“treatment” groups) with groups unaffected by the expansions (“comparison” groups). The nature of treatment (exposure versus take-up) will generally determine the effect identified, but given data limitations on actual receipt of the CTC, the vast majority of studies aims to identify the ITT. A summary of the causal evidence of the CTC on food insecurity is shown in Table 2.
Summary of Causal Evidence on CTC and Food Insufficiency
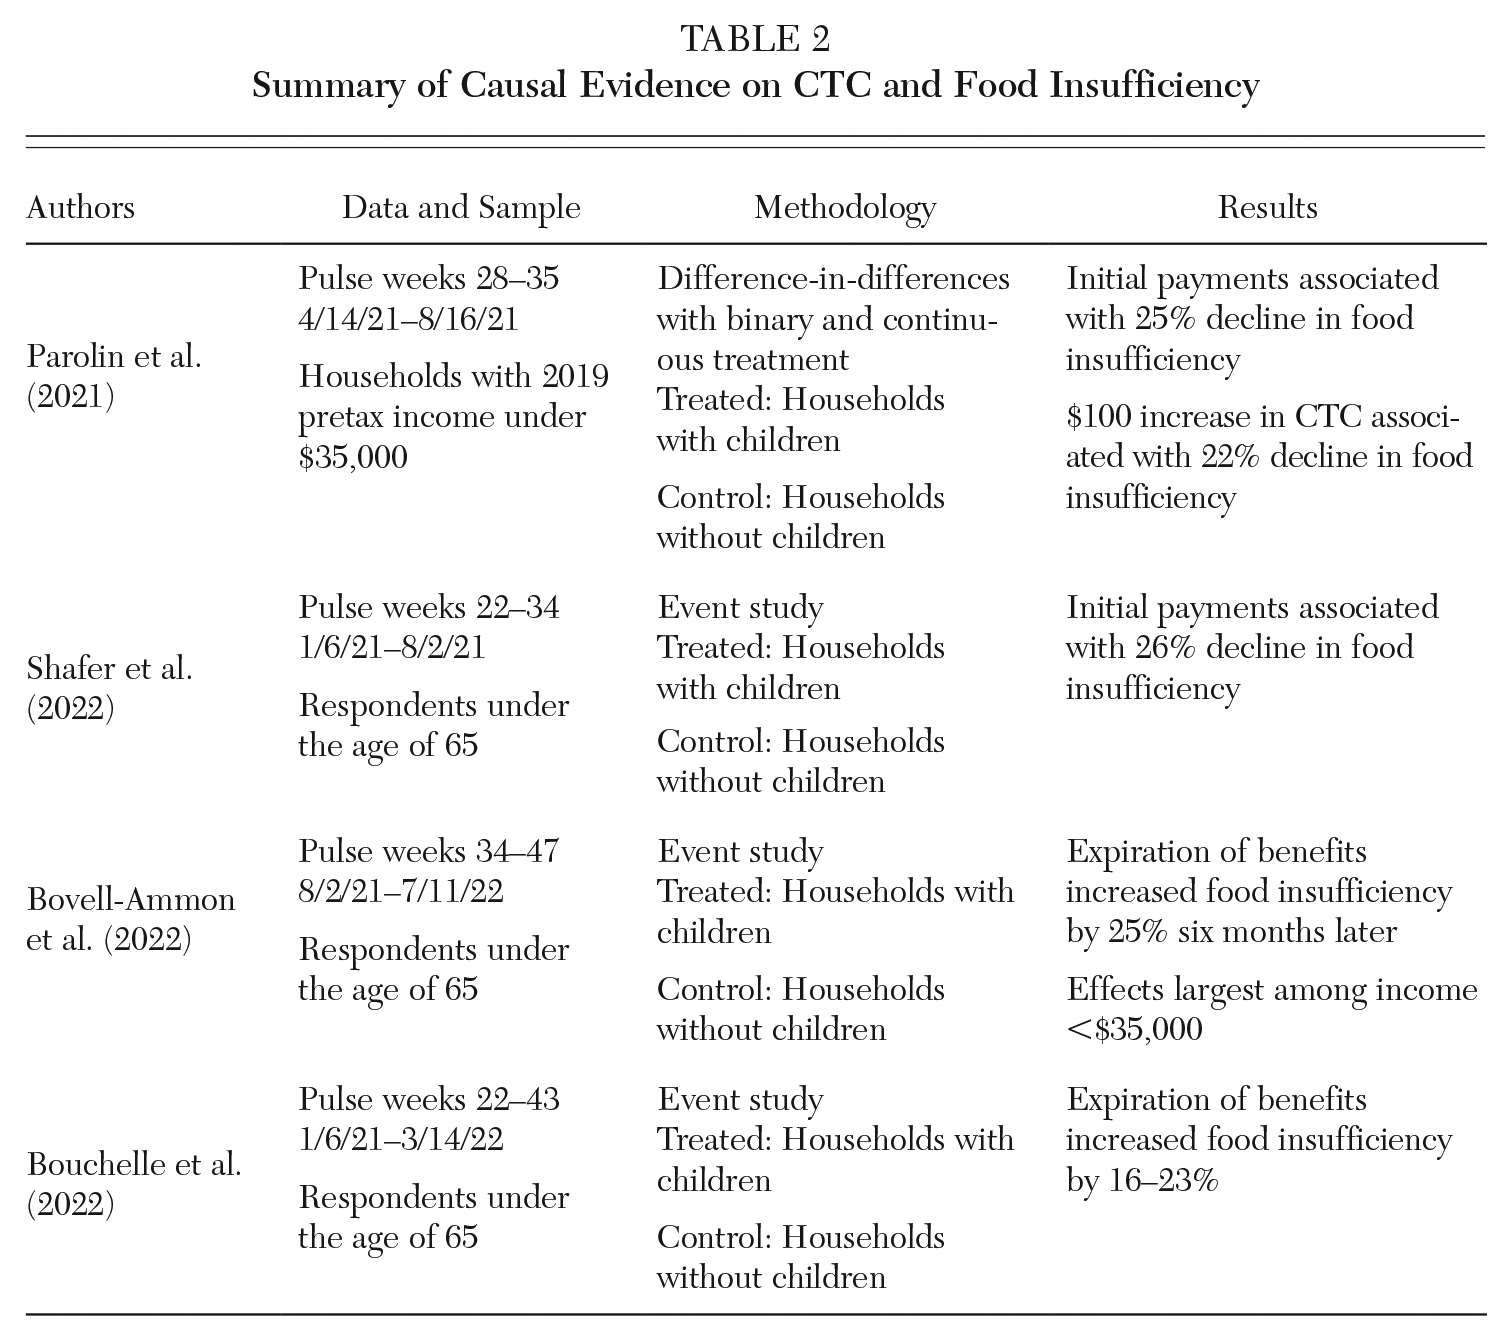
Perez-Lopez (2021) descriptively examines the window around the initial implementation of monthly CTC payments to families (July 15, 2021), utilizing weeks 33 (June 23, 2021–July 5, 2021) and 34 (July 21, 2021–August 2, 2021) of the Pulse and showing that food insufficiency for adults in households with children decreased from 11.0 percent to 8.4 percent, or by about 24 percent. With the information provided, one can also perform a simple difference-in-differences calculation using adults in households without children as a comparison group to move toward a causal estimate. This exercise results in an ITT effect showing a similar decrease of 2.7 percentage points. While information is provided to perform basic difference-in-differences arithmetic, the study itself does not attempt to implement a causal framework; nor does it attempt to delineate among households that may be more likely to see effects from the CTC expansions.
On the contrary, Parolin et al. (2021) use Pulse data spanning April 4, 2021, to August 16, 2021, to analyze the CTC expansions in a causal framework. They model the effect of the CTC with a difference-in-differences framework operationalized in linear regression models, with the identifying assumption that their comparison groups accurately represent the “missing counterfactual” for those households they specify as receiving treatment, also known as the “parallel trends assumption.” The authors use two different treatment regimens to attempt to identify effects. First, they consider a binary measure of treatment for all households with children that have annual incomes below $35,000 (compared to similar low-income households without children). Second, they estimate a continuous measure of treatment through the net value of the CTC benefit and then estimate pre-reform and post-reform values for the CTC based on income and household data in the CPS Annual Social Economic Supplement (ASEC), differencing to obtain the net value and then matching based on observed household information back to the Pulse. The authors find the implementation of expanded CTC benefits reduced food insufficiency among households with children with an ITT effect between 4 and 14 percentage points (or 15.5 to 50.7 percent), depending on the measure of treatment and the modeling assumptions. The authors present event study estimates that suggest the parallel trends assumptions are generally validated for low-income respondents for both experiencing food insufficiency and being behind on rent, with some significant pretreatment effects among all respondents.
Shafer et al. (2022) also examine the effects of the expanded CTC implementation, again using Pulse data from January 6, 2021, to August 2, 2021. Similar to Parolin et al. (2021), the authors try to identify the causal effect of the CTC on food insufficiency, this time in an event study framework. The authors test for the effect of the CTC in the waves pre-implementation and post-implementation, with the expectation that no significant effects of the CTC should be present for the treated group of households with children prior to the implementation of treatment. Given the relatively high income thresholds for the phase-out of the expanded CTC, the authors do not restrict their analysis to low-income households, with treatment being assigned based on whether or not the household has children. They find a 3.7 percentage point reduction (25.9 percent) in food insufficiency in their event study specification, with alternative modeling frameworks suggesting a decrease of between 16.4 percent to 20.8 percent reduction in food insufficiency. Shafer et al. (2022) also provide tests of the parallel trends assumption, finding that it holds overall; however, the authors do show significant declines in food insufficiency for households with children relative to households without children for Pulse waves spanning March 17, 2021, to June 7, 2021.
Given the relatively brief duration of the expanded CTC, some studies also examined the effects of its expiration. In a study similar to Shafer et al. (2022), Bovell-Ammon et al. (2022) use Pulse data from July 21, 2021, to July 11, 2022, to analyze the expiration. The authors consider the same treatment and comparison groups—households with and without eligible children—and again employ an event study framework. They find that the expiration of the expanded CTC resulted in increased rates of food insufficiency for treated groups, but that these effects were not statistically discernable until April. The same group of authors find analogous effect sizes to those in their study of the implementation (Shafer et al. 2022), with expiration resulting in increases in food insufficiency of 3.2 percentage points, or about 25 percent, six months after expiration. Alternative model specifications yielded similar results, with the overall difference-in-differences estimate of a 2.2 percentage point increase in food insufficiency. In the context of expiration, the parallel trends assumption seems more justified, with little evidence present that significant pretreatment trends exist for treated groups.
Bouchelle et al. (2022) estimate analogous event study and difference-in-differences models to those presented by Bovell-Ammon (2022) but differ in their focus on subgroup analyses by household income level. They estimate models for households reporting annual incomes of less than $50,000, less than $35,000, and less than $25,000 and find (also using difference-in-differences) increases in food insufficiency among households with children of 3.5, 4.9, and 6.2 percentage points, respectively, after expiration of the expanded CTC. This represents increases of 16.7 percent, 20.8 percent, and 23.2 percent over baseline food insufficiency levels in each subgroup, respectively. Bovell-Ammon et al. (2022) likewise find heterogeneity in effect size of the CTC across the income distribution, as well as by race and marital status of the household head. Across the wide swath of estimates, the largest increase in food insufficiency after expiration of the CTC was among the low-income group with incomes less than $35,000 (5.9 percentage point increase).
The evidence on the impact of the CTC on food insecurity is more limited compared to food insufficiency and is summarized in Table 3. Karpman et al. (2022) and Rook et al. (2023) both use alternative data sets to the Pulse and abridged forms of the full 18-item questionnaire used by the CPS FSS to assess the relationship between the CTC and household food insecurity. Karpman et al. (2022) use the Well-Being and Basic Needs Survey (WBNS) from the Urban Institute, and Rook et al. (2023) use the National Health Interview Survey (NHIS). The WBNS assessed household food insecurity using a six-item short-form questionnaire. Specifically, questions two through seven from Table 1 were included, and households were categorized as food insecure if they responded affirmatively to two or more questions. Because the WBNS also contains information on whether households received the CTC, the authors could identify average treatment effects on the treated versus intent-to-treat estimates in the above studies. The NHIS includes the first 10 questions from Table 1, and food insecurity is determined by three or more affirmative responses. Neither study can incorporate child-specific questions on food hardship.
Summary of Causal Evidence on CTC and Food Insecurity
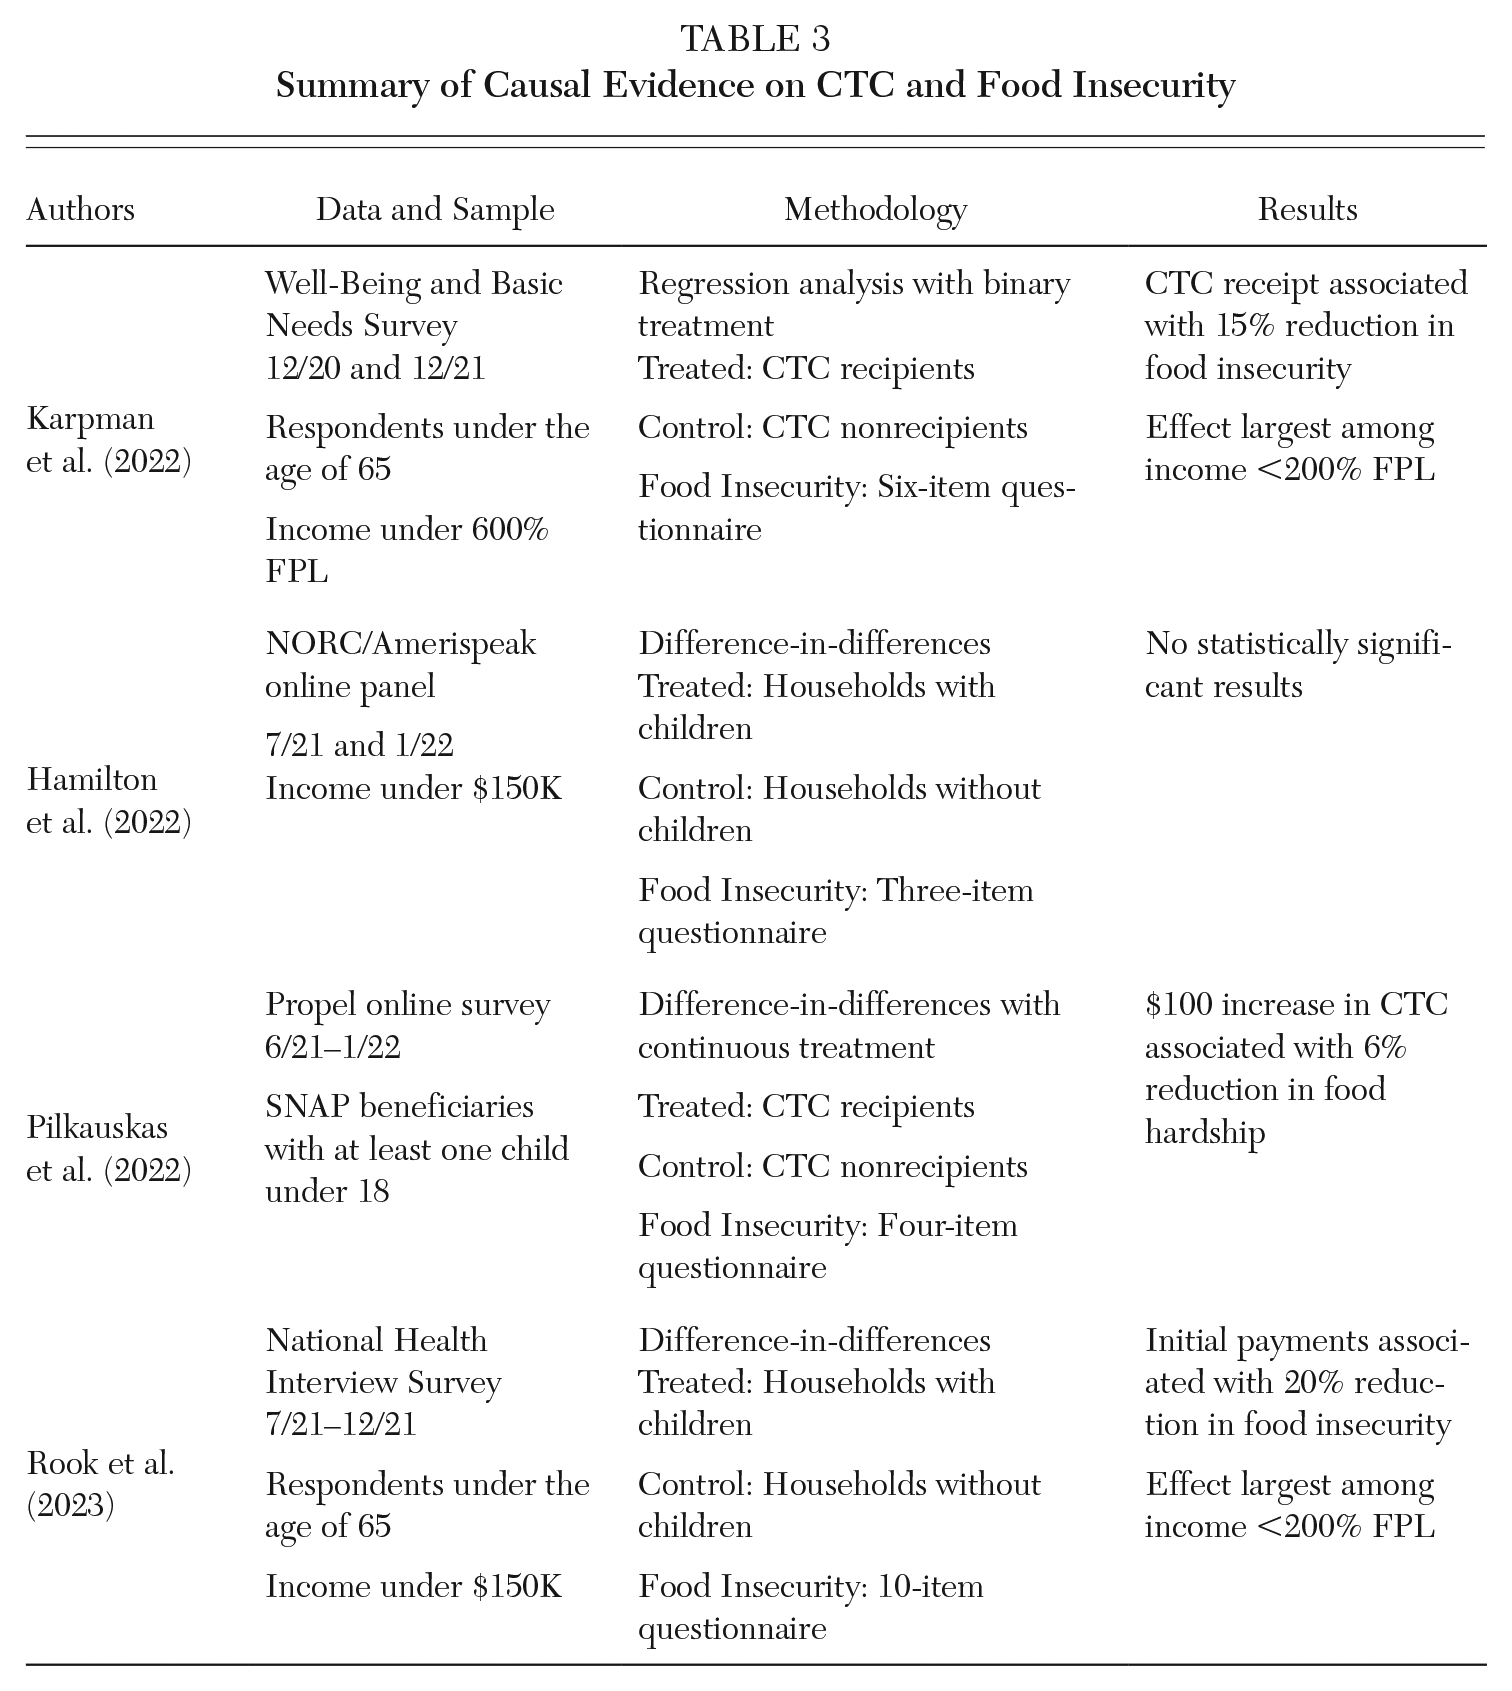
Karpman et al. (2022) compare food insecurity rates from December 2020 to December 2021. They find that food insecurity rates fell 6.1 percentage points among households that received advanced CTC payments, while food insecurity among nonrecipients fell by 2.3 percentage points. By directly comparing CTC recipients with nonrecipients, these results would suggest an ATT difference-in-differences estimate of 3.8 percentage points, or a 15 percent reduction in food insecurity associated with CTC receipt. Rook et al. (2023) compare food insecurity between the months that CTC payments were administered, July 2021 to December 2021, to the prior months back to January 2019. They restrict their sample to households with less than $150,000 in income ($75,000 if the adult is single) and define CTC eligible households as households with children and ineligible households as those without children. For their sample, they find that food insecurity rates fell by 4 percentage points among eligible households, while rates fell by 2.1 percentage points among ineligible households. This gives a difference-in-differences estimate of 1.9 percentage points. Further, both papers show that the reduction in food insecurity is concentrated among households below 200 percent of the FPL. Comparing recipients and nonrecipients at this low-income income threshold, Karpman et al. (2022) find CTC receipt is associated with a 5.1 percentage point reduction in food insecurity while Rook et al. (2023) find that CTC eligibility reduces food insecurity by 3.9 percentage points.
Hamilton et al. (2022) and Pilkauskas et al. (2022) also adapt questions from the FSS questionnaire to estimate the effect of CTC receipt on food hardship using online surveys. Hamilton et al. (2022) use a multiwave NORC/Amerispeak online panel. Wave 1 of the survey was administered in early July 2021 before CTC payments were delivered, and wave 2 was administered from late December 2021 to January 2022 after CTC monthly payments ended. These authors use individual food hardship questions as their outcomes of interest rather than a single measure of food hardship. They use the first three questions from the FSS questionnaire shown in Table 1 as well as their own questions on free meal receipt and confidence in affording food in the next four weeks. Using difference-in-differences estimation to estimate an intent-to-treat effect, the authors find that CTC eligible households were 1.4 times more likely to report balanced meals and 1.4 times more likely to have confidence in affording food in the near future. There was no statistically significant impact on the other measures of food hardship. As in previous papers, Hamilton et al. find larger effects for households with incomes between $25,000 and $50,000 and for households headed by Black and Hispanic individuals.
Partnering with Propel, a company that administers a mobile app to help families manage their Supplemental Nutrition Assistance Program (SNAP) benefits, Pilkauskas et al. (2022) estimate the impact of monthly CTC receipt on multiple measures of food hardship among these very low-income families. Information was collected from a random sample of app users each month from June 2021 to January 2022. For their food hardship measure, this study uses a four-item index that refers to the past 30 days and includes questions one and two from the FSS questionnaire in Table 1 as well as two questions on skipping meals or eating less. The authors estimate a local average treatment effect in a difference-in-differences framework by instrumenting self-reported monthly CTC payments with a measure of predicted monthly CTC benefits given family composition. They find that an additional $100 in monthly CTC benefits reduces their measure of food hardship by approximately 6 percent. This is noticeably smaller than the estimate from Parolin et al. (2021), though the two consider different measures of food hardship. Pilkauskas et al. (2022) also do not find any difference by race or monthly income for their sample.
The Child Tax Credit and Financial Hardship
While there is consistent evidence that the CTC decreases the likelihood of household food insecurity and insufficiency, the evidence on measures of financial hardships is less conclusive. In addition to studying food hardship, Parolin et al. (2021), Perez-Lopez (2021), Karpman et al. (2022), Pilkauskas et al. (2022), and Hamilton et al. (2022) each consider varying measures of financial hardship, such as difficulty paying routine expenses like rent or utilities. Of these papers, only Hamilton et al. find that the CTC has a statistically significant impact on financial hardship as measured by evictions, while the rest find a negative but statistically insignificant association. This is summarized in Table 4.
Summary of Causal Evidence on CTC and Financial Hardship
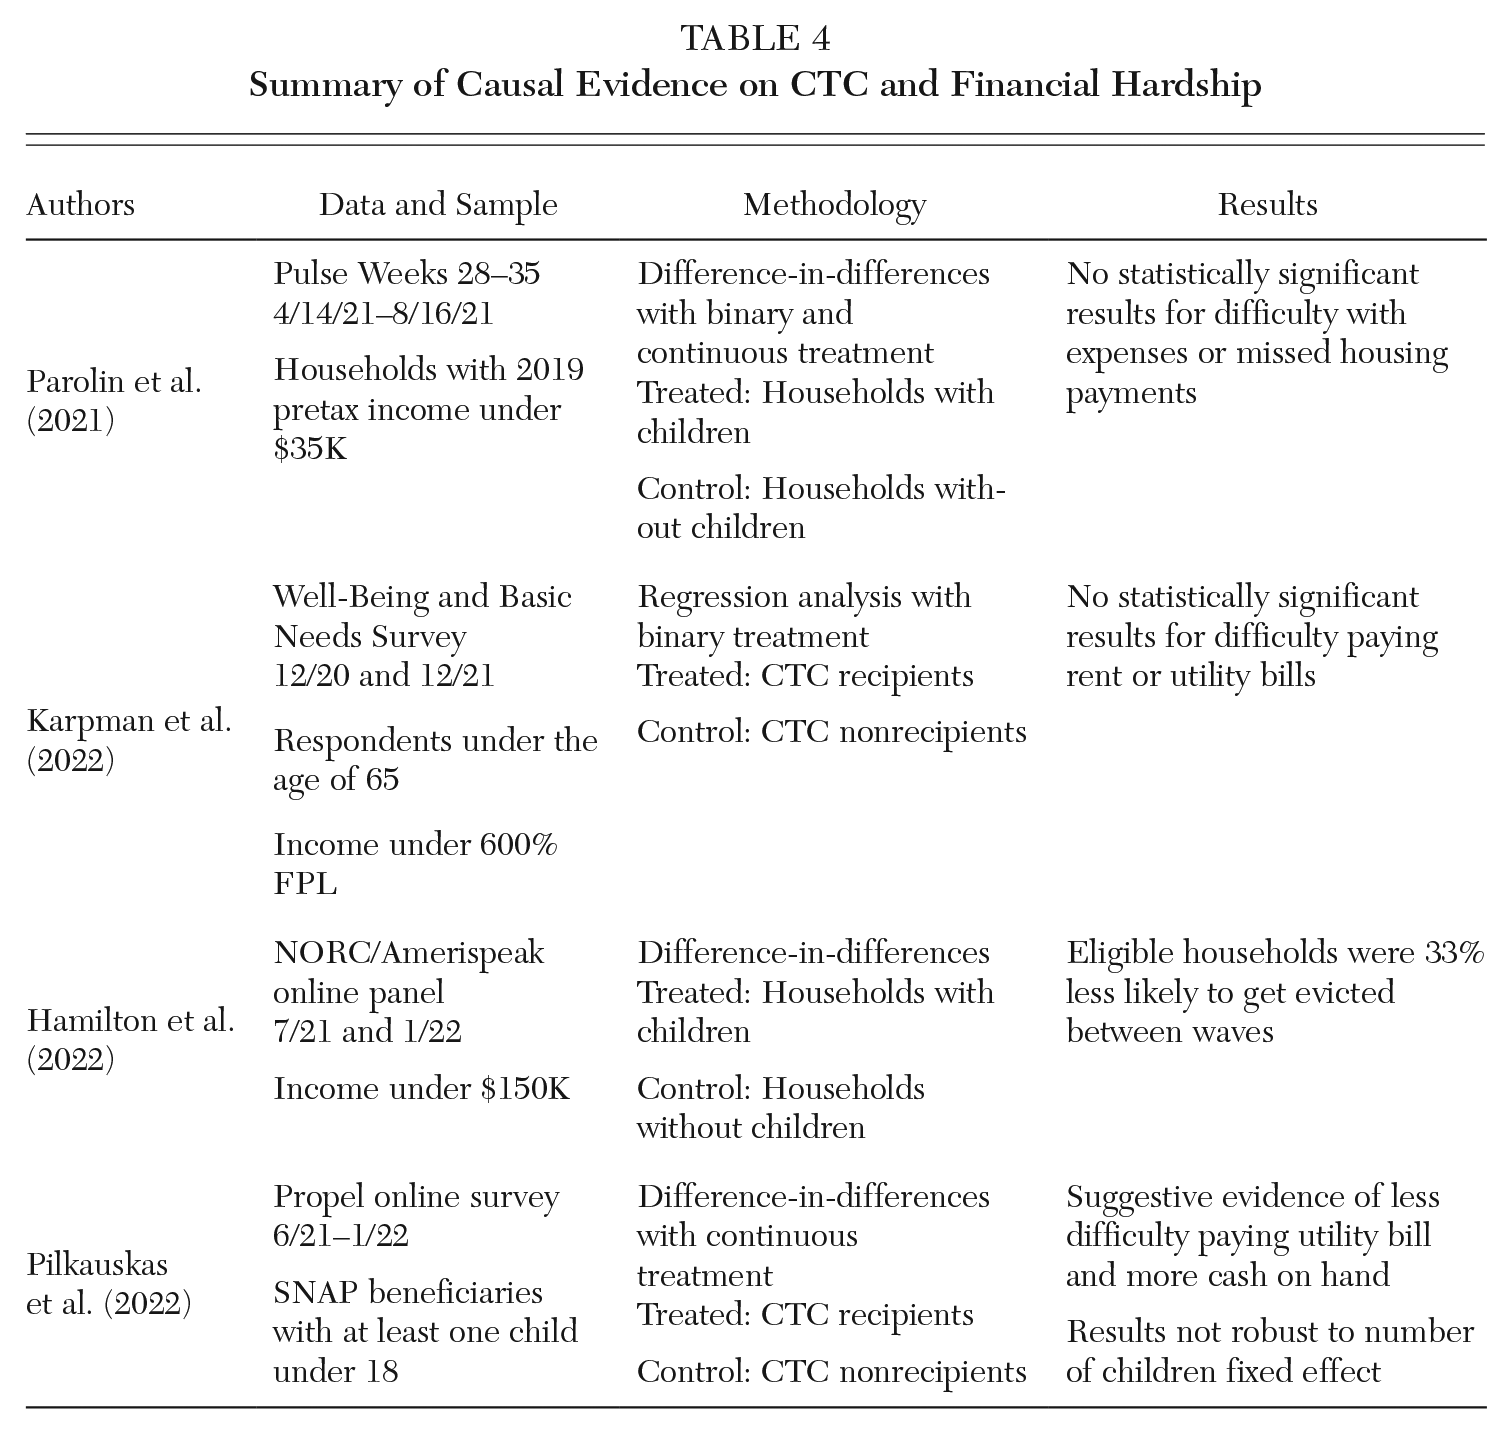
In its aims to capture disruptions brought on by COVID-19, the Pulse asked respondents if they had difficulties paying for their usual household expenses in the past seven days and if the household was currently caught up on their rent or mortgage payments. Usual household expenses include, but are not limited to, food, rent, car payments, medical expenses, and student loans. In descriptive work on initial monthly CTC payments, Perez-Lopez (2021) shows that among households with children, the fraction reporting difficulties paying expenses fell from 31.5 percent in late June to 29 percent in late July. Households without children reported a 1 percentage point increase during this time, from 20.8 to 21.8 percent. However, using the causal framework described previously, Parolin et al. (2021) fail to find any statistically significant impact of the CTC on difficulties with expenses or the likelihood of a missed rent or mortgage payment. This is the case for both the binary measure of CTC receipt and the continuous measure of treatment intensity.
The WBNS includes similar measures of financial hardship. Households are asked if they have had difficulties paying their rent or mortgage or utility bills in the past 12 months. Karpman et al. (2022) descriptively find that CTC recipients experienced improvements along both measures from December 2020 to December 2021. However, CTC nonrecipients experienced similar reductions, and their regression analysis shows a negative but statistically insignificant association between the CTC and these measures of financial hardship. The survey administered by Propel used by Pilkauskas et al. (2022) also includes measures of housing and utilities hardship. Pilkauskas et al. (2022) generally do not find robust evidence of monthly CTC receipt affecting these measures, particularly once fixed effects for the number of children are included, which is their preferred specification. The only evidence of a statistically significant effect of the CTC on financial hardship comes from the NORC/Amerispeak online survey used by Hamilton et al. (2022). The survey included detailed measures of financial hardship, such as being evicted, skipping housing or utility payments, experiencing utility or phone shut-offs, and skipping medical care due to costs. Hamilton et al. find that CTC eligible households were 33 percent less likely to get evicted between the two waves of the survey. However, no statistically significant effect is shown for the other measures of financial hardship, and some even show the opposite of the expected sign.
Discussion
Examining earlier studies can be helpful to contextualize the effect of the CTC on food hardship and, in particular, food insufficiency. However, comparing the magnitudes of the effects of the CTC on food hardship with the previous literature is challenging given that the recent CTC literature differs in data sources, measures, and sample construction. That said, some of the earlier literature focused on food insufficiency outcomes. For example, Gundersen and Oliveira (2001), using a simultaneous equations probit model, show that food insufficiency is largely unresponsive to programs like SNAP and even to changes in income. Gundersen and Ribar (2011) document the relatively weak relationship between reported rates of food insufficiency and objective measures of food expenditure. While the relationship varies across the distribution of food expenditure and household income level, the authors show rates of food insufficiency decrease from about 9 percent to 7 percent when usual weekly per-person food expenditures increase from $125 to $150 for households under 185 percent of the federal poverty line. Normalizing for comparison suggests a roughly 20 percent increase in food expenditure results in a 20 percent decrease in rates of food insufficiency, an elasticity of around −1. On the contrary, Gundersen, Kreider, and Pepper (2017), using methods to bound the effect of SNAP on food insufficiency, find substantially larger mitigating effects, with SNAP reducing the prevalence of food insufficiency among households with children by 63 percent. However, these estimates are derived from samples with a much lower prevalence of food insufficiency among households with children relative to the studies examining the expanded CTC. In one recent study that uses difference-in-differences strategies, Das (2023) finds that living in states with a refundable Earned Income Tax Credit (EITC) decreases food insufficiency by approximately 12 percent for households with dependent children.
A challenge, then, is that as noted above, the older literature, with the exception of Gundersen, Kreider, and Pepper (2017), tends to find effect sizes of programs like SNAP on food insufficiency about half the size as the recent CTC literature estimated using the Pulse. However, the effect sizes of the CTC on food insufficiency are more in line with the effect sizes of other safety-net programs on food insecurity. A substantial literature exists on identifying the effects of SNAP on food insecurity. Policy reports and studies find that SNAP receipt reduces food insecurity by between approximately 9 percent and 60 percent, with moderately smaller effects for households with children (Carlson and Keith-Jennings 2018; Nord and Prell 2011; Mabli et al. 2013). Many other studies also find that SNAP reduces food insecurity by 5 to 20 percentage points while rigorously accounting for the endogenous relationship between SNAP and food insecurity, which, relative to baseline food insecurity rates, amounts to a 20 to 50 percent reduction (Gregory, Rabbitt, and Ribar 2015; Gundersen and Ziliak 2018; Gundersen, Kreider, and Pepper 2017; Ratcliffe, McKernan, and Zhang 2011; Schmidt, Shore-Sheppard, and Watson 2016).
Other studies find similarly sized effects of other safety-net programs in causal settings. For example, both Moellman (2020) and Moellman and Vaughn (2024) find increased access to Medicaid (through expansions and variation in eligibility criteria, respectively) reduces food insecurity by around 20 percent using difference-in-differences approaches. Lenhart (2022) finds that a 51.4 percent increase in EITC benefits after the 2009 American Recovery and Reinvestment Act decreased rates of food insecurity by 8.1 percent among low-educated households with three children. Although estimates of the effect of the CTC are more limited for food security measures, the estimates from Karpman et al. (2022) and Rook et al. (2023) are similar to estimates of the effect of SNAP and other safety-net programs on food insecurity.
A related literature does not focus on program evaluation per se but rather on how household food insufficiency responds to income shocks. Dahl, DeLeire, and Mok (2014) find households with a 25 percent or greater drop in income experienced increased rates of food insufficiency of between 23 percent and 31 percent, suggesting, on the high end, an elasticity of −1.24. Leete and Bania (2010) also examine the effect of income shocks on food insufficiency and find that, across all households, a $1,177 negative income shock (defined as income lost in a given month, such as through wages lost due to unemployment) resulted in a 47 percent increase in the likelihood of a household experiencing food insufficiency, or an income elasticity of approximately −2. To compare, Curran (2021), citing the Tax Policy Center, notes the average total CTC benefit for families was $4,380 in a year. Median family income for households with children was $84,197 (from 2021 American Community Survey one-year estimates), indicating the CTC benefit would increase family incomes by approximately 5.2 percent. Previous estimates would then suggest an expected 5.2 percent to 10.4 percent decrease in the prevalence of food insufficiency, while recent studies generally find much larger effects.
Conclusion
In this article, we provided a brief survey of recent research examining the effect of the 2021 CTC expansion on food and financial hardship. The best causal evidence suggests that, because of the expanded tax credit, food insufficiency fell by about 25 percent and food insecurity by a more modest, but substantial, 15 percent. The effect sizes were more pronounced among the most economically disadvantaged households as well as those headed by a racial or ethnic minority. Research on measures of the expanded CTC on financial hardship are less conclusive, with most metrics showing qualitative reductions in hardships but generally effect sizes that do not differ statistically from zero.
This lack of definitive improvements in financial hardship may be surprising given the clearer evidence on the CTC and food insecurity and insufficiency. However, as Curran (2021) notes, these measures of well-being may be more sensitive to continued receipt rather than initial receipt. This is evidenced in Figure 3, where we show more dollars necessary to meet food need in 2021 even though the rates of food insecurity and food insufficiency both declined. No work thus far has examined the effect of the onset and then departure of the CTC on these measures as there has been for food insecurity and insufficiency. This makes the causal impact of the CTC difficult to assess and highlights the need for future areas of research. Ideally this additional research will leverage multiple sources of data beyond the Pulse survey. The Pulse is certainly a powerful new tool in the evaluator’s toolkit, but because the levels of food hardship differ greatly from other sources like the CPS FSS, it will be important to document evidence of the CTC’s effects across multiple data sources in order to better inform evidence-based policymaking.
Footnotes
Nicholas Moellman is an associate professor of economics in the department of accounting, finance, and economics at Winthrop University.
Cody N. Vaughn is an assistant professor of economics in the department of economics at the University of Wisconsin–La Crosse.
James P. Ziliak is Gatton Endowed Chair of Microeconomics in the department of economics at the University of Kentucky, where he is also founding director of the Center for Poverty Research.