
Abstract
Community gardens are more popular than ever, yet we know little about how leadership structure and neighborhood characteristics relate to programming. Hence, this paper analyzes how the racial/ethnic backgrounds of the community garden leaders are related to the activities the garden undertakes. What types of initiatives do gardens undertake to reduce food insecurity? The paper analyzes how the location of the garden impacts what it does. The article presents novel findings on the impact of leadership and neighborhood characteristics on community garden operations and outcomes. Hence, the essay examines how the race/ethnicity of garden managers and their sex and neighborhood characteristics, such as poverty rate, household income, and racial composition, are related to garden initiatives. Finally, the paper examines how community gardens responded to increased demands for food and services during the Coronavirus Disease 2019 pandemic. We studied 53 community gardens in Michigan from the summer 2020 through the winter 2021. Whites manage 66% (35) of the gardens, while People of Color manage 34% (18). Roughly half of the gardens are managed by males and the remainder by females. The gardens, which lack paid staff, rely heavily on volunteers. Almost 53% of the gardens are in low-income census tracts (with median income of $40,000 or less). During the pandemic, 31% of the gardens reduced their staff, 51.4% had fewer volunteers than in pre-pandemic times, and 51.9% had increased amounts of people seeking food.
Keywords
Introduction
Community gardens are an enduring feature of the American landscape. Initially, urban residents developed community gardens to serve as food sources during economic depressions and wars (Cotton, 2009). The urban garden movement began in Detroit in 1894 when the city’s mayor, Hazen Pingree, allowed residents to farm on 430 acres of vacant land free of cost to reduce food shortages. In all, 1,701 families tended “potato patches” in the city within 2 years. By the time Detroit’s program ended in 1901, New York, Boston, Chicago, Minneapolis, Seattle, Duluth, and Denver had replicated it (Burdine & Taylor, 2017; Detroit Historical Society, 1980; Holli, 1969; Lawson, 2005, 2004; Taylor & Ard, 2015).
The U.S. government urged people to plant Liberty Gardens during World War I, Relief Gardens during the Great Depression, and Victory Gardens during World War II. The gardens boosted cultivated acreage to ensure that people had enough to eat and troops had a steady food supply. By 1944, citizens grew about 8 million tons of food in 20 million Victory Gardens they tended in urban and rural areas. Consequently, about 41% of all the vegetables produced and consumed were grown in Victory Gardens (Hynes, 1996; Lawson, 2005, 2004; Pack, 1919; United States Botanic Garden Conservatory, 2021). Cities like Toledo encouraged Boy Scout and Girl Scout troops to plant communal gardens (The Toledo City Journal, 1919).
Interest in urban gardening waned after World War II. However, there was a resurgence of interest in gardening in the 1970s. During that time, people redefined gardens’ roles in their lives and communities (Lawson, 2005; Lee, n.d.; Saldivar-Tanaka & Krasny, 2004). In the mid-1990s, growth and interest in community gardening were evident in a national study of community gardens that identified 6,020 community gardens in the 38 cities observed (American Community Gardening Association, 1998).
Today, community gardens are more popular than ever. According to the National Gardening Association, 35% of American households grow food at home or in a community garden. The number of households gardening increased from 36 million in 2008 to 42 million in 2013. More specifically, the number of households engaged in community gardening increased by two million from 2008 to 2013. There were dramatic increases in 18- to 34-year-olds, urban dwellers, and households with children that gardened during the study period (National Gardening Association, 2014). The Trust for Public Land (TPL) also tracks the growth in garden plots in public parks in the 100 largest American cities. In 2018, TPL identified more than 29,000 garden plots in the cities studied. That number represents a 44% increase since TPL started tracking community gardens in 2012 (Trust for Public Land, 2018).
So, what purposes do today’s community gardens serve? We examine this question by focusing on community gardens in Michigan. The paper analyzes how the racial/ethnic backgrounds of the community garden leaders are related to the activities the garden undertakes. What kinds of initiatives do gardens undertake to reduce food insecurity?
The paper analyzes how the location of the garden impacts what it does. The article examines understudied variables in community garden research and presents novel findings on the impact of leadership and neighborhood characteristics on community garden operations and outcomes. Hence, the essay examines how neighborhood characteristics such as poverty rate, household income, and racial composition are related to garden initiatives. Finally, the paper examines how community gardens responded to increased demands for food and services during the coronavirus disease 2019 (COVID-19) pandemic.
Literature Review
Definition of Community Gardens
The U.S. Department of Agriculture defines community gardens as plots of land, usually in urban areas, that groups or individuals rent to create private gardens that benefit the garden’s caretakers (National Agricultural Library, 2009). Francis (2003) adds that a community garden is a neighborhood space developed on vacant land designed or managed by residents. Participating gardeners cultivate crops on shared lots subdivided into small plots of land, usually tended by a household or self-selected group. The American Community Gardening Association (ACGA) defines community gardens broadly as urban, suburban, or rural entities that grow flowers, vegetables, or other produce. A community garden varies from a single plot to multiple plots and can be organized and managed by a collective, institution, or government (American Community Gardening Association, 2007).
Purposes of Community Gardens
Some perceive community gardens as inclusive spaces, but gardens can also be exclusive. There are times when gardens are open to an entire neighborhood or the public and include as many people as possible in activities. Those who are not a part of the collective cannot garden in the space or help to manage such gardens (Beilin & Hunter, 2011; Eizenberg, 2012a; Ghose & Pettygrove, 2014a; Glover, 2004; Irazabal & Punja, 2009; Neo & Chua, 2017; Petrovic et al., 2019; Pudup, 2008; Twiss et al., 2003). However, collectives can also organize and manage community gardens to benefit group members.
Researchers, activists, and gardening groups claim that community gardening improves nutrition and reduces food insecurity (Corrigan, 2011). For instance, Alaimo et al. (2008) found that adults in Flint, Michigan, who participated in community gardening consumed more fruits and vegetables than those who were not community gardeners. Barnidge et al. (2013) made a similar finding in rural Missouri. Lautenschlager & Smith (2007) also found a positive association between community gardening and increased intake of fruits and vegetables in youths in Minneapolis/St. Paul metropolitan area.
Some describe community gardens as commons (Egerer & Fairbairn, 2018; Eizenberg, 2012b) that facilitate the practice of civic agriculture (Saldivar-Tanaka & Krasny, 2004). The gardens are said to reduce post-traumatic stress (Hartwig & Mason, 2016; Pitt, 2014) and promote health and well-being (Armstrong, 2000; Draper & Freedman, 2010; Dyg et al., 2020; Guitart et al., 2012; Lovell et al., 2014; Teig et al., 2009; Twiss et al., 2003).
Others see community gardens as therapeutic places (Pitt, 2014) that foster concern for nature and promote environmental stewardship (Torres et al., 2017). Scholars argue that community gardens enable citizenship, social change, and political agency. The gardens can facilitate leadership development, collective efficacy, social cohesion, and the preservation of culture (Augustina & Beilin, 2012; Baker, 2004; Crossan et al., 2016; Egerer & Fairbairn, 2018; Ghose & Pettygrove, 2014b; Hondagneu-Sotelo, 2017; Pudup, 2008; Teig et al., 2009). In addition, scholars suggest that community gardens are places that facilitate interracial interactions (Glover, 2003; Shinew et al., 2004).
Some activists promote disaster resilience through urban community gardens (Chan et al., 2015; McIlvaine-Newsad et al., 2020). The gardens provide an array of ecosystem services (Burdine & Taylor, 2017; Cabral et al., 2017; Clarke & Jenerette, 2015; Petrovic et al., 2019; Smith et al., 2021). They are used to develop green infrastructure; promote sustainability; and create communal, entrepreneurial, social, educational, and recreational spaces for residents (Corrigan, 2011; Cumbers et al., 2018; Gittleman et al., 2010; Petrovic et al., 2019; Saldivar-Tanaka & Krasny, 2004; Smith et al., 2021). Residents create gardens to repurpose vacant land (Burdine & Taylor, 2017; Drake & Lawson, 2014).
In Grand Rapids, Michigan, community gardeners say they participate in gardens to further environmental justice (Kirby et al., 2020). Community gardens can also be sites of tension and contestation (Egerer & Fairbairn, 2018; Schmelzkopf, 1995; Smith & Kurtz, 2003; Staeheli et al., 2002; van Holstein, 2017). However, they are associated with reduced crime (Gorham et al., 2009; Trust for Public Land, 2008). Thus, gardens can raise property values (Voicu & Been, 2008) and trigger or hasten gentrification (Egerer & Fairbairn, 2018).
Garden Typology and Ownership Structure
The ACGA identifies several types of gardens. Roughly two-thirds of the community gardens are neighborhood gardens. Other types include gardens at public housing complexes, schools, religious institutions, senior housing, youth training facilities, public parks, and food assistance organizations (American Community Gardening Association, 1998).
The ACGA found that only 5.3% of the gardens studied are owned by gardeners or land trusts. Though the typical garden operated for more than 10 years, the gardens were not permanent (The American Community Gardening Association, 1998). Burdine and Taylor (2017) found that the gardens studied were most frequently affiliated with public schools, religious institutions, food banks, and the city. Hou and Grohmann (2018) suggest that developing community gardens in Seattle’s parks helps stabilize finances and solidify the long-term operation of the gardens. Middle et al. (2014) also urge cities to incorporate community gardens in previously planned green spaces like urban parks.
Demographic Characteristics of Gardeners
According to the National Gardening Association (2009), most community gardeners are older women; 54% are women, and 68% are 45 years or older. Forty-three percent of gardeners are college graduates, and 36% have some college education. Sixty-four percent are married.
Two-thirds of the gardeners live in households with no children. Teig et al.’s (2009) study of 47 community gardeners in Denver showed that 64% were women, and the average age was 46.8 years of age. Most of the gardeners (78%) were White, 12% were Latinx, 8% were Black, and 2% were of other races or ethnicities. Algert et al. (2014) studied 83 community gardeners in San Jose, California, and found the average age to be 57. Twenty-five percent were college graduates.
Studies show that communities of color can host community gardens effectively. For instance, gardens that grow produce that local grocery stores do not sell thrive in such neighborhoods (Birky & Strom, 2013; Companion, 2016; Langegger, 2013). Burdine and Taylor (2017) found that 46.2% of the community gardens studied were in predominantly minority neighborhoods, and 61.5% were in high-poverty neighborhoods. Shinew et al. (2004) looked at community gardeners in low-to-moderate-income neighborhoods in the St. Louis metropolitan area and found that 71% of those studied were female, and 67% had a college degree. Hanna and Oh (2000) studied community gardeners in Philadelphia and found that two-thirds of the gardeners were over 50 years old. The study also found that 56.8% of the gardeners were African American. While several researchers found that most gardeners were women, Saldivar-Tanaka and Krasny (2004) found that men dominated the gardens they studied in New York. Parry et al. (2005) found that traditional gender roles were resisted and reproduced in the community gardens studied in St. Louis.
Types of Produce Grown
Though gardeners grow fruits, berries, and herbs, most grow vegetables. Studies show that the most popular vegetable grown in gardens is the tomato; 86% of gardens have this vegetable. Almost half of the gardens grow cucumbers and sweet peppers, while 31–39% of gardens grow beans, carrots, summer squash, onions, and hot peppers. Between 20% and 28% of the gardens grow lettuce, peas, sweet corn, and radish (National Gardening Association, 2009).
Burdine and Taylor (2017) also found that tomato was the most common food grown in Toledo’s community gardens; 96.6% of the gardens grew tomatoes. Between 60% and 80% of the gardens grew summer squash, cucumber, sweet pepper, cabbage, lettuce, jalapeno pepper, eggplant, and bean. Algert et al. (2014) also found that tomatoes were the most common crop in the community gardens studied in San Jose. The other popular crops were squash, green beans, peppers, onions, eggplants, and cucumbers.
Location of Community Gardens
To date, very few studies of community gardens assess how their location influences what the gardens do and how they operate. It is also unusual for studies to examine how the racial/ethnic characteristics of the leaders of the community gardens influence the initiatives the gardens pursue. Most scholars focus on urban community gardens, but Armstrong (2000) studied and compared rural and urban gardens in upstate New York.
Smith et al. (2021) note that the siting of community gardens is understudied. Consequently, we have a limited understanding of how siting impacts performance. Burdine and Taylor (2017) analyzed the differences in gardens in high- and low-income neighborhoods and neighborhoods with high and low concentrations of People of Color. The study found that the type of vegetables grown, the amount and type of infrastructure in the garden, and the types of sustainability practices used differed in high- and low-income neighborhoods and predominantly White and predominantly minority communities.
Use of Food Grown
Community gardeners use the food they produce in a variety of ways. Most of the time, it is consumed. The food may also be sold. Hence, Armstrong (2000) found that 35% of the community gardens studied sold produce grown in the garden. However, only 10% of the garden coordinators said gardeners used proceeds from selling the produce to supplement their incomes. Burdine and Taylor (2017) found that a much lower percentage of the community gardens they studied sold the produce grown. Only 10.3% of the community gardens in Toledo sold their produce. The results of a Lansing, Michigan, study partly support the findings from Toledo. Kirby et al. (2020) found that community gardeners received less than 10% of their household income from the sale of produce grown.
Community gardens are much more likely to donate the food not consumed by their gardeners to individuals or institutions rather than sell it. Hence, 65.5% of the gardens donated food to neighborhood residents, and 48.3% donated food to emergency food assistance institutions such as food banks, pantries, shelters, and soup kitchens. Food was shared with family and friends—37.9% of the gardens did this. In addition, 10.3% of the gardens donated produce to schools, and 3.4% made food donations to churches (Burdine & Taylor, 2017). In Lansing, 72% of the community gardeners donated food to friends and family, and 34% donated food to nonprofits (Kirby et al., 2020).
Methods
Survey Methodology: Identifying and Selecting Community Gardens
We studied community gardens in Michigan from the summer 2020 through the winter 2021. We used ReferenceUSA (renamed Data Axle), the U. S. Department of Agriculture, Local Harvest, Project Grow Gardens, Foodshed.net, Common Ground, Michigan State University Extension, food banks, and various city governments and health departments to find community gardens in Michigan. We identified 569 community gardens.
However, we had no contact information for many of the gardens. We lacked contact information because some gardens have high staff turnover, so the information listed was inaccurate. Other gardens have no lead coordinator or manager or are operated solely by volunteers, so they do not list a contact person. School gardens are on hiatus during the summer, and gardens operated by religious institutions or senior housing may list contact information for individuals who are not connected to the gardens or are not knowledgeable about garden operations. Moreover, some gardens suspended gardening operations due to the pandemic.
Consequently, we identified 165 community garden managers and asked them to complete a survey about the community garden they operate. The sample was drawn from urban and rural parts of Michigan. Gardens from both peninsulas of the state were also included in the study. The survey, designed on a QualtricsXM platform, could be administered by telephone or self-administered (Qualtrics, 2020). Community garden staff were usually too busy during daytime hours to take a telephone survey, so they were sent a hyperlink to complete it at their convenience. We offered study participants $35 in compensation for their time; it took about 45 minutes to complete the instrument. We analyzed data from the Qualtrics survey in SPSS 27.0 (IBM, 2020). We collected data from June 3, 2020 to February 12, 2021. We received 87 responses. In all, 53 of the responses were usable for this study.
Spatial Mapping
First, we used the Census’s Geographic Information Systems Open Data (2020) to identify Michigan’s urban boundaries. The Adjusted Census Urban Boundary layer is a single polygon representing the boundary of each locality. Next, the SPSS data file was converted to a comma-separated value file with the addresses of community gardens to create maps with each organization’s locations studied. Some gardens are close to each other; therefore, the dots may be superimposed—especially in urban areas. We used ArcPro 2.7.1 (ESRI, 2021a) and the ArcGIS World Geocoding Service (ArcGIS Developers, 2021) to geocode the community gardens’ addresses, turning each address into a point on the map. The data points were then projected onto a map using the NAD 1983 Michigan GeoRef projected coordinate system (ESRI, 2021b).
Variables Examined
Independent and Dependent Variables
The paper examines five independent variables. Two of the independent variables are concerned with the characteristics of the garden manager: the race/ethnicity of the community garden manager and the sex of the manager. The other three independent variables focus on the spatial location of the community garden. They are the racial/ethnic composition of the census tract in which the garden is located, the poverty rate of the tract, and the median household income of the census host tract. Other researchers examine similar independent variables in their research. For instance, Smith et al. (2021) use the percentage of People of Color in census tracts to analyze White and minority census tracts in their study of the siting of community gardens. We found no evidence of multicollinearity between the independent variables examined in our study. The variance inflation factor is well below 5—a suggested threshold—for all tests performed.
The dependent variables examined are concerned with the locale, staff size, the number of volunteers, the type of products, places where the products are sold, service to people on food assistance programs, the distribution of garden produce, the impacts of the pandemic, and garden responses to the pandemic.
Urbanized Areas, Small Towns, and Rural Areas
We used the U.S. Census Bureau (2020) guidelines to classify urban areas, small towns, and rural areas. According to the census, an urbanized area is a continuously built-up setting with a population of 50,000 or more. Small towns or rural areas are locales with fewer than 50,000 people that are not a part of any urbanized or metropolitan areas (MDOT, 2013; Ratcliffe et al., 2016; U.S. Census Bureau, 2020). Though the census has specific definitions of urban clusters and rural areas, we collapsed these two types of jurisdictions into one category: small towns or rural areas.
Other researchers, such as Sharkey (2009), explore the differences between rural and urban food environments. Researchers such as Burke et al. (2018) also say examining food insecurity in rural areas, small towns, and urban locales is essential. McEntee and Naumova (2012) also examine rural emergency food assistance organizations. Taylor et al. (2021) also studied rural–urban differences in the operations of farmer’s markets in Michigan.
The Demographic Characteristics of Host Census Tracts
We collected data from the U.S. Census Bureau on the poverty level of the census tracts where the gardens were located. The poverty rates in the relevant census tracts were as high as 59%. If 0–25% of the census tract residents lived below the poverty level, the garden got a code of 1 to designate the low-poverty group. Community gardens located in census tracts with 26–59% of the residents living below the poverty level received a code of 2 and were placed in the high-poverty category.
We used a similar process to categorize census tracts into low- or high-median household income groups. So, census tracts with median household incomes of $40,000 or less got a code of 1 to designate low to median household income. In contrast, host tracts with median household incomes of $41,000 or more were coded as 2 to indicate high to median household incomes.
The third demographic factor considered was the racial/ethnic composition of the host tracts. The racial/ethnic composition of the tracts varied widely; some census tracts were almost devoid of People of Color, while others mainly had racial and ethnic minority residents. We created two groups of host tracts. Census tracts comprised of 0–50% People of Color were coded as “1” and placed in the non-majority People of Color group. On the other hand, tracts with 51–99% People of Color were coded as “2” and included in the majority People of Color category.
Results
Community Gardens: The Michigan Context
Map 1 shows the distribution of the 569 community gardens identified in Michigan in 2020. The gardens are most heavily concentrated in the southern and central portions of the state. The gardens are also located primarily in urban areas in the Detroit metropolitan area, in Ann Arbor/Ypsilanti, Kalamazoo, Flint, Lansing/East Lansing, and Grand Rapids. All but 12 of the community gardens are in the state’s Lower Peninsula. Michigan’s Upper Peninsula is sparsely populated and mostly rural.
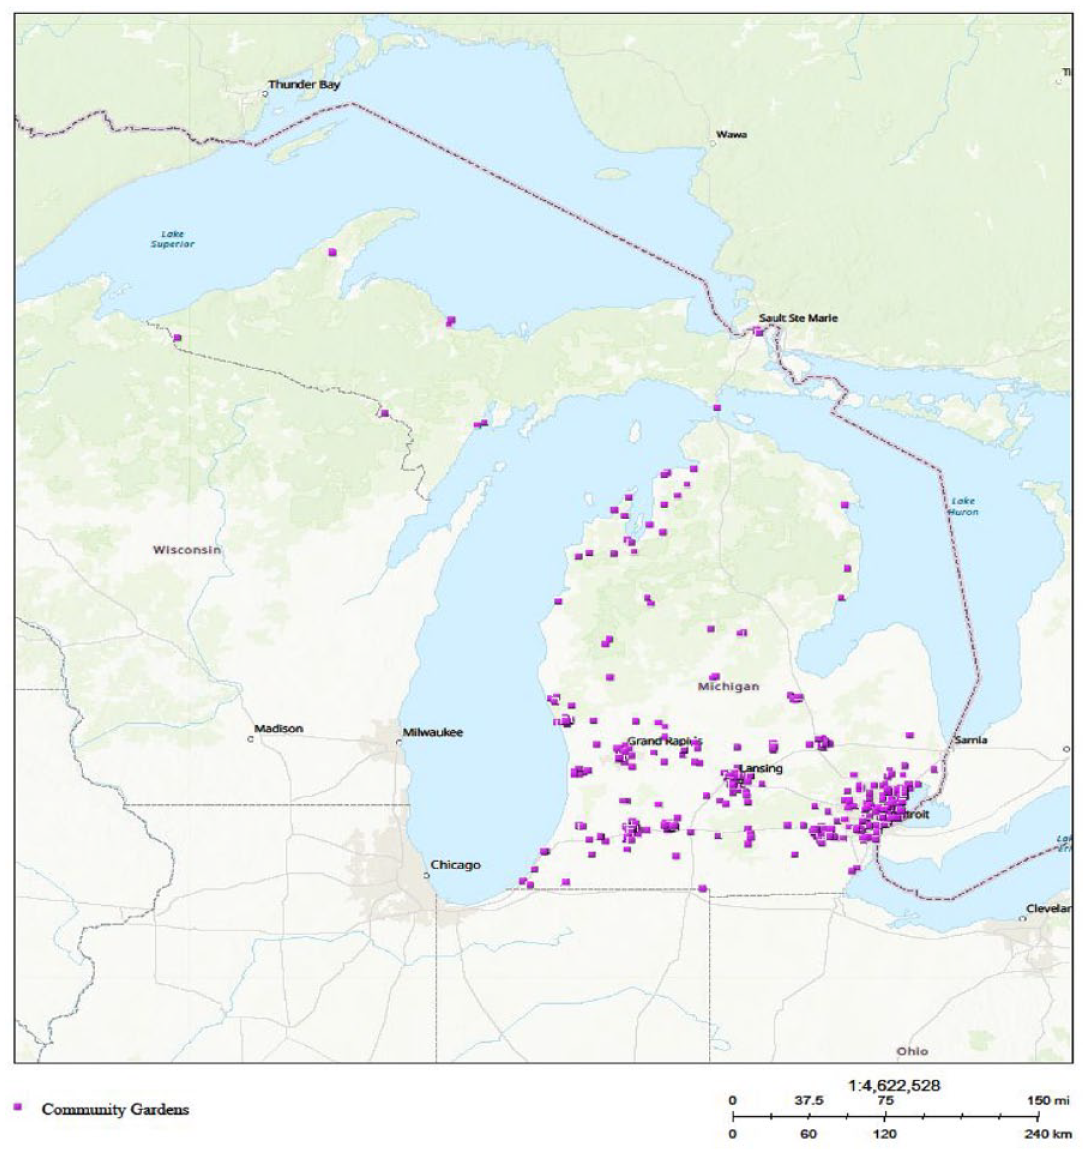
Location of Michigan’s community gardens, 2020 (n = 569).
Characteristics of Community Gardens Studied
Locale
We studied 53 community gardens in Michigan in 2020; Map 2 shows the locations of the gardens studied. In all, 44 (83%) of the gardens are in the urbanized areas of Detroit and its suburbs, Ann Arbor and Ypsilanti, Flint, Lansing, East Lansing, and Grand Rapids. Nine (17%) community gardens are in small towns or rural areas (Table 1).
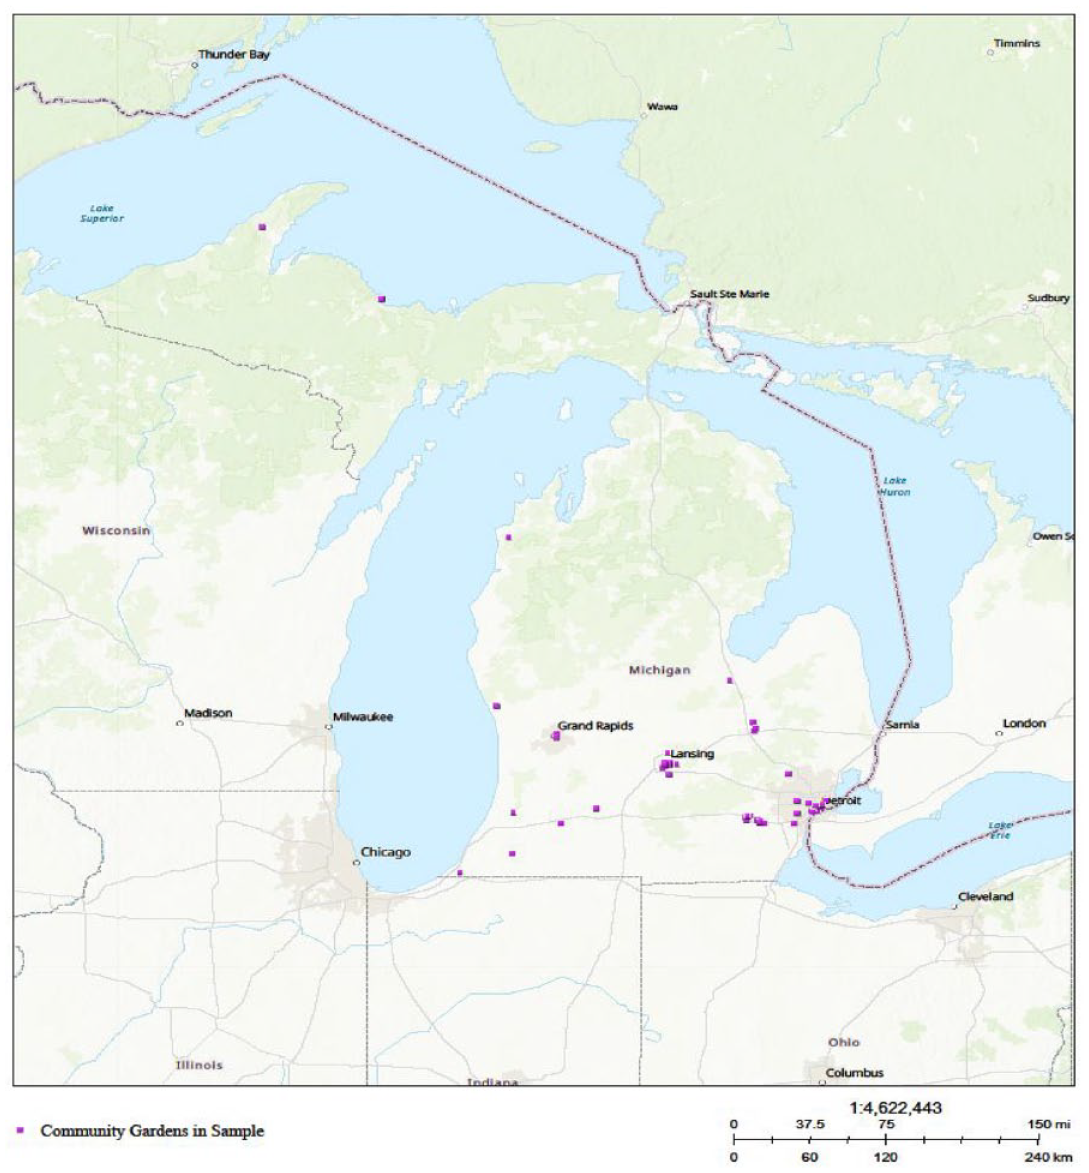
Michigan community gardens studied in 2020 (n = 53).
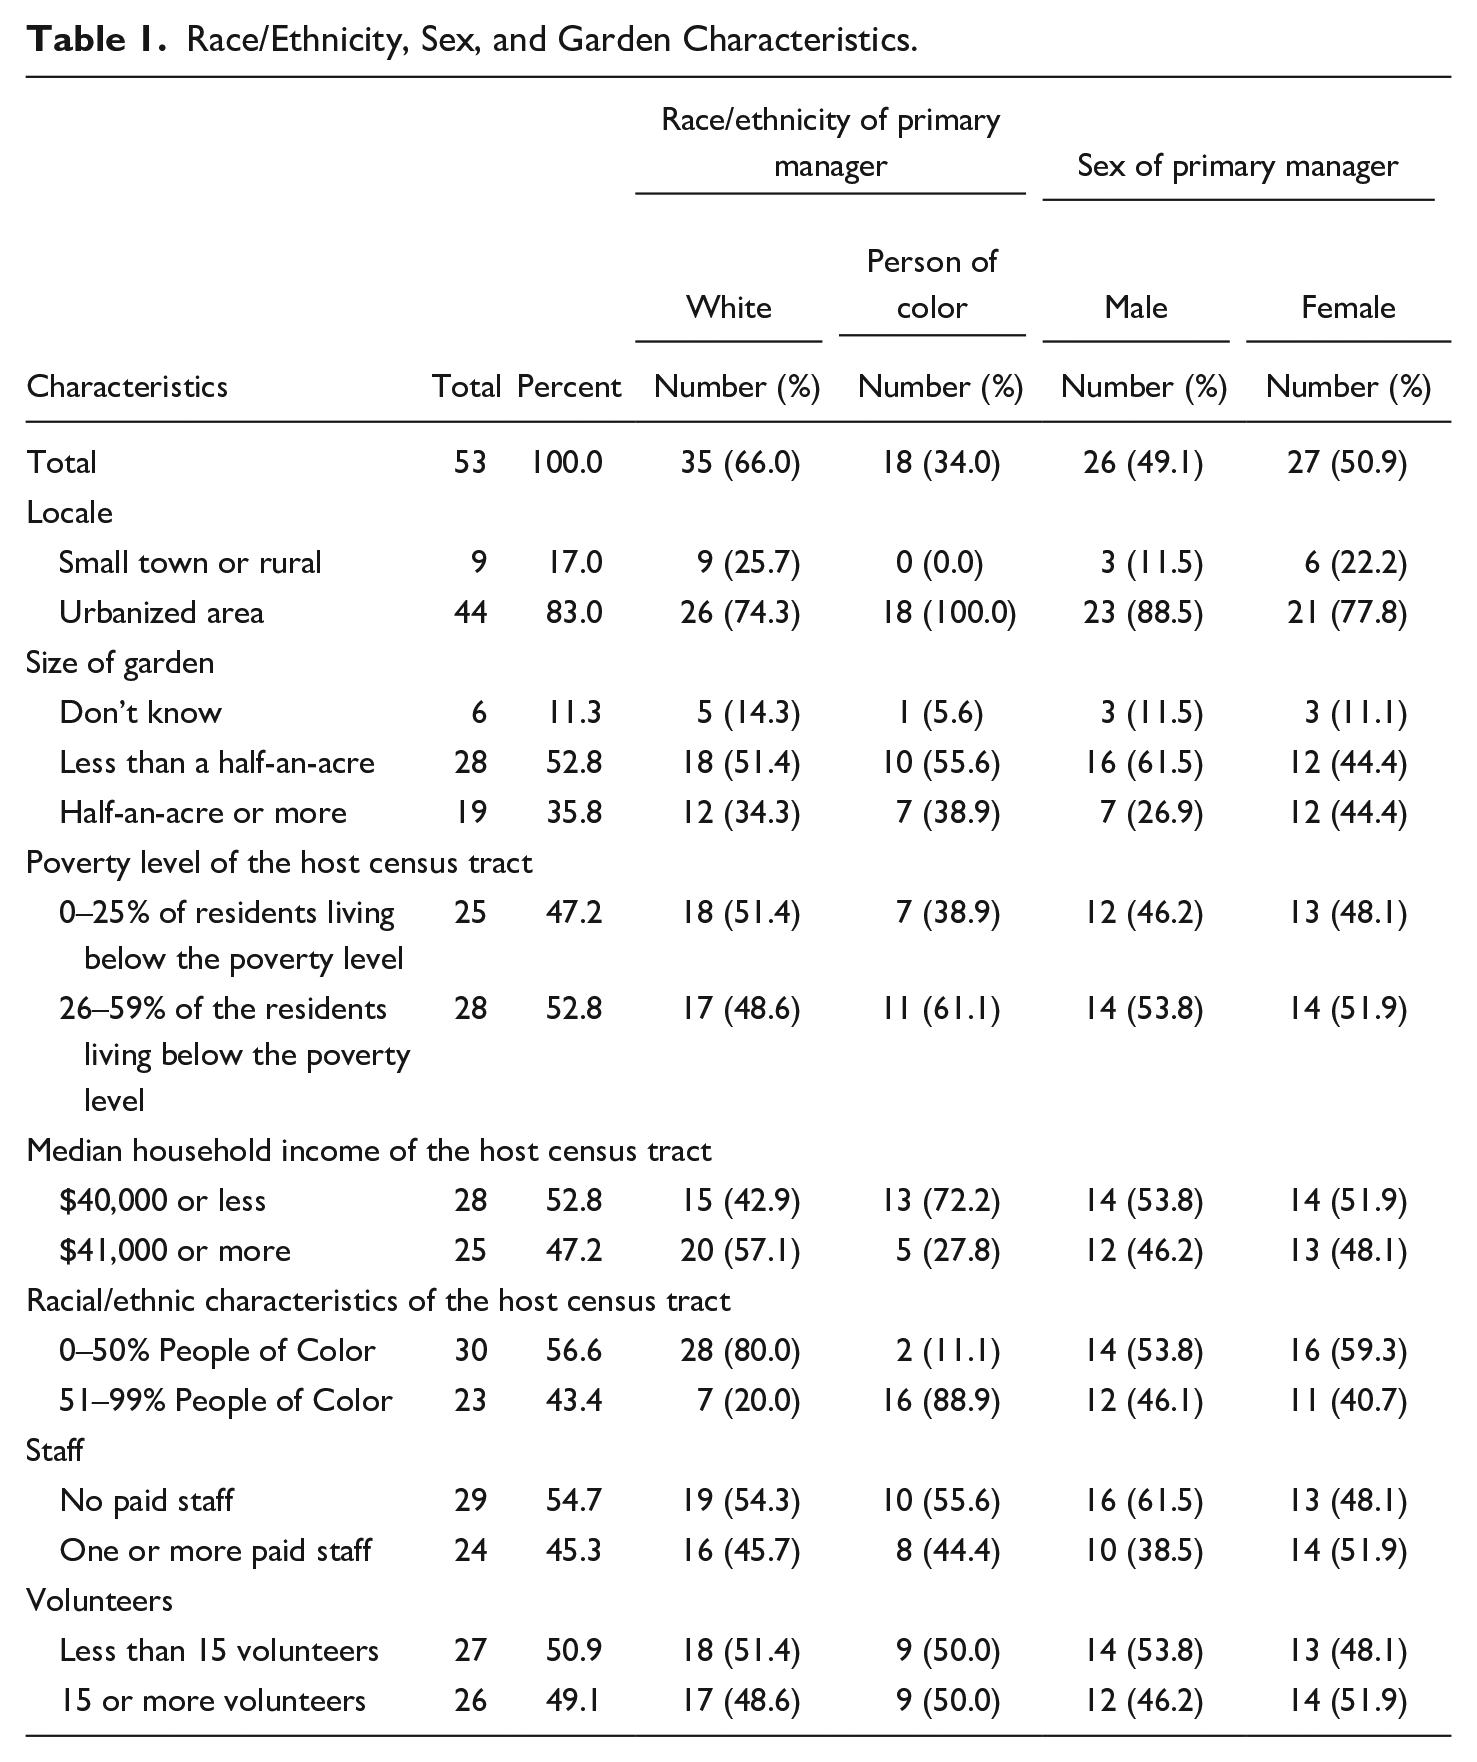
Race/Ethnicity, Sex, and Garden Characteristics.
Size of Gardens
In general, the community gardens studied are small; 52.8% are less than half an acre in size. Only 19 (35.8%) of the gardens were half an acre or more. A slightly higher percentage of managers of color oversaw the more extensive gardens than White managers. So, 34.3% of the gardens half an acre or bigger were managed by Whites, while People of Color managed 38.9% of similarly sized gardens.
Female managers were more likely to manage the more extensive gardens than male managers. Hence, females managed 44.4% of the gardens that were half an acre or more. In comparison, males managed 26.9% of similarly sized gardens.
Neighborhood Poverty and Income Characteristics
Community gardens are more likely to be in high-poverty census tracts than low-poverty ones. In all, 28 (52.8%) of the gardens are in host tracts where the poverty level is 26% or higher. The remaining 25 gardens are in neighborhoods with lower poverty rates. Roughly 53% of the gardens are in census tracts with median income of $40,000 or less. In addition, 23 (43.4%) of the gardens are in neighborhoods where more than half of the residents are People of Color. Most community gardens have no paid staff; this is the case for 54.7% of them. Moreover, 50.1% of the gardens have less than 15 volunteers.
The race/ethnicity of the community garden manager was associated with urban or rural locales, poverty rates, household income, and the racial/ethnic composition of the host census tract. Overall, two-thirds of the garden managers were White, and 34% were People of Color. The 18 gardens managed by People of Color were in urbanized areas. In contrast, 74.3% of the gardens that Whites managed were in urbanized areas, and 25.7% were in small towns/rural areas.
Most of the community gardens managed by People of Color are in high-poverty census tracts. Consequently, 61.1% of the minority-led gardens are in high-poverty census tracts. In comparison, 48.6% of the White-led community gardens are in high-poverty host tracts.
Most of the gardens managed by Whites are in neighborhoods with high median incomes, while most of the gardens managed by People of Color are in host tracts with low median household incomes. About 72% of the gardens managed by People of Color are in host tracts where the median household income is $40,000 or less. On the contrary, only 42.9% of the gardens managed by Whites are in low-income host tracts.
Neighborhood Racial/Ethnic Characteristics
There are also stark differences in the racial/ethnic composition of the census tracts in which Whites and People of Color manage gardens. Hence, 80% of the White managers operate gardens in tracts where 50% or less of the residents are racial/ethnic minorities. On the other hand, 88.9% of the Managers of Color operate gardens in neighborhoods where more than half of the residents are People of Color.
Paid Staff and Volunteering
There was a weak association between the race/ethnicity of the garden manager, having paid staff, and the number of volunteers. The sex of the garden manager had a significant impact only on the size of the staff. Male-run community gardens were likelier than female-led gardens to have no paid staff.
Longevity of Gardens
The community gardens studied tend to be long-lived. While 11.3% of the gardens have been operating for 2–4 years, 18.9% have been operational for 5–9 years. Most of the gardens, 50.9%, have been operating for 10–48 years. Table 2 shows that, on average, the gardens have operated for 12.8 years.
Community Garden Characteristics: Means Comparisons.
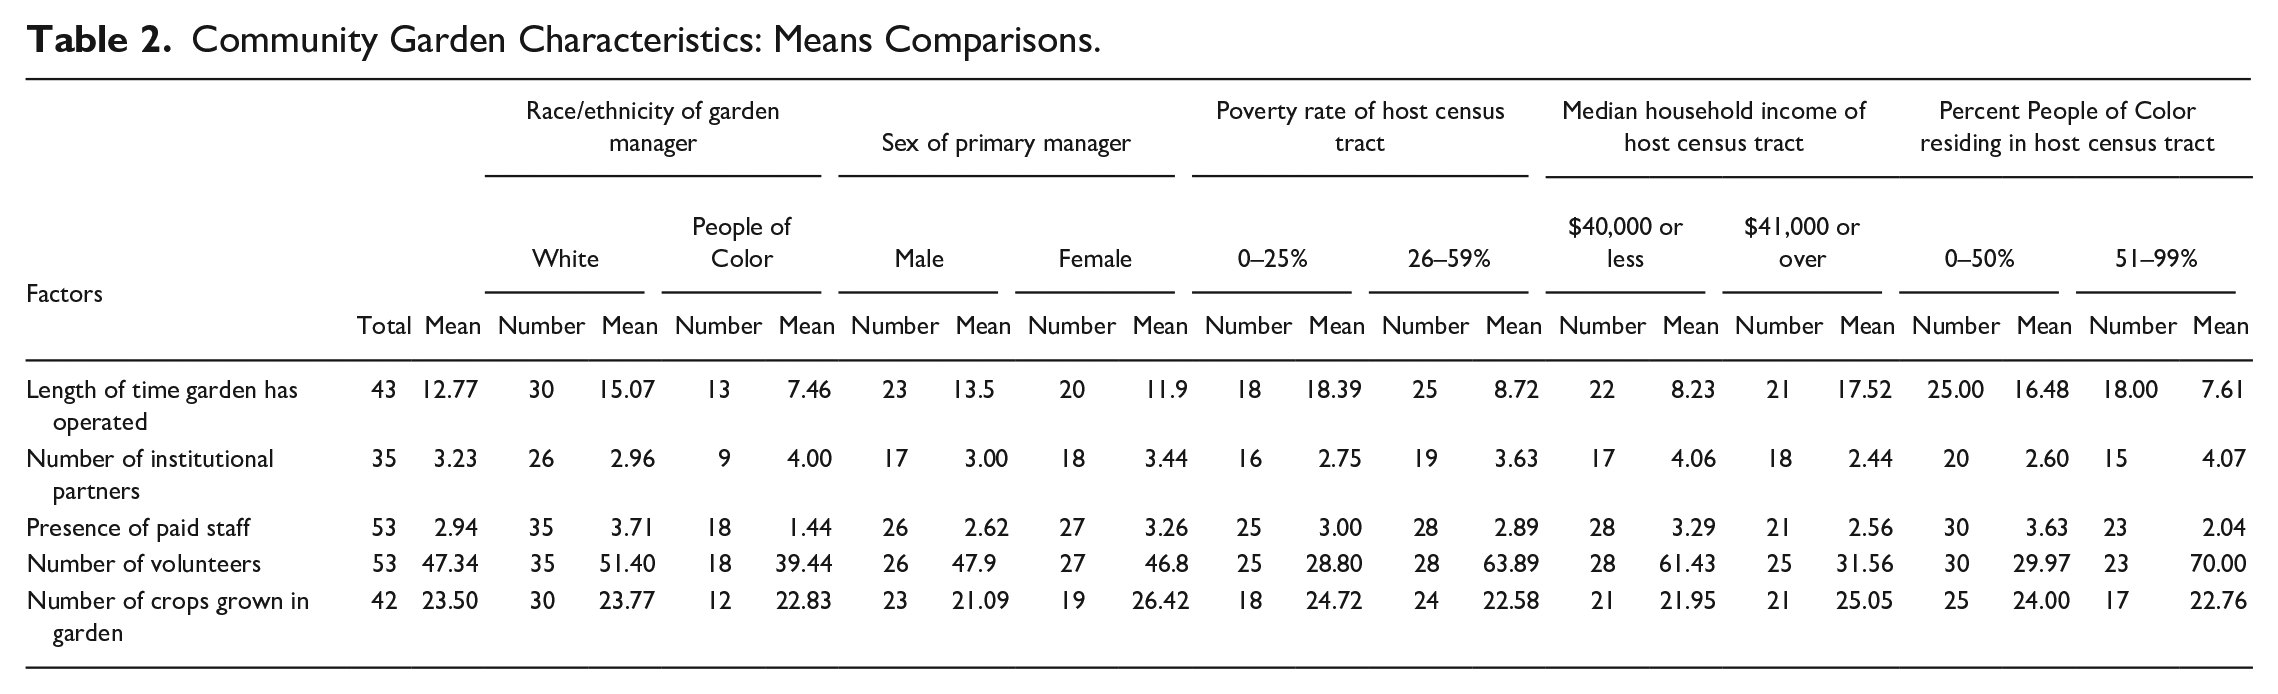
Gardens led by White managers have been operational for much longer than those managed by People of Color. Hence, White-managed community gardens operated for a mean of 15 years, while People-of-Color-Managed gardens operated for a mean of 7.5 years. Male garden managers operate older gardens than female managers. The gardens males manage are operational for a mean of 13.5 years, while those managed by females exist for a mean of 11.9 years.
There was significant variation in the ages of the gardens in different host tracts. The gardens in low-poverty census tracts were much older than those in high-poverty tracts. The community gardens in low-poverty census tracts were operational for a mean of 18.4 years. In contrast, the community gardens in high-poverty census tracts operated for 8.7 years.
The converse is true for gardens in low- and high-income tracts. The community gardens in high-income tracts are older than those in low-income tracts. The community gardens in census tracts with mean household incomes of $41,000 or more have been operating for 17.5 years. However, community gardens in census tracts with a mean household income of $40,000 or less have been operating for 8.2 years.
Table 2 also shows that community gardens in low-minority census tracts are much older than those in predominantly minority host tracts. Thus, the gardens in census tracts where half or fewer residents are People of Color have existed for 16.8 years. Conversely, the community gardens in tracts where more than half of the residents are People of Color have operated for 7.6 years.
Institutional Partnerships
Gardeners and institutions typically collaborate to develop gardens. The 35 gardens reporting had a mean of 3.2 institutional partners. People-of-Color-led gardens worked with more organizations than White-led gardens. Hence, gardens headed by People of Color collaborated with four institutions, while White-operated gardens had a mean of 2.96 institutional partners (Table 2). Female-managed gardens worked with slightly more institutional partners than male-led gardens. Female-led gardens had 3.44 institutional partners, while male-led gardens had a mean of 3 institutional collaborators.
Gardens in high-poverty tracts collaborate with more organizations than gardens in low-poverty tracts. Thus, there was a mean of 2.75 collaborators in low-poverty tracts and 3.63 institutional partners in high-poverty tracts. Similarly, community gardens in low-income tracts were much more likely to have collaborators than gardens located in high-income tracts. Thus, gardens had a mean of 4.06 collaborators in low-income tracts and 2.44 institutional partners in high-income tracts. Community gardens in census tracts where more than half of the residents are People of Color had a mean of 4.07 collaborators. In contrast, community gardens in census tracts where a half or less of the residents are People of Color have a mean of 2.60 institutional partners.
Overall, community gardens affiliate with up to 10 different institutional partners. Therefore, 18.9% of the gardens have one institutional partner, 11.3% have two partners, and 30.3% affiliate with 3 and 10 organizations. The remaining 39.6% of the organizations either have no affiliations or do not know if they do. The study found that almost half of the community gardens collaborate with nonprofit organizations. In addition, 17% collaborated with businesses, 15.1% had ties to a religious institution, and 15.1% had connections to city governments. Seven gardens were open to neighborhood residents, while a private group operated another seven. Six of the gardens were at schools, while land trusts managed two, and two were in parks (Table 3).
Community Gardens: Institutional Partners and Prior Land Use.
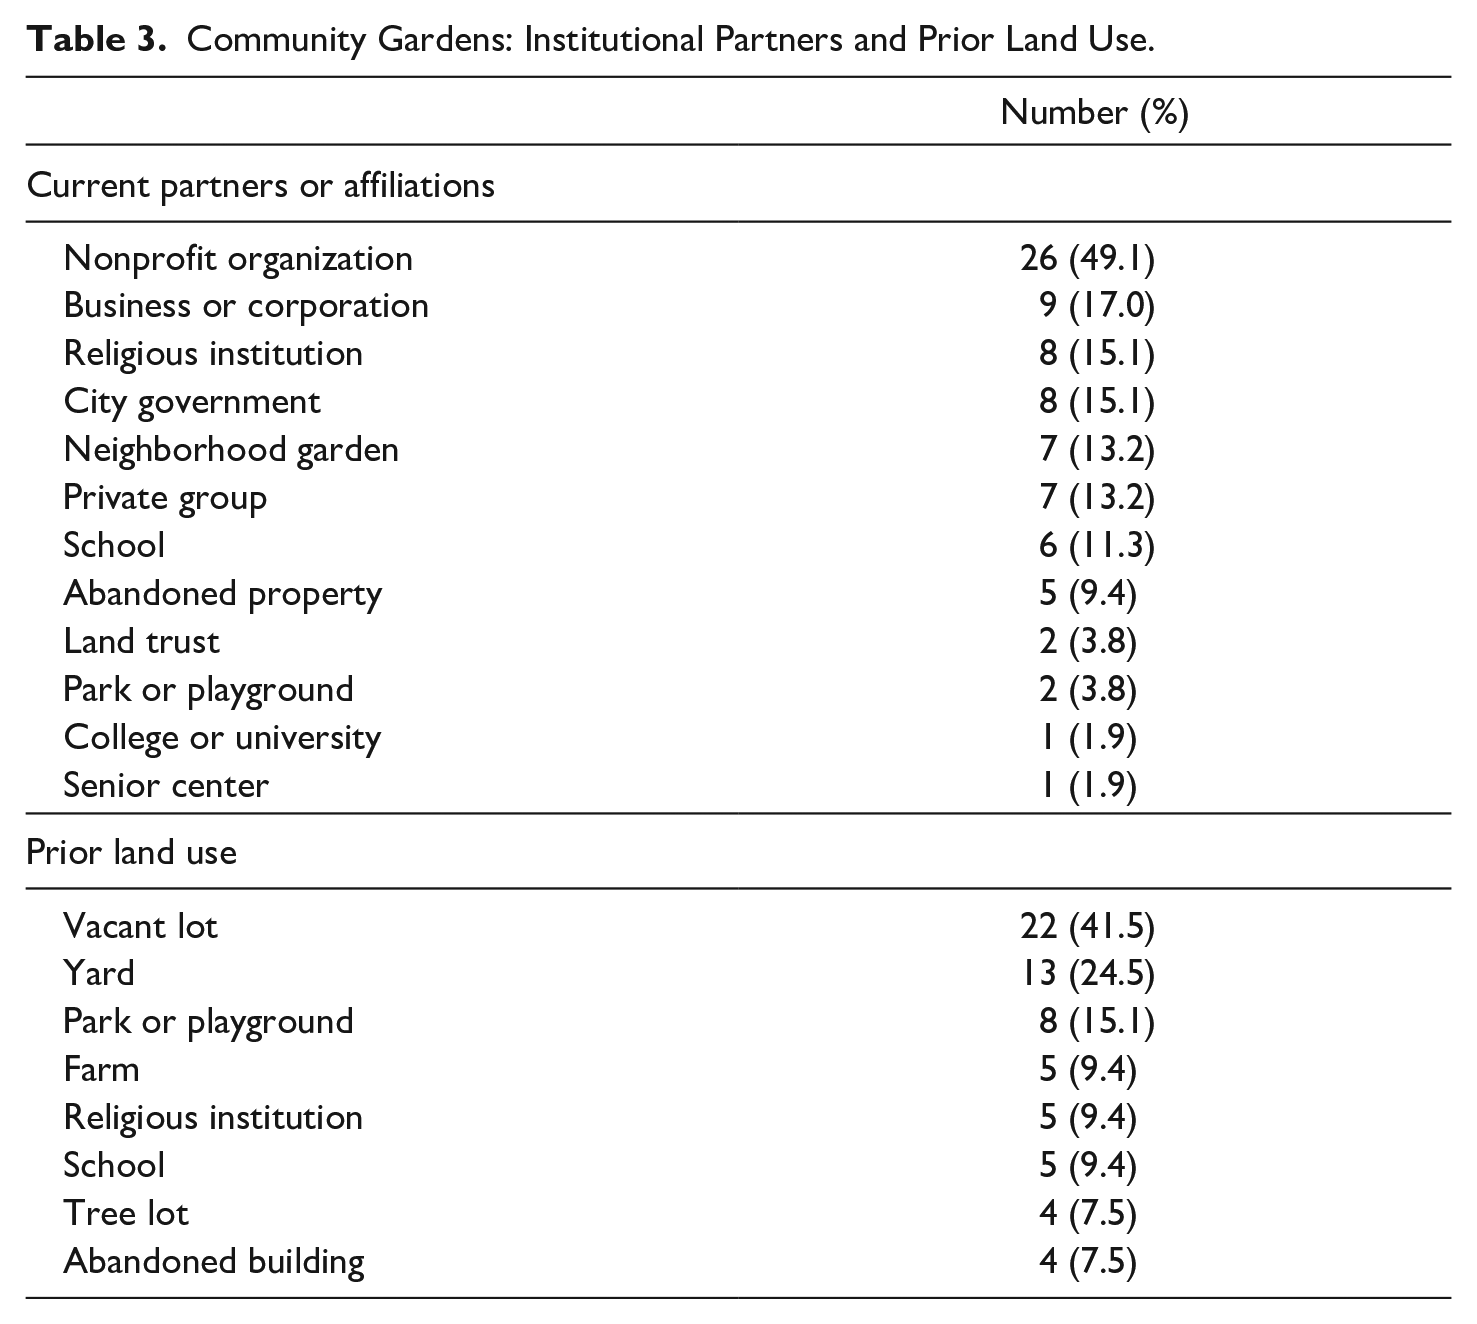
Community gardens are often developed on vacant lots; this was the case for 41.5% of the gardens. A quarter of the gardens were created in yards, and 15.1% in parks and playgrounds.
Community gardens were also developed on land that was formerly farms, tree lots, schools, and religious institutions.
Number of Staff
If they have staff, the community gardens have only a few; they had a mean of 2.94 staff. White-run community gardens had significantly more staff than those run by People of Color. Thus, White-run gardens had a mean of 3.71 staff while People-of-Color-run gardens had 1.44 staff. Gardens operated by females had more staff than those operated by males. The mean number of garden staff was somewhat similar in low- and high-poverty host tracts. However, the number of staff was noticeably higher in low-income than in high-income tracts. The pattern was similar for the racial/ethnic composition of the tract. Gardens in tracts containing low percentages of People of Color had more staff than gardens in host tracts where more than half of the residents are People of Color.
Volunteering
The community gardens relied on volunteers. A mean of 47.3 people volunteered in the community gardens studied. Nevertheless, there were more volunteers in White-led gardens than in gardens led by People of Color. Hence, gardens led by Whites reported a mean of 51.4 volunteers, while gardens with People of Color managers had a mean of 39.4 volunteers. The number of volunteers in male-run and female-run gardens was similar.
Despite the race/ethnicity of the garden manager, the volunteers were concentrated in high poverty, low income, majority People of Color tracts. Hence, more than twice as many volunteers were in gardens in high-poverty census tracts than in low-poverty tracts. The reverse was true for income effects. Gardens in low-income census tracts had significantly more volunteers than those in high-income census tracts. So, the gardens in low-income host tracts had 61.4 volunteers; this number is almost twice as high as the mean of 31.6 volunteers reported in high-income tracts.
We observed the most significant difference in voluntarism in non-majority and majority People of Color host tracts. While community gardens in census tracts with 0–50% People of Color residing in them had 30 volunteers, the community gardens in census tracts where more than half of the residents are People of Color had 70 volunteers at the gardens.
What Gardens Grow
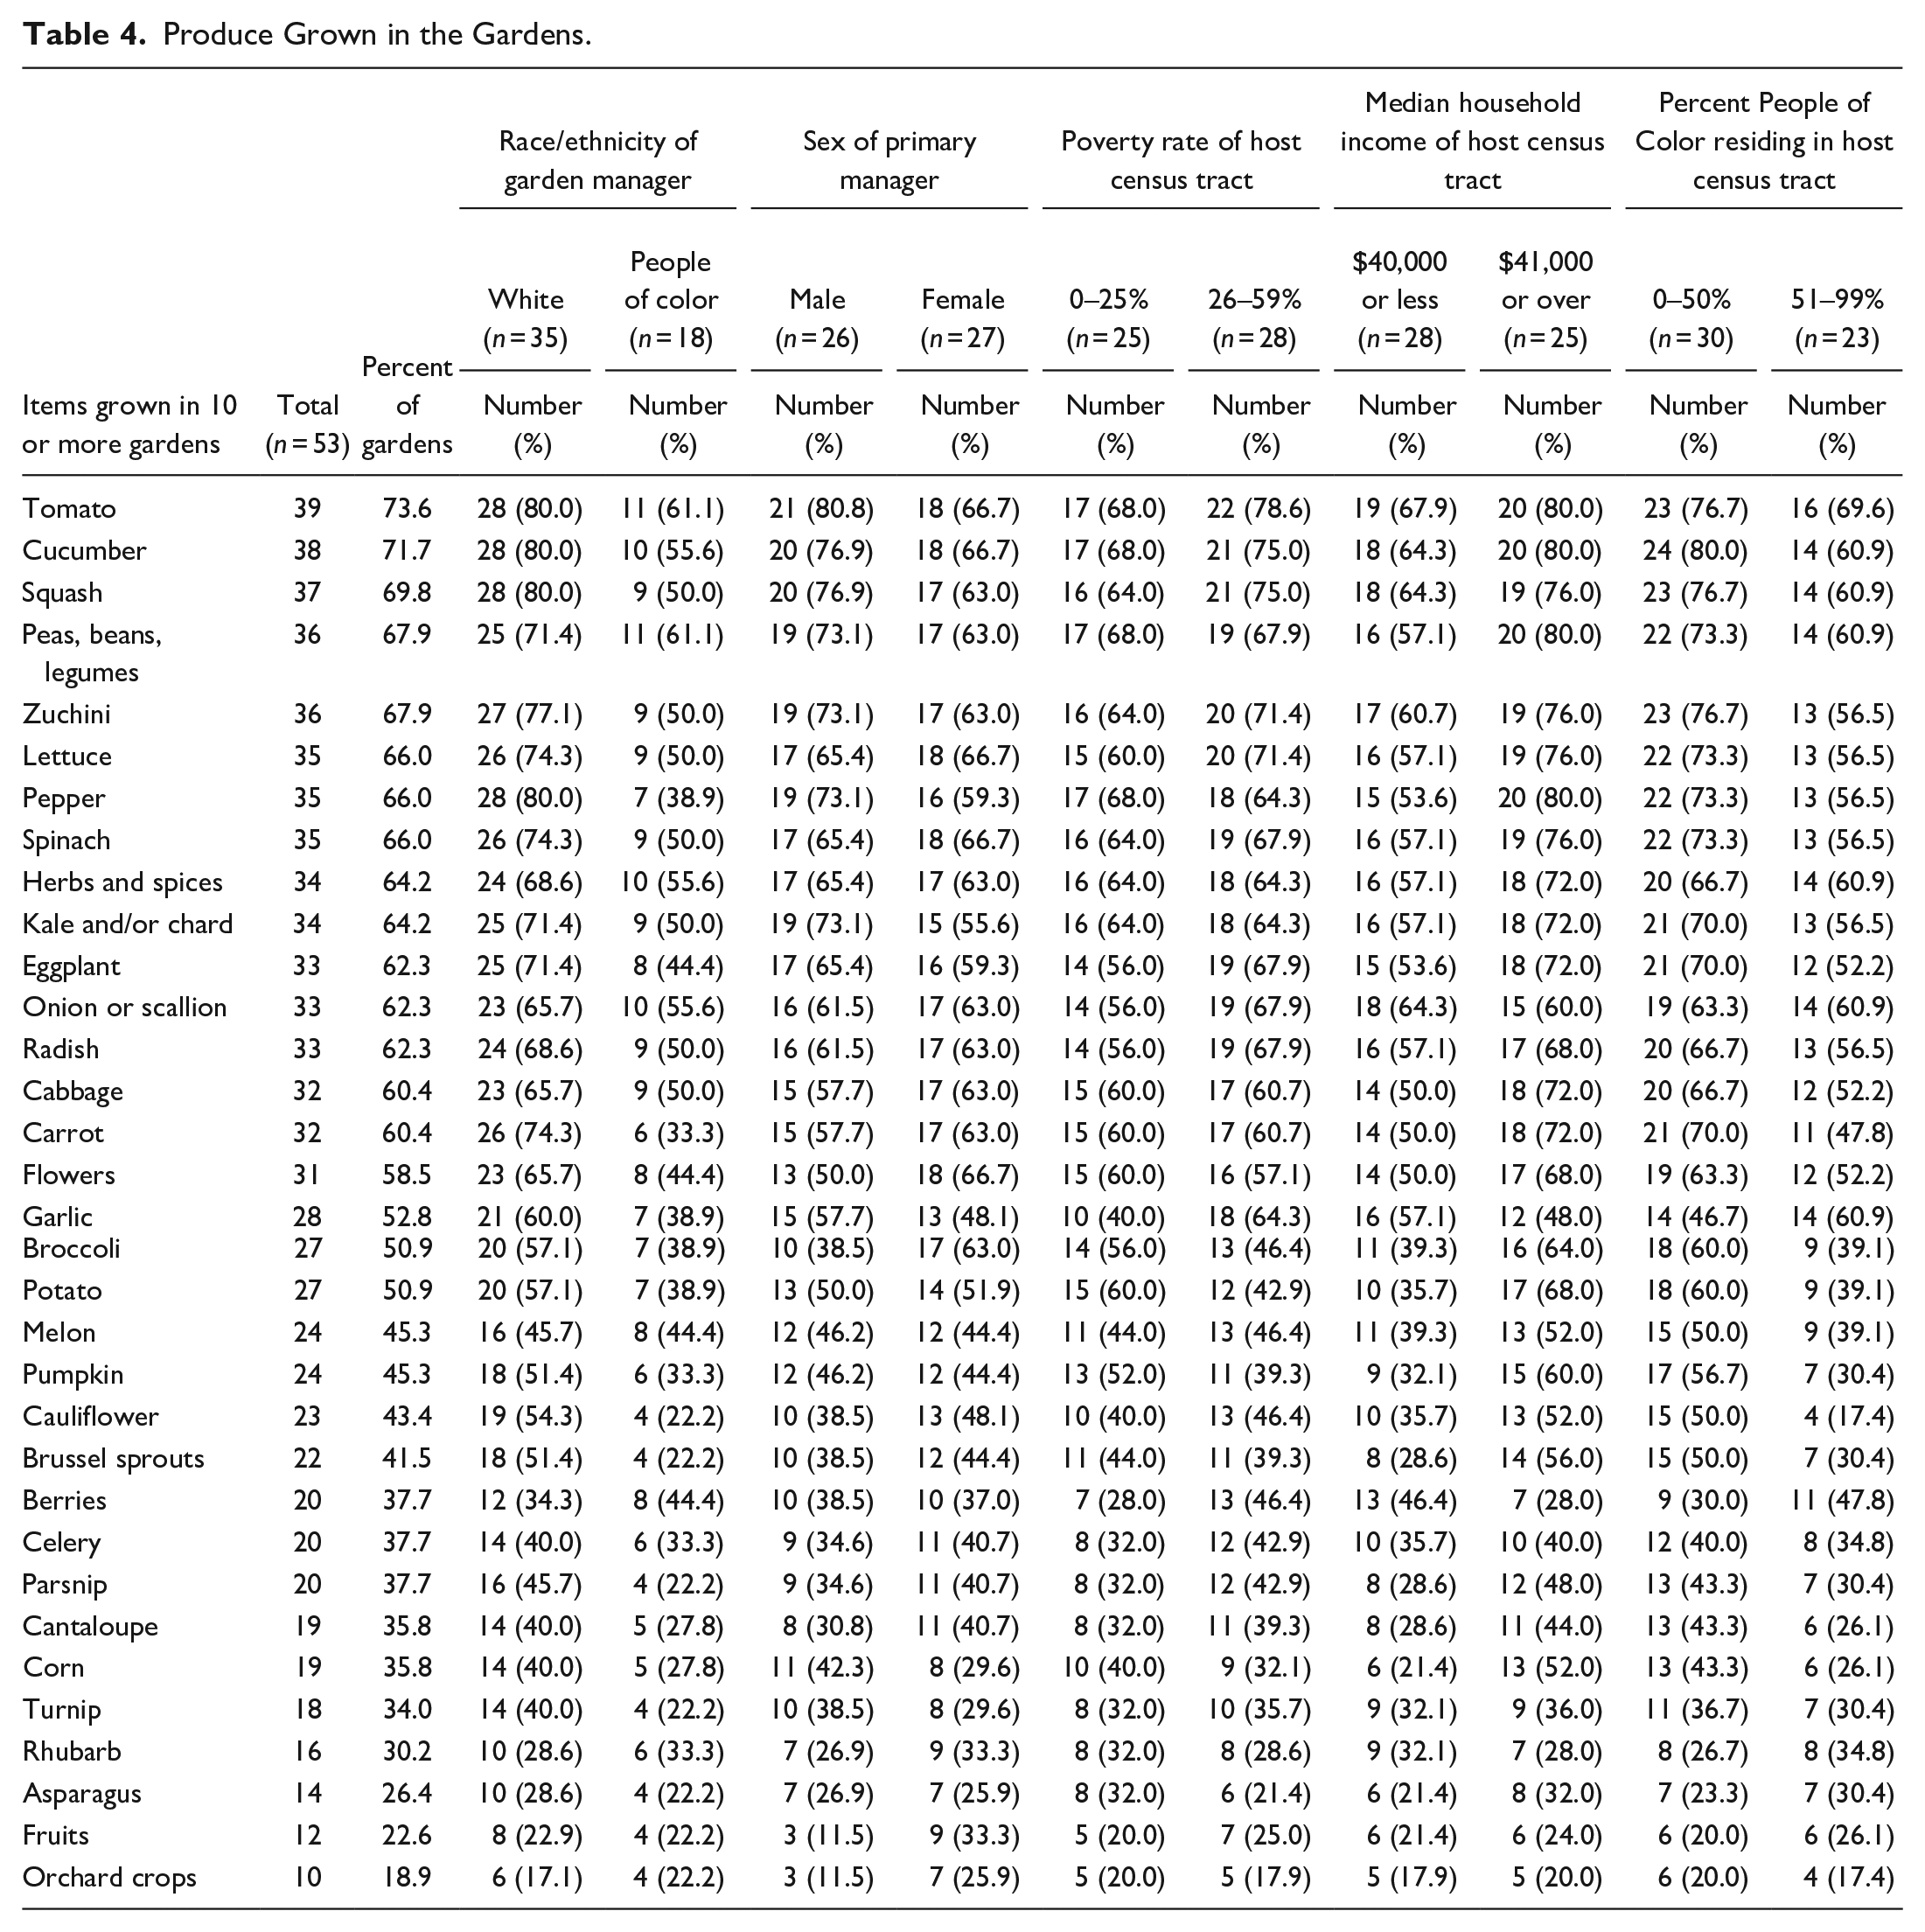
We provided garden managers with a list of 61 garden crops; they selected which crops gardeners cultivated in their gardens. If their gardens cultivated crops that were not listed, managers could write in the names of such crops. Overall, gardens grew 23.5 different crops (see Table 3). The number of crops grown was similar between White-managed and People-of-Color-managed gardens. Thus, gardens that Whites managed grew a mean of 23.8 different types of crops, while the gardens managed by People of Color cultivated a mean of 22.8 different crops. However, the gardens with paid staff grew a wider variety of crops than those with no paid staff. When the gardens had paid staff, they cultivated 24.9 crops, while those without paid staff grew 22.6 different crops. The number of volunteers was also related to the variety of crops grown. Gardens with less than 15 volunteers cultivated 21.3 crops, while the gardens with 15 or more volunteers grew a mean of 25.3 crops.
Table 4 lists the produce grown in 10 or more gardens in the study. Tomato was the most frequently grown crop; 73.6% of the gardens grew this product. More than 60% of the gardens also grew cucumbers, squash, legumes, zucchini, lettuce, pepper, spinach, herbs and spices, kale/chard, eggplants, onion/scallion, radish, cabbage, and carrots. For all the crops listed above, community gardens managed by People of Color were less likely to cultivate these items than White-led community gardens.
Produce Grown in the Gardens.
The Sale of Garden Produce
Only 24.5% (13) of the community gardens sold the crops grown in the garden (Table 5). People-of-Color-led gardens were more likely to sell their products than gardens managed by Whites. While a third of the gardens managed by People of Color sold produce, one-fifth of those that Whites managed did likewise. Gardens managed by males were slightly more likely than those managed by females to sell produce. Hence 26.9% of the gardens with male managers and 22.2% of those with female managers sold crops cultivated.
Places Where Community Gardens Sell Their Produce.
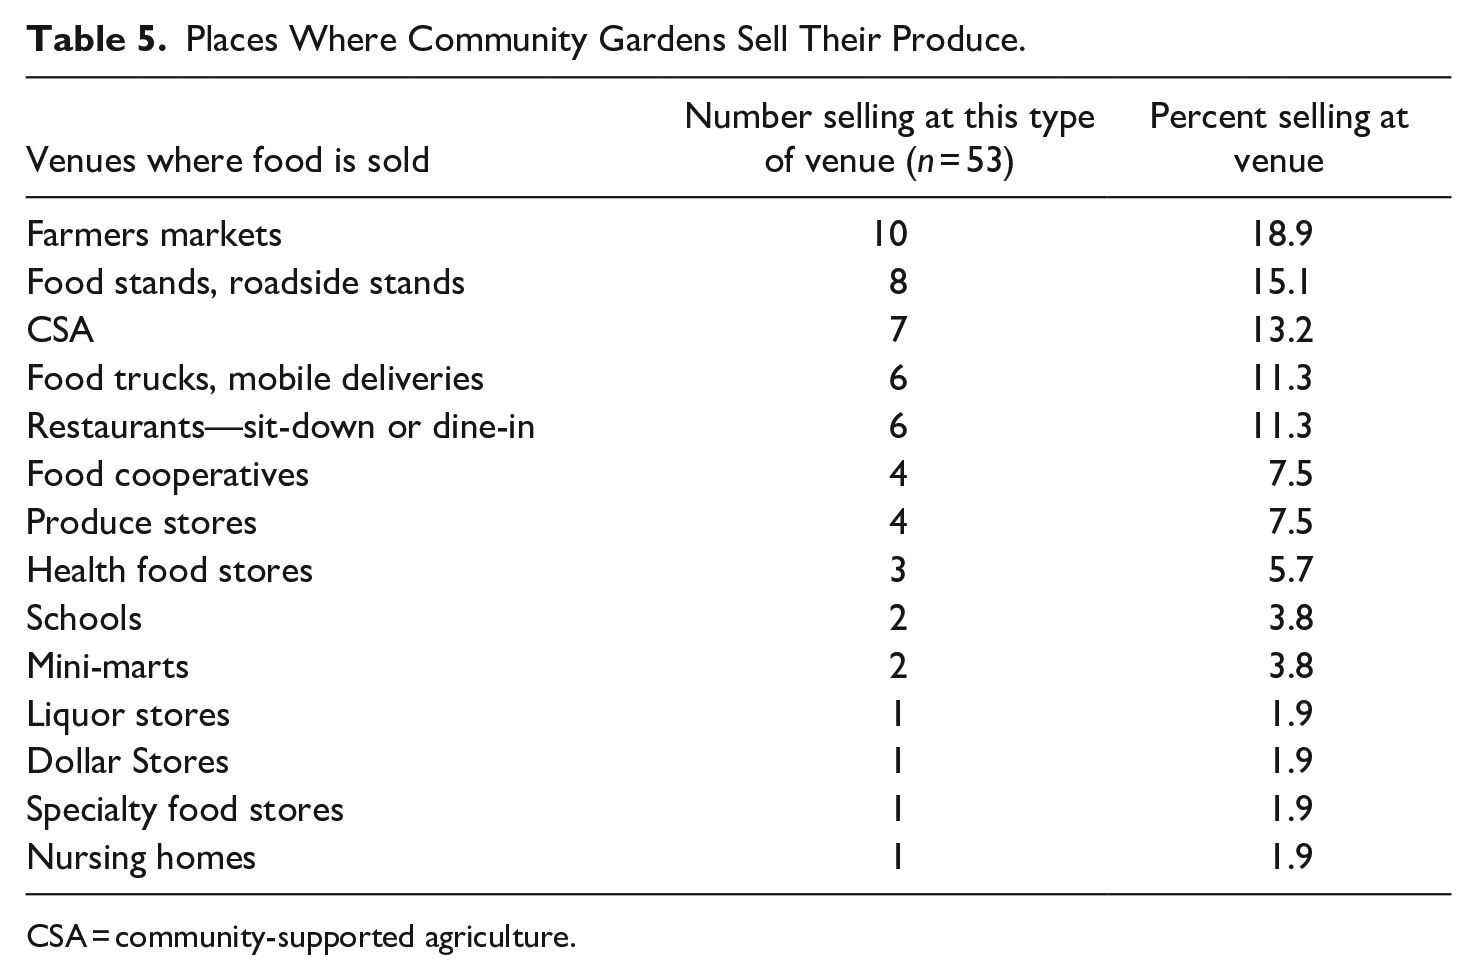
CSA = community-supported agriculture.
There was no association between the poverty rate of the host census tract and the sale of garden produce. Twenty-four percent of the gardens in low-poverty tracts and 25% of those in high-poverty tracts sold their garden produce. Income mattered more as gardens in low-income census tracts were more likely to sell their produce than gardens in census tracts with high median household incomes. So, 28.6% of the gardens in low-income census tracts sold produce. In comparison, 20% of the gardens in high-income host tracts sold their crops.
We observed the most significant difference in the sale of produce when we examined the racial/ethnic composition of the host tracts. Gardens in host tracts with high percentages of People of Color were more than twice as likely to sell products than gardens in census tracts with low percentages of People of Color. While 34.8% of the gardens in host tracts where more than half the residents are people sold the crops grown, only 16.7% of the gardens in census tracts where 0–50% of the residents are People of Color sold their produce.
Community garden managers identified 14 venues where they sold crops. Table 5 lists the ones where the products are most frequently sold. Farmer’s markets and food or roadside stands top the list. Community gardens also sell their products through community-supported agriculture (CSA) programs.
Community Gardens: Serving Low-Income Residents
The paper examines how community gardens serve low-income residents by looking at participants in four food assistance programs (see Table 6). Community garden managers indicated if they had gardeners, staff, volunteers, customers, clients, or neighbors who participated in government- or nonprofit-run nutrition programs. We looked at the following programs—the Supplemental Nutrition Assistance Program (SNAP), Women, Infant, and Children (WIC), Double-up Food Bucks, and Project FRESH—a senior farmers market nutrition program (see the United States Department of Agriculture, 2021).
The Extent to Which the Gardens Serve Low-Income Residents.
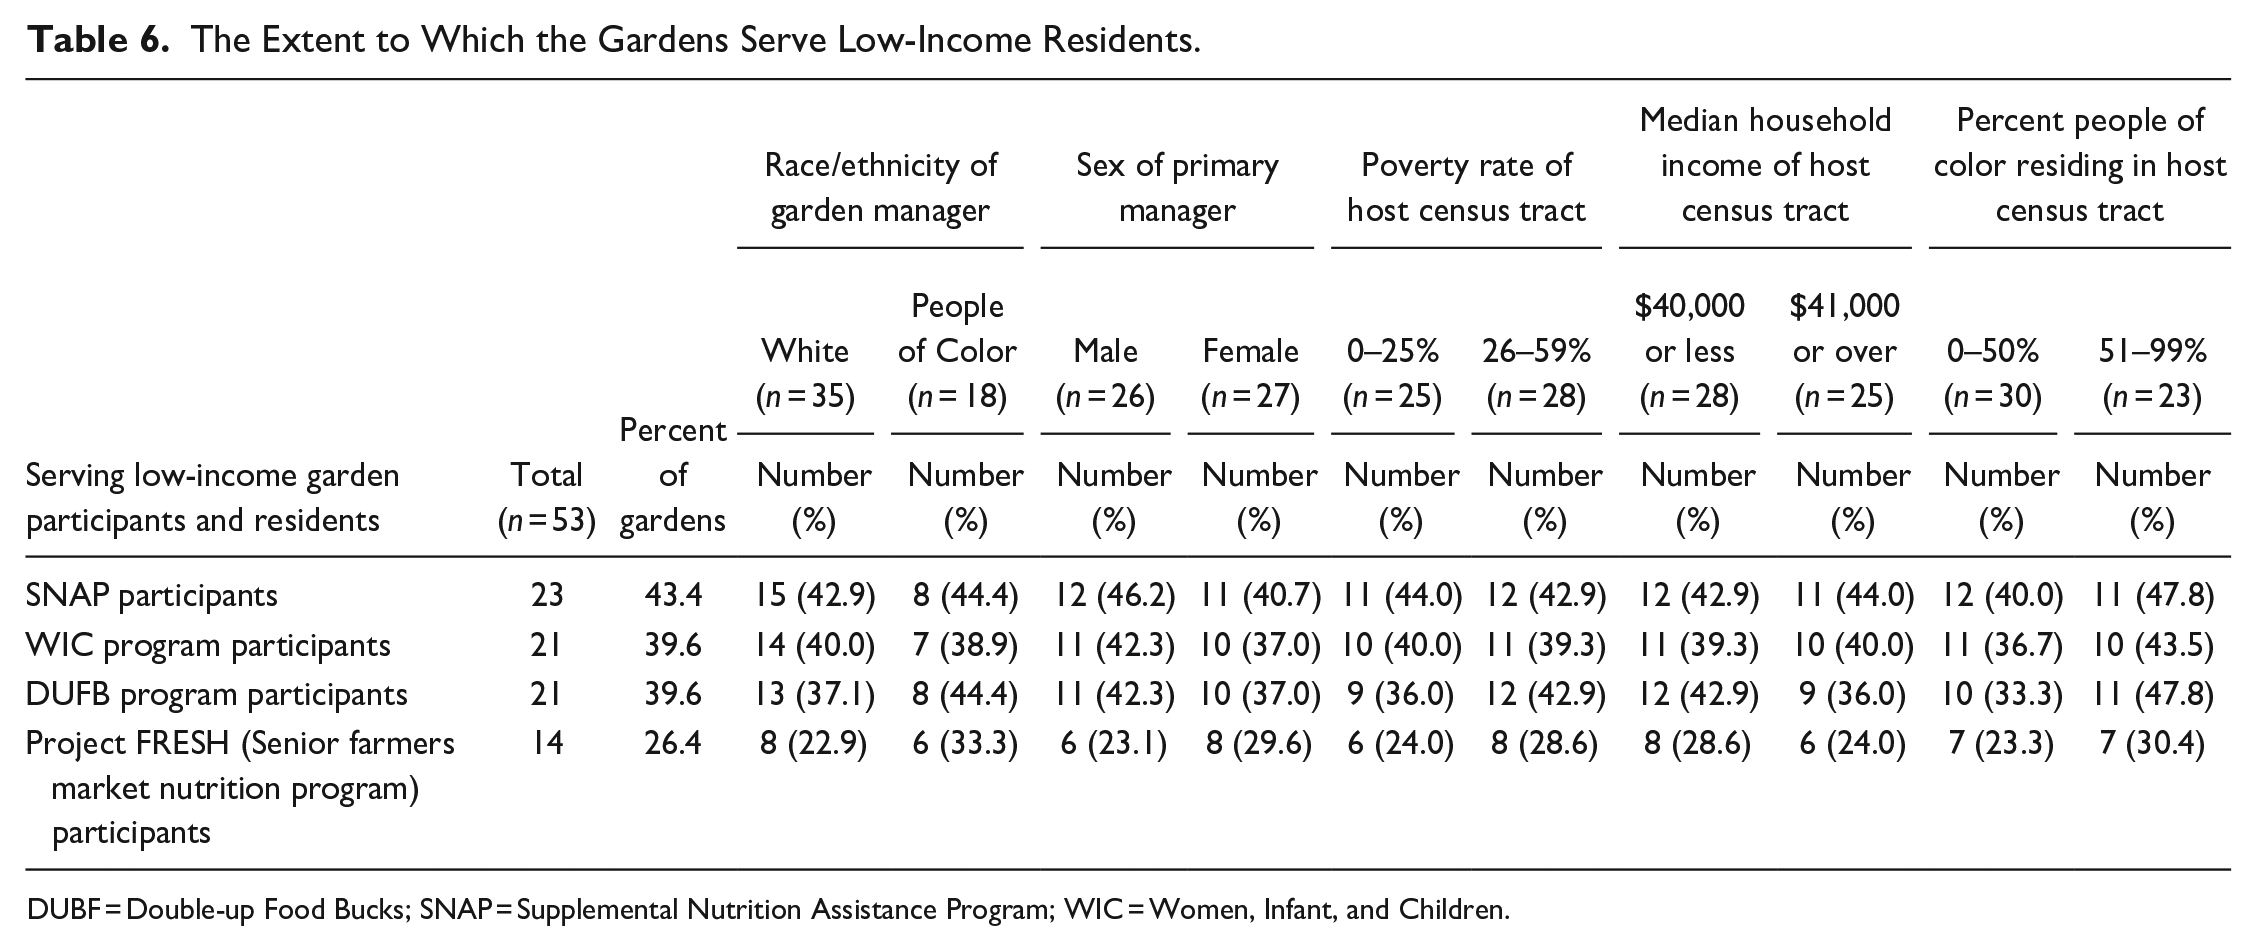
DUBF = Double-up Food Bucks; SNAP = Supplemental Nutrition Assistance Program; WIC = Women, Infant, and Children.
Community gardens often engage with SNAP participants; 43.4% of the gardens serve SNAP recipients. Gardens headed by Managers of Color are slightly more likely to engage SNAP recipients than those managed by Whites. Our study found that 44.4% of gardens managed by a Person of Color and 42.9% of those operated by Whites served SNAP recipients. Gardens managed by males were more likely to serve SNAP recipients than female-managed gardens. Forty-six percent of the male-led gardens and 40.7% of the female-led gardens served SNAP recipients.
There was no association between the poverty rate or the household income level of the census tract and service to SNAP recipients. However, gardens in predominantly People of Color census tracts were more likely to serve SNAP recipients than those in low-minority tracts. Hence, 47.8% of the gardens in census tracts where more than half of the residents were People of Color served SNAP recipients. In comparison, 40% of the gardens in host tracts where 0–50% of the residents are People of Color served SNAP recipients.
Roughly 40% of the gardens served WIC recipients and DUFB program participants. In the case of WIC, the independent variable that had the most substantial impact on service was the racial/ethnic characteristics of the host tract. Gardens in majority People of Color tracts were likelier than those in non-majority People of Color tracts to engage with WIC recipients. Consequently, 43.5% of the gardens in tracts where more than half of the residents of People of Color served WIC recipients. Conversely, 36.7% of the gardens in census tracts where 0–50% of the residents are People of Color served WIC recipients. The results were similar for engagement with DUFB program participants. While 47.8% of the gardens in predominantly minority host tracts engaged DUFB recipients, a third of the gardens in low-minority census tracts did likewise.
Only 26.4% of the gardens served residents participating in the Project FRESH program. The gardens most likely to engage Project FRESH participants are those that People of Color manage, gardens operated by females, and gardens in high-poverty and low-income census tracts. Community gardens in predominantly People of Color host tracts were also more likely to serve Project FRESH recipients than those in census tracts with 0–50% of People of Color residents.
How do Community Gardens Deal with Produce that Growers do not Use or Sell?
Community garden managers reported what happened to food cultivated in their gardens that was not used by their gardeners or sold. More than half of the gardens gave the produce to friends, family, and neighbors. They gave it to anyone who asked, donated it to a food pantry, or composted it (Table 7).
Dealing With Unused or Unsold Garden Produce.
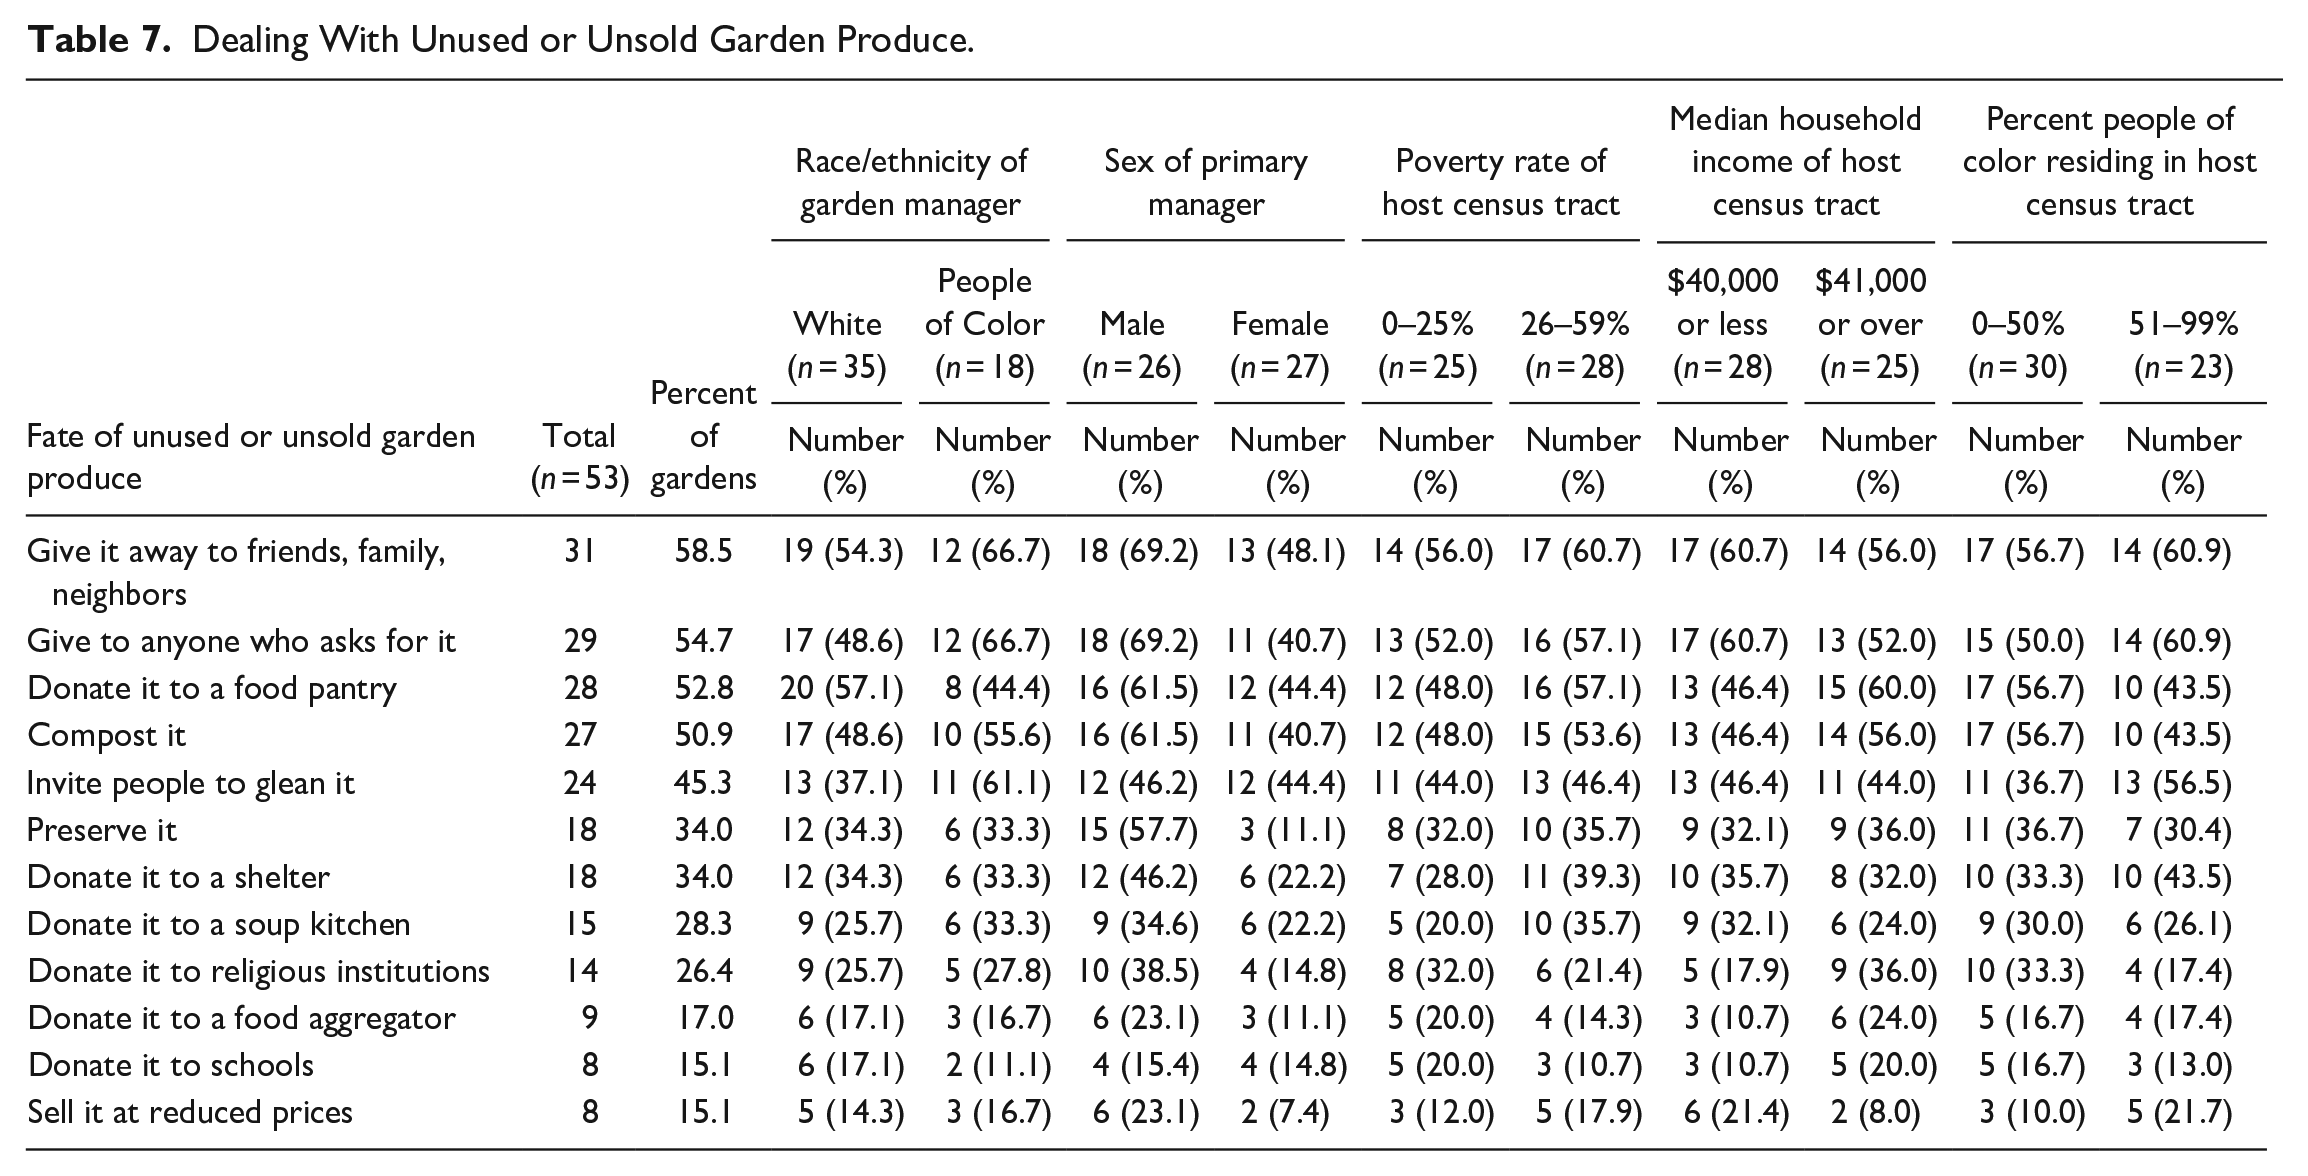
Two-thirds of the gardens led by People of Color managers gave the food away to friends, family, or neighbors or gave it to anyone who requested it. In contrast, 54.3% of the White-led gardens gave produce to their friends, family, or neighbors, while 48.6% gave crops to anyone asking for it. Gardens managed by males were much more likely to give away produce to friends/family/neighbors, anyone asking for it, food pantries, or compost it than female-led community gardens.
Gardens in high-poverty census tracts were more inclined to give away food to the people and institutions mentioned above than gardens in low-poverty census tracts. Gardens in low-income and majority People of Color tracts are slightly more likely to give garden produce to friends/family/neighbors or anyone asking for it than gardens in high-income and non-majority People of Color tracts.
Gleaning is an activity that allows gardens to gather and repurpose food not used or sold by gardeners. Gardens led by People of Color were far more likely to invite people to glean their gardens than those led by Whites. Hence, 61.1% of the gardens managed by People of Color allowed gleaning. Conversely, only 37.1% of the gardens operated by Whites invited people to glean. Gleaning was also much more prevalent in gardens in host tracts where more than half of the residents were People of Color; 56.5% of those gardens allowed gleaning. Gleaning was allowed in only 36.7% of the gardens in census tracts where up to a half of the residents were People of Color.
Preservation was another strategy used by gardens to process food not used or sold by gardeners. Thirty-four percent of gardens preserved what they cultivated. However, male-led gardens were significantly more likely than female-led gardens to preserve crops. That is, 57.7% of gardens managed by males and 11.1% of those operated by females reported preserving what they cultivated.
Community Gardens in a Time of Crisis
Impacts of the Pandemic
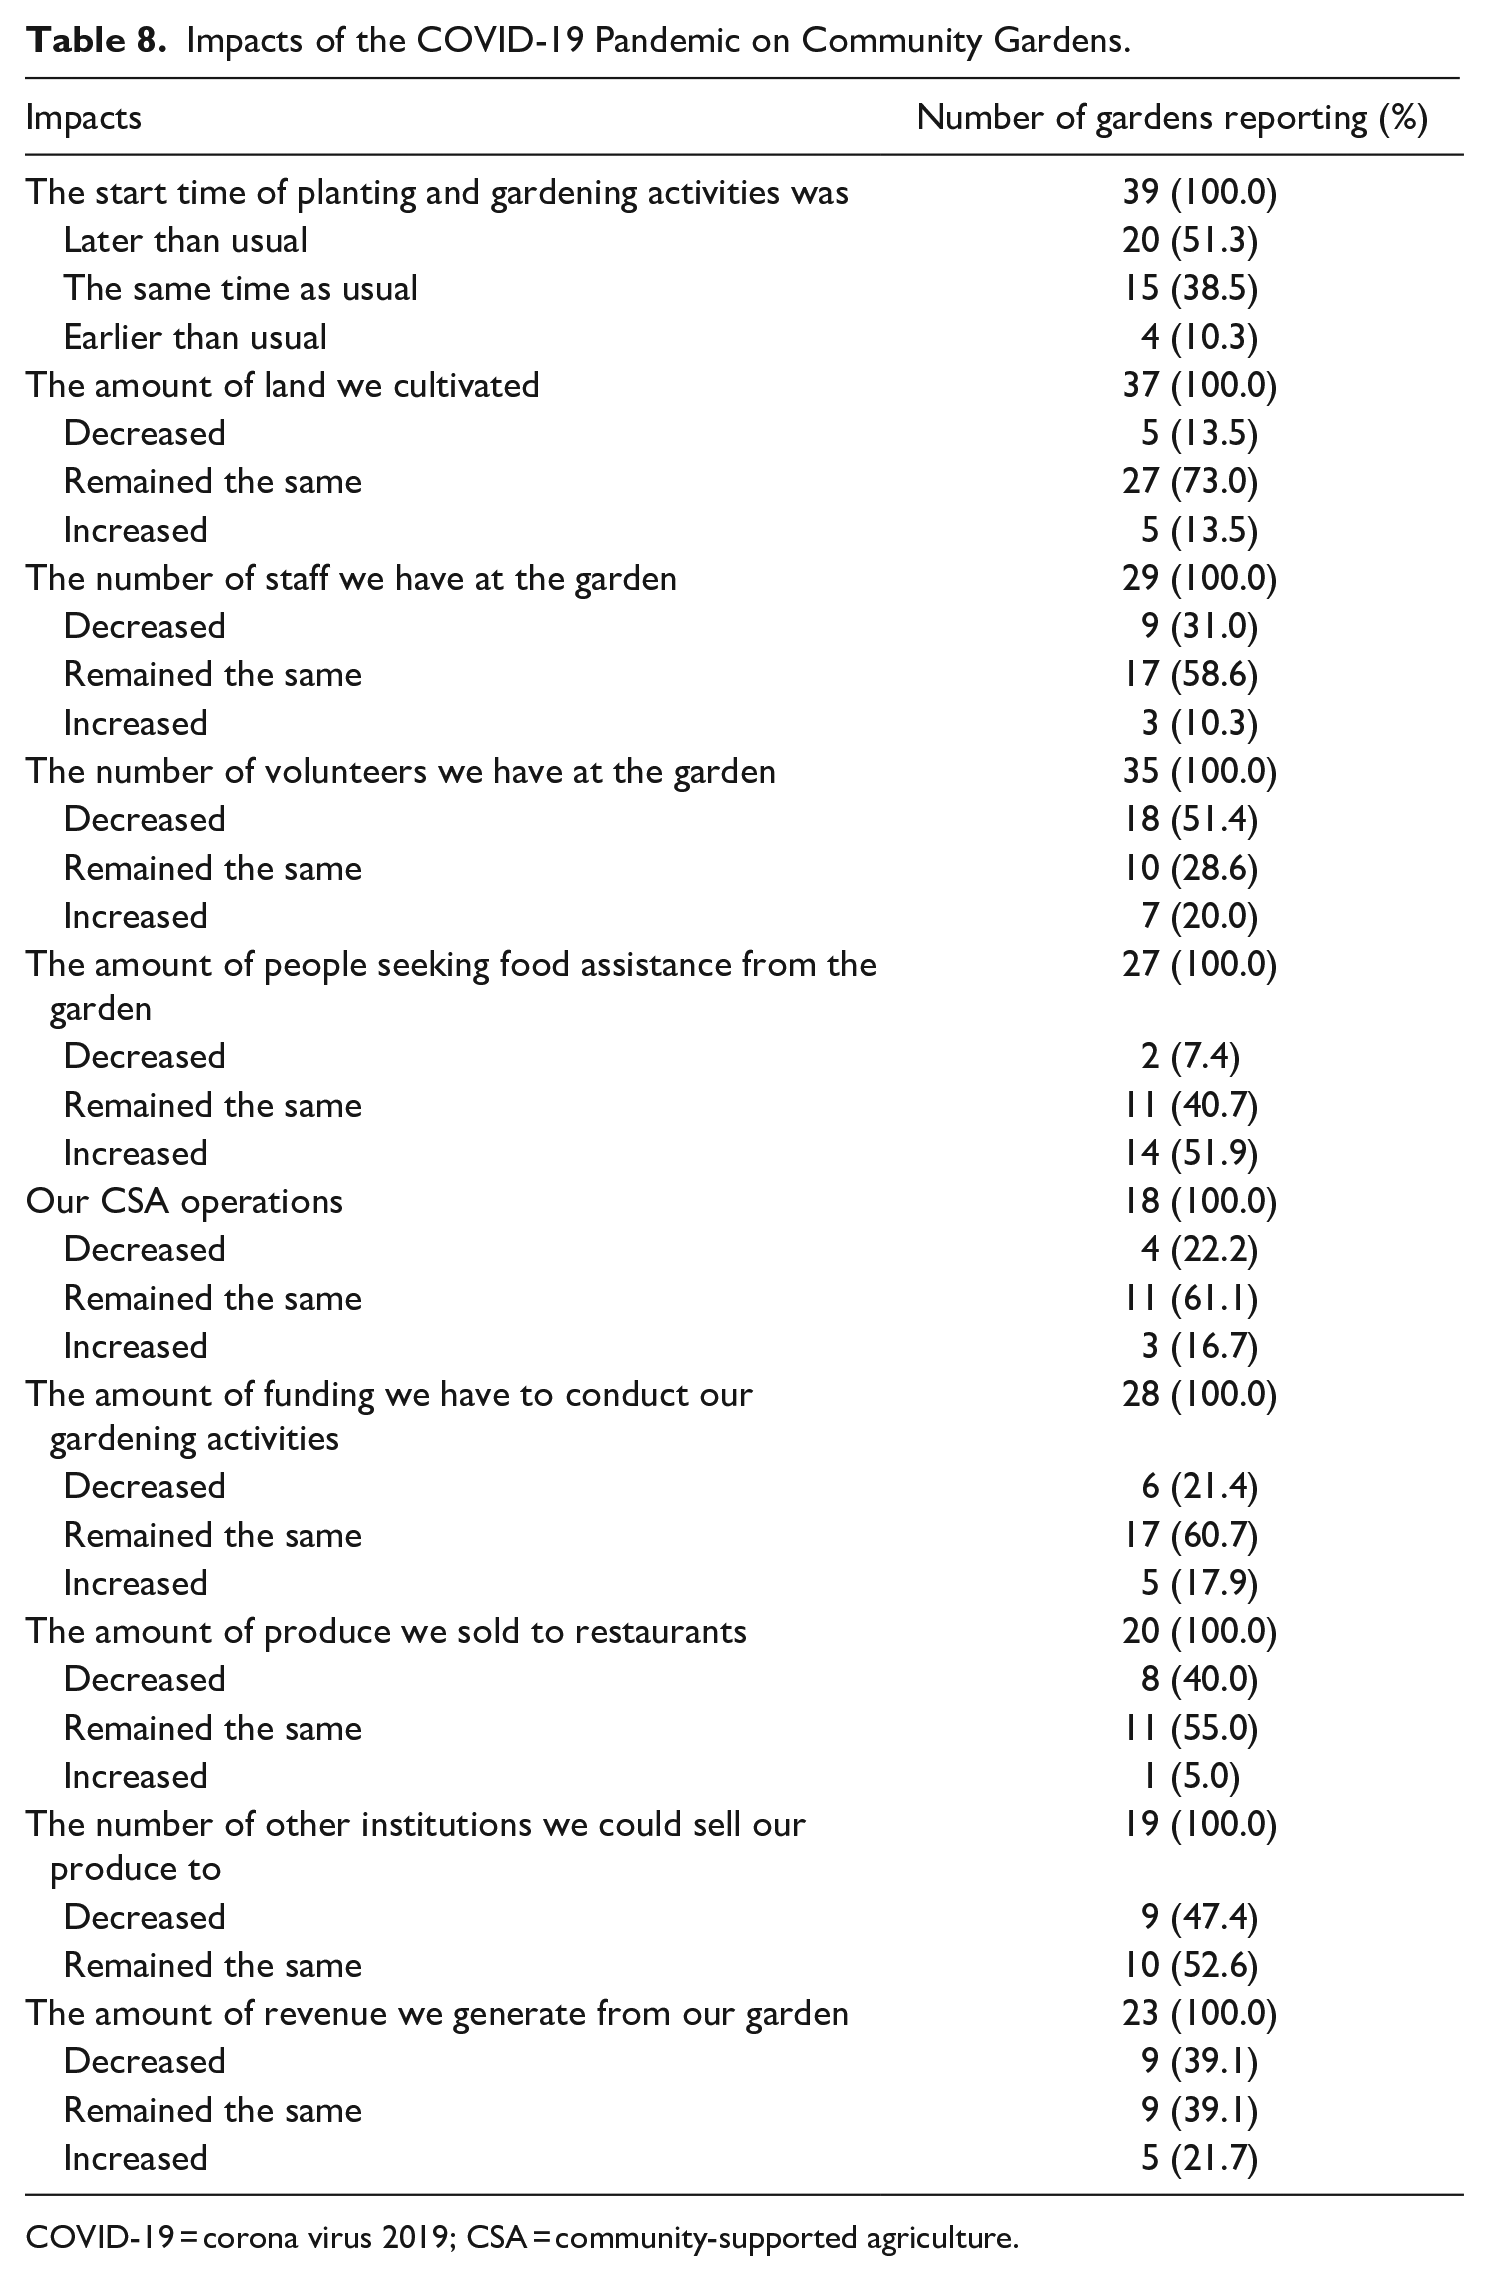
The COVID-19 had a profound impact on community gardens. Though only 13.5% of the gardens said they reduced the size of the area under cultivation, planting and other activities started later than usual for 51.3% of the gardens. Moreover, 31% of the gardens reduced their staff, and the number of volunteers declined in 51.4% of them. The reduction in personnel needed to execute garden activities was accompanied by increased demands for service. For instance, 51.9% of the managers reported that the number of people seeking food from their community garden increased (Table 8).
Impacts of the COVID-19 Pandemic on Community Gardens.
COVID-19 = corona virus 2019; CSA = community-supported agriculture.
While 22.2% of the gardens reported that their CSA activities declined, 16.7% increased such activities. Overall, community gardens had fewer places to sell their produce. Forty percent said the amount of produce they sold to restaurants decreased, and 47.4% reported that they sold reduced amounts of produce to other institutions. Unsurprisingly, 39.1% of the community gardens reported losing revenue during the pandemic. Only two gardens reported receiving government support to help them acquire the personal protective equipment and supplies they needed.
Responses to the Pandemic
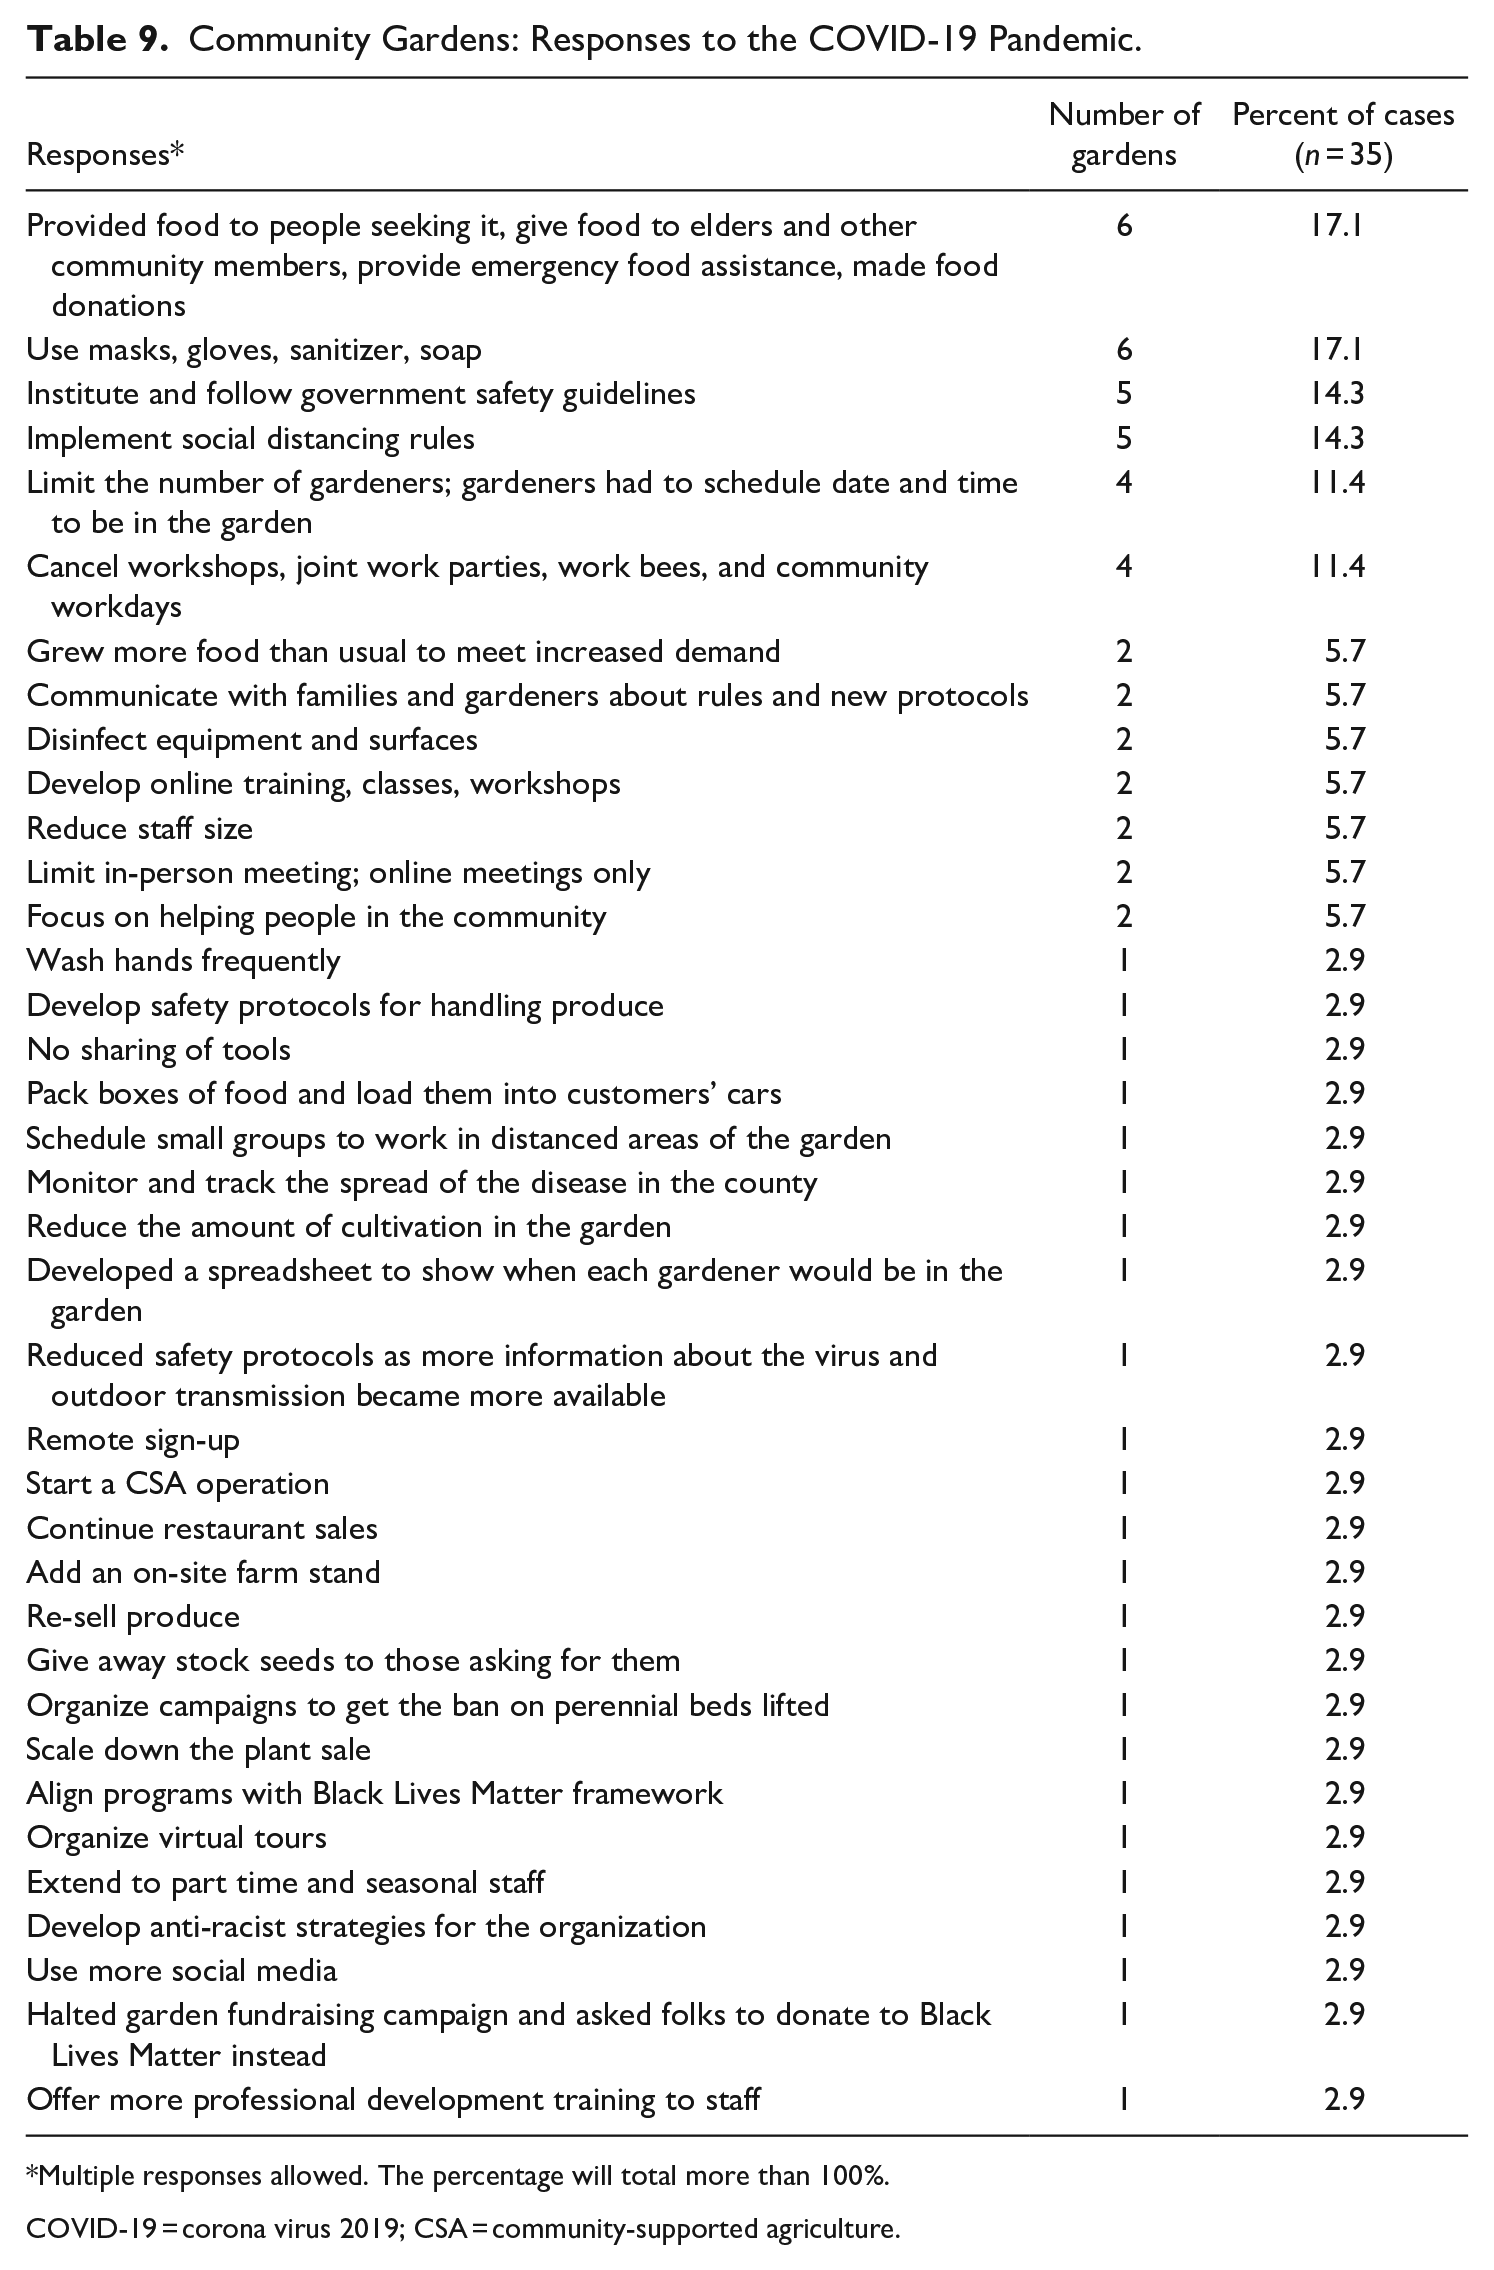
The two most common responses to the pandemic that community gardens adopted were (a) providing free food to people who needed it and (b) using masks, gloves, and sanitizers to help keep the virus at bay (Table 9). Community gardens also followed government safety guidelines and instituted social distancing rules. The community gardens also responded by limiting the number of gardeners at the site at any given time and monitoring the spacing of gardeners while onsite. Gardens reported that they prohibited sharing tools, and sanitized surfaces, and moved many of their programs online.
Community Gardens: Responses to the COVID-19 Pandemic.
Multiple responses allowed. The percentage will total more than 100%.
COVID-19 = corona virus 2019; CSA = community-supported agriculture.
Gardens found creative ways to sell or distribute their produce. One garden packed boxes with food and put them in their customers’ cars, another started a CSA, and another installed an on-site farm stand. There was increased demand for seeds, so one manager reported giving away all the garden’s stockpiled seeds.
Discussion
Community gardens were born during economic crises and severe food shortages. The COVID-19 pandemic of 2020 plunged the country (and the world) into health, economic, and political crises and food shortages. The pandemic ravaged the globe, and the United States was hard hit. Food access was at the center of the crisis as people formed long lines and waited hours to obtain food from emergency food assistance organizations. Our study explored how community gardens responded to the pandemic. The results show that community gardeners were among the unsung heroes of the pandemic. They grew more food, donated food to the needy, and adjusted their operations to respond to the crisis.
Community gardens are overlooked when food systems are considered. Farmers, farmer’s markets, and emergency food assistance programs received government assistance during the pandemic. For instance, the U.S. Department of Agriculture’s Farm to Families Food Box Program helped the food systems actors and organizations mentioned above gain access to millions of dollars of federal funding to grow and supply food to needy citizens (Agricultural Marketing Service, 2021; Galloway, 2020; Sielksi, 2020; Taylor et al., 2021). By and large, such assistance bypassed community gardens. Only two community gardens studied got help; they received a negligible sum to purchase masks and hand sanitizers.
This aspect of community gardening has not been studied before. Although studies examine improved diets and nutrition that community gardens make possible (Alaimo et al., 2008; Barnidge et al., 2013; Corrigan, 2011; Lautenschlager & Smith, 2007), previous studies have not examined how community gardens alleviate hunger during severe food shortages. Our new findings show that community gardens are crucial during public health crises. The gardens we studied remained operational and showed a resilience hitherto unstudied.
The most popular foods grown in the gardens we studied were similar to those reported in other studies (Algert et al., 2014; Burdine & Taylor, 2017; National Gardening Association, 2009). However, we found that the variety and types of foods grown in community gardens in predominantly White and predominantly People of Color census tracts differed somewhat.
Our study is only one of a few (see Burdine & Taylor, 2017; Smith et al., 2021) to examine the relationship between census tract characteristics and community garden characteristics. Researchers such as Birky and Strom (2013), Langegger, (2013), and Companion (2016) find that communities of color host community gardens successfully. Our study supports such findings; we present novel findings showing that low income, high poverty, and predominantly People of Color census tracts host viable community gardens.
Although Kirby et al. (2020) report that 72% of the gardens donate food to family and friends, only 58.5% of the gardens in our study donated food to family, friends, and neighbors. Burdine and Taylor (2017) also found that a higher percentage of the gardens gave food to neighbors or emergency food organizations than we found in our study.
The gardens in majority-People-of-Color census tracts were under increased pressure during the pandemic to produce and give away food. They reported that more people than usual sought free food from them. Community gardens in majority-People-of-Color census tracts are also more likely to give away food to family/friends/neighbors or allow gleaning than other gardens.
The gardens in communities of color occupy a unique niche in that they are more likely to sell the food produced in their gardens than the gardens in predominantly White census tracts. Earlier studies report that community gardens sell the produce they grow (Armstrong, 2000; Burdine & Taylor, 2017; Kirby et al., 2020). However, we found that 24.5% of the community gardens sell their produce; this figure is lower than the 35% that Armstrong (2000) reports but higher than the 10.3% that Burdine and Taylor (2017) report.
The study makes other contributions to our understanding of community gardens. It is the first to examine how the garden managers’ race/ethnicity and sex influence garden activities and outcomes. White and People of Color managers tend to operate in separate spheres. People-of-Color managers are not in the rural domain; they operate community gardens in urban areas. Most People of Color managers operate gardens in high-poverty census tracts with low median household incomes. These managers also oversee gardens in majority-People-of-Color neighborhoods. In comparison, most White garden managers administer community gardens located in low-poverty census tracts with high median household incomes and a low percentage of People of Color.
The study found that the community garden manager’s race/ethnicity and sex were influential in several other instances. White managers had more staff and volunteers than People-of-Color-managers. Staffing and volunteer levels had significant implications for the amount and type of crops gardens grow, the number of programs they operate, their ability to provide services to those in need, the types of services provided, and their ability to cope with the COVID-19 pandemic.
Most of the community gardens in our study are on once-vacant land. Other researchers report similar findings (Burdine & Taylor, 2017; Drake & Lawson, 2014). Like the American Gardening Association (1998), we found that the gardens in our study were affiliated with nonprofits, schools, religious institutions, and public parks. The gardens also collaborated with corporations and businesses. Corporations and businesses were the second most common institutional partners for the gardens. Unlike the American Community Gardening Association (1998) study, we found that a low percentage of the gardens in our study were neighborhood gardens. We also found that People-of-Color-managed gardens had more institutional collaborators than gardens managed by Whites. Female managers operated gardens with more institutional partners than those managed by males.
Many researchers have examined whether people on food assistance programs have access to fresh, healthy, and affordable foods (Bartfeld, 2003; Berner & O’Brien, 2004; Eisinger, 2002; Guthrie, 2020; Nichols-Casebolt & Morris, 2002; Tiehen, 2020). Usually, these studies focus on access to farms, farmer’s markets, food stores, and emergency food assistance organizations. Our study is one of a few that examine the connection between community gardens and nutrition assistance programs. We found that gardens in high poverty, low income, and majority People-of-Color census tracts were more likely to cater to people on nutrition assistance programs than community gardens elsewhere. The gardens we studied served people in nutrition assistance programs.
Conclusions
Community gardens are a vital part of the food system that deserves heightened attention. The COVID-19 pandemic demonstrated the extent to which community gardens are overlooked and their critical role in individual and community food security. Most studies of community gardens focus on urban gardens in one city, but our statewide study shows the importance of examining gardens in multiple towns and rural areas.
We urge researchers to conduct more multi-location studies, allowing for a more robust examination of neighborhood or census tract influences. The two management factors studied, the race/ethnicity of managers and the sex of managers, and the three neighborhood characteristics studied—poverty levels, median household income, and the race/ethnicity of residents living in a census tract—influenced many aspects of community gardening. Continuing this line of inquiry could provide us with new insights into community gardens’ roles, functions, and effectiveness.
We conducted the study at a unique historical moment that exposed many societal vulnerabilities. Our findings demonstrate that community gardens are resilient entities that helped participants and neighborhood residents cope with a pandemic by providing spaces for organizing, production, self-care, and community building.
Footnotes
Declaration of Conflicting Interests
The authors declared no potential conflicts of interest with respect to the research, authorship, and/or publication of this article.
Funding
The authors disclosed receipt of the following financial support for the research, authorship, and/or publication of this article: The JPB Foundation, The Doris Duke Charitable Foundation, and the C. S. Mott Foundation.