
Abstract
This article returns to a classic question of political economy: the zero-sum conflict between capital and labor over the division of the national income pie. A detailed description of labor’s share of national income in 16 industrialized democracies from 1960 to 2005 uncovers two long-term trends: an increase in labor’s share in the aftermath of World War II, followed by a decrease since the early 1980s. I argue that the working class’s relative bargaining power explains the dynamics of labor’s share, and I model inter- and intra-class bargaining power in the economic, political, and global spheres. Time-series cross-section equations predicting the short- and long-term determinants of labor’s share support most of my theoretical arguments and the main findings are robust to alternative specifications. Results suggest that the common trend in the dynamics of labor’s share of national income is largely explained by indicators for working-class organizational power in the economic (i.e., unionization and strike activity) and political (i.e., government civilian spending) spheres, working-class structural power in the global sphere (i.e., southern imports and foreign direct investments), and indirectly by an indicator for working-class integration in the intra-class sphere (i.e., bargaining centralization).
This article fills a lacuna in inequality research by systematically analyzing the division of national income between the two dominant social classes—capitalists and workers. The zero-sum distribution of national income between labor’s compensation and capitalists’ profits (typically called “labor’s share of national income”), although a classic question of political economy, has largely been neglected by current research. In part, this is because economists widely regard labor’s share of national income as one of the great constants of economic development. Much like the positive class compromise argument for mutual cooperation between classes in capitalist democracies (Przeworski 1985; Przeworski and Wallerstein 1982), 1 the assumption is that, over time, workers and capitalists both benefit similarly from the fruits of economic growth and productivity gains. As I show, this idea is rather misleading because labor’s share of national income functioned as an indicator of workers’ fluctuating bargaining position during the postwar period.
Recently, labor’s share of national income has been making a comeback in economic research (Atkinson 2009). Much of this revitalization is driven by evidence from the past two decades that contradicts the usual argument that economic expansion will make most workers better off. Growth of productivity has expanded total income, but in many countries average real wages and employment are flat or falling. Income growth has occurred mainly in capitalists’ profits and at the very top of the wage distribution, sharply increasing income inequality (Piketty and Saez 2006; Wolff 2003). As a result, most developed countries have seen a large and persistent reduction in labor’s share of national income (Blanchard 1997). Nevertheless, except for a few studies, little is known about the scope of the decline in labor’s share and its timing across countries. Furthermore, we know relatively little about labor’s share during the ascendancy of social-democratic projects in the aftermath of World War II. This article fills this gap in inequality research by systematically analyzing labor’s share of national income in 16 industrialized democracies from 1960 to 2005.
Not only do we lack studies documenting the distribution of national income between workers’ compensation and capitalists’ profits, but, with a few important exceptions, there are no rigorous studies explaining the dynamics of labor’s share. Earlier studies on labor’s share focus almost exclusively on its short-term fluctuation and the business cycle, demonstrating that rapid economic growth, high rates of unemployment, and rising prices decrease labor’s share (Broddy and Crotty 1975; Glyn and Sutcliffe 1972; Raffalovich, Leicht, and Wallace 1992; Weisskopf 1979). Less research is devoted to explaining what drives longer-term trends in labor’s share. Some studies do show that workers’ collective action in the labor market (i.e., unionization and strike activity) was positively related to labor’s share of national income in the postwar United States until the late 1970s (Kalleberg, Wallace, and Raffalovich 1984; Rubin 1986; Wallace, Leicht, and Raffalovich 1999).
In this article, I develop a broad conceptualization of workers’ relative bargaining power as a function of workers’ organizational power in the economic and political spheres, their structural power in the global sphere, and their degree of centralization in the intra-class sphere. I apply this conceptualization toward an understanding of the dynamics of labor’s share of national income within 16 capitalist democracies from 1961 to 2005. By seeking an overarching pattern across countries, above and beyond national particularities, I put the argument regarding the significance of working-class bargaining power for the dynamics of labor’s share to a strong test.
In the next section, I describe the patterns of labor’s share that emerged from 1960 to 2005. I then discuss the longstanding assumption of neoclassical economic theory that labor’s share is constant and its recent reevaluation, introducing a conceptualization of the relative bargaining power of labor to explain the dynamics of labor’s share. I use this framework to understand changes in labor’s share in 16 developed countries by estimating models for the entire period of 1961 to 2005 and testing for changes in the coefficients over time. I go on to test the robustness of the results by examining their sensitivity to information from individual countries, the inclusion of top earners with the working class, analyzing a directly observed comparable measure of technological change across countries, and different specifications of productivity.
Labor’s Share of National Income in Capitalist Democracies, 1960 to 2005
By way of introducing the dataset for the dependent variable, Figure 1 presents plots of the trends in labor’s share of national income for the 16 capitalist democracies for which data are available. Labor’s share is measured by labor’s compensation (i.e., wages, salaries, and fringe benefits) as a percentage of Gross Domestic Product.
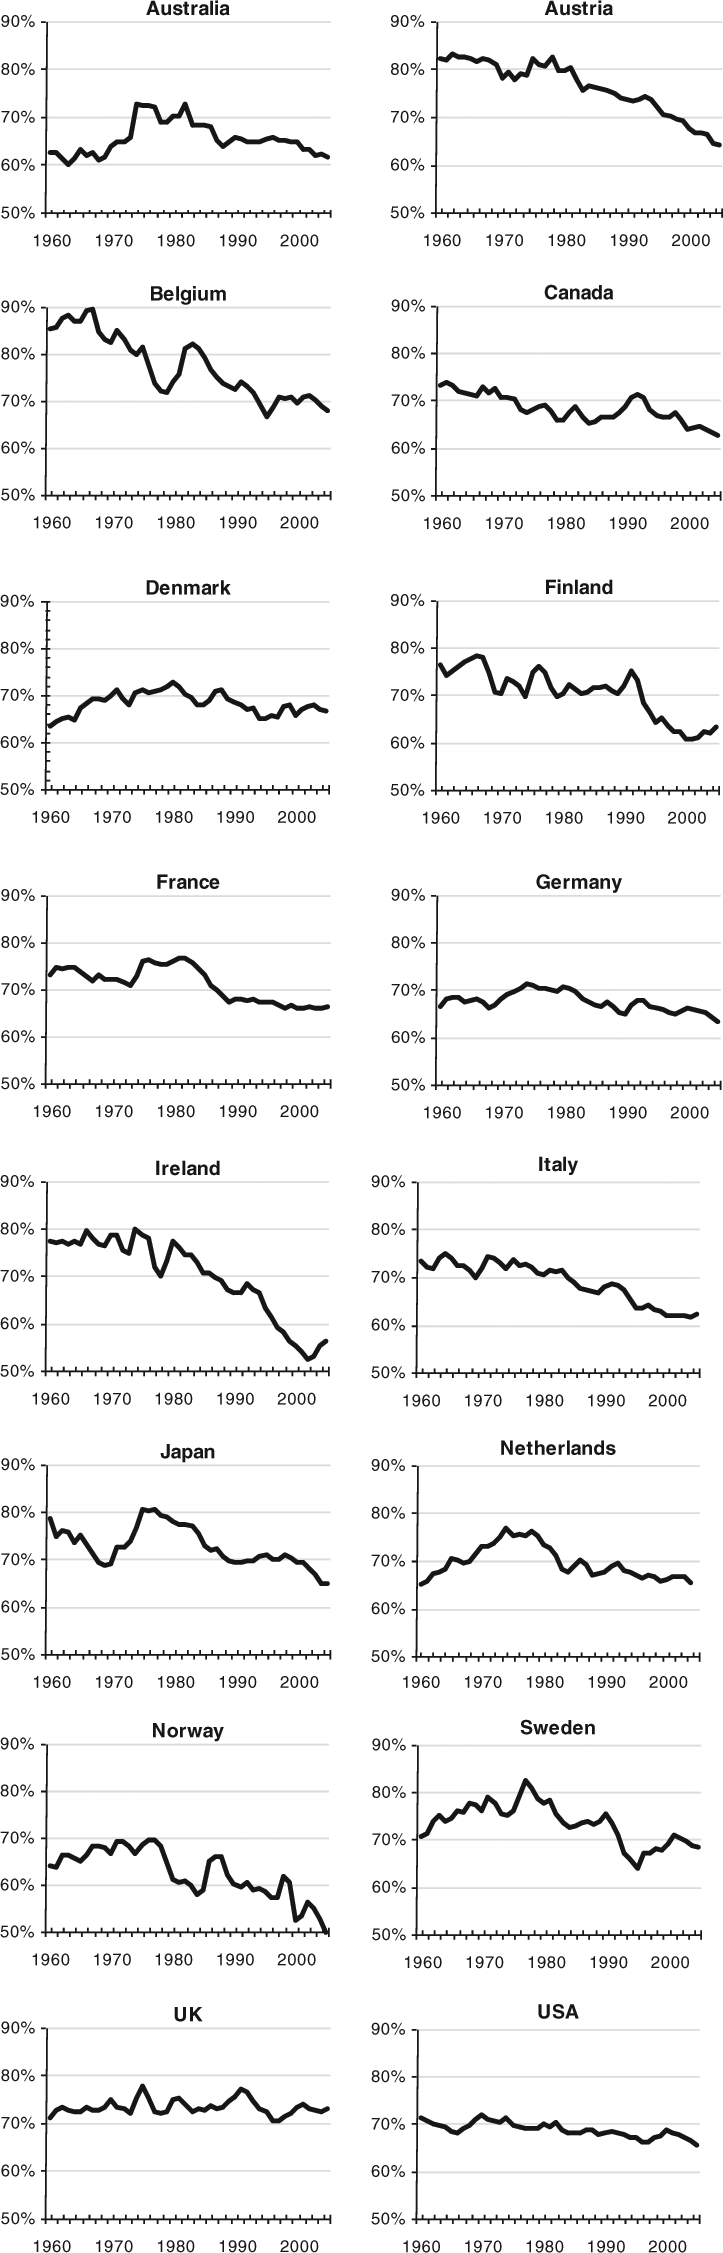
Labor’s Share of National Income in 16 OECD Countries, 1960 to 2005
The figure clearly shows that labor’s share of national income has decreased since the early 1980s in the Anglo-Saxon countries, Continental Europe, and even Scandinavia, although the scope and timing of the decline differs across countries. On average, labor’s share declined by almost 9 percentage points since the early 1980s, from 73 percent in 1980 to 64 percent in 2005. In contrast to the recent downward trend, the first half of the twentieth century saw an increase in labor’s share: the United Kingdom experienced a distinct upward trend, from 56 percent in 1913 to 72 percent in 1964 (Matthews, Feinstein, and Odling-Smee 1982), and the United States also saw labor’s share of national income increase by 5 percentage points from the end of World War II until the late 1960s (Krueger 1999). Systematic data on labor’s share for the period before 1960 in other developed countries are not readily available, but Figure 1 shows that the increase in labor’s share in the postwar period is not unique to the United Kingdom and the United States. Labor’s share increased in most countries in the 1960s and 1970s. In Denmark, Finland, the Netherlands, Norway, and Sweden, labor’s share increased by 4 to 6 percentage points during the 1960s; during the 1970s, labor’s share increased in Australia, France, Germany, and Japan. 2
To explain what is behind the upward and downward trends in labor’s share, Figure 2 presents countries’ annual growth in real earnings and fringe benefits per employee and productivity growth. The rationale is that growth in productivity will increase national income; the question, though, is how much of that growth translates into wages and fringe benefits. Clearly, the upward trend in labor’s share during the 1960s and 1970s, when most workers’ real wages and fringe benefits generally increased, was due to a more rapid rise in labor’s compensation relative to productivity. Contrary to the common economic assumption that compensation tracks productivity, real earnings and fringe benefits have increased more slowly than productivity in all countries during the past two decades. This is partly because less skilled workers are increasingly restricted to precarious low-wage jobs (Handel and Gittleman 2004; Kalleberg 2009) in which compensation growth is much slower than productivity growth (Sakamoto and Kim 2010). Because productivity growth expands total income, slow income growth for workers implies faster income growth for capital.
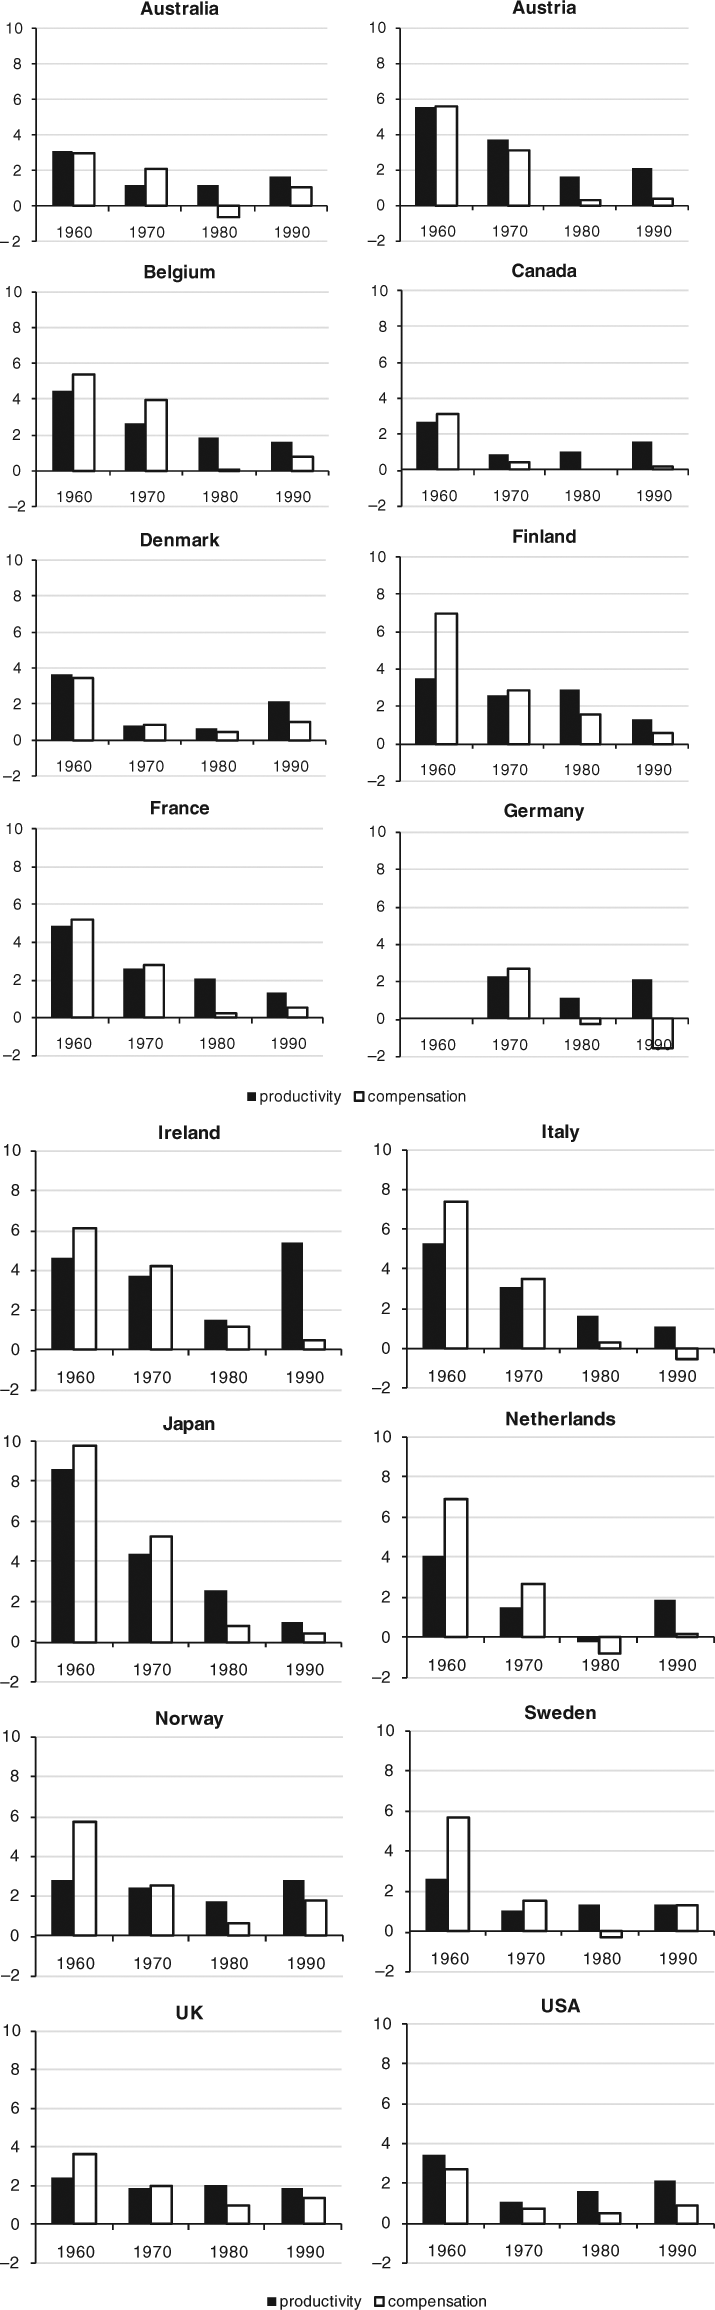
Annual Percentage Growth in Productivity and Compensation in 16 OECD Countries by Decade
These upward and downward trends indicate that although income inequality among workers and labor’s share of national income are related, they are not identical and are even, at times, negatively correlated. For example, when earnings inequality showed little change during the 1960s and 1970s, labor’s share of national income increased in most countries. Arguably, there are distinctive mechanisms through which labor’s share, but not necessarily income inequality, is linked to workers’ bargaining power. While it is evident that labor unions and a large public sector increase income and earnings equality (Card 2001; Lee 2005; Moller, Nielsen, and Alderson 2009), it is not clear that they do so at employers’ expense. Pressures of international competition also had a significant impact on rising income inequality among workers (Alderson and Nielsen 2002; Beckfield 2006), but its overall effect on labor’s share may be zero. It may be the case that as the demand for skilled labor relative to unskilled labor increased, and the returns to each diverged, aggregate labor’s compensation increased rapidly, at a pace similar to economic growth.
The general conclusion from the available evidence is that there is no real long-term stability in labor’s share during the postwar period. I document two common long-term trends in rich countries since the end of World War II: an increase in labor’s share during the 1960s and 1970s (or earlier), followed by a decrease since the early 1980s. Figure 3 presents these two general trends with box plots of the yearly spread of labor’s share in 16 developed countries from 1960 to 2005.
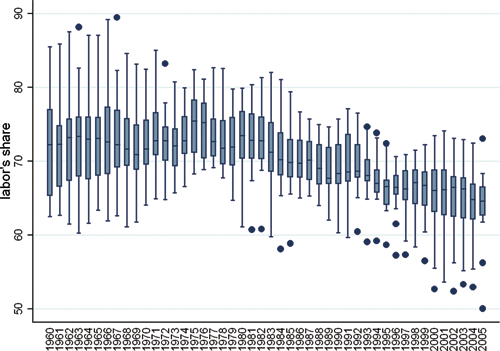
Box Plots of Labor’s Share of National Income, 16 OECD Countries, 1960 to 2005
Factors of Production
The fact that economic research neglects labor’s share of national income reflects what has long been regarded as a “stylized fact”of economic growth—the constancy of labor’s share (Kaldor 1961). 3 Keynes (1939:48), for example, wrote that “the stability [italics mine] of the proportion of the national dividend [income] accruing to labor . . . is one of the most surprising, yet best-established, facts in the whole range of economic statistics.” The constancy of labor’s share is derived by adopting a standard neoclassical Cobb-Douglas aggregate production function that assumes labor and capital are paid their marginal productivity, labor and capital are neither substitutes nor complementary factors in the production process, and factors’ shares are determined entirely by production technology, which increases the marginal product of capital and labor by the same amount. By implication, workers and capitalists should benefit similarly from technological progress.
Recently, this “stylized fact” has turned out not to be true for many developed countries. Two explanations for the decline in labor’s share since the early 1980s have been advanced. The first line of reasoning relaxes the Cobb-Douglas production function assumptions by suggesting that the increase in wages in the late 1960s and early 1970s led to capital-biased technological change (hereafter CBTC), which benefits capital productivity more than labor (Acemoglu 2002, 2003; Blanchard 1997). That is, the increase in wages not only led firms to move to technologies using less labor and more capital, but it may have prompted firms to develop new labor-saving technologies to avoid high labor costs and to better utilize capital assets. Once this technical change takes place, firms gradually reduce their labor demands. According to the CBTC hypothesis, the rise in labor productivity since the late 1970s should be negatively associated with labor’s share, due to a larger increase in capital productivity; during earlier years, productivity growth should have been positively associated with labor’s share. Supporting the first part of this hypothesis, Bentolila and Saint-Paul (2003) find a negative effect for total factor productivity on labor’s share in industry data for 12 OECD countries from 1972 to 1993. While it seems likely that technological changes had some effect on labor’s share, the CBTC hypothesis, by itself, cannot explain the current decline in labor’s share. The main problem for the CBTC hypothesis is that computer and information technologies have advanced steadily since the early 1980s, despite wage moderation during the 1980s and 1990s. CBTC also fails to explain why countries that are relatively similar from a technological point of view differ in the scope of the decline.
Alternatively, Blanchard and Giavazzi (2003) argue that the explanation for the decline in labor’s share lies in workers’ bargaining power. Assuming that wages not only reflect marginal productivity but are also determined by bargaining in the labor market, Blanchard and Giavazzi’s model suggests that, starting in the mid-1980s, a decrease in unionization led to a reduction in real wages at a given level of employment, and, by implication, a reduction in labor’s share of national income. While this hypothesis seems to fit well with the declining trend in unionization and labor’s share, this relation has not been tested empirically. Moreover, by focusing solely on workers’ bargaining power in the labor market, Blanchard and Giavazzi overlook much of the historical sequence of labor movements in developed countries, such as labor-affiliated political parties and expansion of the welfare state, as well as the global context of workers’ bargaining power. I therefore suggest a broader conceptualization of labor’s relative bargaining power in explaining the dynamics of labor’s share of national income.
Workers’ Bargaining Power
Figure 4 presents a conceptual diagram of the causal pathways between indicators for workers’ bargaining power and labor’s share of national income. The theoretical model is guided by the general hypothesis that, controlling for macroeconomic variables, variation in workers’ bargaining power explains the dynamics of labor’s share in capitalist democracies. I expect workers’ bargaining power to influence labor’s share through three principal pathways: employment, compensation, and the economy’s income. All else being constant, an increase in employment and in compensation rates (i.e., the numerator of labor’s share) increases labor’s share, while an increase in product growth (i.e., the denominator of labor’s share) decreases labor’s share.
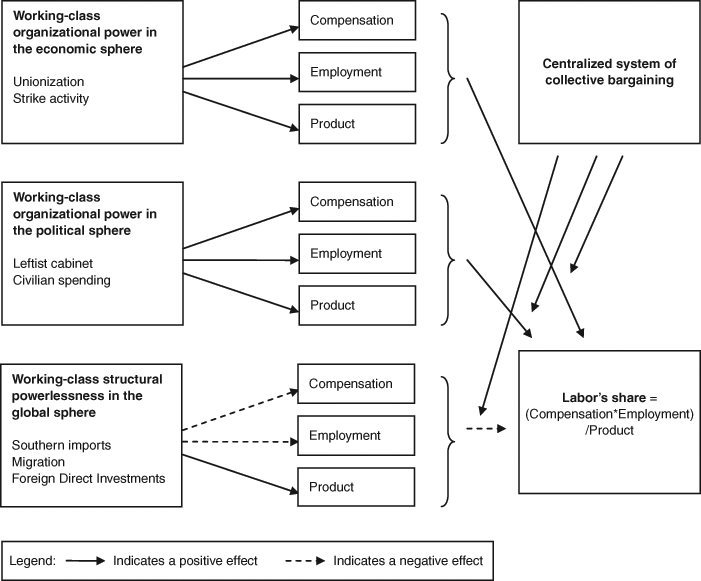
Hypotheses Regarding the Effects of Working-Class Bargaining Power on Labor’s Share of National Income
Working-Class Organizational Power in the Economic Sphere
In general, sociologists have been silent on the current redistribution of income from labor to capital, but a few studies argue for the significance of workers’ collective action in the labor market to explain the upward trend in U.S. labor’s share. Conventional wisdom holds that labor can enhance its share of income through two forms of collective action—union organization and strike activity—mainly by increasing levels of employment and compensation while decreasing firms’ profits (Kalleberg et al. 1984; Rubin 1986; Wallace et al. 1999). Due to the inverse relationship between workers’ organizational power in the labor market and capitalists’ profits, changes in unionization and strike activity may explain the upward trend in labor’s share during the 1960s and 1970s, and its downward trend since the early 1980s. Although national labor movements have experienced vastly different trajectories in the postwar period, labor commonly held a strong position relative to capital in the two decades after World War II. In the capitalist democracies of Europe, North America, and the Pacific region, unions organized between one and two thirds of all workers (Western 1997). Labor’s robust position was characterized by militant demands for better wages and working conditions (Shalev 1992). However, labor organizations lost power in nearly all industrial economies in the 1980s, and the decline continued during the 1990s. Unionization rates also fell during this period (Ebbinghaus and Visser 1999; Western 1997). With labor’s organizational base crumbling, the power of the strike to boost average employee wages was severely weakened (Rosenfeld 2006), and labor militancy fell sharply over the past two decades (Piazza 2005).
This conventional wisdom is challenged, however, by evidence of wage restraint (Layard, Nickell, and Jackman 1991) and high rates of productivity (Hicks and Kenworthy 1998) in countries with high levels of unionization. Strong unions might not only be good for workers, they might, as Wright (2000) claims, be even better for employers. Labor union power adversely affects capitalists’ material interests only up to a certain point. Once workers’ organizational power crosses a certain threshold, labor unions begin to have a positive effect on capitalists’ profits, primarily by imposing wage restraint while providing significant gains in productivity due to high levels of cooperation between workers and capitalists. Applying Wright’s argument to labor’s share of national income, we would expect very high levels of unionization to have a zero or even negative effect on labor’s share if strong unions promote faster economic growth than growth in real wages and fringe benefits.
Working-Class Organizational Power in the Political Sphere
Previous research, mainly on the U.S. economy, focuses almost exclusively on how workers’ collective action in the economic sphere generates distributional inequalities, neglecting how collective action in the political sphere affects labor’s share. In fact, one may assume that labor has greater relative power vis-à-vis capital in the political than in the economic sphere. Wage-earners who are disadvantaged in the economic sphere, where they are subordinated to their employers, can combine to take collective action in the political sphere. According to power resources theory, workers’ organization in social-democratic parties, often with the support of unions and allied leftist parties, results in a shift in the relative bargaining power of capital versus labor, with a strengthening of labor’s position (Esping-Andersen 1985; Hicks 1999; Korpi 1983; Stephens 1979). Previous studies demonstrate that social-democratic parties use their cumulative power to redistribute income among workers through progressive taxes and social transfer payments (Brady 2003; Moller et al. 2003). In addition, I argue that these parties redistribute income from capital to labor through workplace regulations and relative protection from market forces.
Political parties affiliated with the working class should support redistribution of the national income pie in favor of labor. Labor governments’ promotion of legislation on issues such as unemployment insurance and the minimum wage, as well as their promotion of a favorable political climate for organized labor, can be seen as an attempt to reduce inequalities inherent in employment relations. In the U.S. context, to take one important example, changes in political affiliation during the Reagan administration arguably had a key influence on labor’s relative bargaining power: Republican opposition to organized labor hit its stride in the summer of 1981, when Reagan dismissed striking air-traffic controllers and replaced them with non-union employees. I expect leftist governments, which draw their political power base from the working class and tend to support policies that increase earnings and employment, to be positively related to labor’s share of national income.
In addition to labor-affiliated governments, free or subsidized provision of public services and goods, such as education and health care, amplifies the size of the public sector and should increase labor’s share of national income by increasing levels of compensation and employment (especially for women). Public employment facilitates women’s entry into the labor force by offering a large supply of care and service jobs along with convenient working conditions (Esping-Andersen 1990). Public-sector workers also earn more, on average, than do workers in the private sector, and most earnings advantages are concentrated at the low end of the earnings distribution (Bender 1998; Gornick and Jacobs 1998). In the United States, Devine (1983) found that the level of social spending, which includes public social services and transfer payments, had a positive effect on the labor-capital income ratio between 1949 and 1976. Yet the two components of social spending—public social services and transfer payments—do not necessarily affect labor’s share in a similar way. Although social transfer payments, which are particularly generous in social- and Christian-democratic regimes, redistribute income among workers (Moller et al. 2003), they are much less likely to redistribute income from capital to labor because they have only a minor effect on workers’ employment and compensation.
The explanation for the long-term trends in labor’s share of national income may thus also lie in the political sphere. In the aftermath of World War II, formerly weak leftist political parties and their allies, the trade unions, greatly increased their political strength. For the first time in history, leftist political parties were either government parties or major opposition parties in most of the capitalist democracies (Piven 1991). In the 1980s, however, the social-democratic model came under severe attack in France, Germany, the Netherlands, Belgium, and Britain, and by the 1990s it was being challenged even in the Nordic countries. Labor parties lost power (Piven 1991; Pontusson 1995), and those that retained power were unable to support their traditional working-class constituencies through social welfare and full employment policies (Korpi and Palme 2003).
Working-Class Structural Power in the Global Sphere
The final component of workers’ inter-class bargaining power is more global. During the past three decades, advanced economies have increasingly integrated into international markets for goods, capital, and labor. This globalization, in particular the entry of less-developed countries into the world market, should have undermined workers’ structural power in the economic system and exerted a downward pressure on the least skilled workers’ wages and employment in developed countries. Because the vast literature documenting gains from globalization suggests a positive effect on an economy’s income (Haskel, Pereira, and Slaughter 2007), if average earnings do not track economic growth, the decline in labor’s share due to globalization may be substantial.
First, globalization may raise profits relative to wages by increasing manufactured imports from developing countries (e.g., China, India, and the Eastern bloc) to developed countries (i.e., southern imports). Importing goods from less-developed countries reduces firms’ costs and places workers in industrialized countries in direct competition with lower-paid workers in developing countries. This competition curbs the bargaining power of workers in rich countries. As a result, southern imports bring down the wages of the least skilled workers in developed countries, increase unemployment (Wood 1994), and most likely decrease labor’s share of the national income.
A second feature of globalization is the rising flow of migrant workers from low-income to high-income countries. In 2000, nearly 9 percent of the workforce in advanced countries was foreign-born, while the top dispatchers of migrants were all low-income countries—China, India, and the Philippines (Freeman 2006). Growth in the global labor supply, in particular the influx of low-skilled migrants, is expected to depress wages by threatening or displacing native workers. Indeed, most empirical studies find a negative effect of immigration on less skilled native-born workers’ wages and employment, although this effect is relatively small (Freeman 2006). I therefore expect a greater rate of immigration will decrease labor’s share of the national income.
The final component of the globalization triad is increased capital mobility, that is, more outflow and inflow of foreign direct investments (FDI). One consequence of the rise in FDI is that an increasing share of countries’ output is accounted for by foreign affiliates of multinational firms. Research finds that direct investments in multinational firms weaken labor’s bargaining position and exert a downward pressure on the wages of (typically) organized, middle-income workers (Brady and Wallace 2000). This is mainly due to foreign-affiliated firms’ opposition to unionism (Milkman 1992) and their heavy reliance on flexible employment to reduce production costs (Budros 1997). Multinational firms are also associated with national, cultural, and linguistic divisions among co-workers that obscure the bases for collective action (Brady and Wallace 2000). Although multinational firms contribute to an increase in the wages of higher-income workers (Huttunen 2007), the negative effect of direct investments on aggregate compensation is most likely higher than its positive effect.
Working-Class Bargaining Power and Workers’ Integration in the Intra-Class Sphere
Intra-class conflict among workers over the definition and organization of their common interests is the fourth sphere relevant to a better understanding of labor’s share of national income. Ever since Marx ([1847] 1963), scholars have suggested that workers’ success in extracting economic rewards from employers depends, in part, on their collective ability to reduce intra-class competition. In applying Marx’s long-standing argument, workers’ intra-class competition is best conceptualized in terms of the level at which collective bargaining is conducted.
In general, the continuum ranges from a highly centralized corporatist system, where wage agreements cover the entire, or almost the entire, workforce, to a highly decentralized system where many local unions sign numerous collective agreements that cover workers in specific firms or occupations within firms. In a centralized system, wage agreements should promote the wide interests of all workers and thus overcome internal competition. Centralization therefore empowers low-skilled workers and increases organized workers’ overall capacity to bargain for better wages and employment. By contrast, wage agreements signed by narrowly based unions boost antagonistic interests among workers. With decentralized bargaining, fewer workers are covered by collective agreements and more of these workers are low-skilled and employed in various nonstandard employment relations. In a decentralized system, organized workers’ capacity to redistribute income in favor of labor is thus undermined.
Consequently, decentralization not only raises wage inequality among workers (Hicks and Kenworthy 1998; Kristal and Cohen 2007; Wallerstein 1999), but it also undermines the effectiveness of workers’ organizational power in advancing labor’s share of national income. Decentralization should also increase workers’ vulnerability—especially workers employed in the periphery of the labor market—to the entry of manufacturing goods and migrant workers from less-developed countries. Decentralization likely occurred throughout the 1980s and 1990s across developed countries, even where formal measures of centralized bargaining show little change. During this period, firm-level bargaining flourished alongside centralized wage talks across Europe (Freeman and Gibbons 1994; Katz 1993). 4 Growth of firm-level bargaining since the 1980s suggests that intra-class competition among organized workers has intensified. I therefore expect that the positive effect of workers’ organizational power on labor’s share has declined in the past two decades while there is a larger negative effect for workers’ structural powerlessness in the global sphere.
Data
The sample includes 16 industrialized democracies (Australia, Austria, Belgium, Canada, Denmark, Finland, France, [West] Germany, Ireland, Italy, Japan, the Netherlands, Norway, Sweden, the United Kingdom, and the United States). To test the theoretical model, I use time-series cross-sectional (TSCS) data, that is, yearly observations for each country throughout almost the entire 46-year period (1960 to 2005). There are 702 country-year observations; using first differences decreases the number of observations for each country by one year. In addition, data on productivity for Germany are available only since 1971, there is a discontinuity in strike data for France since 2002, and there is an absence of comparable data on migration rates for the United Kingdom for 2003 to 2005. Table 1 shows definitions, data sources, and averages by country for the variables used in the analyses.
Country Averages of Relevant Variables
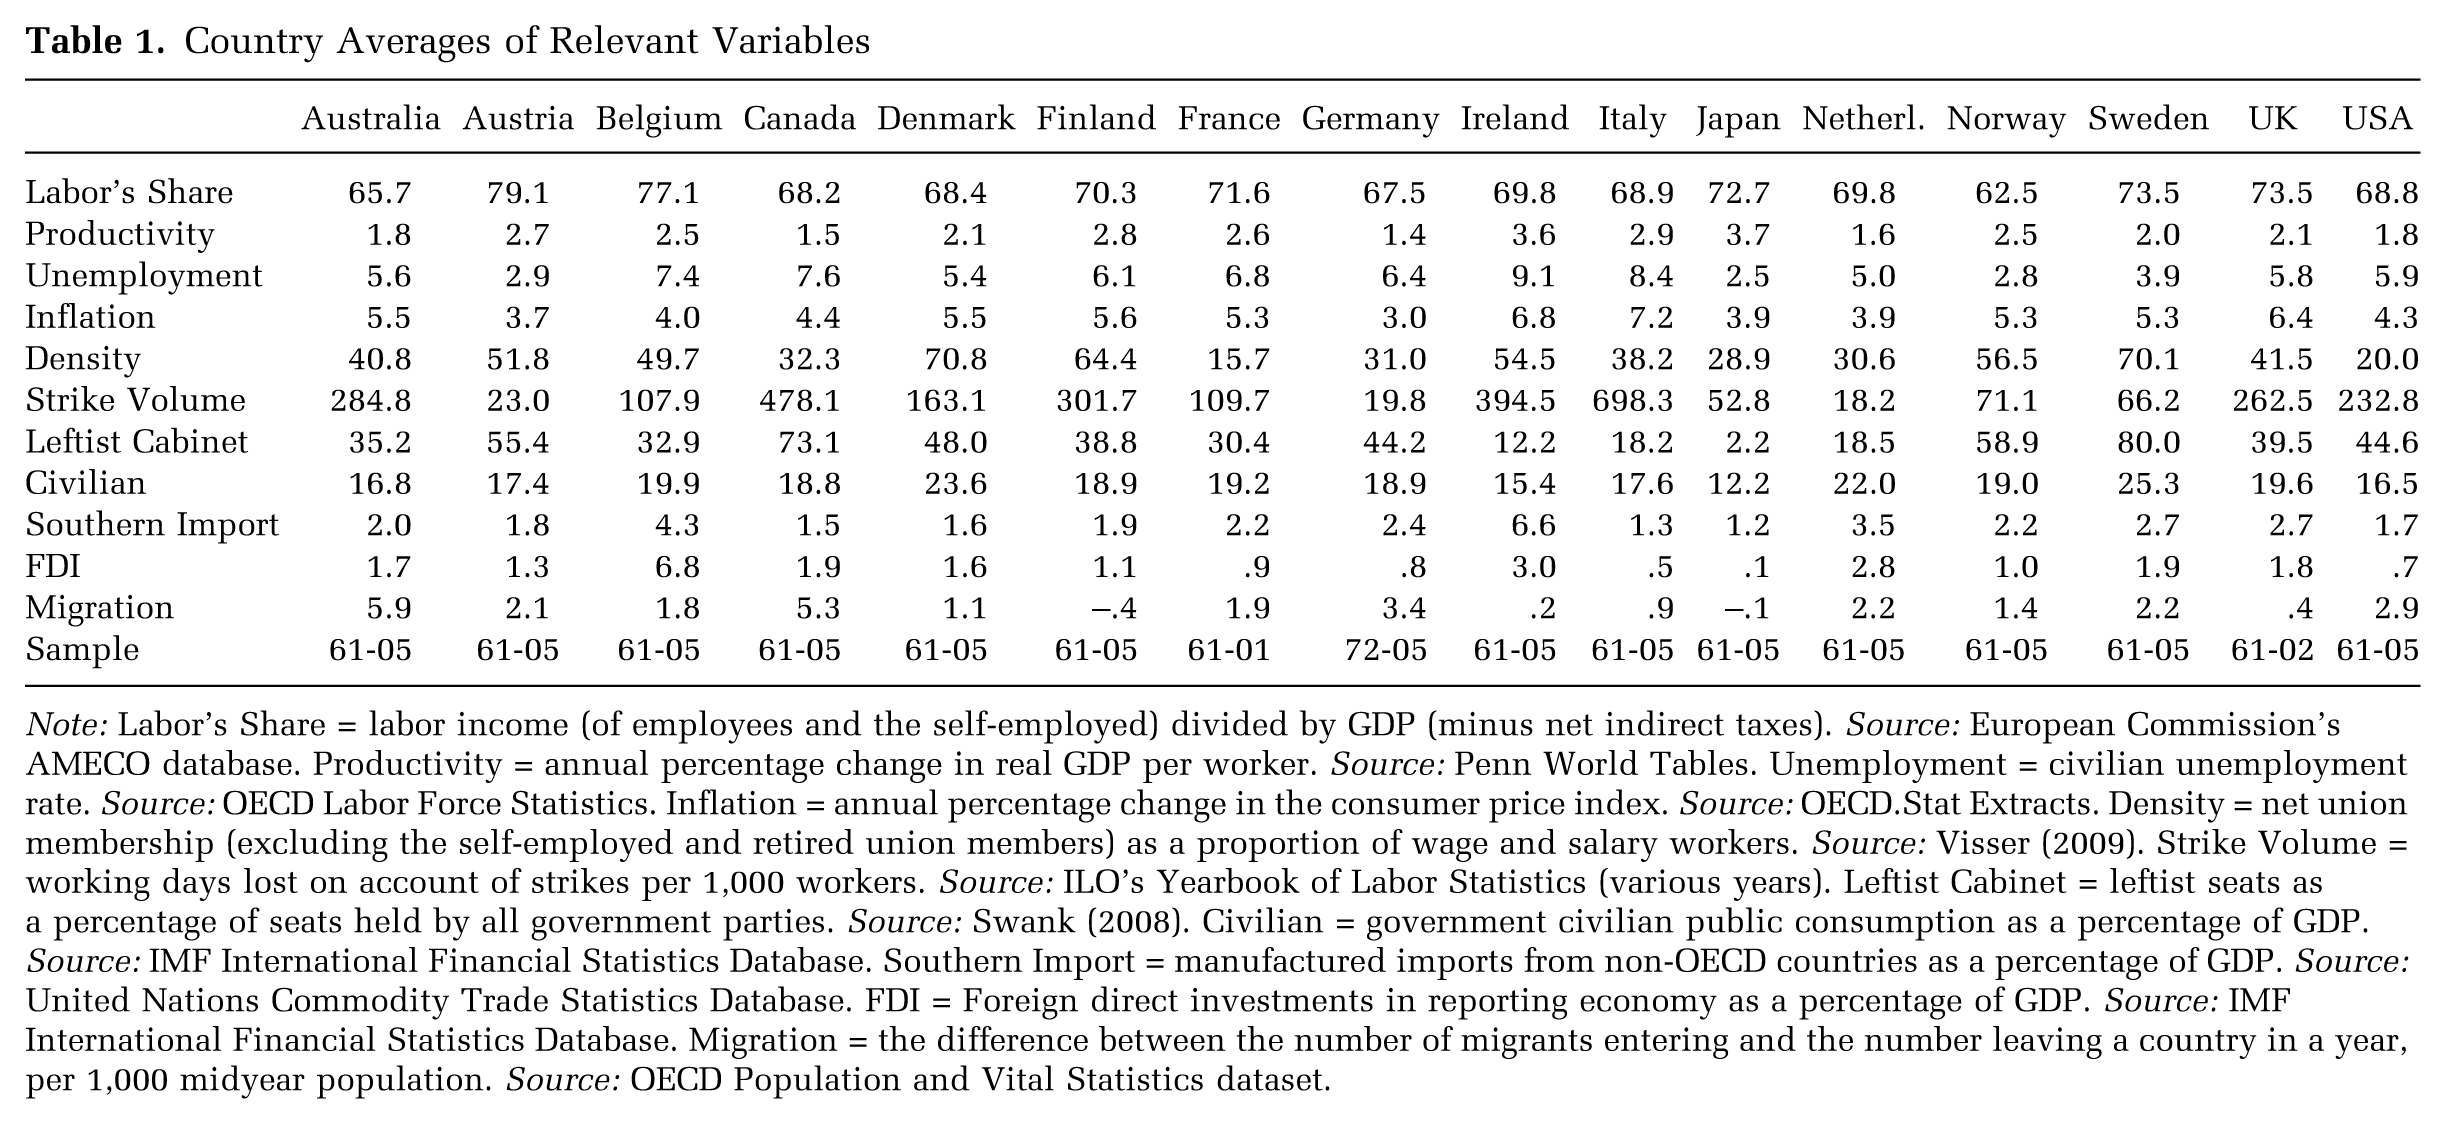
Note: Labor’s Share = labor income (of employees and the self-employed) divided by GDP (minus net indirect taxes). Source: European Commission’s AMECO database. Productivity = annual percentage change in real GDP per worker. Source: Penn World Tables. Unemployment = civilian unemployment rate. Source: OECD Labor Force Statistics. Inflation = annual percentage change in the consumer price index. Source: OECD.Stat Extracts. Density = net union membership (excluding the self-employed and retired union members) as a proportion of wage and salary workers. Source: Visser (2009). Strike Volume = working days lost on account of strikes per 1,000 workers. Source: ILO’s Yearbook of Labor Statistics (various years). Leftist Cabinet = leftist seats as a percentage of seats held by all government parties. Source: Swank (2008). Civilian = government civilian public consumption as a percentage of GDP. Source: IMF International Financial Statistics Database. Southern Import = manufactured imports from non-OECD countries as a percentage of GDP. Source: United Nations Commodity Trade Statistics Database. FDI = Foreign direct investments in reporting economy as a percentage of GDP. Source: IMF International Financial Statistics Database. Migration = the difference between the number of migrants entering and the number leaving a country in a year, per 1,000 midyear population. Source: OECD Population and Vital Statistics dataset.
The dependent variable is labor’s share of national income. I follow previous studies and measure labor’s share as the percentage of Gross Domestic Product (minus net indirect taxes) that compensates labor. Recent studies argue that a measure of labor’s share including only employees’ compensation on the labor side is biased over time because it does not take into account the move from self-employment to wage and salary employment (Gollin 2002; Krueger 1999). In this study, the numerator of labor’s share is labor income (of employees and the self-employed), including wages, salaries, and fringe benefits, and GDP is the denominator. I estimate the “labor portion” of self-employed income by multiplying the number of nonemployees by the average compensation per employee. 5 According to national accounts definitions, GDP is the sum of labor income and capitalists’ profits (i.e., firms’ profits and income from dividends, interest, and rent). 6 Thus, if labor’s share of national income rises (or declines) by a certain amount, capital’s share must decline (or rise) by the same amount. Realized capital gains through the exercise of stock options and other assets, which became key components of top executive remuneration in the 1990s (Piketty and Saez 2006), are generally not counted in the national income accounts and therefore are not part of either labor’s compensation or capitalists’ profits.
I measure union density as the percentage of wage and salary workers that are union members (excluding the self-employed and retired union members). For theoretical and pragmatic reasons, in this analysis the principal measure for strike activity is strike volume, which is calculated as the number of days lost to strikes and lockouts relative to the total number of wage and salary workers in each year. This measure represents the total economic damage inflicted on employers due to strikes, as well as the economic costs incurred by workers who engage in strikes. 7
For workers’ organizational power in the political sphere, I draw directly on data collected and coded by Swank (2008). The best indicator available for labor-affiliated government is leftist cabinet, defined as leftist seats as a percentage of seats held by all government parties. According to this definition, leftist cabinet is scored 100 for each year the left is in government alone and as a fraction of the left’s seats in parliament when the left is in a coalition government. I treat the U.S. Democratic Party and the Canadian Liberal Party as leftist parties, given their pro-labor orientations in their specific national contexts. 8 I calculate government civilian spending as a percentage of GDP; it includes expenditures on direct social services like education and health care and is an approximation of the size of the public sector. Social security spending is not part of this value.
I measure southern import as manufactured imports from non-OECD countries as a percentage of GDP. Manufactured imports are defined as Standard International Trade Classification (SITC) groups 5, 6, 7, and 8. Because data are available only since 1962, and for a few countries only from 1963, I impute missing data points using linear interpolation according to the average annual change in the following five years. I calculate net migration rate by the number of immigrants minus the number of emigrants as a percentage of a country’s total population. This measure aims to capture the effect of increased movement of migrant workers from low-income to high-income countries. For international capital mobility, I use foreign direct investment inflows as a percentage of GDP.
All models control for macroeconomic variables, including productivity growth, which captures effects of periodic expansion and contraction of output and longer-term trends in economic growth. Studies often use productivity growth as a proxy for the significance of technological change to determine changes in labor’s share of national income.
Method
For theoretical and methodological reasons, I analyze the determinants of labor’s share of national income in time-series cross-sections dynamic specification (a lagged dependent variable is included among the predictors) by fixed-effects estimators (Beck 2001; Kittel and Winner 2005). Fixed-effects estimators, which exploit within-country variation as a means of purging unit heterogeneity, make it possible to obtain unbiased and consistent estimates of parameters when country effects are arbitrarily correlated with measured explanatory variables (Halaby 2004). By applying fixed-effects estimators, I can explain variation in labor’s share over time within countries but not differences in levels between countries.
To remove potential spurious relations between the variables due to a time trend, and to estimate the differing long- and short-term contributions to labor’s share, I use single-equation error correction models (ECMs). Although ECMs are not limited to analyses in which cointegration is a problem, I should note that such models offer methodological advantages when, as is the case here, the possibility of unit root problems cannot be rejected. 9 Recent research demonstrates the utility of ECMs, which include separate parameters for contemporaneous effects and long-term equilibrium effects, in analyzing dynamic processes (De Boef and Keele 2008). Estimating both short- and long-term effects is of particular importance for this study. I argue that increasing manufactured imports from developing countries, for example, will not only bring down current wages and employment for the least skilled workers in developed countries (i.e., the short-term effect), but it will also affect labor’s compensation in the following years (i.e., the long-term effect) as firms invest abroad in search of lower labor costs. Unionization and strikes should also increase wages and benefits in both the short and the long term because collective wage agreements are usually signed for a period of a few years. I therefore specify the TSCS variant of the single-equation error correction model for the dynamic relationships:
In this model, current changes in labor’s share of national income (measured in first difference, Y t –Y t−1) are a function of both short-term changes (i.e., first differences) in the independent variables and their long-term levels. Specifically, β1 captures any short-term effects on labor’s share, while β3 captures long-term effects. The long-term effect occurs at a rate dictated by the value of β2 that captures the rate of return to equilibrium. I estimate this model using OLS with panel-corrected standard errors (Beck and Katz 1995), which mitigate within-group heteroskedasticity and contemporaneous correlation of errors. The estimations are also adjusted for panel-specific patterns of autocorrelation. I use country dummy variables and time dummies to control for country-specific and time-specific fixed effects.
Results
Basic Regressions
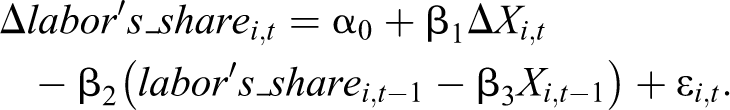
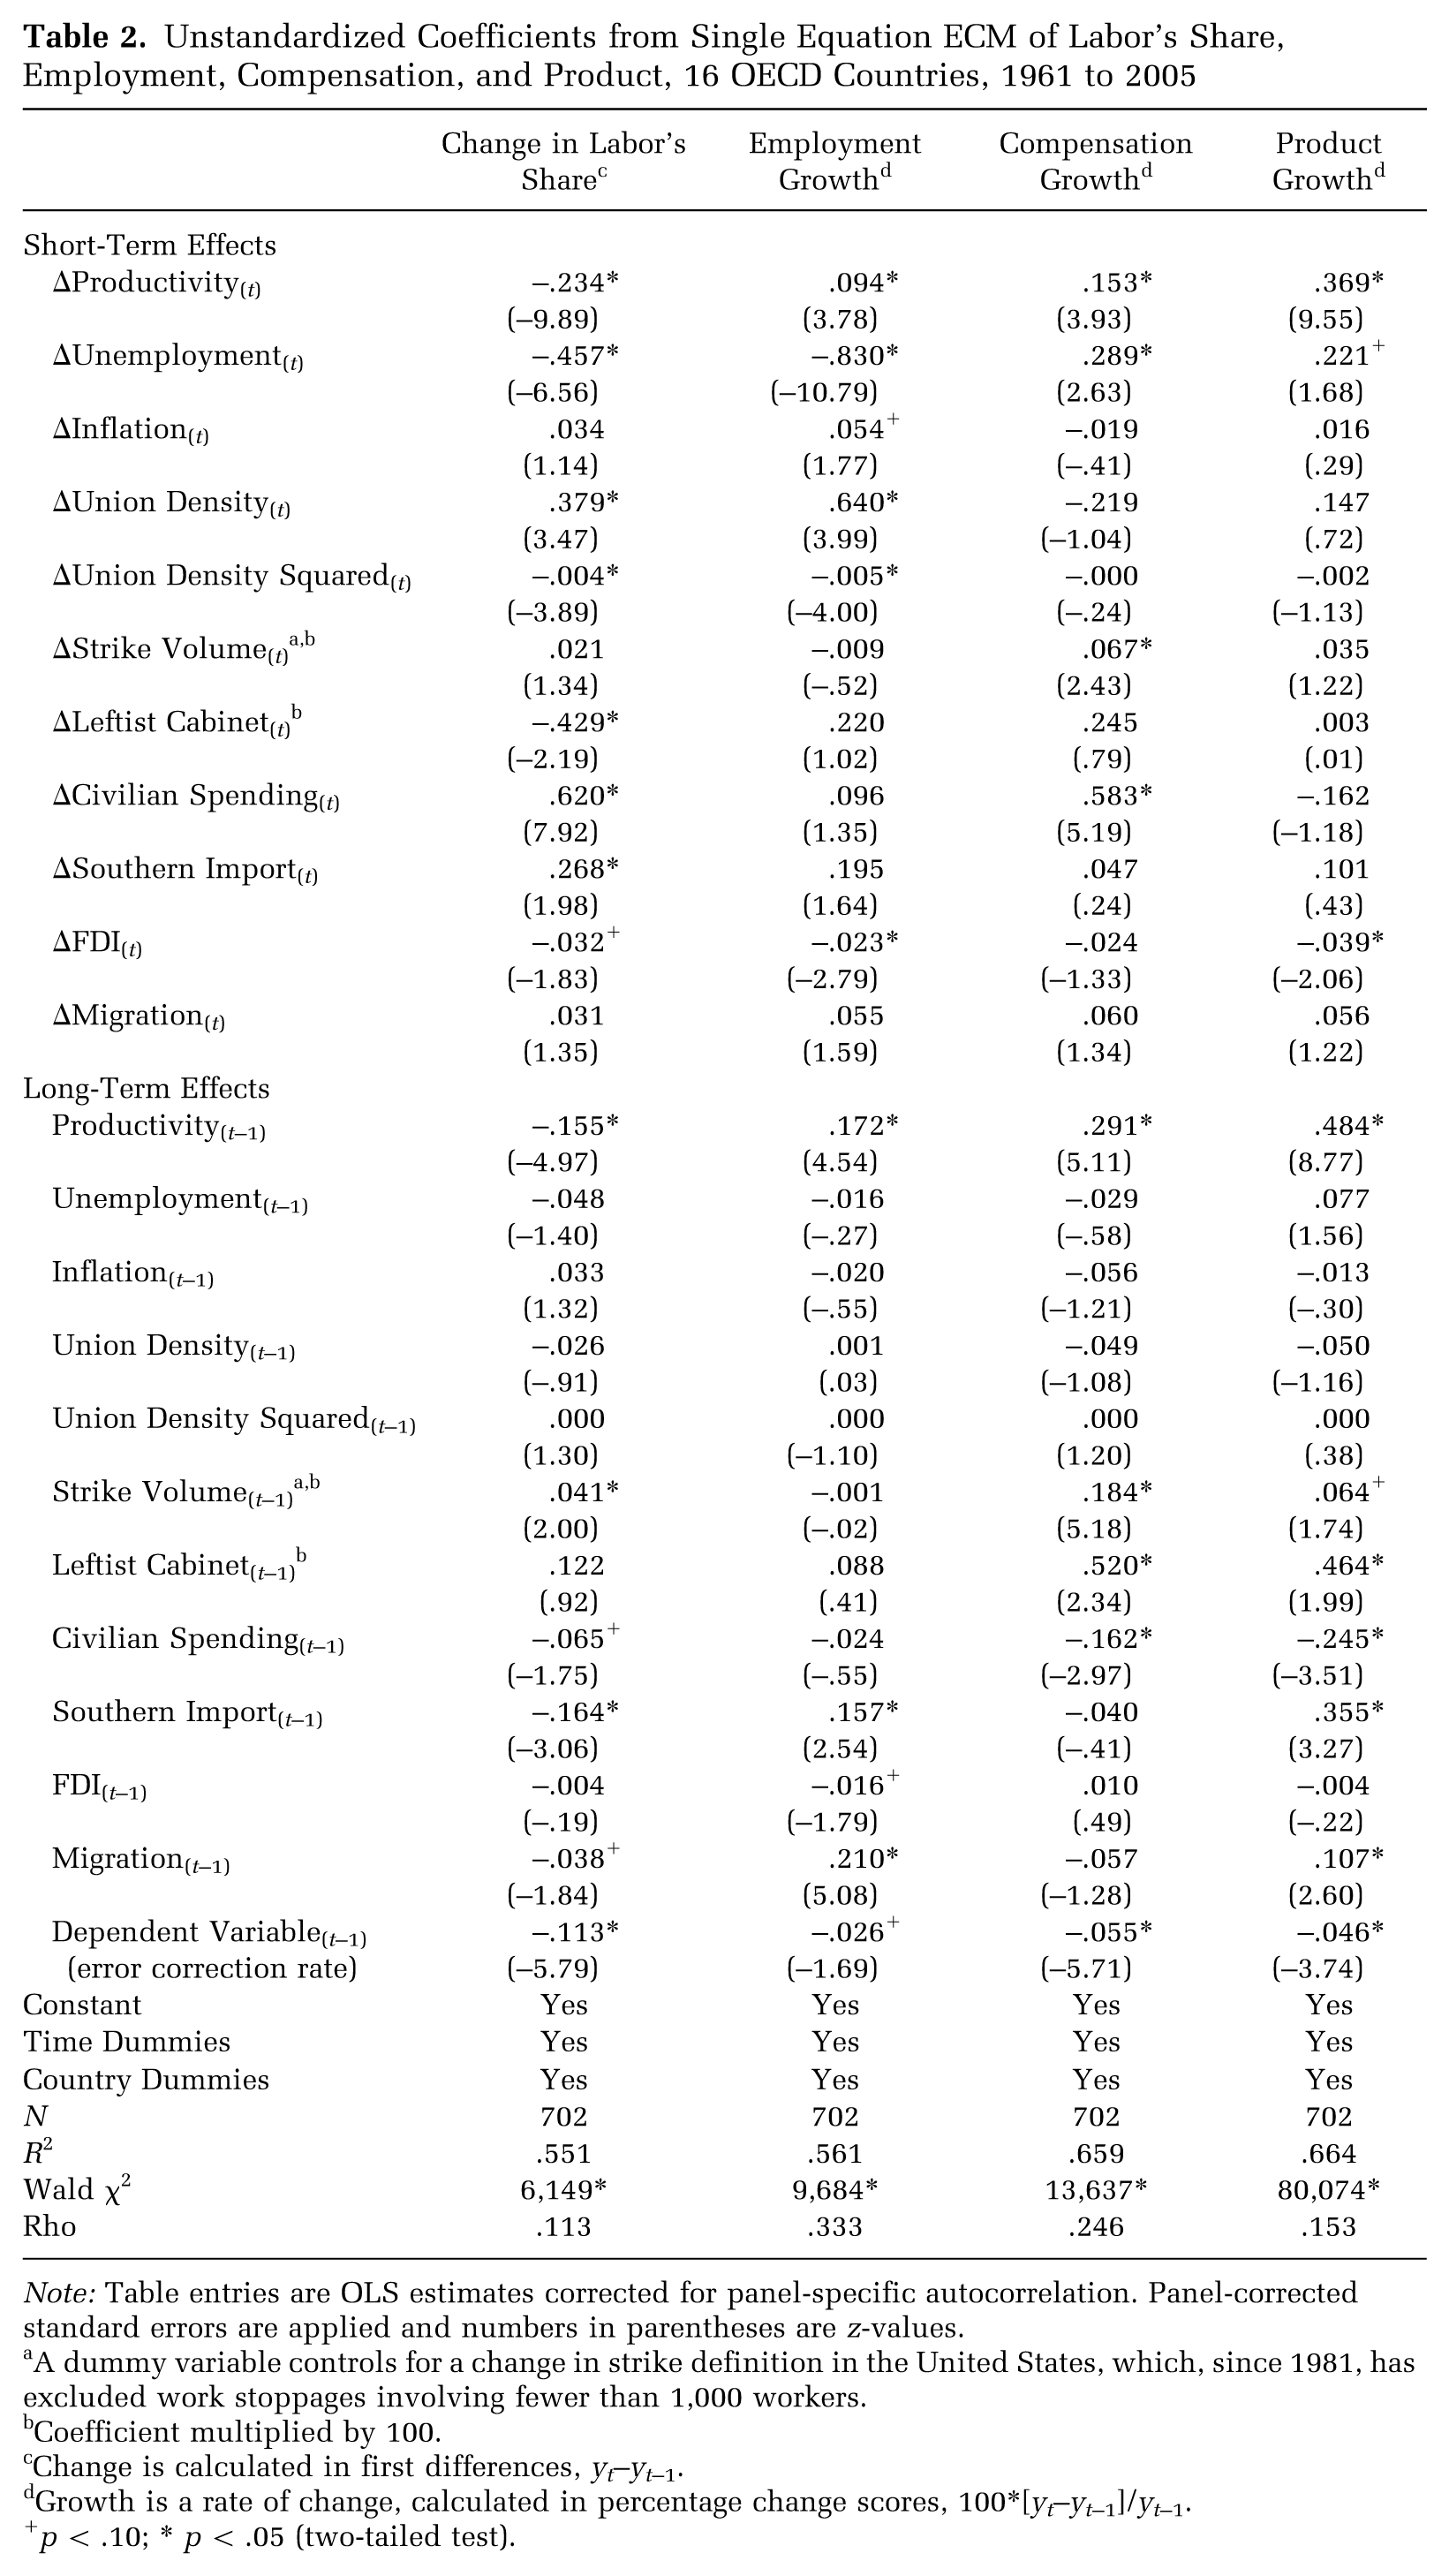
Using the methods described in the preceding section, I estimate a basic error correction model in column 1 of Table 2. I model the change in labor’s share of national income as a function of short-term changes (i.e., first differences) and long-term levels (i.e., lagged values) of macroeconomic factors (i.e., productivity growth, unemployment, and inflation) and workers’ bargaining power indicators in the economic sphere (i.e., union density, union density squared, and strike volume), political sphere (i.e., leftist cabinet and civilian spending), and global sphere (i.e., southern imports, FDI, and migration). To specify the mechanisms through which the variables affect labor’s share, I follow Raffalovich and colleagues (1992) and decompose change in labor’s share into three additive components (measured by percentage change scores): employment growth (column 2), average compensation growth (column 3), and product growth (column 4). To illustrate the dynamic pattern of the relations, Figure 5 plots their lag distributions. The lag distribution, presented by the comparable semi-standardized coefficients, is the amount by which labor’s share changes each year, expressed in percentage points, in response to an increase in one standard deviation of the independent variable.
Unstandardized Coefficients from Single Equation ECM of Labor’s Share, Employment, Compensation, and Product, 16 OECD Countries, 1961 to 2005
Note: Table entries are OLS estimates corrected for panel-specific autocorrelation. Panel-corrected standard errors are applied and numbers in parentheses are z-values.
A dummy variable controls for a change in strike definition in the United States, which, since 1981, has excluded work stoppages involving fewer than 1,000 workers.
Coefficient multiplied by 100.
Change is calculated in first differences, y t −y t−1.
Growth is a rate of change, calculated in percentage change scores, 100*[y t −y t−1]/y t−1.
p < .10; * p < .05 (two-tailed test).
Estimated Lag Distributions for Labor’s Share of National Income for Various Independent Variables (semi-standardized coefficients)
Overall, I find that indicators for workers’ bargaining power in the economic sphere redistribute income toward the working class. The positive effect of the first difference of union density on labor’s share and the negative effect of the square of union density reveal that labor unions adversely affect capitalists’ profits, but, as expected, only up to a certain point. Unionization increases labor’s share through its positive association with employment growth, and there is no significant relation between unionization and compensation growth for the entire period from 1961 to 2005. Contrary to my hypothesis, unionization (lagged) level does not relate to changes in labor’s share. Consequently, the bulk of the effect of unionization on labor’s share occurs immediately, with no effect over future time periods (see Figure 5). However, unionization levels may positively relate to labor’s share through other variables, such as the tendency for unemployment to decrease when strong unions participate in policymaking (Kenworthy 2002).
Coefficients for changes and lagged levels of strike volume are consistent with theoretical expectations. Strike activity positively affects labor’s share of national income in the long term, essentially by increasing workers’ rate of compensation. The positive relationship between strike volume and labor’s compensation is most likely due to the positive effect on compensation of workers who directly participate in a strike, as well as the “strike threat effects” that boost non-striking workers’ pay (Rosenfeld 2006). As expected, workers benefit more from strike activity in the following two years than in the year they strike, when strike activity is converted into a new wage agreement.
Contrary to my hypothesis, a growing presence of labor-affiliated political parties in a government has a negative effect on labor’s share of national income. 10 However, the fact that the lagged value of leftist cabinet raises both compensation and economic growth, and therefore has no overall effect on changes in labor’s share, is consistent with previous studies. 11 During the 1960s and 1970s, wages grew faster in countries with labor governments (Western and Healy 1999) that supported their working-class base by raising real wages. Concurrently, labor governments across developed countries enhanced economic growth (Hicks and Kenworthy 1998). The rationale here is that labor governments have an interest in pursuing a collective gain strategy (i.e., economic growth) and enacting policies that guarantee workers will benefit through real wages. Consequently, the lagged value of leftist cabinet has no overall effect on labor’s share of national income within countries.
The distributional consequences to income of civilian spending are, as expected, in favor of labor. An increase in civilian spending on direct social services increases labor’s share of national income by increasing workers’ rate of compensation, most likely through the public sector and its spillover effect on private employers. Yet the positive effect of change in civilian spending is offset by a negative effect (although smaller in size) of the lagged value of civilian spending. This result suggests that an increase in civilian spending makes only a short-term contribution to labor’s share. Following expansion in government civilian spending, there is a slowdown in wages and production that results in a decline in labor’s share. The overall effect of civilian spending on labor’s share, however, is positive.
Results concerning the three variables related to globalization are consistent with the theoretical model. A rise of three percentage points in imports from less-developed countries, which occurred from 1980 to 2005, depresses labor’s share by nearly 4 percentage points. 12 Although importing manufactured goods from less-developed countries increases employment and an economy’s income, it does not translate into a rise in average earnings. The positive association between southern import and employment growth explains the increase in labor’s share in the short term. Yet because southern import has a long-term positive effect on the size of the national income pie but does not lead to increased wages, labor’s share of national income declines in the following two years.
The second component of globalization—inflow of foreign direct investments—decreases labor’s share of national income in the short term, essentially by lowering employment rates and compensation. The increase in the share of a country’s output accounted for by multinational firms’ foreign affiliates exerts a downward pressure on employment and average earnings, most likely due to multinational firms’ common practice of flexible employment, which may spill over to local firms. This negative effect of FDI, however, is not distributed across future time periods. The overall effect of migration on labor’s share is negative, as expected. The higher the rate of migration, the faster the growth in employment. Over the following years, however, migration’s effect on the labor market tends to reduce labor’s share, most likely due to a slowdown in low-skilled workers’ earnings and benefits.
Finally, consistent with prior research, labor’s share of national income declined throughout periods of productivity growth, indicating that the rewards of increased worker productivity fall disproportionately to employers. Although productivity growth opens more employment opportunities and improves workers’ compensation, capitalists’ profits also increase, and the rise in productivity does not translate into an increase in labor’s share. The negative relation between productivity growth and labor’s share fits the CBTC hypothesis that technological change improves capital productivity to a greater extent than labor productivity, although this negative relation is expected to have arisen mainly in the past two decades. Unemployment’s negative association with labor’s share reveals that the massive increase in unemployment in the past two decades, which has been particularly persistent in Europe, has shifted income from labor to capital. Growth in unemployed workers may provide another indication of labor’s weakening bargaining power vis-à-vis employers (Korpi 2002).
In summary, the results generally confirm the theoretical model. Net of macroeconomic variables, organizing new union members, surges in strike activity, and expansion of the public sector increase labor’s share of national income over time. On the other hand, importing goods from developing countries, increases in migrant workers, and growing inflows of foreign direct investment decrease labor’s share over time. Leftist government increases both earnings and an economy’s income growth; it therefore has no direct effect on changes in labor’s share within countries.
Changing Effects over Time
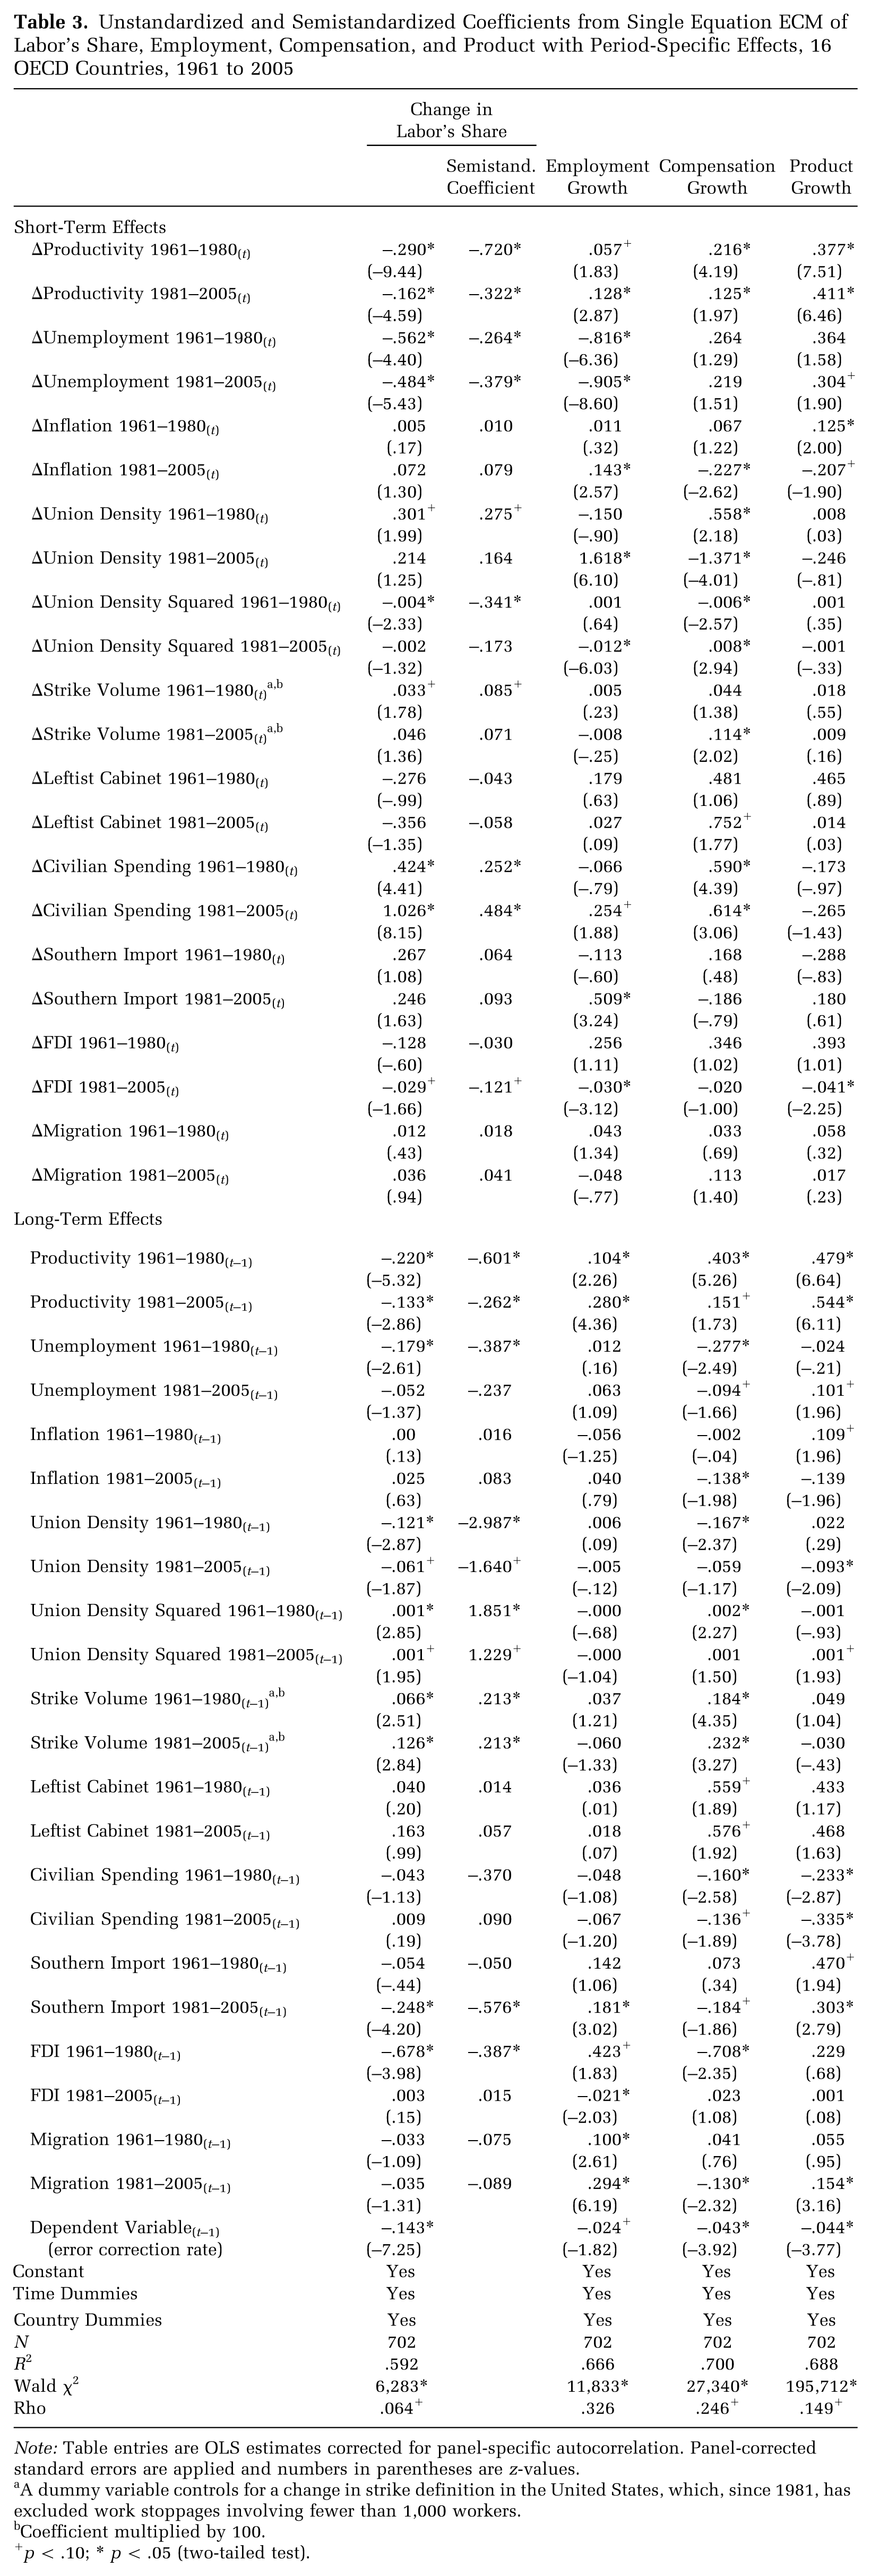
By estimating a single coefficient for the entire 1961 to 2005 period, I assume a constant and stable relation between workers’ bargaining power and labor’s share of national income. However, the impact of workers’ bargaining power on labor’s share may change over time. In particular, I expect to find significant differences between the last two decades and the early decades of the period, which may be due to the process of bargaining decentralization as firm-level bargaining flourished across countries. Indicators for workers’ organizational power should have a larger positive effect on labor’s share in the early period, while indicators for workers’ structural powerlessness should have a larger negative effect in the more recent period. To account for these considerations, I re-estimate Model 1 in Table 2 with interaction dummies for two subperiods: 1961 to 1980 and 1981 to 2005. I interact these period dummies with all variables of interest. Table 3 presents the results. To address the question of the variables’ relative impact on labor’s share, I present the semi-standardized coefficients, expressed in labor’s share percentage points.
Unstandardized and Semistandardized Coefficients from Single Equation ECM of Labor’s Share, Employment, Compensation, and Product with Period-Specific Effects, 16 OECD Countries, 1961 to 2005
Note: Table entries are OLS estimates corrected for panel-specific autocorrelation. Panel-corrected standard errors are applied and numbers in parentheses are z-values.
A dummy variable controls for a change in strike definition in the United States, which, since 1981, has excluded work stoppages involving fewer than 1,000 workers.
Coefficient multiplied by 100.
p < .10; * p < .05 (two-tailed test).
Results for workers’ organizational power are partly consistent with the theoretical argument. Increasing unionization’s positive effect on labor’s share of national income was higher in the first period. I find positive relations between change in unionization and average compensation growth only during the 1960s and 1970s. Looking at the long-term coefficients, I find evidence for wage restraint by strong labor unions during both periods but especially during the 1960s and 1970s. Similarly, the short-term coefficient for strike activity is significant for labor’s share only during the first period. Increasing government spending on direct social services, however, seems to have had a larger effect on labor’s share during the second period. Yet the public sector’s expansion occurred mostly during the first period, when civilian spending as a percentage of GDP increased, on average, from 13.5 percent in 1961 to 20.4 percent in 1980. Since 1981, government civilian spending has stayed relatively constant across countries. Thus, the overall increase in labor’s share due to civilian spending was larger in the first period.
Turning to effects of the globalization indicators over the two periods, I find that imports from developing countries decreased labor’s share of national income mainly in the last two decades, most likely by bringing down the wages of the least skilled workers in developed countries. The negative effect of foreign direct investments on labor’s share also differs between the two periods. During the 1960s and 1970s, the lagged value of FDI was negatively associated with labor’s share due to its negative effect on average earnings growth. In more recent years, the change in FDI has decreased employment rates and thus labor’s share. While a larger flow of migrant workers increased employment during the entire 1961 to 2005 period, more recent waves of migrant workers, mainly from developing countries, have suppressed wage growth and labor’s share of national income.
Based on differences in the coefficients of the variables and their averages between the two periods, few conclusions can be drawn regarding the processes that explain the upward and downward trends in labor’s share of national income across countries. The rise in labor’s share during the 1960s and 1970s was partly an outcome of organizing new union members, strike waves of the late 1960s, and rapid expansion of the public sector. The declining trend of labor’s share since the early 1980s is associated with deterioration of workers’ organizational power resources in advanced capitalist countries. Unionization rates and levels of strike activity have fallen, government civilian spending has stagnated, and workers’ collective action power to redistribute income in favor of labor has been severely weakened. Labor’s capacity to influence state policies has also declined across countries, and governments’ targets of full employment have been abandoned in favor of labor market flexibility and low inflation. The current decline in labor’s share is also due to workers’ lessening power in the global context due to integration of countries into international markets, which has caused an increase in imports from developing countries, cheap immigrant labor, and capital mobility.
Robustness Analyses
I assess sensitivity of the results to information from individual countries with a jackknife analysis. More precisely, I re-estimate Model 1 in Table 2 by excluding one country after another. Table 4 presents the resulting minimum and maximum values of the estimates, as well as the excluded country for which that estimate was obtained. The analysis demonstrates the robustness of the reported findings to outliers. None of the coefficients change signs with the exclusion of a particular country. The coefficient for migration, however, becomes zero when Ireland is removed from the model. Ireland’s migration rate increased from around zero in the early 1990s to 16 percent in 2005. Re-estimating the models for the components of labor’s share without Ireland yields similar results regarding the positive effect of migration on employment and its negative effect on compensation. Yet, without Ireland, migration has no effect on economic growth, which probably explains the zero effect on labor’s share. Apart from migration, the main results are robust and nearly all significant coefficients retain their signs in the jackknife analysis.
Jackknife Analysis, Single Equation ECM of Labor’s Share, 16 OECD Countries, 1961 to 2005
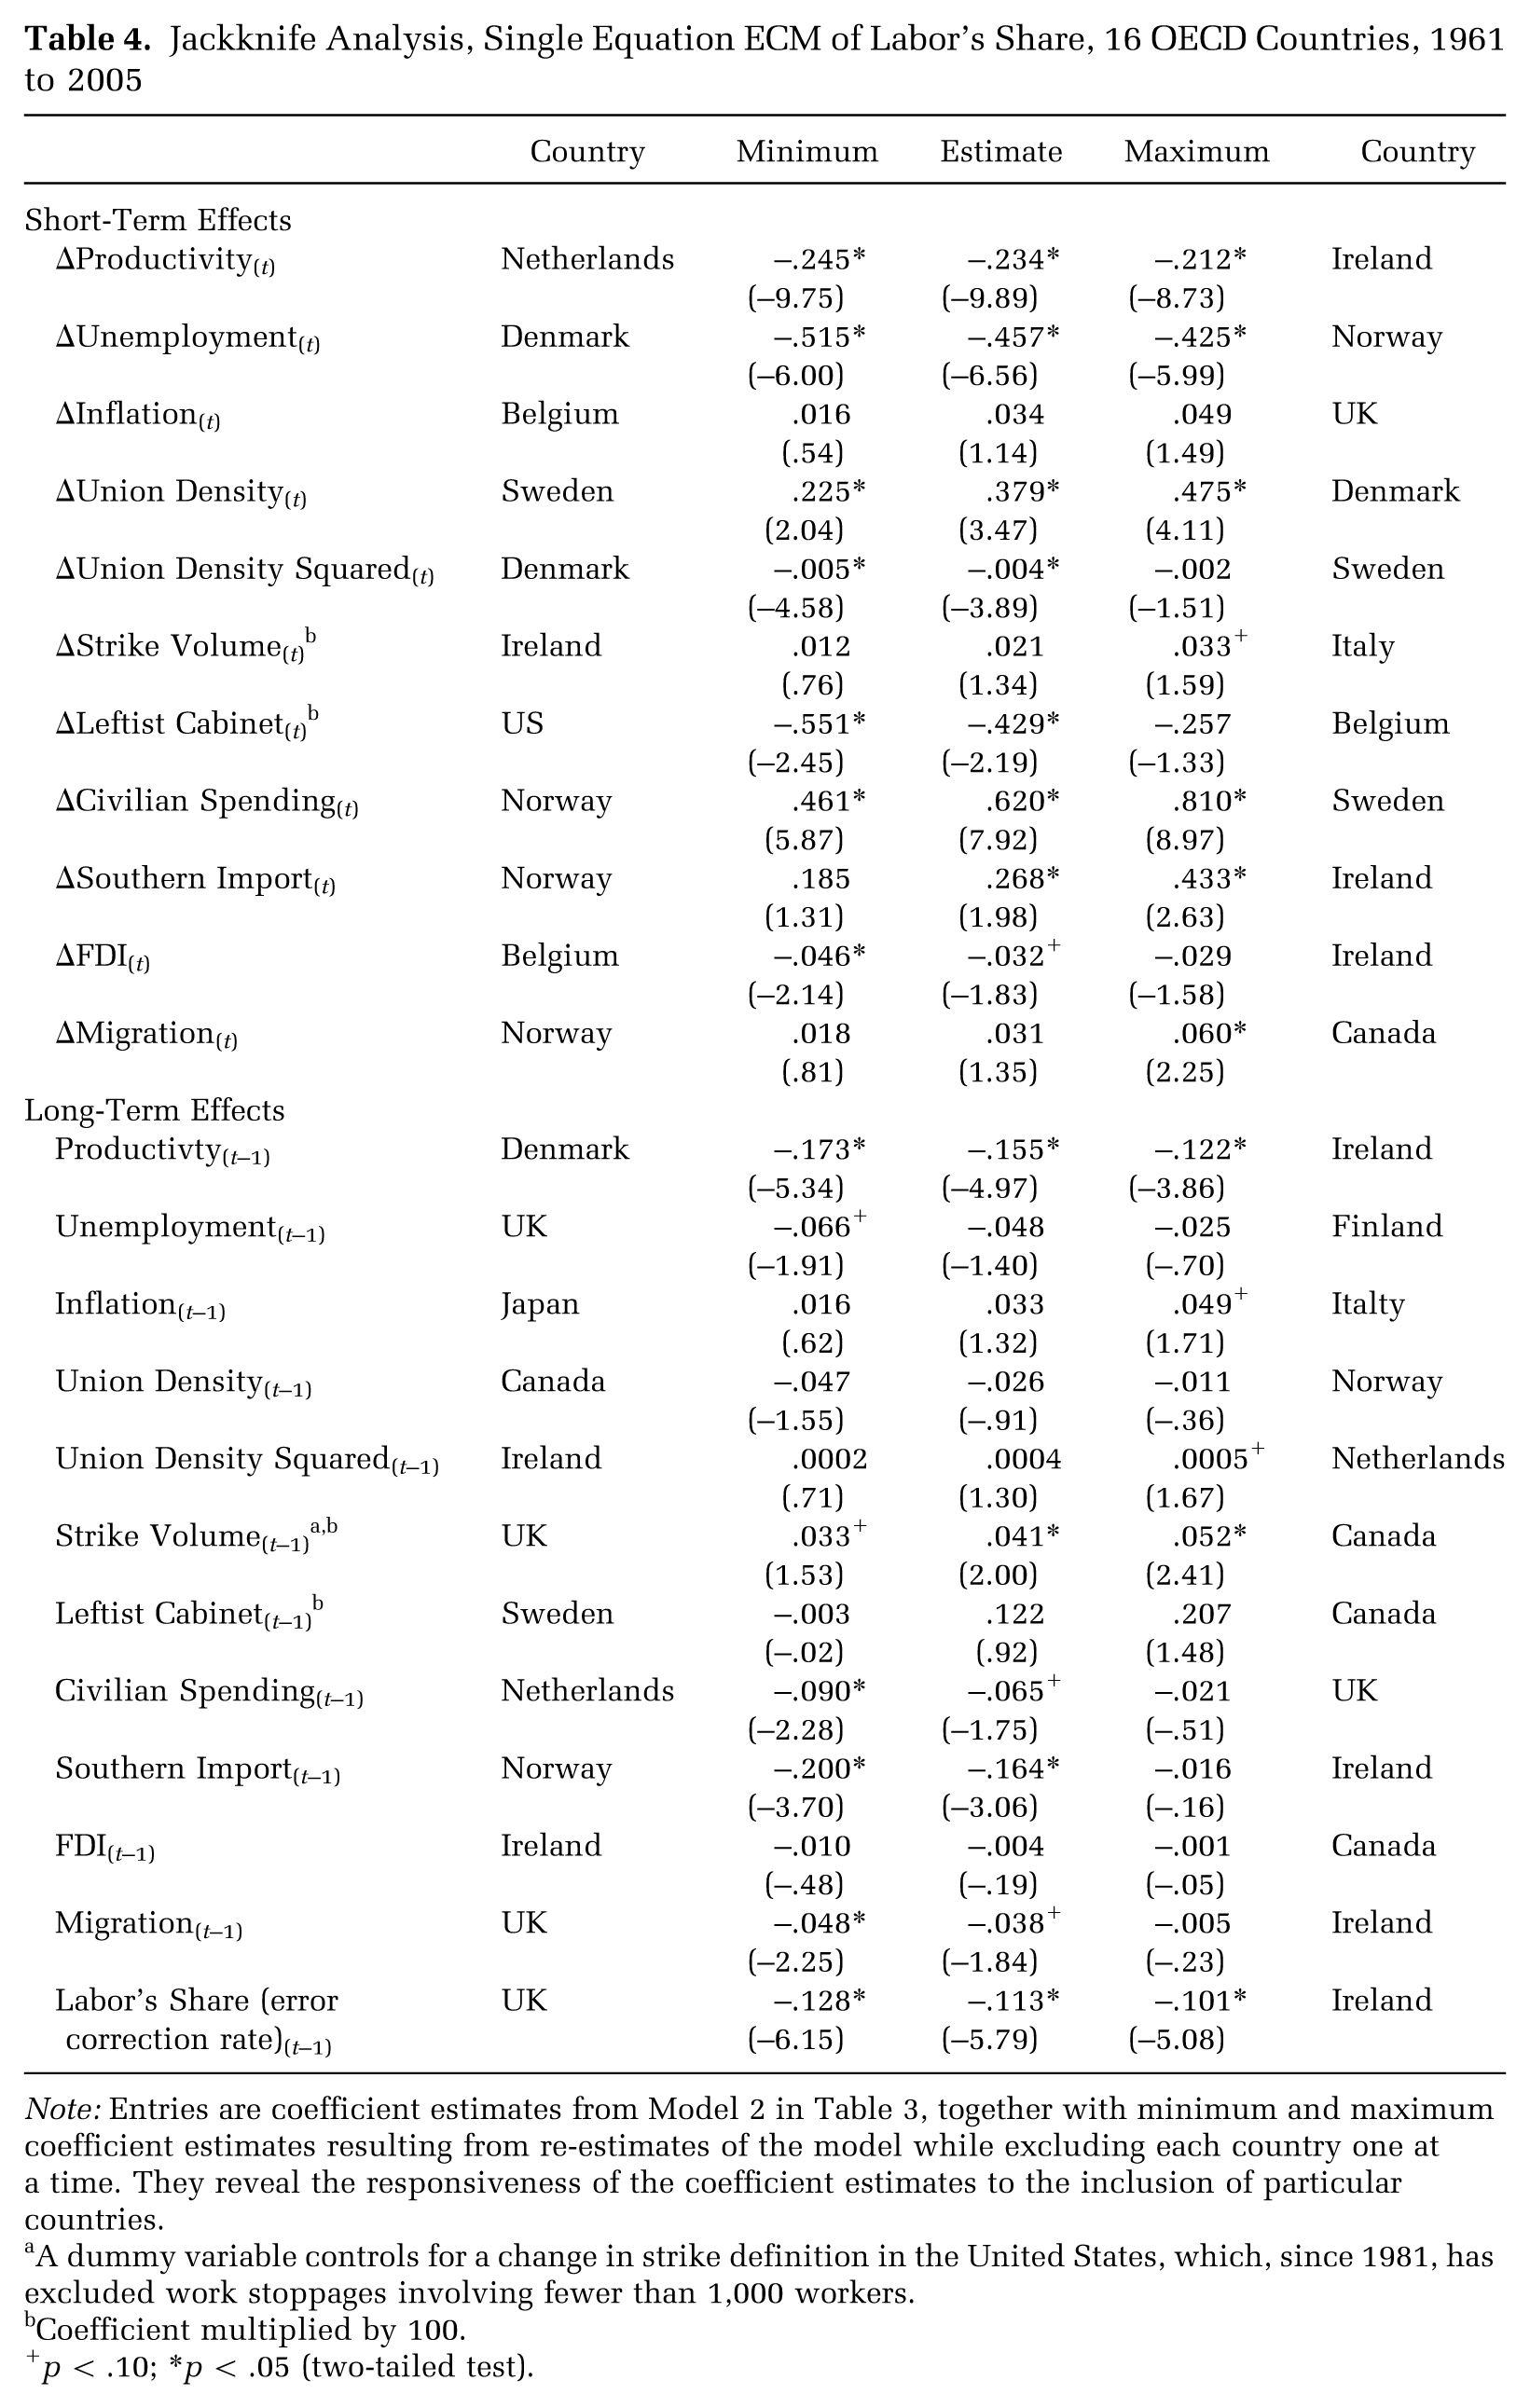
Note: Entries are coefficient estimates from Model 2 in Table 3, together with minimum and maximum coefficient estimates resulting from re-estimates of the model while excluding each country one at a time. They reveal the responsiveness of the coefficient estimates to the inclusion of particular countries.
A dummy variable controls for a change in strike definition in the United States, which, since 1981, has excluded work stoppages involving fewer than 1,000 workers.
Coefficient multiplied by 100.
p < .10; *p < .05 (two-tailed test).
One possible criticism of analyzing the distribution of national product between the aggregate categories of capital and labor is that, by doing so, we ignore the likelihood of “contradictory locations within class relations” (Wright 1978:61), that is, workers whose interests may be more aligned with capitalists than with workers. Indeed, labor’s total compensation includes top managers who extract wages, salaries, and fringe benefits while also drawing capital income such as dividends. 13 Nonetheless, including top managers with the working class does not necessarily bias the analysis; if anything, it puts my argument to a stronger test. Given the proliferation of such high-earning salaried professionals, it is a wonder that labor’s share is not at a record high. Based on recent estimates of the share of total income held by the richest groups (Atkinson and Piketty 2007, 2009), I calculate a modified measure of workers’ share for a restricted sample of 13 countries. 14 I subtract an approximation of the top 1 percent earners’ income from aggregate labor’s compensation and divide that amount by GDP. As expected, in all countries workers’ share is lower than labor’s share by about 3 to 6 percentage points. In the United Kingdom and the United States, there was also a more rapid decline in workers’ share during the 1990s relative to the decline in labor’s share. I estimate the same models presented in Table 2 with the modified measure of labor’s share as the dependent variable. Results for this restricted sample from 1961 to 2000 are substantially the same as those for the full sample, most likely because the correlation between changes in labor’s share and changes in the modified measure for labor’s share is .982. 15
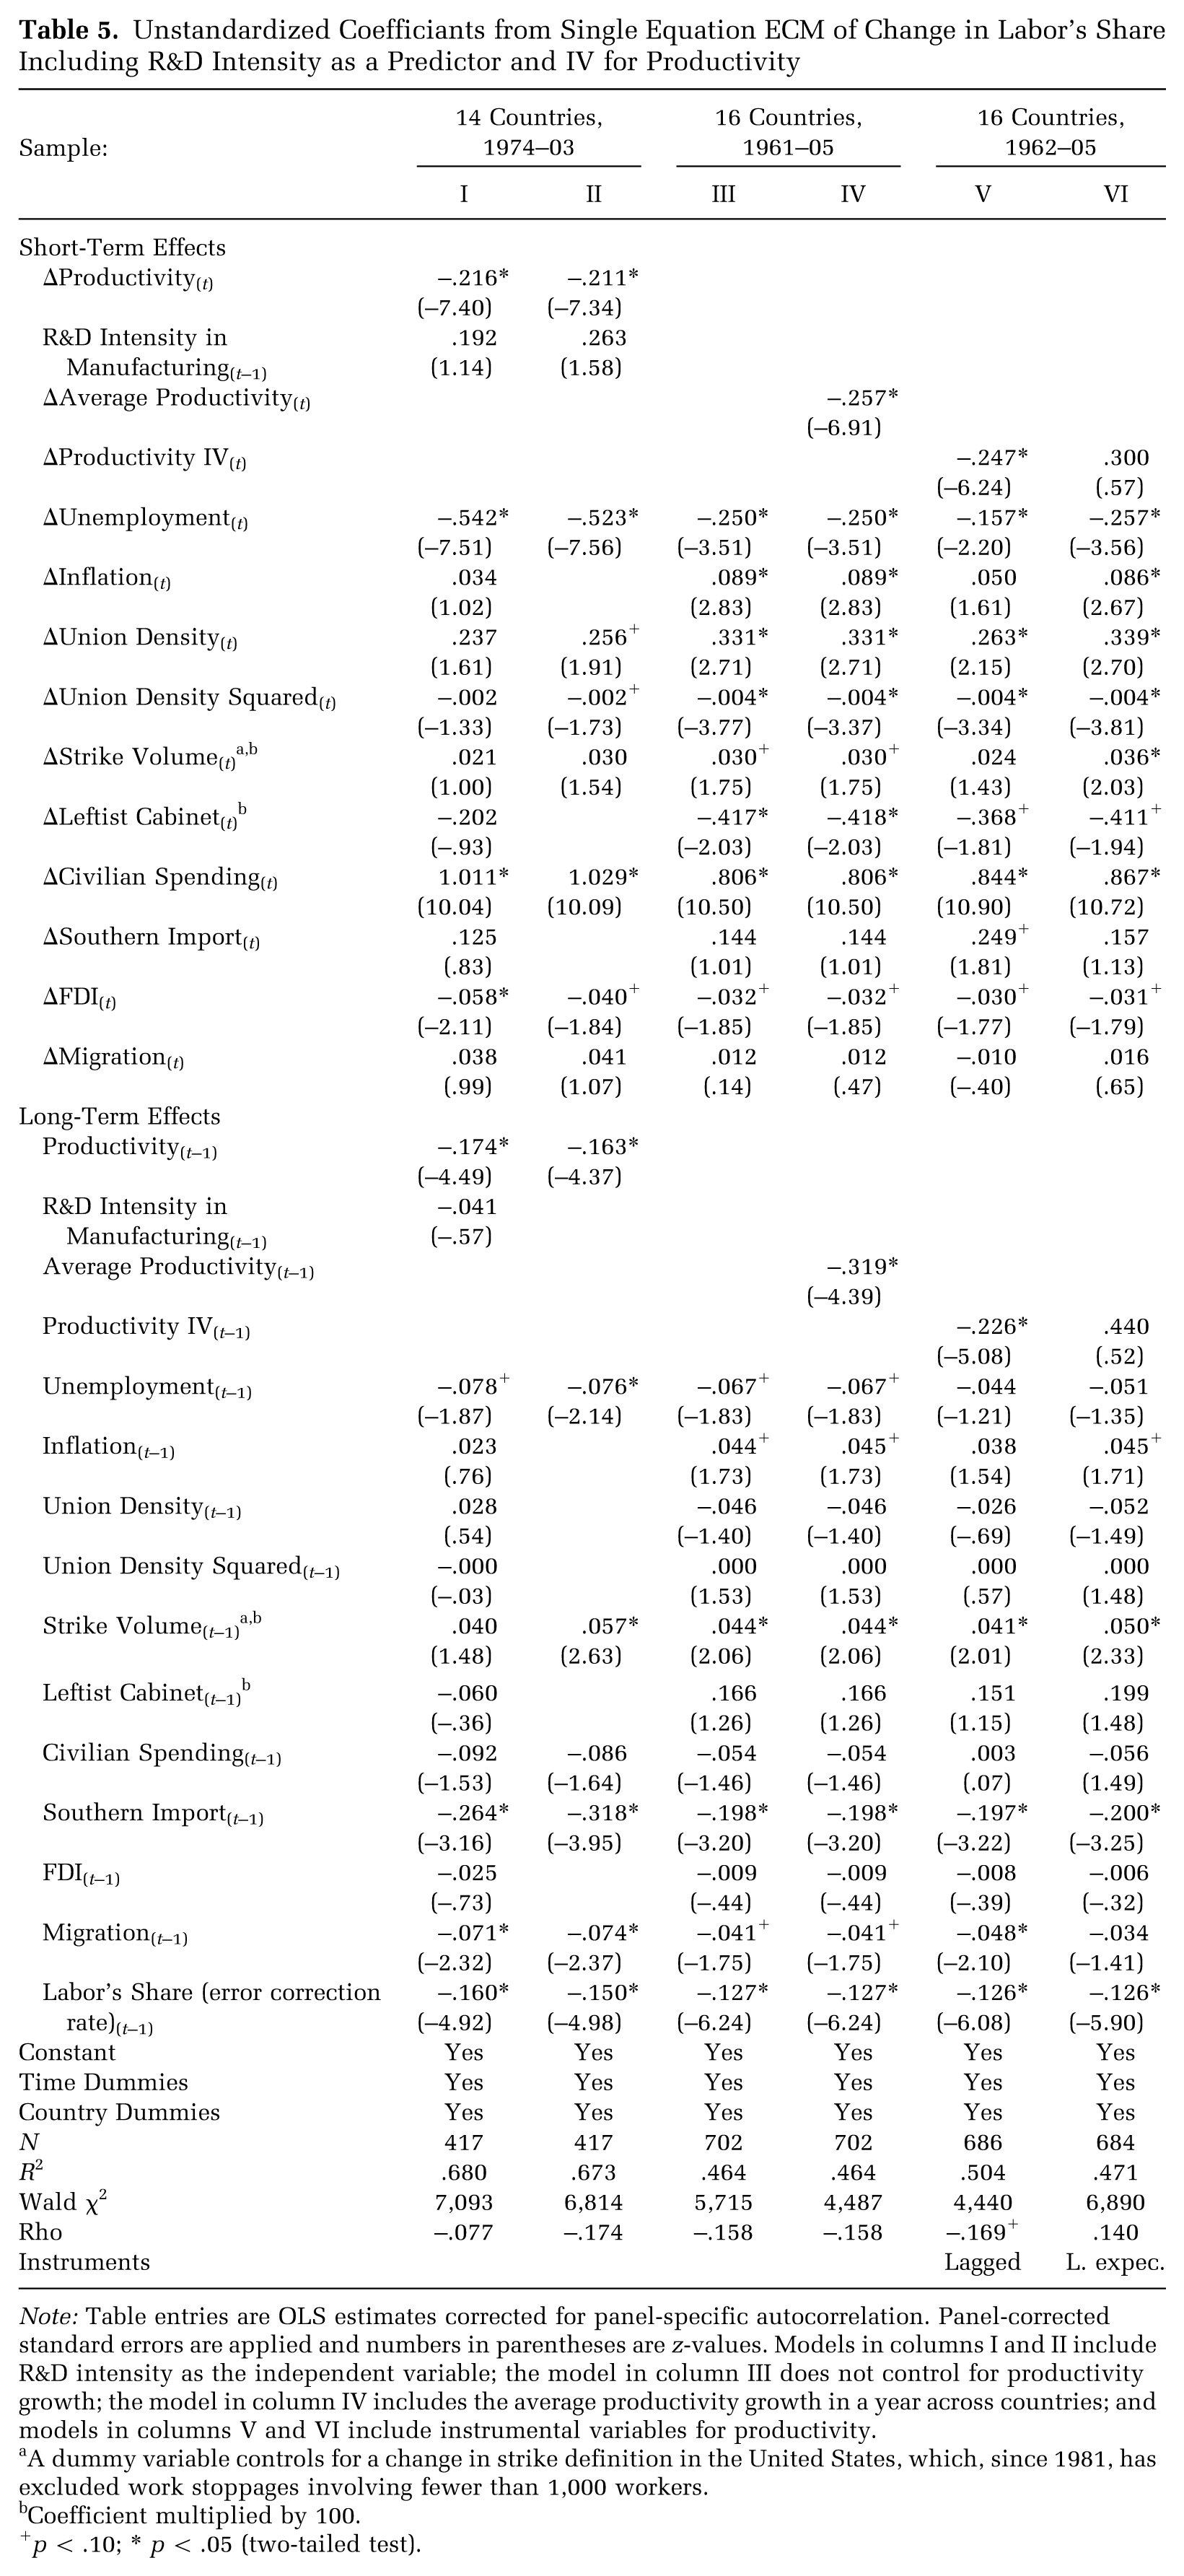
So far, as is common in the existing literature, I have analyzed relations between productivity growth and labor’s share of national income as a proxy for the significance of technological change in determining changes in labor’s share. According to the CBTC hypothesis, a negative coefficient for productivity suggests that while labor productivity increased in the past decades, capital productivity increased faster, boosting capitalists’ profits. The underlying assumption is that capital inputs are more complementary with computer technology than are aggregate labor inputs. Productivity growth is therefore an indirect measure of technology. Because the omission of a direct measure for technological change may bias the results, in Table 5 I investigate whether effects of workers’ bargaining power indicators on labor’s share hold when analyzing a directly observed, comparable measure of technological change across countries (i.e., R&D intensity in manufacturing). A measure of investment in computers or information technology may have some advantages over R&D as a proxy for technological change, but data are generally available only for a subset of countries, and even then for only a few recent years. Another drawback is that this measure relates only to manufacturing industries, but labor’s share is measured at the country level. Nevertheless, results presented in Table 5 are perhaps the most rigorous test for the independent effect of workers’ bargaining power on labor’s share of national income.
Unstandardized Coefficiants from Single Equation ECM of Change in Labor’s Share Including R&D Intensity as a Predictor and IV for Productivity
Note: Table entries are OLS estimates corrected for panel-specific autocorrelation. Panel-corrected standard errors are applied and numbers in parentheses are z-values. Models in columns I and II include R&D intensity as the independent variable; the model in column III does not control for productivity growth; the model in column IV includes the average productivity growth in a year across countries; and models in columns V and VI include instrumental variables for productivity.
A dummy variable controls for a change in strike definition in the United States, which, since 1981, has excluded work stoppages involving fewer than 1,000 workers.
Coefficient multiplied by 100.
p < .10; * p < .05 (two-tailed test).
I draw on data from the OECD ANBERD (Analytical Business Enterprise Research and Development) and OECD STAN (Structural Analysis) databases to construct R&D intensity, measured by R&D expenditure in manufacturing divided by value added in manufacturing. Yearly data are available since 1973 for all countries except Austria and Belgium. I imputed some data points using linear interpolation due to missing observations. All countries continually increased the proportion of value added given to R&D between 1973 and 2005, with the largest increases occurring in Denmark, Finland, Japan, and Sweden. On average, R&D intensity grew from 3 percent in 1973 to 5.5 percent in 1990 and up to 7 percent in 2003.
At the country level, I find negative correlations between levels of R&D intensity and labor’s share and positive correlations between the first differences of the two variables. This might suggest that technological change benefits workers’ relative share in the short term but contributes more to capitalists’ profits over the following years. Negative relations between levels of R&D intensity and labor’s share, however, may also be due to a time trend. Results in Table 5 reveal no significant relations between R&D intensity and labor’s share, with or without controlling for productivity growth. Using results from the full model, I removed several variables whose z-values are less than 1. Overall, the main findings are robust, and including levels and changes in R&D intensity does not change the results presented in Table 2. 16
Because the CBTC hypothesis argues that firms responded to the 1960s’ and 1970s’ profit squeeze by investing resources to develop technologies that are more complementary with capital inputs and could thus increase capital productivity, taking productivity to be exogenous may bias the results. Given that I am particularly interested in the effect of workers’ bargaining power on labor’s share of national income, controlling for macroeconomic variables, such a bias from reverse causation, if it exists, will most likely not affect the main findings. Nevertheless, because productivity growth is most likely affected by some of the independent variables in the model (e.g., leftist government), the endogeneity of productivity may result in inconsistent estimates of the effects of the variables. To test the robustness of the results, I first estimate the basic model without controlling for productivity growth (column 3 in Table 5) and with a measure for the average productivity growth in a year across countries (mainly to control for the business cycle). Except for inflation, which became positively significant, the main findings are robust for these specifications.
Next, to deal with this potential endogeneity, I created two plausible instrumental variables for productivity. In the first stage, I regress productivity growth on the instruments; in the second stage, I use the predicted values for productivity in place of the endogenous regressor to estimate the change in labor’s share. Columns 5 and 6 in Table 5 contain these results. It is notoriously hard to find convincing instruments for productivity and, because my instruments are not very powerful, I present this as only one of several robustness checks. I first use the lagged value of the endogenous regressor as an instrument for its first difference and the lagged difference (x t−1 – x t−2) as an instrument for its lagged value. These variables are most likely uncorrelated with the error term and more weakly correlated with the exogenous variables. Compared with the models where productivity growth is assumed to be exogenous (see Table 2), the IV coefficient estimates, although estimated with less precision, are remarkably close. The second instrumental variable for productivity growth is made up of the variation in productivity caused by the initial level and the rate of improvement in life expectancy at age 40. Life expectancy is a plausible instrument because recent studies show that better health at a young age has long-term consequences for workers’ productivity at the micro and macro levels (Aghion, Howitt, and Murtin 2009). Data on life expectancy at age 40 are available from the OECD Health Dataset. Although correlations between productivity growth and the health instrument are not low (.492 for first differences and .632 for levels), correlations between the instrument and change in labor’s share are lower than the relations with productivity growth (−.273 compared with −.465); coefficients for the instrument are not statically significant. Nevertheless, the main findings for the indicators for workers’ bargaining power are robust to this specification as well.
Conclusions
Capitalists’ profits play a crucial role in the process of social stratification. Yet inequality research largely neglects the dynamics of national income distribution between capitalists’ profits and labor’s compensation. Even studies on income inequality between social classes tend to identify the capitalist class as a subset of the self-employed. This approach ignores the fact that corporations, not individual business-owners, dominate production for private profit in modern capitalist economies. This article brings relations between capitalists’ profits and workers’ income back into inequality research by analyzing labor’s share of national income in 16 capitalist democracies during the postwar period. As is the case with earnings inequality, the past two decades have seen a reverse long-term trend toward increasing inequality between capitalists’ profits and labor’s compensation.
To explain the upward and downward trends in labor’s share of national income within countries, I developed and tested a theoretical model of the relative bargaining power of capital versus labor. I conceptualized this argument as a model of inter- and intra-class bargaining power in the economic, political, and global spheres. The findings support the theoretical model and underline the value of using a broad conceptualization of labor’s relative bargaining power. Labor’s share of national income increased in the 1960s and 1970s due to unions organizing new members, the surge in strike activity, and the consolidation of the welfare state. These factors all increased labor’s compensation faster than the economy’s income. Labor’s share declined since the early 1980s with the decline in unionization rates and levels of strike activity, stagnation in government civilian spending, and bargaining decentralization. Labor’s capacity to influence state policies has also declined across countries, and governments’ targets of full employment have been abandoned in favor of labor market flexibility and low inflation. The current decline in labor’s share of the national income can also be traced to an increase in imports from developing countries and the increased presence of foreign affiliates of multinational firms. Contrary to previous studies (Jaumotte and Tytell 2007), once Ireland is removed from the analysis, migrant labor is not associated with the decline in labor’s share.
Overall, the findings do not support the additional explanation—that is, capital-biased technological change—for the decline in labor’s share of national income (Acemoglu 2002, 2003; Blanchard 1997). Although productivity growth has had a negative effect on labor’s share, this effect did not increase over the past two decades. Likewise, there is no evidence that R&D intensity (as a directly observed, comparable measure of technological change) relates to changes in labor’s share. The design of this study, however, which analyzes changes in labor’s share at the country level, might conceal part of the technological change effect that most likely differs between industries. A rigorous test for the significance of technological change in explaining the decline in labor’s share of national income requires industry-level data.
A few caveats deserve mention. First, and most obvious, by estimating an average effect for 16 countries, the analysis does not provide an account of the specific historical circumstances in each country. Substantive knowledge about individual cases is important to further confirm the causal importance of workers’ bargaining power factors (Kristal 2010). Second, by applying fixed-effects estimators to obtain unbiased and consistent estimates of parameters, the findings uncover sources generating the common upward and downward trends in labor’s share but only partly advance our knowledge about why the levels of labor’s share are higher in some countries (e.g., Belgium and Sweden) than in others (e.g., Australia and the United States). Several causal processes that explain the variation in levels across countries probably differ from the causal pathways that explain variation over time within countries. For instance, leftist governments may be a major determinant of cross-country variation in the levels of labor’s share but have no effect on changes in labor’s share within countries.
At a broader level, the findings suggest equilibrium in the relationship between the relative bargaining power of capital versus labor and labor’s share of national income during the postwar period. Labor’s share increased when capital’s bargaining power was threatened by the ascendancy of social-democratic projects in the aftermath of World War II. The past two decades have seen a new swing of the pendulum toward a restoration of the capitalist class’s bargaining power. Harvey (2005) argues that this countermovement is the essence of the neo-liberal revolution, usually attributed to Margaret Thatcher and Ronald Reagan. According to Harvey, neo-liberalism—“the freedom of the market”—has not benefited everyone everywhere. On the contrary, neo-liberalism is actually an attempt to restore the capitalist class’s share of income to its pre–World War II levels. I find that the capitalist class has succeeded in creating a climate conducive to promoting profits. In fact, across capitalist democracies, labor’s share of national income in 2005 was the smallest it had been for at least four decades.
Footnotes
Acknowledgements
I wish to thank participants in these presentations, as well as Yinon Cohen, David Grusky, Hadas Mandel, and ASR reviewers for their comments on drafts of this article.
Earlier versions of this article were presented at the Columbia Center for the Study of Wealth and Inequality and at the 2009 summer meeting of the ISA Research Committee on Social Stratification and Mobility.
The Stanford Center for the Study of Poverty and Inequality provided support for this project.
1.
Evidence in favor of the positive class compromise argument, according to ![]() :162), is the narrow range of the distribution of labor’s share in European countries between 1953 and 1964: “within a very narrow range, at the time between wages that equal 50 and 55 percent of total product . . . all outcomes are equally possible, outside of this range they are nearly impossible [italics mine].”
:162), is the narrow range of the distribution of labor’s share in European countries between 1953 and 1964: “within a very narrow range, at the time between wages that equal 50 and 55 percent of total product . . . all outcomes are equally possible, outside of this range they are nearly impossible [italics mine].”
2.
The trend in labor’s share in Norway is similar to that in other Scandinavian countries, although its level is lower by 8 percentage points, most likely due to oil revenues.
3.
4.
Even in Sweden’s centralized bargaining system, to take an important example, in the early 1980s the Swedish metalworkers and Volvo withdrew from centralized negotiations; thereafter, bargaining lurched toward the sector and firm levels.
5.
Because data on the self-employed are available only from the late 1980s for New Zealand and Switzerland, I exclude these countries from the analysis. Measuring the share of employees’ compensation in GDP in New Zealand reveals that employees’ share increased until the late 1970s and decreased since then. Switzerland saw a continuous increase in employees’ share. Yet these results are most likely biased due to the move from self-employment to wage and salary employment.
6.
From a firm’s standpoint, rent and interest payments would be seen as costs, but for the economy as a whole, they are forms of income received by other members of the capitalist class, such as landlords and bankers. In addition, while labor’s share is commonly measured by dividing labor’s compensation by GDP, capital share in my measure includes net capital income and capital depreciation. Some scholars argue that capital depreciation should be taken out of capital income and that labor’s and capital’s shares are much less stable than is usually claimed. On average, labor’s share without capital depreciation declined from 86 percent (73 percent with capital depreciation) in 1980 to 76 percent (64 percent with capital depreciation) in 2005. Because capital depreciation measurements are subject to debate (![]() ) and may be affected by tax policy, in this study I use the common measure of labor’s share that includes capital depreciation on the capital side.
) and may be affected by tax policy, in this study I use the common measure of labor’s share that includes capital depreciation on the capital side.
7.
Comprehensive data on strikes in the United States are only available for 1960 to 1980. Starting in 1981, during the Reagan administration, the Bureau of Labor Statistics (BLS) began to collect data only for strikes involving more than 1,000 workers. The 1960 to 1980 and 1981 to 2005 segments of the strike series for the United States are thus not comparable. To control for this anomaly, I include a dummy variable equal to 1 for 1981 to 2005 and 0 for 1960 to 1980.
8.
U.S. Democrats and Canadian Liberals are not comparable to leftist political parties in other countries and should more correctly be categorized as centrist in comparative research. Yet my analysis explains the dynamics of labor’s share only within countries, not the levels of labor’s share between countries (given fixed-effects estimators); in the specific national contexts of the United States and Canada, these political parties have pro-labor orientations. I argue that governments’ political affiliations during the 1960s and 1970s (e.g., the British Labour Party, the German Social-Democrats, the Swedish Social Democrats, or the Johnson administration in the United States) positively affected labor’s relative bargaining power. Indeed, when explaining the levels of labor’s share between countries, the higher level in Sweden compared with the United States is most likely partly due to the cumulative power of the Swedish Social-Democratic party. Differences in the levels of labor’s share of national income between countries, however, is not the subject of the current research.
9.
I tested the data by applying the augmented Dickey-Fuller test to individual country time-series.
10.
Estimating the same model with dummies for election years, I tested (and rejected) the possibility that the negative coefficient for leftist government does not necessarily capture the effect of a specific policy but rather the short-term cost of elections.
11.
I estimated the same model with rightist political parties in the government instead of leftist cabinet. Research finds that rightist political parties, whose policies favor free markets and business interests, increase household income inequality (![]() ), but I do not find any effect on labor’s share of national income, with and without controlling for leftist governments (analyses not shown).
), but I do not find any effect on labor’s share of national income, with and without controlling for leftist governments (analyses not shown).
12.
This is a result of dividing the coefficient of the lagged southern import (−.164) by the coefficient of the lagged labor’s share (.113). This calculation yields the long-term multiplier that represents the total long- and short-term effect on labor’s share for a one-point increase in the independent variable.
13.
According to the national accounts classification, workers whose income is derived from a mixture of earnings, fringe benefits, and profit-linked mechanisms (such as dividends) would have their income split proportionately between the labor and capital components.
14.
Data are not available for Austria, Belgium, and Denmark for the entire period and for Australia (2003 to 2005), Canada (2001 to 2005), Finland (2005), Germany (1999 to 2005), Ireland (1960 to 1974, 2001 to 2005), Italy (1960 to 1973), and the Netherlands (2000 to 2005).
15.
None of the coefficients in a model with labor’s share as the dependent variable are significantly different from those in a model with workers’ share as the dependent variable.
16.
I also estimated models without time dummies that eliminate any common trends and external shocks to which all countries are jointly exposed, and the results are generally the same. Additionally, I constructed a measure for R&D intensity for the entire economy based on data from OECD Main Science and Technology Indicators. The analysis, available only for 1982 to 2005, supports the robustness of the results.
References
Supplementary Material
Please find the following supplemental material available below.
For Open Access articles published under a Creative Commons License, all supplemental material carries the same license as the article it is associated with.
For non-Open Access articles published, all supplemental material carries a non-exclusive license, and permission requests for re-use of supplemental material or any part of supplemental material shall be sent directly to the copyright owner as specified in the copyright notice associated with the article.