
Abstract
We study the role of family wealth for children’s educational achievement using novel Swedish register data. In particular, we focus on the relationship between grandparents’ wealth and their grandchildren’s educational achievement. Doing so allows us to reliably establish the independent role of wealth in contributing to long-term inequalities in opportunity. We use regression models with extensive controls to account for observed socioeconomic characteristics of families, cousin fixed effects to net out potentially unobserved grandparent effects, and marginal structural models to account for endogenous selection. We find substantial associations between grandparents’ wealth and their grandchildren’s grade point averages (GPA) in the 9th grade that are only partly mediated by parents’ socioeconomic characteristics and wealth. Our findings indicate that family wealth inequality—even in a comparatively egalitarian context like Sweden—has profound consequences for the distribution of opportunity across multiple generations. We posit that our estimates of the long-term consequences of wealth inequality may be conservative for nations other than Sweden, like the United States, where family wealth—in addition to its insurance and normative functions—allows the direct purchase of educational quality and access.
Keywords
For decades, inequality research has focused on occupations, education, or income as the main signifiers of socioeconomic well-being. In comparison, economic wealth as a dimension of social stratification has only recently begun to attract more empirical attention (Conley 1999; Keister 2000; Oliver and Shapiro 1995; Piketty 2011). This research suggests that family wealth is central to intergenerational transmission processes. It also documents considerable intergenerational rigidity, in particular at the top of the wealth distribution (Björklund, Roine, and Waldenström 2012; Hällsten 2014; Pfeffer and Killewald 2016b), where the very wealthy are most successful in maintaining their social advantage. Concerns about wealth stratification are also at the center of recent and widely discussed predictions about the rise of a class of individuals living solely off the returns to their economic capital (i.e., rentiers) rather than their labor (Piketty 2011).
Some studies argue that the persistence of wealth is limited to two generations (e.g., Adermon, Lindahl, and Waldenström [2015] for Sweden), but others have found effects of grandparents’ wealth that extend to their grandchildren’s wealth position (Pfeffer and Killewald 2016a). For intergenerational mobility more broadly, a current strand of the literature suggests that inequality should be studied as transmitted across multiple rather than just two generations (Hällsten 2014; Jaeger 2012; Lindahl et al. 2015; Mare 2011).
In this analysis, we determine to what extent family wealth structures educational outcomes over multiple generations in Sweden. Our primary analytic focus is the relationship between grandparents’ wealth and their grandchildren’s educational outcomes—namely, grandchildren’s grade point average (GPA) in 9th grade and their transition into the highest track of upper-secondary schooling, intended for university-bound students. We directly address the growing interest in the transmission of inequality across multiple generations and the hypothesis that—compared to socioeconomic characteristics—family wealth may wield particularly strong multigenerational influences (Mare 2011; Pfeffer 2014). Together, our analyses substantially expand knowledge on the long-term processes of status maintenance, moving beyond prior work that focuses on other components of socioeconomic inequality or analyzes transmission processes solely from parents to children.
This study uses administrative data drawn from tax registers that capture detailed wealth components for the entire Swedish population between 1999 and 2007. For this project, we linked these data to other administrative data sources, including school registers that provide information on students’ educational achievement and attainment. This new source of linked data provides a range of measures that—in their combination—are typically unavailable for social science research. We have a rich set of socioeconomic measures for parents and grandparents that includes permanent (lifetime) income and detailed wealth information. These data allow for a rigorous test of the independent role of net worth and separate asset components (financial assets, home wealth, real assets, and debts). They also permit analyses of whether the associations between grandparents’ wealth and grandchildren’s educational outcomes are mediated by characteristics of the middle generation, including fathers’ cognitive ability and non-cognitive skills, and by selection into more socioeconomically segregated schools.
The focus on wealth two generations removed also affords some unique methodological opportunities. Besides capturing otherwise “unobserved wealth” still in the hands of the generation prior to parents, it helps reduce several particularly thorny concerns about endogeneity—namely, unobserved confounding and reverse causation. Our analyses account for families’ unobserved factors by comparing cousins, which we consider a separate methodological contribution.
Finally, apart from its unique available data, Sweden presents a particularly interesting national case to assess the intergenerational influences of family wealth. Sweden is one of the most egalitarian countries of the industrialized world, with comparatively low levels of income and class inequality, both within and across generations, and a comprehensive education system. However, as we will show, Sweden’s wealth distribution and its intergenerational impacts are far from equitable. Finding a substantial and extended role of family wealth in an otherwise egalitarian context makes a strong case for increased attention to family wealth in examinations of inequality in opportunity in other, less egalitarian, countries.
Theoretical Background
Wealth and Dimensions of Socioeconomic Standing
At the turn of the millennium, several scholars made the case for increased consideration of wealth as a central dimension of social stratification (Keister and Moller 2000; Spilerman 2000). In his proposition of new principles for class analysis, Sorensen (2000) suggested that physical wealth is a central social background condition that should be considered in all analyses of social class and mobility. While research on wealth has considerably expanded since then (Killewald, Pfeffer, and Schachner forthcoming), standard models of intergenerational mobility still tend to exclude family wealth. In large strands of social mobility research, the focus is on the correlation in one outcome across generations, most often occupational position or income (Solon 1999; Torche 2015). In contrast, traditional status attainment research in sociology assesses multiple parental background factors (generally education and occupation) in analyses of children’s socioeconomic attainment in terms of not only their final occupation but also key intermediary steps such as educational attainment and first occupation (Blau and Duncan 1967; Sewell, Haller, and Portes 1969).
Early on, this approach was criticized as missing unobserved factors in individuals’ backgrounds. Even in 1972, Bowles noted that wealth was missing from these models and that its exclusion would likely lead to a biased view of the overall importance of social inequality in status attainment. Similarly, Henretta and Campbell (1978) suggested that the stratification literature ignored measures of wealth even though most sociologists saw wealth as an important source of power. Anticipating this line of reasoning, Blau and Duncan (1967:191) had already presented a defense of their own approach: “[I]nclusion of other family background variables may lead to some reinterpretation of how the effect of such variables is transmitted, or of what is their relative importance, but it will not alter greatly our over-all estimate of the importance of variables of this kind.” Half a decade later, it is still an open question whether analyzing wealth as a dimension of socioeconomic background contributes unique and significant explanatory power to our understanding of the intergenerational status attainment process.
What Is Unique about Wealth?
Wealth differs from other components of family background components used to study attainment inequality—such as parents’ education, income, and occupation—in that it has a higher degree of permanence: wealth tends to capture advantages generated many generations back and thus most strongly incorporates the history of prior inequality and social exclusion (Oliver and Shapiro 1995). Wealth is different from other background factors, particularly income, in several ways. Wealth is not directly tied to work in a given period and therefore not directly determined by episodes of unemployment or illness (even though one may consume wealth to overcome such hardships) or by preferences for leisure (Spilerman 2000). Wealth is also often taxed more favorably than income, and can, to some extent, be consumed without being lost, for instance in the case of housing wealth (Spilerman 2000).
More important, wealth is more highly concentrated at the top compared to income, and top wealth-holders and top earners are not always the same individuals. In fact, the very top of the wealth distribution is often not inhabited by the highest income earners, because the truly wealthy do not need to work (Keister 2014). Wealth may thus be a much more relevant measure to identify economic elites. On the other end of the scale, wealth—unlike most forms of income—can be negative in the form of net debt. Finally, in Weberian terms, wealth captures not only the class or market dimension of inequality, but also the status dimension that entails social prestige and admiration, that is, Weber’s concept of “Stand.” Overall, wealth may not only be a different, but also a more encompassing, indicator of inequality.
Family Wealth and Children’s Education
The intergenerational literature on wealth largely focuses on transfers of wealth itself and how individuals tend to use these transfers (as reviewed in Spilerman 2000). The effects of wealth on other outcomes, such as children’s education, have been studied less frequently. One of the earliest contributions by Rumberger (1983) found that parents’ wealth is associated with children’s education net of other measures of socioeconomic background. Conley (2001) provided evidence on substantial and independent associations between parents’ wealth and children’s college attendance. Several other studies on the United States document a substantial association between parents’ wealth and children’s educational achievement (Orr 2003; Shanks 2007; Yeung and Conley 2008) or attainment (Axinn, Duncan, and Thornton 1997; Belley and Lochner 2007; Conley 2001; Morgan and Kim 2006; Pfeffer 2011). Strong wealth effects on educational attainment have also been shown in late-industrializing countries, such as Brazil, Chile, India, and Mexico (Filmer and Pritchett 2001; Torche and Costa-Ribeiro 2012; Torche and Spilerman 2006, 2009). Because developing economies often have labor markets with high economic volatility, weak or nonexistent social safety nets, and limited access to credit, even low levels of wealth may constitute a crucial economic resource that allows families to invest in children rather than relying on them to work for financial support. In comparison, one might assume more limited wealth effects on education in developed countries, given higher overall incomes and the availability of public welfare programs and public education. Nonetheless, wealth has also been shown to matter for educational attainment in post-industrial countries with extensive welfare systems and state-funded education (Pfeffer and Hällsten 2012).
Cesarini and colleagues (2015) provide a critique of the potential causal role of parental wealth for children’s education. They use lottery wins as a source of exogenous variation in wealth in Sweden and find that parents’ lottery wins have no effects on children’s educational outcomes. 1 They suggest that “the correlations observed in developed countries between . . . parental income and children’s outcomes do not reflect a causal effect of wealth” (Cesarini et al. 2015:4 [italics added]). We interpret their findings as strong evidence that Swedish families do not face economic constraints for educational participation, which may be unsurprising since education is tuition-free at all levels in Sweden. However, although lottery-won wealth is clearly exogenous (conditional on lottery participation), lottery wins may not establish the same social conditions that come with wealth accumulated and passed down over generations, such as the reinforcement of social norms related to wealth (discussed in more detail below). Qualitative research shows that inherited wealth—presumably unlike lottery wealth—carries a broader meaning than just its monetary value, namely, it is perceived as a status transfer in the form of a long-term loan with clear limitations on how it should be spent (Schaeffer 2014). Of course, neither inherited nor accumulated wealth lend themselves to a social experiment.
Some scholars posit that family wealth, as well as other socioeconomic characteristics tied to children’s outcomes, are just genetic effects in disguise. Black and colleagues (2015) recently negated this view: comparing intergenerational wealth correlations across adopted and biological children in Sweden, they found substantial correlations for adopted children for whom a biological link is missing. In fact, the wealth correlation was even stronger for adopted children than for biological children. That is, growing up in a wealthy environment has long-term effects that dwarf genetic factors.
The Importance of Grandparents’ Wealth
There are several reasons to focus on grandparents when conceptualizing family wealth. Because wealth reflects historical inequality and advantage accumulated over many generations, examining only parents is too limited and would downwardly bias our assessment of the importance of wealth. Furthermore, for a large share of the sample studied here, their grandparents were still alive during their teenage years, meaning that wealth transfers to parents had not yet occurred in full. This highlights the challenge in measuring wealth that may not yet have been passed down from the prior to the current parent generation. An exclusive focus on parents’ wealth thus underestimates a family’s wealth potential (Pfeffer and Killewald 2016a).
A small number of studies have begun to consider the role of multigenerational wealth effects on children’s educational outcomes. Møllegaard and Jaeger (2015) found that grandparents’ cultural capital (measured as their education and cultural participation) is associated with grandchildren’s schooling, but grandparents’ economic and social capital is not. However, in their available measures of economic capital, Møllegaard and Jaeger could draw on only a limited indicator of wealth (owning a summerhouse). 2 Adermon and colleagues (2015) found that education can account for a fifth of the intergenerational (parent-child) wealth persistence in Sweden, and a third of the multigenerational (grandparent-child) wealth persistence (see their Table 7). Similarly, Pfeffer and Killewald (2016a) found that education accounts for a quarter of the parent-child wealth correlation in the United States, but nearly half of the grandparent-child wealth correlation. Both studies suggest that education is an important factor behind the multigenerational effects of wealth, complementing direct transfers. In line with these findings, we expect wealthy origins to have a profound impact on inter- and multigenerational mobility processes, in particular through their impact on children’s education.
Wealth Mechanisms
Family wealth can exert intergenerational influences in many ways. We will briefly present three possible mechanisms that may explain the effects of family wealth on offspring’s educational outcomes. Our empirical analyses are not designed to sharply distinguish among these pathways or determine their relative importance. Instead, we make a case for the general significance of these mechanisms and the fact that their particular importance depends on institutional and macro-social contexts. The next section then details the Swedish context and hypothesizes the likely relevance of the mechanisms resulting from it.
The purchasing mechanism
The most intuitive function of wealth in intergenerational processes is that it allows the purchase of various goods and services, including those that support learning and educational success. The primary purchasing function is the investment by which students can attend schools with tuition fees. In a country like the United States, this may be the purchase of a home in a neighborhood with high-quality public schools (Owens 2016), the purchase of private secondary education, or the reduction of credit constraints to access costly higher education (Lovenheim 2011; Pfeffer 2011). Home ownership—a major part of a typical household’s wealth portfolio, and which is often aided by intergenerational wealth transfers (Spilerman 2004)—can be crucial in providing a safe and stable learning environment for children (Conley 1999; Solari and Mare 2012) and serve to reduce behavioral problems in children (cf. Spilerman and Wolff 2012).
The scope of the purchasing function likely varies by national context and depends, in particular, on the extent to which education and out-of-school academic support is paid for privately, the strength of gradients in schooling quality in neighborhoods of different affluence, and the direct costs of higher education.
The insurance mechanism
Apart from the actual use of wealth—as implied by the purchasing function—another mechanism for the intergenerational effect of wealth may be the potential for its use. As Spilerman (2000) points out, wealth need not be consumed to be an effective resource. It has a latent function that provides insurance for various types of failures, for instance, by substituting income losses or smoothing career disruptions, thereby reducing the impact of uncertainty by substituting for income (Pfeffer 2010; Pfeffer and Hällsten 2012). With wealth-provided insurance, the potential cost of risk-taking behavior is lower. 3 Wealth’s insurance against risk may allow families’ educational decisions to be guided more by children’s strengths and interests than by external constraints, thereby fostering children’s unique abilities and skills. Wealth may also allow children greater opportunity to identify their unique abilities, for instance, by enabling them to enroll in higher-education programs without the immediate constraints created by economic calculations of expected human capital investment returns.
As Pfeffer and Hällsten (2012) argue, the scope of wealth’s insurance function is likely dependent on the extent of the public insurance system. For instance, a public system of generous unemployment insurance may make the need for additional wealth-based insurance against career disruptions unnecessary. However, even the most advanced welfare states cannot give complete insurance against life course risks, and especially not against the risks involved in continuing one’s education beyond the minimum required school attendance. That is, wealth will always provide at least supplementary insurance, even in the most developed welfare-state contexts.
The normative mechanism
The third channel of intergenerational influence of wealth goes through its role in fostering pro-education norms. A baseline assumption is that because wealth is associated with power and privilege, families strive to secure this advantage for their descendants (Thurow 1975). Our argument is that because, in modern society, the intergenerational stability of elite social positions is not prima facie guaranteed, families with wealth may emphasize higher education as a way to increase their descendants’ ability to preserve family wealth, either by their own socioeconomic success or by their skillful management of dynastic wealth. The idea that education is one instrument by which advantaged groups reproduce their advantage has a long history in sociological thought (Collins 1971; Parkin 1979), but analyses of the reproduction of economic wealth through education are few and typically focus on the very top of the distribution, for example, on elite schooling (Bourdieu 1998; Khan 2011; Levine 1980).
Here we argue that the normative channel through which family wealth and education are connected extends beyond elite positions—that the presence of family wealth at levels far below those required for elite closure may foster a belief in higher education as a conventional goal. That is, by sustaining socialization into the idea that further education is possible, even moderate family wealth may create a sense of educational entitlement (Conley 1999, 2001). 4 We also add that families of more moderate wealth levels may foster pro-education norms out of instrumental motivations, similar to how the wealthiest families may invest in their eventual heirs’ asset management capacities: moderate wealth can dissipate quickly in the next generation if it is consumed during periods of unemployment (see Spilerman 2000). Educational success facilitates access to more stable employment and income flows, as well as to marital partners with similarly stable employment and income prospects. Thus, fostering normative orientations toward education is a rational strategy for the intergenerational preservation of even moderate wealth.
The effects of pro-education norms materialize in the form of a desired educational destination (degree), but those educational destinations are predetermined by previous educational achievement (test scores, GPAs) that make them realistic goals (Morgan 2005). That is, pro-education norms feed into higher ambitions for educational attainment and, by doing so, create higher educational achievement.
Finally, we believe that the scope for the normative mechanism also depends on broad, macro-economic contexts, namely the degree of fluidity of the economic and social structure in terms of overall levels of intergenerational status reproduction (social mobility), the volatility of the economic system, and the stability of institutions that defend property rights. The need for status reproduction via education should be highest in societies that are fluid in these aspects. The same holds for a society that is widely perceived as fluid by its members and the resulting perceived need of status reproduction via education. Because the forces mentioned affect not only—and likely not even primarily—elites but also the rest of the distribution, we consider the normative power of wealth for status-maintenance through education an explanation with population-wide relevance in fluid societies.
The Swedish Context
We study Sweden, a small country with advanced welfare-state capitalism and a long tradition of redistribution and egalitarian policies. Its income distribution is one of the most equal in the industrialized world (Gottschalk and Smeeding 2000): the Swedish welfare state provides comparatively extensive benefits to disadvantaged groups in society, and unionism and collective bargaining are influential in setting workers’ wages and benefits (Alexopoulos and Cohen 2003). Whether Swedish wealth inequality is also comparatively low has been debated. Findings from the mid-1980s tend to suggest a comparatively low level of wealth inequality in Sweden, for instance compared to the United States (gini coefficient of .59 versus .79, respectively; Davies and Shorrocks 2000), although in absolute terms, wealth inequality still far exceeds income inequality in Sweden. More recent international comparisons of wealth inequality show Sweden to be marked by the highest levels of wealth inequality in the industrialized world (Jäntti, Sierminska, and Smeeding 2008). In part, this finding can be explained by the fact that wealth data typically fail to capture public pension entitlements (Domeij and Klein 2002), which—thanks to Sweden’s strong public pension system—are distributed much more equally than wealth held in private pension accounts. We therefore side with the conservative conclusion that levels of wealth inequality in Sweden are at least not exceptionally low compared to other developed countries. But we do note that the incentives for wealth accumulation in Sweden are relatively low given the public provision of not only pension benefits but also education. With reduced necessity to save for old age and for one’s children’s education, private wealth portfolios may be even more reflective of permanent long-term inequality than in other nations, and less reflective of parental preferences (for savings for old age and direct investment in children’s education), making our analysis a particularly strong test of wealth effects.
Sweden levied a wealth tax of up to 4 percent of total wealth holdings per annum, relatively high in international comparison, before it was abolished in 2007 (Rietz and Henrekson 2015). Despite this tax, an unequal wealth distribution prevailed. Note that social democratic reforms in Sweden from the 1930s onward have typically not been aimed at challenging the capitalist class, but rather occurred through collaboration, although this collaborative spirit has been romanticized in retrospective accounts (Lundberg 1985).
Schooling in Sweden is not only free at all levels, elementary through university, but also nearly completely standardized. The complex and divided educational pathways found in other systems have been abolished, and there is a national standardized curriculum. Non-tracked elementary school is mandatory until grade nine or, usually, age 16. The three-year upper-secondary school is tracked, primarily between academic and vocational fields. The vocational tracks are general in character, without the strong connection to the labor market typical for apprenticeship systems, like that of Germany. Admission to upper-secondary school is based on relative rank in terms of 9th-grade GPA and a fixed number of school vacancies, and the same principle applies for tertiary education. That is, the idea that determinants of students’ early efforts to achieve largely predetermine later educational choices (Morgan 2005) fits the Swedish case well, because prestigious, academic tracks are mostly inaccessible to students with poor grades. All academic tracks, on the other hand, grant basic eligibility for tertiary education.
Standardized education used to mean that students were assigned to schools exclusively by proximity, creating a tight bond between neighborhood and school segregation. Since the 1990s, this bond has loosened. In 1992, the free schooling reform introduced the possibility of school choice and “free schools” that are publicly funded but privately run, much like charter schools in the United States (Björklund et al. 2005). Admission to these schools is based on queues, which means that engaged (and privileged) parents who choose schools well before their children are school-age have an advantage in utilizing school choice. This reform came into effect gradually, but school choice is now widespread. By 2012 (when the last of our analyzed cohorts graduated from elementary school), around 15 percent of students at the elementary level and 25 percent at the upper-secondary level went to free schools. As a consequence of school choice, but also increased neighborhood segregation, sorting on achievement across schools has steadily increased, yet the influence of family background on achievement at the elementary level has remained stable over time (Holmlund et al. 2014).
Although we are not able to neatly separate the effects of the three hypothesized mechanisms underlying the importance of family wealth for education, we can now make some predictions about their relative contributions in the case of Sweden. First, because education is free at all levels, the purchasing function of wealth is likely of limited scope, especially in comparison to its likely impact in other countries where monetary constraints to educational access are much higher, such as the United States. Similarly, the importance of wealth for obtaining out-of-school academic support is comparatively limited in Sweden, especially in comparison to countries like the United States that have a strong “shadow education” sector (Baker et al. 2001; Buchmann, Condron, and Roscigno 2010). The public funding of education is complemented by Sweden’s regulated rental markets and overall high housing quality, limiting the potential influence of home-ownership wealth on children’s education. Affluent neighborhoods are sites of high-quality schools and highly motivated peers in Sweden, too, but the standardized education system and comparatively low level of economic segregation lead us to expect the purchasing function of homeownership will be relatively weak and—to the extent it exists—mediated by school characteristics.
Second, although Sweden generally offers extensive public insurance plans, private insurance against remaining risks is still present and, in the Swedish case, likely more important than the purchasing mechanism. The decision to enroll in university—and with it all development and preparation in earlier grades—still incurs the risk of potential non-completion and lost opportunity costs, which the Swedish system—nor any other system—cannot insure against (for more detail, see Pfeffer and Hällsten 2012).
Third, the normative mechanism may be particularly significant in accounting for the intergenerational influence of family wealth on children’s education in Sweden. Overall, Sweden is a rather fluid society. As a small open-market economy, it is dependent on trade and has a long tradition of economic restructuring to adapt to changing market influences (Alexopoulos and Cohen 2003). These factors have broad implications for the function of wealth beyond economic elites: a more fluid society, like that of Sweden, puts a higher premium on education to maintain advantaged positions and avoid social degrading across the distribution.
Data and Methods
Data and Sample
The data for our analyses are drawn from Swedish administrative registers. The Swedish multigenerational register contains population-wide links between children and their parents and grandparents based on birth and adoption records. We merged data from this register on individuals in cohorts born between 1980 and 1996 to information on their parents’ and grandparents’ education, occupation, employment, and income via school registers, tax registers, occupation registers, and censuses, and to their parents’ and grandparents’ wealth via the Swedish Wealth Register that existed from 1999 through 2007. We also merged information on fathers’ cognitive and non-cognitive skills from mandatory military enlistment records.
Our data are for the entire Swedish population with two exceptions. First, not every individual had traceable grandparents, largely because of immigration (i.e., their grandparents were not Swedish residents), and a few cases had exceptionally long generational spacing, such that the death of grandparents occurred before we could observe them in the registers. We could identify the grandparents of 84 percent of members of the birth cohorts in our data. But when we restricted the sample to Swedish-born children with Swedish-born mothers, this figure rose to 99.9 percent. Of these identified grandparents, 92 percent were alive between 1999 and 2007, allowing us to observe their wealth. Thus, our data cover families with non-immigrant origins and normal generational spans. The second limitation in our data is that not all fathers in the sample completed Sweden’s mandatory military enlistment, leading to a loss of another 20 percent of the analytic sample. However, sensitivity analyses (available upon request) reveal that our results are stable across subsamples with and without enlistment matches for fathers, suggesting bias to be negligible.
Variables
Outcome variables
The educational outcomes we use are GPA from 9th grade, which is the final year of mandatory education, and graduation from an academic program in upper-secondary school, which prepares students for college, measured as a dummy variable (yes/no). Both measures are collected from school registers. We transform GPAs to ranks within each graduation year using the cumulative distribution function. This variable thus represents each child’s relative position in the distribution of educational performance, bounded by 0 and 1. 5
Family wealth
Our key independent variables are various measures of family wealth, collected from the Swedish Wealth Register (1999 to 2007), which contains detailed information on various types of financial and real assets and debts. Register information on wealth is primarily based on tax records, but complemented with reports from financial organizations such as banks and estate registers. In 2008, the Swedish wealth tax was abolished (the gift tax and inheritance tax had been abolished in 2005); as a result, 2007 is the last year for which these wealth data are available. We measure wealth for parents and grandparents on both the matrilineal and patrilineal side, assessments not generally available in previous multigenerational research.
We construct two sets of wealth measures. First, we compute net worth as total wealth minus total debts. Second, we decompose wealth into financial wealth, net home wealth, and net real wealth. Financial wealth consists of cash, stocks, bonds, and other financial instruments that rarely serve as collateral—that is, debt is rarely held against them—which is reflected in a rather low correlation between financial wealth and debt (see Appendix Table A1). We divide wealth not held in financial assets into net home wealth, that is, the net value of owner-occupied housing, and net real wealth, that is, real estate property, such as summer houses, and other highly priced assets like cars and jewelry. We observe the value of owner-occupied housing and other real estate properties in tax registers that, fortunately, also include the market value of homes, rather than only the taxed value of these assets (the latter would severely underestimate home wealth). In contrast, other highly priced assets—such as cars or valuable collections—are self-reported to the tax authority (because there is no administrative register for such items). As a consequence, any potential reporting bias likely in survey-based wealth measures will also apply to our measure of net real wealth, affecting this measure more than the other wealth components.
We measure both housing and real wealth net of debt. Although we cannot directly observe the type of debt and the asset against which it may be held, we know that the vast majority of debt held by Swedish households is in the form of mortgages or home equity-based lending. Unsurprisingly, debt is more highly associated with home values than any other asset component (especially for parents but also for grandparents; see Appendix Table A1). We therefore subtract debts from gross home values to obtain net home wealth. When debt is in excess of the value of the owner-occupied home, we set net home wealth to zero and subtract the remaining debt from gross real wealth, yielding net real wealth. As a result, net real wealth can be negative, whereas financial and home wealth is zero or larger. Appendix Table A2 shows the distribution of wealth for both parents and matrilineal grandparents.
Although wealth holdings may be marked by less volatility than annual income streams (see Solon 1989), wealth is exposed to other sources of volatility, such as stock market or housing market volatility. We seek to reduce attenuation bias in our estimates by averaging across all available years in the wealth registers (1999 to 2007). The correlation between these averaged wealth measures and their respective one-year versions is between .85 and .95, suggesting that the attenuation bias in one-year measures would have led to an underestimation of the association between wealth and our outcomes. Because wealth is recorded at the individual rather than the family level, we compute wealth measures for parents by taking totals over mothers and fathers, and for grandparents by taking totals over grandmothers and grandfathers across both lineages (i.e., a total of maternal and paternal grandparental wealth).
We conducted specification searches to test various functional forms of family wealth. Our preferred specification, reported here, uses ranks of each underlying continuous covariate (the cumulative distribution function bounded by 0 and 1).
Other socioeconomic characteristics
A competing explanation for associations between family wealth and educational achievement is that they reflect other dimensions of family socioeconomic standing and characteristics. We therefore include extensive and high-quality controls for both parents’ and grandparents’ education, occupation, and income, as well as parents’ employment and father’s cognitive ability and non-cognitive skills.
Swedish administrative data on education are comprehensive and date back to the 1970s. We know from previous studies using those data that measures of educational attainment should not be reduced to either educational level or educational field (Hällsten 2013). The Swedish educational nomenclature (SUN 2000) is very specific and allows us to combine educational levels and fields (coded to the European standard ISCED-97, see Statistics Sweden 2005) to observe specific degrees (e.g., a bachelor’s degree in economics). To capture the complexity of educational level and field while maintaining parsimony, we follow prior research (Björklund and Sundström 2006) in using an aggregate variable of “educational value,” regressing children’s GPA on fixed effects for unique combinations of parents’ educational level and field codes. The resulting predicted GPA provides a unidimensional measure of parents’ educational characteristics that are relevant to children’s GPA. We use the same assignment process for grandparents’ education.
To capture parents’ and grandparents’ occupations, we use three-digit International Standard Classification of Occupations (ISCO-88) codes from occupation registers and five-digit codes from the Nordic Standard Occupational Classification (NYK85) from censuses. We compute an aggregate “occupational value” following a process like that used to assign “educational value” (regressing child’s GPA on parents’ occupational codes as fixed effects and using the resulting predicted GPA as a unidimensional measure that reflects parents’ occupational characteristics relevant to children’s GPA). We observe disposable individual income and average it between 1968, the first year of population income data, and 2012, restricting the data to ages 18 to 65. In other words, we draw on an unusually exhaustive measure of permanent lifetime income. In addition, we use tax registers to capture parents’ non-employment (approximated through exceptionally low annual market earnings), averaged between 1980 and their children’s 19th birthday. Non-employment of parents is coded as earnings below 10,000 Swedish Krona (SEK) per month (which is a bit stricter than the method used by Erikson and colleagues [2007] in their study of labor market entry for youths).
The aggregation rule for each socioeconomic characteristic is as follows: for educational and occupational values, and non-employment, we take the mean value over parents and both lineages of grandparents. For disposable individual income, we take the sum over parental and both grandparental pairs (like we did for wealth).
For fathers, we also draw on mandatory military enlistment registers to link information on cognitive ability (assessed by a formal test, see Carlstedt and Mårdberg 1993) and non-cognitive skills (assessed by a psychologist, see Mood, Jonsson, and Bihagen 2013). These measures of cognitive ability and non-cognitive skill are powerful predictors of educational performance and labor market outcomes (Lindqvist and Vestman 2011).
To capture the effects of children’s elementary school contexts, we construct school-level aggregates of the proportion of foreign-born students, parents’ average educational values, and the school’s wealth concentration (measured as an additive index of financial, home, and real wealth, as defined above, among grandparents and parents; Cronbach’s α = .93), as well as a dummy for attending a free school, which are often more socially selective. Table 1 provides a list and descriptive statistics for all variables used in the analyses. We transform all continuous variables into ranks using the cumulative distribution function (which is bounded by 0 and 1). As a consequence, our models resemble the percentile rank regressions used by Chetty and colleagues (2014) in their study of income mobility in the United States.
Descriptive Statistics
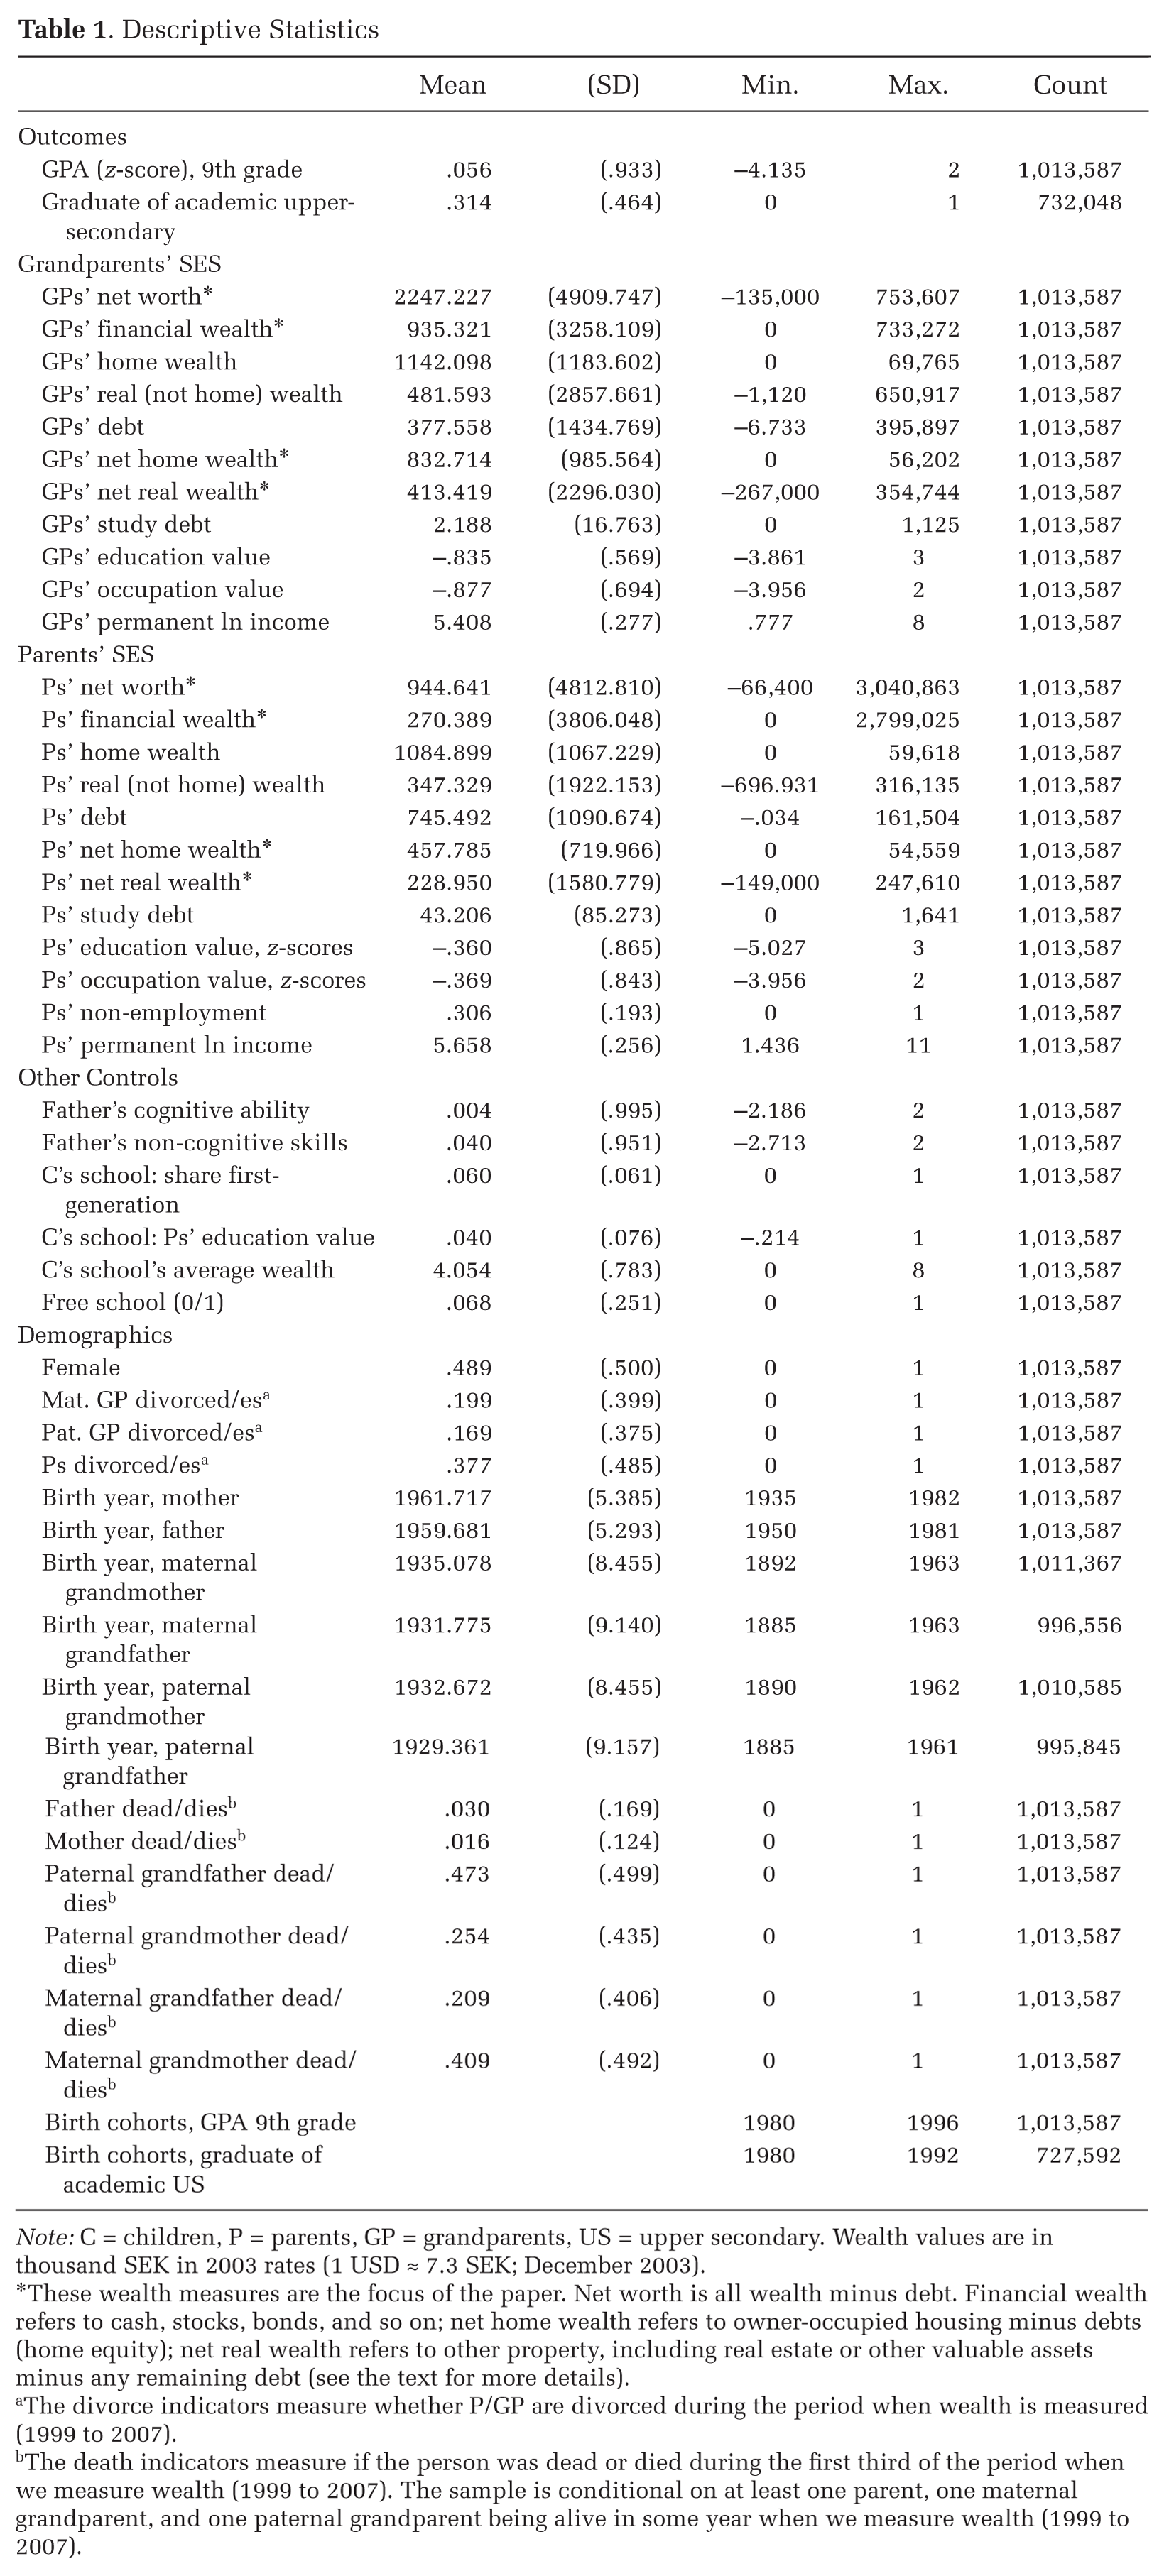
Note: C = children, P = parents, GP = grandparents, US = upper secondary. Wealth values are in thousand SEK in 2003 rates (1 USD ≈ 7.3 SEK; December 2003).
These wealth measures are the focus of the paper. Net worth is all wealth minus debt. Financial wealth refers to cash, stocks, bonds, and so on; net home wealth refers to owner-occupied housing minus debts (home equity); net real wealth refers to other property, including real estate or other valuable assets minus any remaining debt (see the text for more details).
The divorce indicators measure whether P/GP are divorced during the period when wealth is measured (1999 to 2007).
The death indicators measure if the person was dead or died during the first third of the period when we measure wealth (1999 to 2007). The sample is conditional on at least one parent, one maternal grandparent, and one paternal grandparent being alive in some year when we measure wealth (1999 to 2007).
Other controls
We include birth year dummies for all generations (the earliest observed year within parent and grandparent pairs) in the baseline specification to avoid confounding life-cycle differences in wealth with age effects, a biasing factor extensively discussed in the wealth literature in economics. In practice, these controls matter very little over and above children’s birth year: 6 within the birth cohorts studied here (1980 to 1996), the variance in age of parents and grandparents is limited and may therefore produce limited bias. We also measure divorce among parents or grandparents during the period of observation using separate dummies for each spousal pair. We include dummies capturing whether any grandparent died or was dead between 1999 and 2002, because grandparents’ death may capture whether wealth was transferred to parents. This control had only marginal effects on our results.
Intergenerational wealth effects may be confounded by geographic variation in wealth and schooling outcomes, and home wealth—a major source of wealth—shows vast variation across local areas in Sweden. However, sensitivity analyses that used municipality dummies for all generations to capture geographic home price variation had virtually no impact on the results (not shown).
Analytic Strategy
We measure family wealth as parents’ and grandparents’ wealth. Our analytic focus, however, is on grandparents’ wealth. Besides the substantive importance of a multigenerational perspective, the focus on grandparents’ wealth carries several advantages in terms of reducing concerns about unobserved bias. Potential claims about unobserved heterogeneity driving intergenerational wealth associations often refer to differential savings behaviors and future orientations that affect both parents’ wealth accumulation and their children’s educational success. We argue that the Swedish context should minimize the importance of these factors, but these claims nonetheless compete with the social mechanisms we hypothesized to explain the effects of family wealth on children’s educational outcomes (purchasing, insurance, norms). Our focus on grandparents’ wealth affords us the ability to control for unobserved factors of the extended family, namely by comparing cousins in what we call the cousin fixed-effects (FE) approach. This design compares cousins from the same patrilineal stem who are exposed to different levels of matrilineal wealth. We focus on the effect of matrilineal grandparents’ wealth, but our grandparents’ wealth measure sums the wealth of both lineages. Thanks to this approach, we capture the full effect of maternal grandparents’ wealth, and a part of the paternal grandparents’ wealth effect. In Part A of the online supplement (http://asr.sagepub.com/supplemental), we explain in more detail why this approach continues to capture most of paternal grandparents’ wealth information. 7
The cousin fixed-effects approach is advantageous partly because it is not available in the study of two-generational influences. Estimating the effect of maternal wealth while conditioning on paternal fixed effects (or vice versa), that is, a sibling fixed-effects approach, would require some within-family variation in maternal (paternal) wealth. That variation would typically arise from significant spacing in sibling births, and the family experiencing a sudden wealth increase or decrease that affects only the younger sibling. In other words, the effect would be identified based on a quite select sample.
In addition to some specific methodological concerns faced by our cousin fixed-effects strategy (addressed in Part A of the online supplement), we note a broader methodological concern about grandparents’ wealth effects and three-generational effects in general: unmeasured parent characteristics and measurement error in observed parental characteristics tend to attenuate parent effects and increase grandparent effects, upwardly biasing the latter. In response to this concern, we took considerable care in measuring a wide range of parental control variables with as little measurement error as possible using unusually long time-spans—for instance, full lifetime incomes. Measuring income across the entire life course should also better capture savings behaviors, because the two are closely associated (Dynan, Skinner, and Zeldes 2004). With an accurate estimate of the total accumulated income flows that can be converted into a stock—that is, with controls for the true permanent incomes for grandparents and parents—we can net out a great deal of saving behaviors.
Finally, our focus on grandparents should reduce some remaining concerns about endogeneity in the effects of family wealth on children’s educational outcomes. In particular, some researchers may be concerned about reverse causality, according to which children’s educational outcomes affect families’ wealth accumulation. For example, information on children’s educational performance early in their schooling careers may trigger parents to accumulate more assets (e.g., if children’s high performance motivates parents to save for their college careers) or draw down on their existing assets (e.g., if children’s low performance is driven by behavioral problems that limit parents’ possibilities of market work). These alternative narratives of reversed causation—whether they are convincing or not—apply to parents’ wealth. Grandparents’ wealth, in contrast, is less likely to confront the same concerns to the same degree: grandparents’ wealth has largely been accumulated before the signals of their grandchildren’s early educational performance emerge, making the temporal ordering of our variables somewhat clearer than for the two-generational case.
In summary, while we expect educational outcomes to be more weakly associated with grandparents’ wealth than with parents’ wealth, based on our arguments and the empirical identification strategy described, we consider the association between education and grandparents’ wealth to be less subject to endogeneity bias and thus potentially more reflective of the three hypothesized wealth mechanisms.
Methods and Models
We begin by estimating linear models (OLS and FE), including for outcomes that are discrete (0/1). For our analysis of graduation from academic upper-secondary schools, we use linear probability models (LPM) where the coefficients are interpreted as a change in probability (as Mood [2010] shows, logistic regression coefficients are not comparable across models due to scaling issues). In practice, LPM coefficients are often very similar to average marginal effects (AME) from logistic regressions (i.e., the marginal effect evaluated over all covariate combinations that exist in the sample). We computed AMEs to corroborate our results, and the AME and LPM are close to identical in all our models (results available upon request). Our models use robust standard errors clustered on patrilineal grandparents. We test for differences in the wealth effect across models to assess the statistical significance of confounding or mediation. 8
In addition to the OLS and FE models, we also apply marginal structural models (MSM). Most studies of intergenerational mobility are guided by the two-stage Markovian paradigm, in which intergenerational transmission occurs in independent sequences between two generations (i.e., from grandparents to parents and from parents to children, but not from grandparents directly to grandchildren; Mare 2011). A test of the alternative, non-Markovian scenario with direct multigenerational transmission consists of estimating whether an additional prior generation contributes unique explained variance net of two-generational transmission processes. The corresponding test of a direct grandparents’ contribution controlling for parents’ characteristics can, however, downplay the influence of older generations, because some explanatory power that originated in prior generations may be mistakenly ascribed to parents. For example, when studying the effect of neighborhood segregation as experienced by parents and their children on children’s educational achievement, Sharkey and Elwert (2011) show that standard regression estimates that control for variables—such as children’s characteristics—that lie on the causal pathway between parental neighborhood poverty and the outcome lead to underestimation of the total effect of parental neighborhood poverty. Their solution is to rely on MSM (Robins, Hernán, and Brumback 2000) using inverse probability-of-treatment weights (IPTW). We follow this strategy to assess the total contribution of grandparents’ wealth to children’s GPA while simultaneously addressing collider and over-control bias. In essence, we create data where confounders are orthogonal to wealth in each of the parental and grandparental generations using a re-weighting strategy. For a discussion of the technical aspects of MSM-IPTW, see Part B of the online supplement.
Results
Family Net Worth and Children’s Educational Achievement
As a first description of the association between family wealth and educational achievement, Figure 1 reports a non-parametric plot of children’s 9th-grade GPA across different dimensions of socioeconomic background (SES), measured as ranks, for parents and grandparents separately. All SES measures, including wealth, correlate strongly with GPA. On average, children from the bottom quintile of the SES distribution (rank < .2) typically place in the third decile (between the 30th and 40th percentile) of the GPA distribution, whereas children from the top quintile (rank ≥ .8) typically place in the sixth decile. Gradients by grandparents’ SES are flatter, influenced by faster regression to the mean at the bottom: on average, the educational achievement of children from the bottom quintile of grandparents’ SES distribution lies in the fourth decile of the GPA distribution. In line with our expectations, SES gradients are stronger for parents but still quite pronounced for grandparents—this in a country that, for decades, has exerted exceptional efforts to reduce educational inequality.
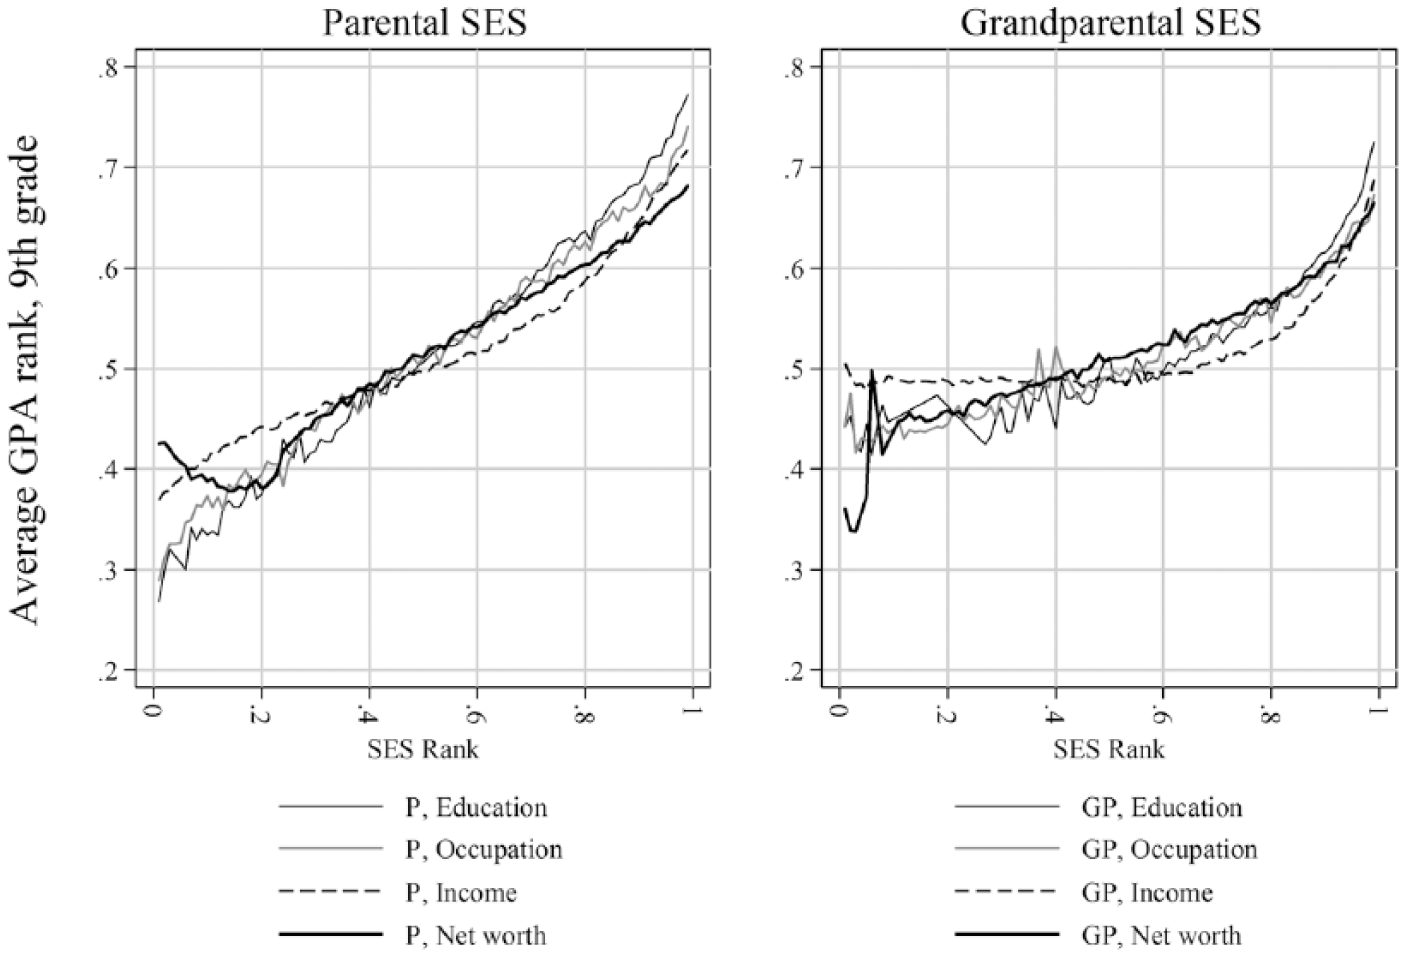
GPA (9th grade) and Dimensions of Parents’ and Grandparents’ SES
With the exception of the very bottom of the distribution, the wealth gradients in achievement found here closely resemble the gradients found for other dimensions of SES, for parents and grandparents. In particular, note that the association between ranks of GPA and ranks of parents’ SES is largely linear, including for wealth. One difference emerges for households in the bottom of the wealth distribution, which—unlike the income distribution—is made up of cases of negative and zero values. Children from these households fare somewhat better in terms of their educational achievement compared to children from the bottom of the distribution of other SES characteristics, reflecting the ambivalent nature of net debt. In some cases, net debt may indicate families’ ability to take out loans, or “productive debt,” and thus does not exclusively capture economic disadvantage. That phenomenon, however, does not extend to the association between GPA and grandparents’ wealth, where the lowest net worth levels are associated with exceptionally low achievement. This may indicate that net debt in former generations overwhelmingly reflects economic disadvantage rather than productive debt. Otherwise, the GPA gradient by grandparents’ wealth again follows the shape of gradients by other SES characteristics, with the more pronounced curvature of the lines indicating that educational advantage accrues faster with rising SES. However, the conclusion that educational advantage is concentrated solely at the very top of the grandparental wealth distribution—that is, multigenerational reproduction is exclusively elite reproduction—is unwarranted. If anything, the association between educational achievement and grandparents’ wealth follows a less exponential pattern than for other SES components, especially income, in which educational advantage is largely concentrated within the top quarter of the distribution.
Figure 2 decomposes net worth into three components: financial wealth, net home wealth, and net real wealth. The gradients in GPA are similarly patterned for parents’ and grandparents’ wealth components, although they are again flatter for the latter. The strongest wealth gradient in GPA emerges for financial wealth, especially in the grandparents’ generation. The home wealth gradient in GPA is similar to that of financial wealth—although, naturally, it does not capture achievement gaps among children of non-owners—and becomes steeper in the top quintile of the distribution, indicating increasing returns to high housing wealth. We observe a somewhat weaker gradient in GPA for net real wealth, that is, real estate, farm lands, and other valuable real assets.
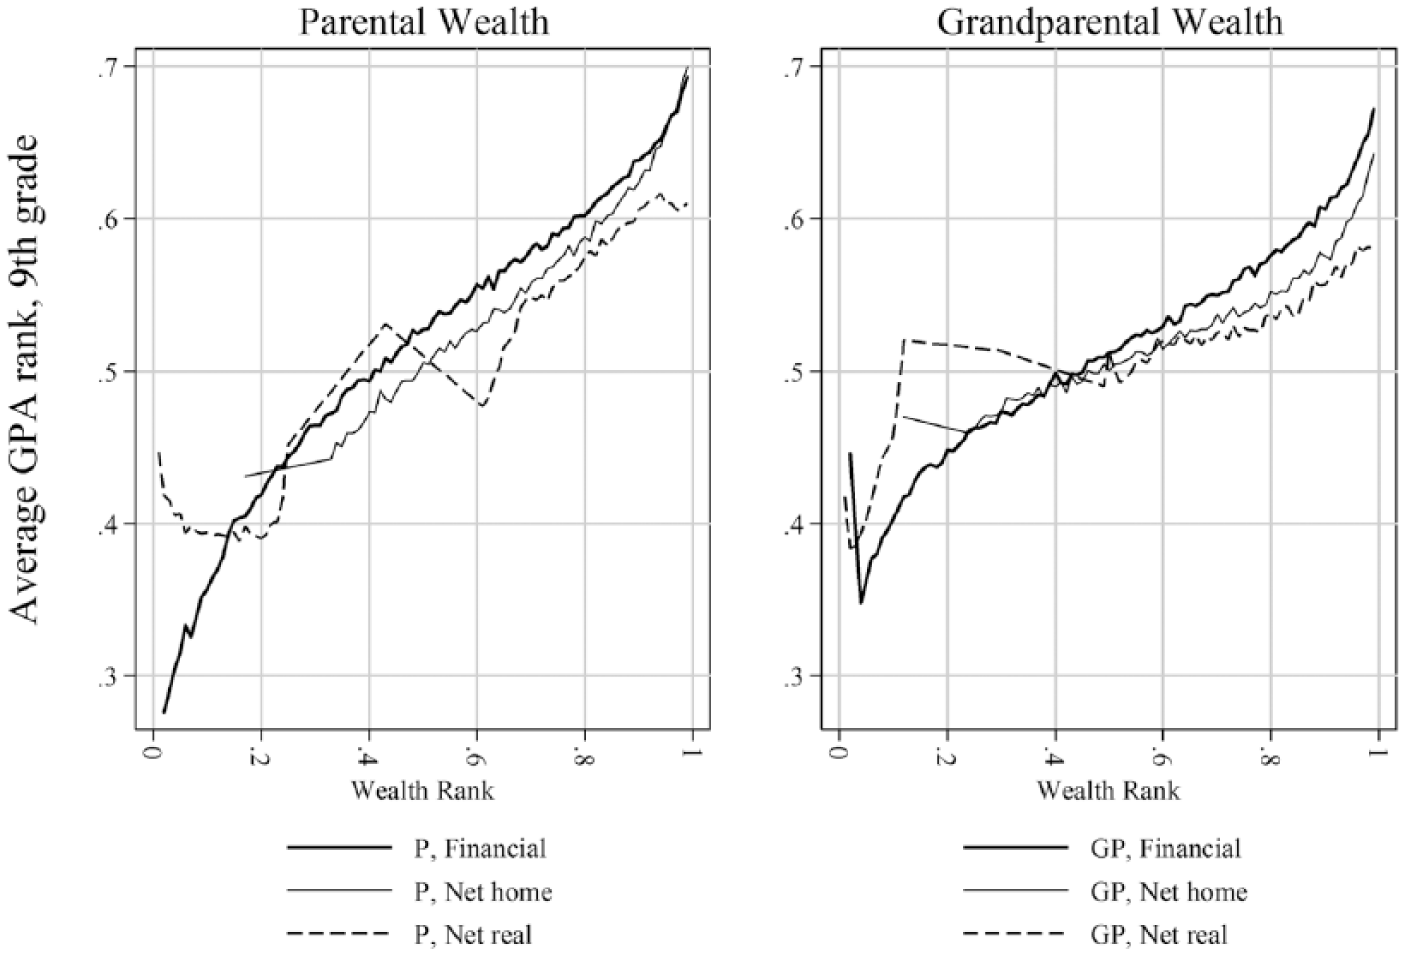
GPA (9th grade) and Wealth Components
Table 2 reports associations between GPA and grandparents’ wealth as estimated in a series of OLS regression models. In Model 1, with only basic controls for demographic differences, we find that the rank-rank slope between GPA and grandparents’ wealth is .23. Thus, for a one-percentile rise in grandparents’ wealth rank, children’s educational achievement rank increases by close to a quarter of a percentile. This association is diminished somewhat by adding further controls for grandparents’ divorce (Model 2) and other socioeconomic characteristics of grandparents, chiefly grandparents’ education (Model 3), and less so grandparents’ occupation (Model 4) and permanent income (Model 5). All the decreases in the coefficients are statistically significant. Notably, in a model that includes all socioeconomic characteristics of grandparents (Model 5), wealth stands out with the strongest independent association with GPA.
Regression of GPA Rank on Grandparents’ Wealth and Control Variables
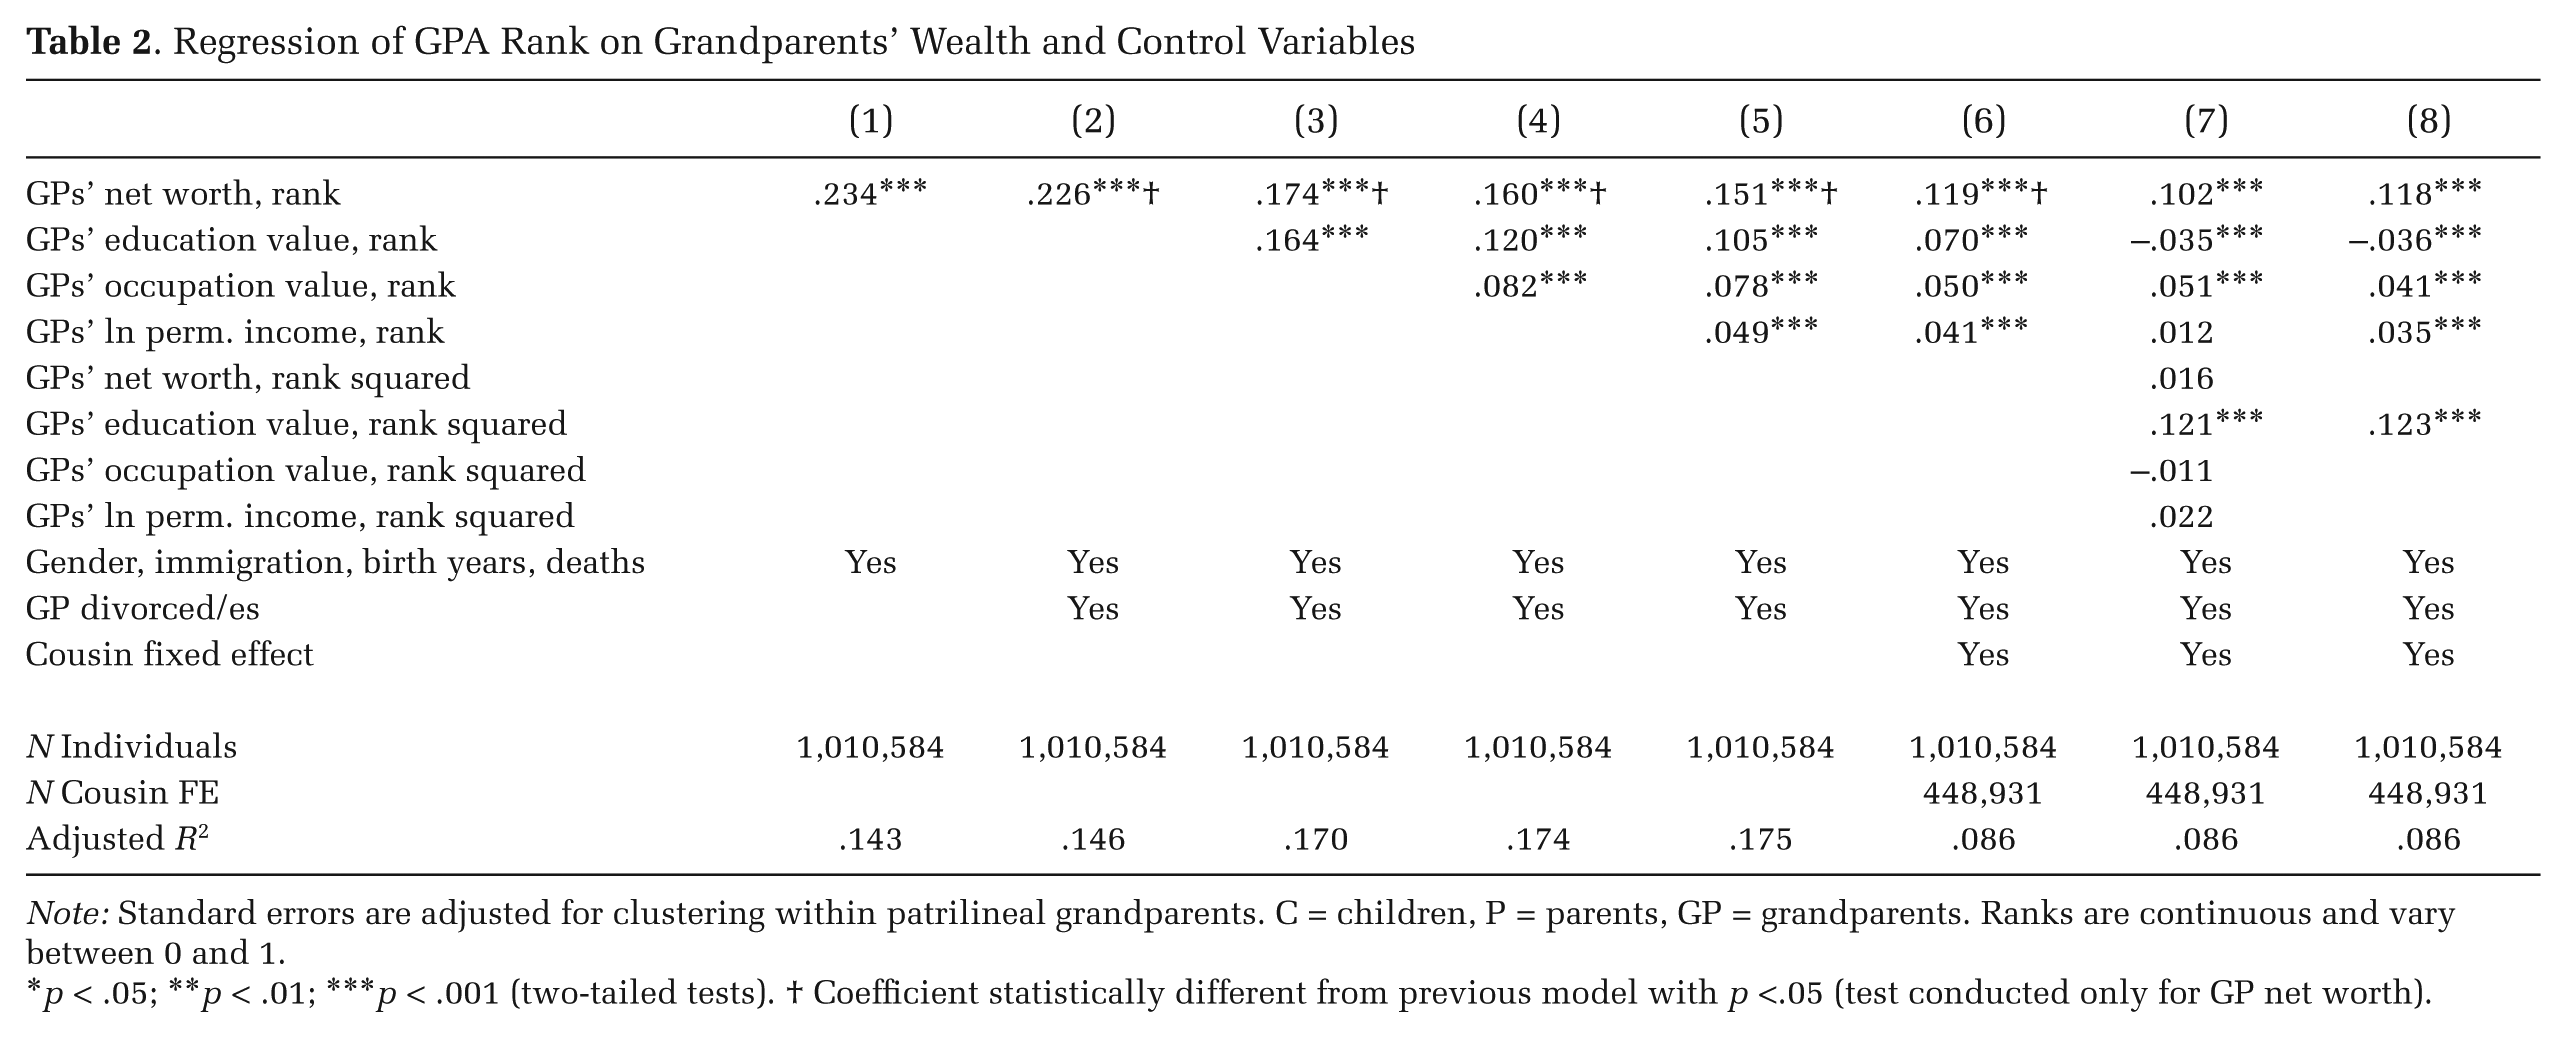
Note: Standard errors are adjusted for clustering within patrilineal grandparents. C = children, P = parents, GP = grandparents. Ranks are continuous and vary between 0 and 1.
p < .05; **p < .01; ***p < .001 (two-tailed tests). † Coefficient statistically different from previous model with p <.05 (test conducted only for GP net worth).
In Model 6, we additionally control for paternal cousin fixed effects in an effort, as described earlier, to account for further unobserved characteristics of grandparents. With this control in place, the association between grandparents’ wealth rank and grandchildren’s GPA rank decreases significantly, from .15 to .12, or by around 20 percent. The association, however, remains substantial: for each percentile rank increase in grandparents’ net worth, children’s GPA rises by .12 percentiles. Strikingly, the wealth coefficient remains the largest among all SES dimensions.
In Model 7, we pay closer attention to the nonlinearities observed in the descriptions of raw associations provided earlier. We capture nonlinearities for grandparents’ wealth and other SES characteristics in a quadratic specification. (We also tested higher-order polynomials and dummy categories; available upon request). The results confirm our earlier conclusion that the educational advantage arising from grandparents’ wealth should not be thought of as purely or even chiefly dynastic reproduction at the very top of the distribution. In fact, in these conditional models, the concentration of educational advantage at the top is much stronger only for grandparents’ education; the quadratic terms for the other SES variables are not significant (given the large power in our models, we are confident that these terms are very close to zero). The grandparents’ wealth association thus follows a linear pattern. The nonlinear association for grandparents’ education consists of a very low, even negative, conditional association in the bottom half of the distribution but a particularly strong one at the top. In fact, the conditional association is even stronger at the top of the educational distribution (grandparents’ education effect of .2079 [= –.0349 + 2 × .1214]) 9 than at the top of the wealth distribution (grandparents’ wealth effect of .1344 [= .1022 + 2 × .0161]). In Model 8, we thus drop the quadratic terms for all variables except grandparents’ education. Our preferred linear wealth effect is estimated to be .12.
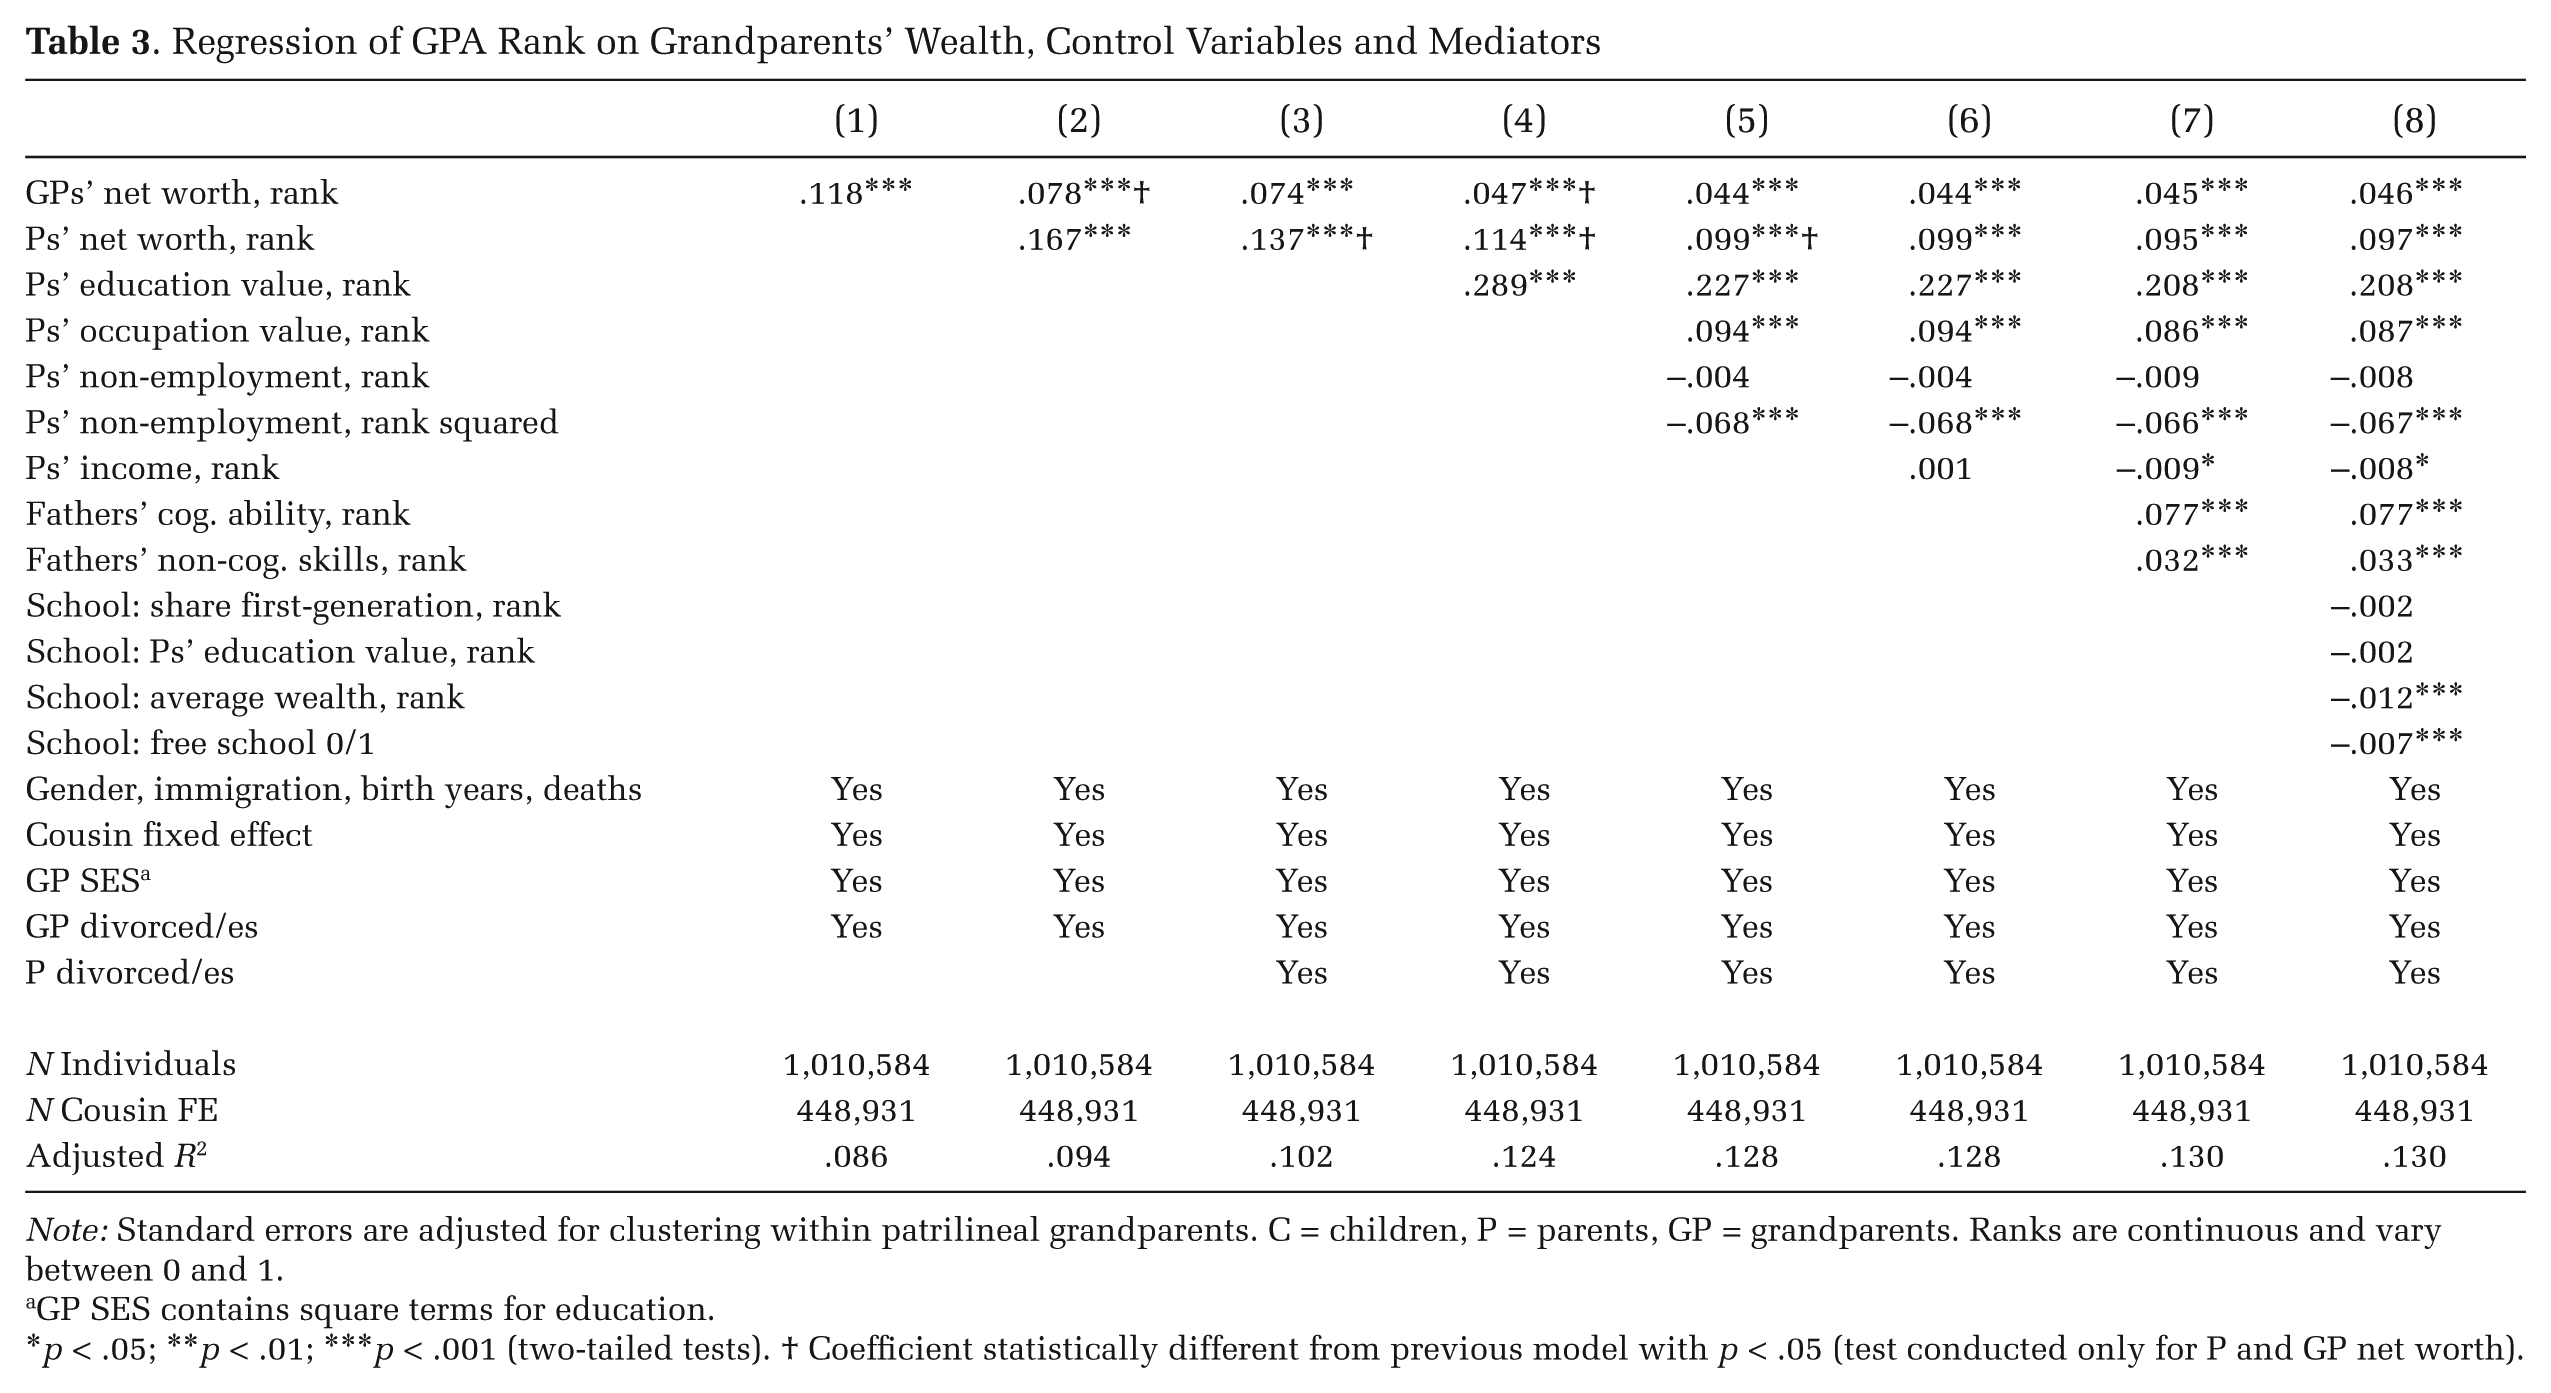
In the next set of analyses, reported in Table 3, we add mediators from the parents’ generation. Here, our specification search suggested a square term for parents’ non-employment as the only detected nonlinearity in the parental associations. For reference, Model 1 repeats the estimates from our final model based on grandparents’ information only (see Table 2, Model 8). In Model 2, we control for parental wealth, which significantly reduces the grandparental wealth association, from .12 to .08, which is about half the size of the direct parental wealth association (.17). Another major and significant drop of the direct grandparental association—to .05—occurs when controlling for parents’ education (Model 4), but both parents’ wealth and grandparents’ wealth associations are remarkably stable to the introduction of controls for parents’ divorce (Model 3), other socioeconomic characteristics of parents (Models 5 and 6), and even fathers’ cognitive ability and non-cognitive skills (Model 7) and the quality of schools children attend (Model 8). Overall, grandparents’ wealth contributes to the variance in educational achievement substantively and separately from other characteristics of grandparents, with a rank-rank slope of .12 through a direct channel (.05) and two main indirect channels via parents’ wealth (.04) and parents’ education (.03). 10
Regression of GPA Rank on Grandparents’ Wealth, Control Variables and Mediators
Note: Standard errors are adjusted for clustering within patrilineal grandparents. C = children, P = parents, GP = grandparents. Ranks are continuous and vary between 0 and 1.
GP SES contains square terms for education.
p < .05; **p < .01; ***p < .001 (two-tailed tests). † Coefficient statistically different from previous model with p < .05 (test conducted only for P and GP net worth).
Finally, focusing on the independent associations with parental wealth reveals that it, too, is remarkably stable to the introduction of other parental controls. The rank-rank slope coefficient of around .10 (Models 7 through 10) suggests that children of the wealthiest parents have a 10 percentile rank advantage in terms of their GPA compared to children from the least wealthy parents, after controlling for the wealth and SES position of the grandparents’ generation. This association is substantial; its size is second only to that of parents’ education and notably larger than the associations with parents’ occupation and fathers’ cognitive ability. Net of education, none of the parental wealth associations are explained by fathers’ cognitive ability, fathers’ non-cognitive skills, or the quality of schools attended by children.
In summary, we found sizeable joint and independent associations of grandparents’ and parents’ wealth with their (grand-)children’s educational achievements. These associations are partly mediated by parents’ educational attainment, further suggesting an exposed role of education in the multigenerational significance of family wealth. In particular, the finding that grandparents’ wealth plays a greater role than other dimensions of grandparents’ socioeconomic status is very much in line with the theoretical motivation, discussed earlier, that multigenerational associations may be particularly marked for wealth (Mare 2011; Pfeffer 2014).
Marginal Structural Models of Multigenerational Wealth Effects
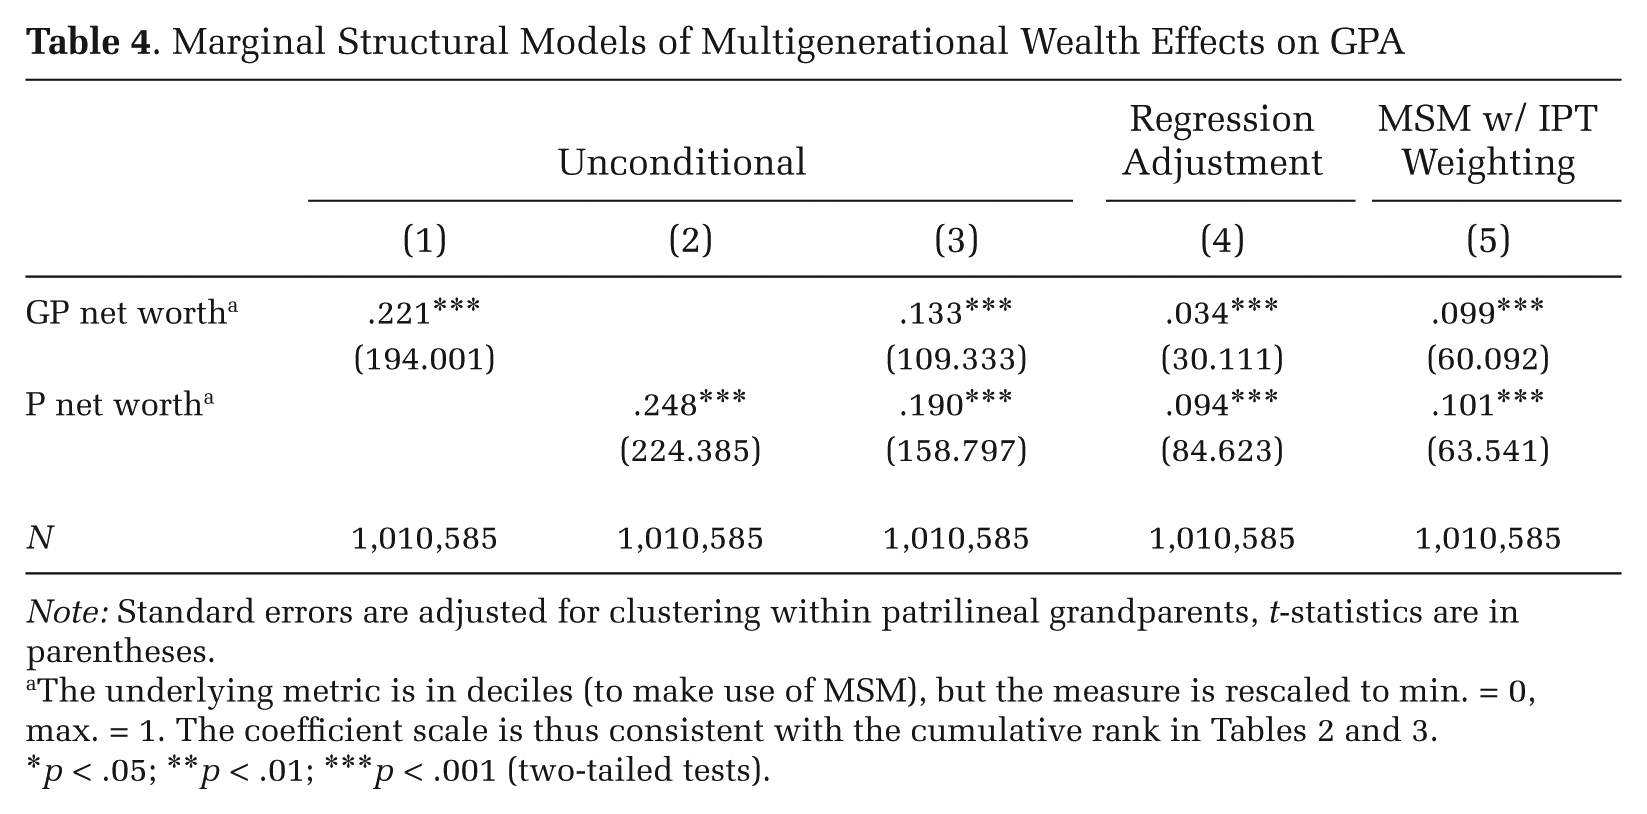
To assess the overall effect of family wealth and the relative importance of both grandparents’ and parents’ wealth, we turn to marginal structural models (MSM). Table 4 reports baseline OLS estimates for regressions based on specifications using wealth deciles, rescaled to match the scale used earlier for wealth ranks. The main difference between these two sets of results lies in the detail of the wealth variable (deciles versus full rank) and the presence of a cousin fixed effect (excluded versus included). We report the unconditional effects of grandparents’ and parents’ wealth in Models 1 and 2, respectively, and their joint effects in Model 3. The results closely reproduce the patterns found in prior models: the unconditional grandparents’ effect is very similar to the one shown in Table 2, the parents’ effect is only slightly larger, and when we consider their effects jointly, both are reduced, with parents’ wealth showing a stronger effect. Introducing controls for all other socioeconomic indicators in both the grandparents’ and parents’ generations (Model 4) produces estimates of wealth effects that closely resemble those reported earlier, with a parental wealth effect of around .10 and a grandparental wealth effect of .034, somewhat smaller than the estimate of .045 reported in Table 3.
Marginal Structural Models of Multigenerational Wealth Effects on GPA
Note: Standard errors are adjusted for clustering within patrilineal grandparents, t-statistics are in parentheses.
The underlying metric is in deciles (to make use of MSM), but the measure is rescaled to min. = 0, max. = 1. The coefficient scale is thus consistent with the cumulative rank in Tables 2 and 3.
p < .05; **p < .01; ***p < .001 (two-tailed tests).
In Model 5 of Table 4, we re-estimate the grandparents’ wealth effect using marginal structural models with inverse probability-of-treatment weights (MSM-IPTW). The results indicate that the effects of grandparents’ wealth are very similar in size to those of parents’ wealth. With an effect size of .10, the grandparents’ effect estimated through MSM is, in fact, quite close to the baseline grandparents’ wealth effect without any controls in the parents’ generation (.12; see Table 2, Model 8). However, given that the fixed effect reduces the grandparents’ wealth effect by some 20 percent in Table 3, we may assume a similar degree of upward bias here, which would bring the true effect to .08. This finding suggests that a traditional mediation analysis, as used in the prior section, adequately divides the total effect of grandparents into a direct and indirect effect (via parents’ wealth and education) and, importantly, that these regression estimates do not suffer to a substantively meaningful extent from collider variable bias. The MSM approach instead assigns both these paths to their origin in grandparents’ wealth. The total effect of family wealth in two prior generations is the sum of the grandparents’ wealth coefficient and the parents’ wealth coefficient. The estimate of close to .20 implies, for instance, a 2 percentile-point change in educational achievement for a decile shift in grandparents’ and parents’ wealth. This effect is about the size of the unconditional wealth gaps described in the beginning of this article.
Overall, the MSM-based results strengthen our conclusion that both grandparents’ and parents’ wealth are important and strong contributors to (grand-)children’s educational achievement. Wealth inequality has long-standing effects on subsequent generations.
Net Worth and Children’s Educational Achievement Summarized
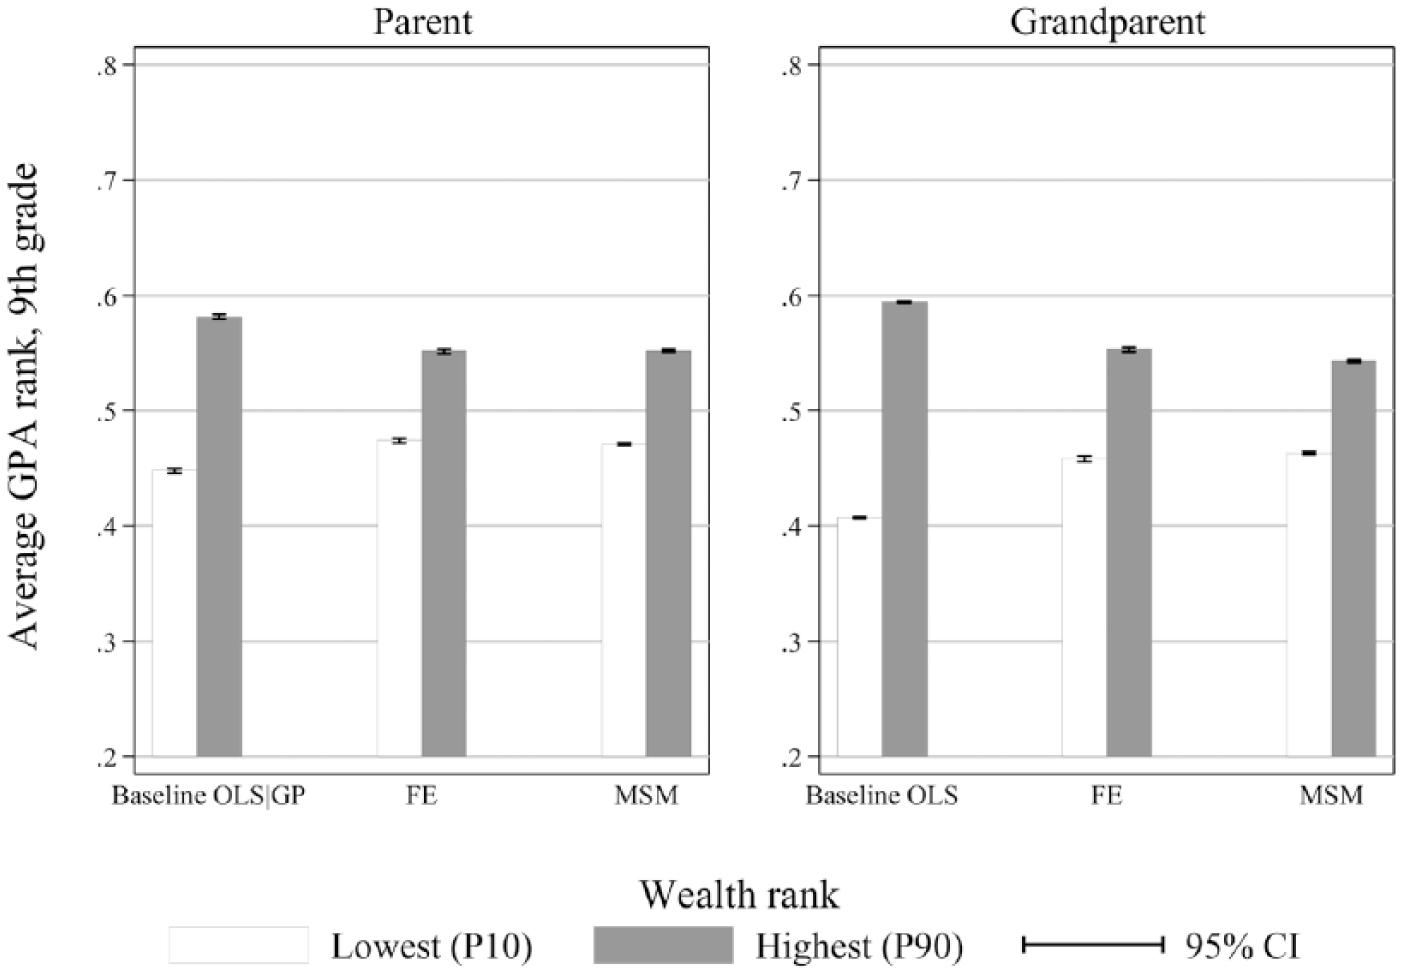
We now briefly summarize and provide an intuitive presentation of our main empirical findings on the relationship between family wealth and academic achievement. Figure 3 compares the predicted level of educational achievement between children whose parents’ and grandparents’ net worth is toward the bottom (10th percentile) versus the top (90th percentile) of the distribution. The figure displays results from three modeling approaches: baseline regressions models (OLS), regression models with full controls and cousin fixed effects (FE), and marginal structural models (MSM). Multiplying the gaps shown in the figure by 1.25 yields the regression coefficients displayed in the tables (coefficients refer to differences of 100 percentiles, P90–P10 to differences of 80 percentiles, hence 100/80 = 1.25).
Predicted GPA (9th grade) for the 10th and 90th Percentile of the Parents’ and Grandparents’ Net Worth Distributions
The right side of Figure 3 illustrates that—without any controls for confounding factors—individuals whose grandparents were at the 90th percentile of the wealth distribution (P90) perform, on average, at about the 60th percentile in terms of GPA, and children whose grandparents were at the 10th percentile of the wealth distribution (P10) perform at about the 40th percentile (the approximate 20 percentage-point difference in these predicted values is, in essence, the regression coefficient as displayed in the regression tables; see Table 2, Model 1). Taking into account that the origins of children with wealthy grandparents differ from those of children with less wealthy grandparents in other observable and unobservable ways (FE model) reduces the gap in their educational achievement: grandchildren from the top and bottom of the wealth distribution are predicted to perform at the 55th and 45th GPA percentile, respectively. This 10 percentile-point gap remains when we account for confounders on the causal pathway from grandparents to grandchildren (i.e., in the parents’ generation) using MSM.
The left side of Figure 3 displays predicted GPA values by parents’ wealth position. Conditional on grandparents’ wealth, children of parents in the 90th percentile of the wealth distribution achieve a GPA at the 58th percentile, on average, whereas children of parents in the 10th percentile of the distribution fall, on average, at the 44th percentile of the GPA distribution. Controls for confounders in both the fixed-effects model and the MSM design reduce that gap to the 55th versus 47th percentile, a remarkably similar gap to that found based on grandparents’ wealth.
The Role of Wealth Components
Additionally, we assess whether and to what degree the associations between educational achievement and family net worth described earlier are driven by the specific wealth components of financial wealth, net home wealth, and net real wealth. Table 5 reports models based on net worth and wealth components. Our specification search suggested that associations with a separate wealth component are also linear.
Regression of GPA Rank on Wealth Components
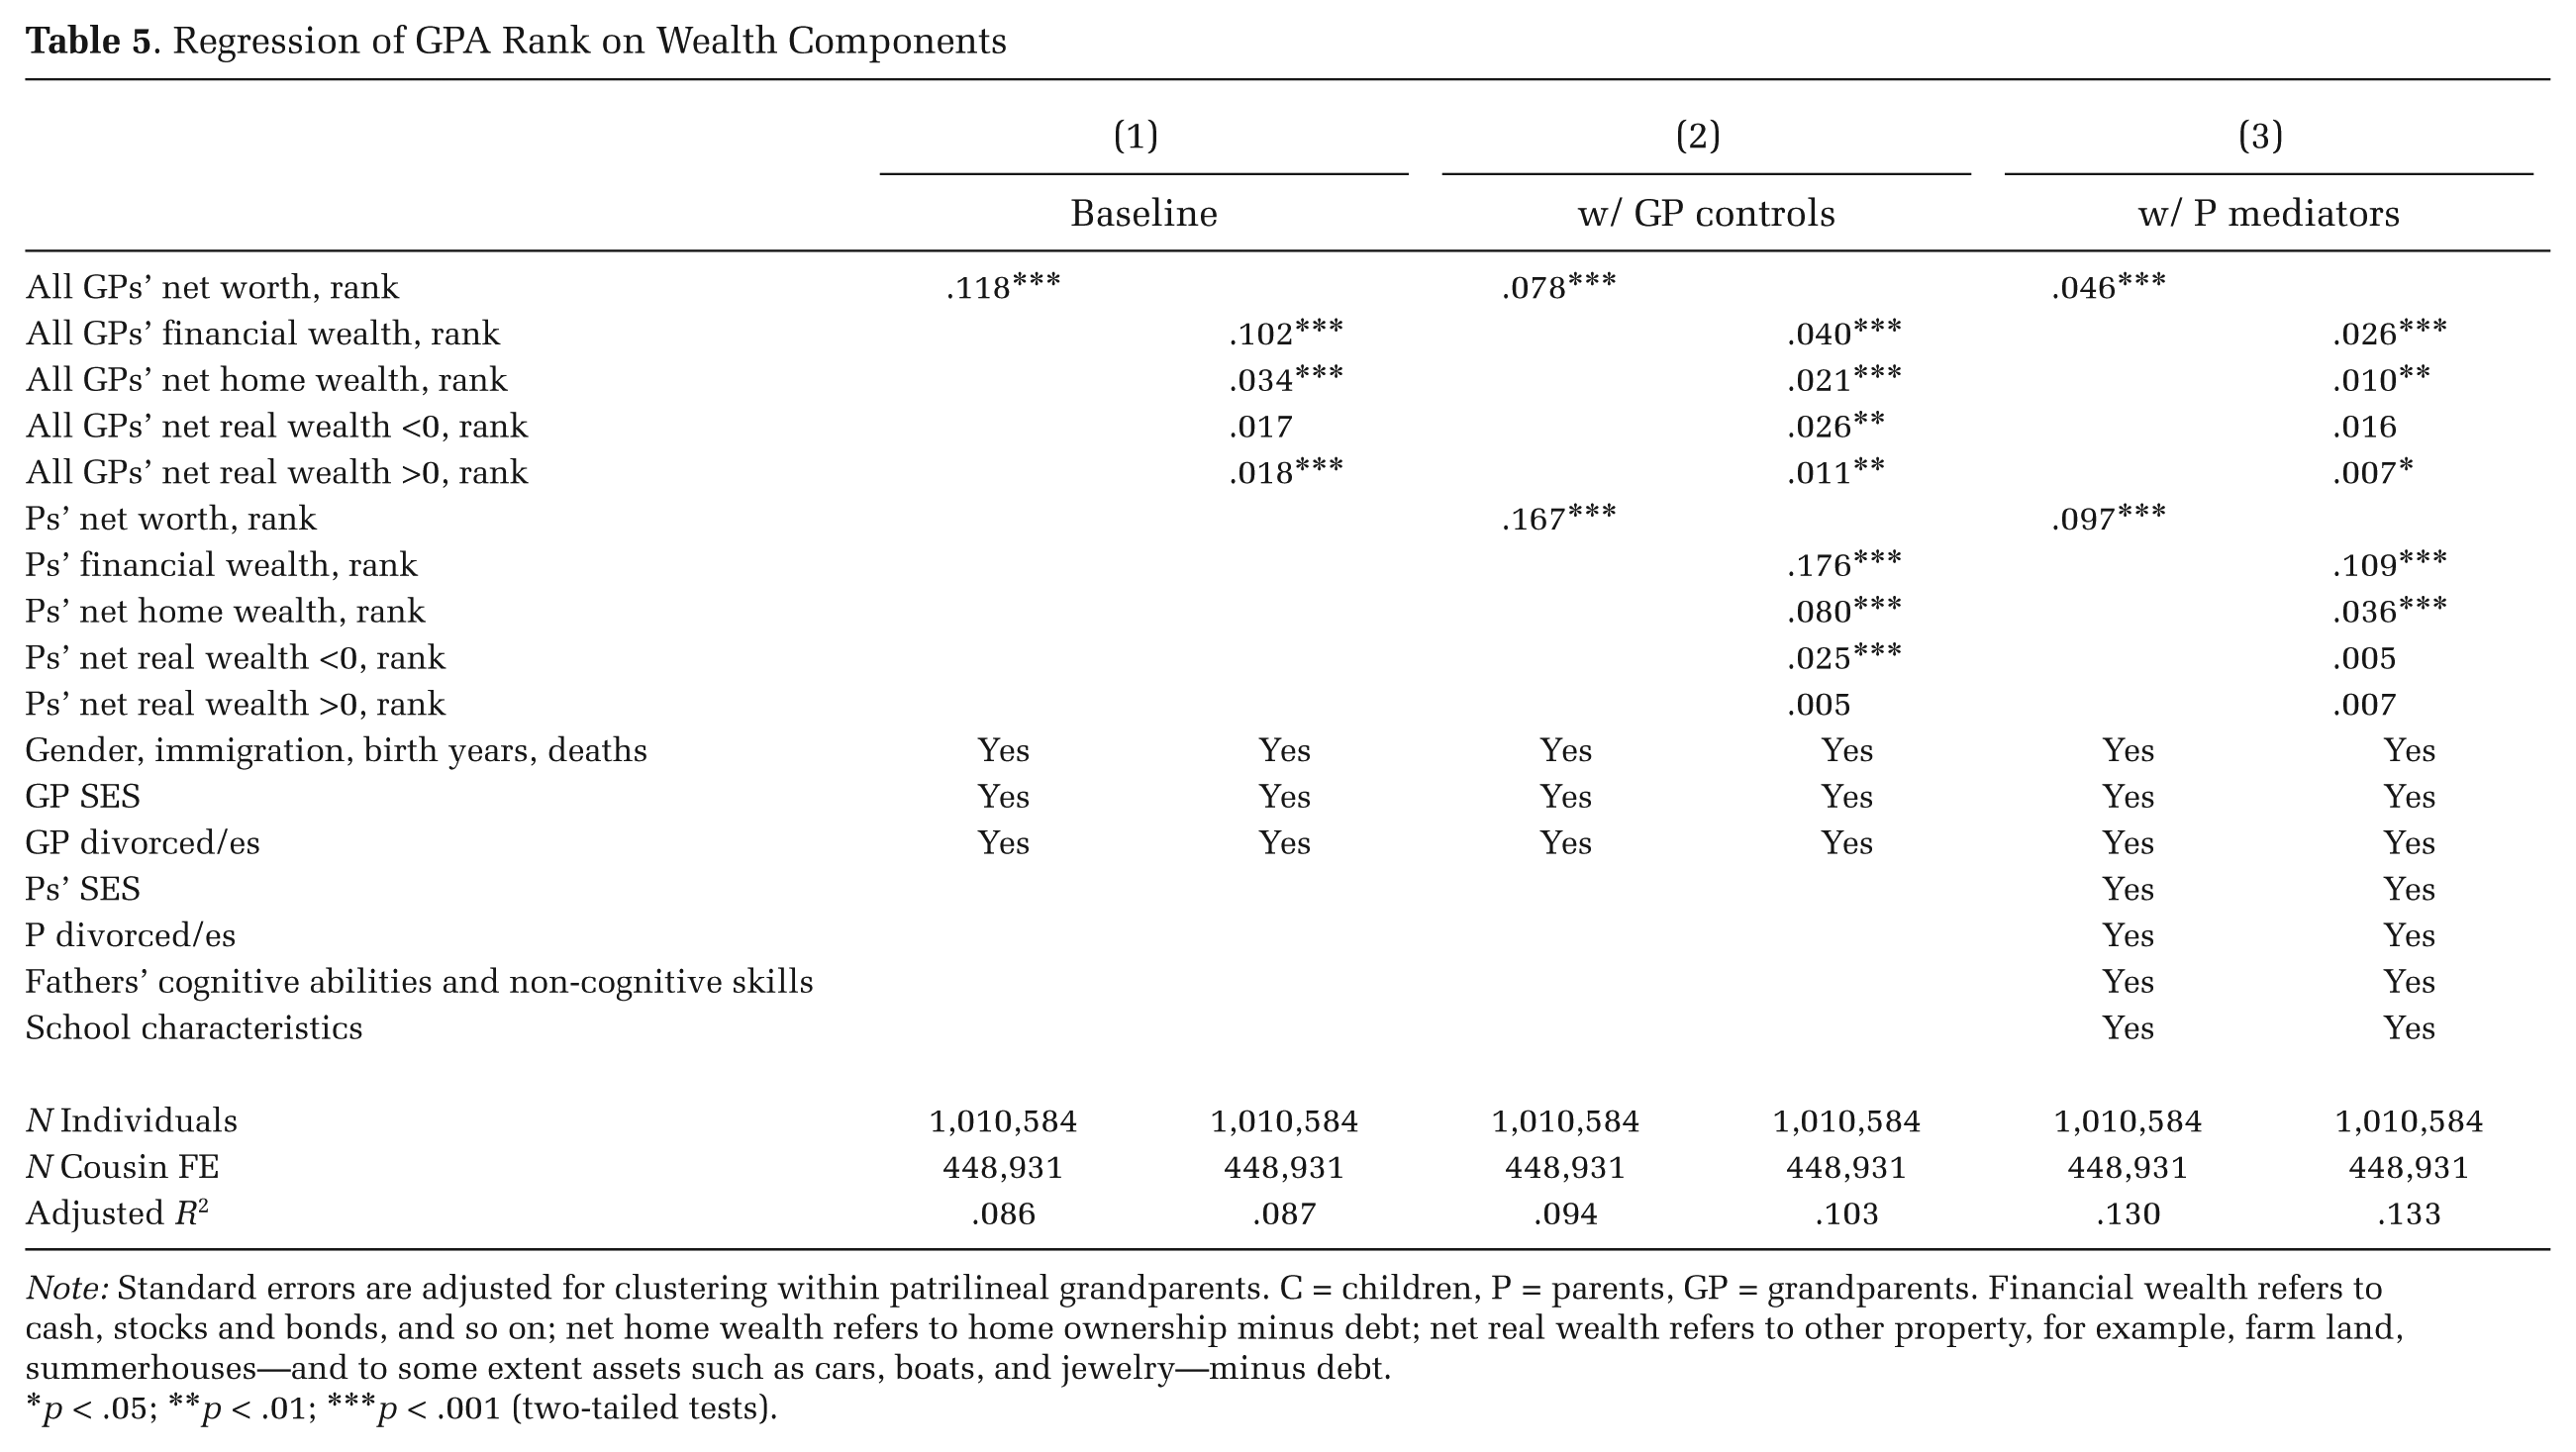
Note: Standard errors are adjusted for clustering within patrilineal grandparents. C = children, P = parents, GP = grandparents. Financial wealth refers to cash, stocks and bonds, and so on; net home wealth refers to home ownership minus debt; net real wealth refers to other property, for example, farm land, summerhouses—and to some extent assets such as cars, boats, and jewelry—minus debt.
p < .05; **p < .01; ***p < .001 (two-tailed tests).
In Model 1, based on grandparents’ wealth without further controls for grandparents’ and parents’ SES, we clearly observe that net financial wealth drives most of the net worth association with grandchildren’s GPA. The .12 association with grandparents’ net worth breaks down to a .10 association with grandparents’ financial wealth, and .04 and .03 association for net home wealth and other net real wealth, respectively. When we control for parents’ wealth and SES as mediators in Models 2 and 3, these differences across grandparents’ wealth components attenuate, but the grandparents’ financial wealth coefficient is still much larger than that of other components of grandparents’ wealth. For parents, the dominant role of financial wealth is even more marked: with full controls for other socioeconomic characteristics, the parental financial wealth coefficient is .11—even larger than the parental net worth coefficient (.095)—followed by the parental net home wealth coefficient of .03. Overall, we conclude that financial wealth—or wealth in largely liquid form rather than in housing or other real estate—is the most consequential component of family wealth in predicting children’s educational achievement.
Academic Upper-Secondary Attainment
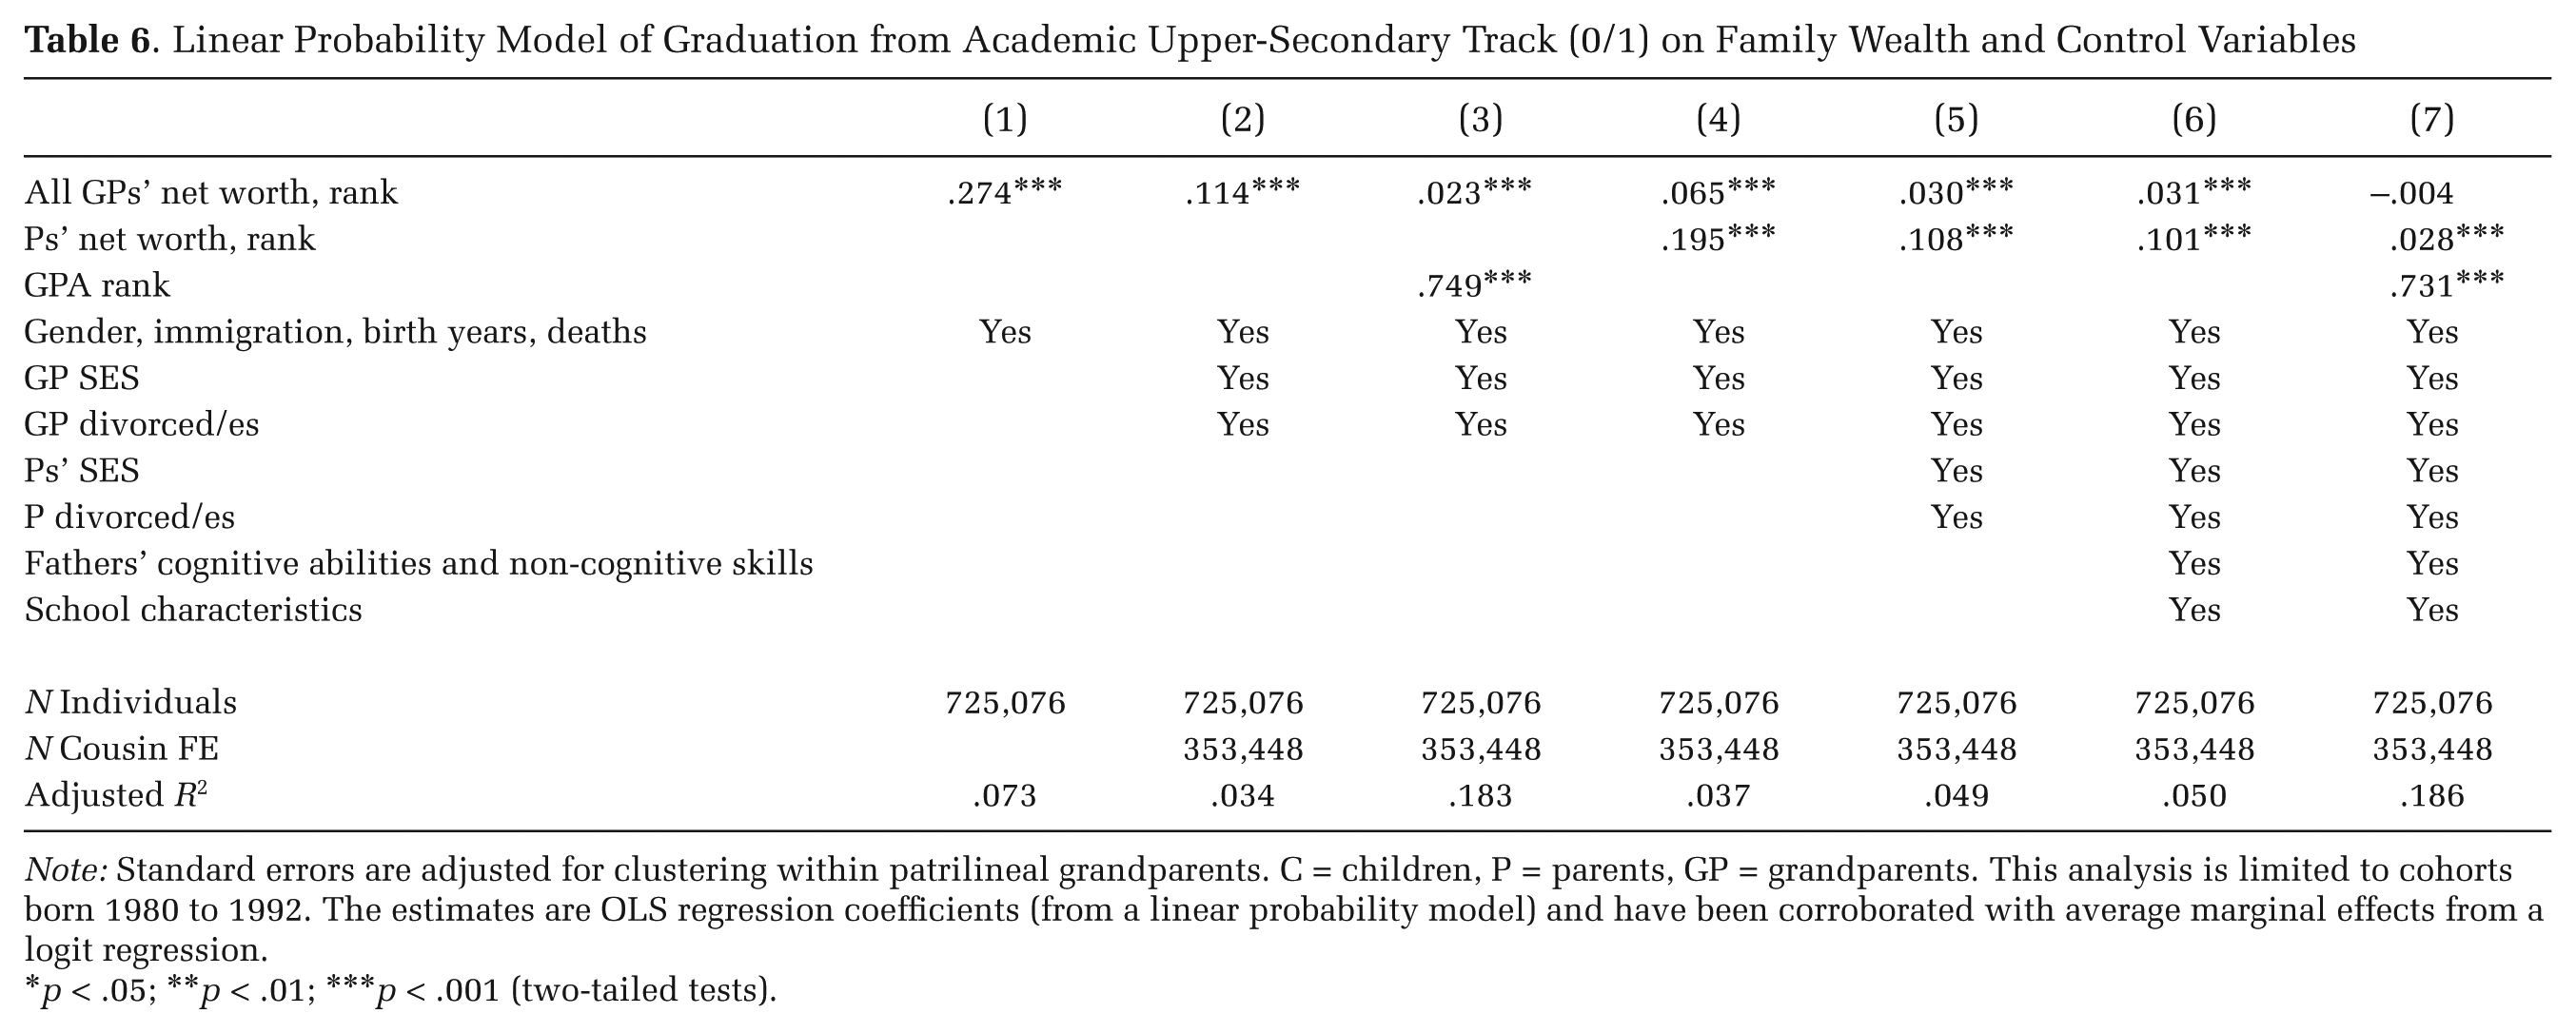
Finally, we analyze how family wealth is associated with graduation from the most prestigious academic track on the secondary level. In Table 6, Model 1, the coefficient for grandparents’ net worth rank is .27, meaning we observe a 27 percentage-point difference in graduation rates between children from the very top and bottom ends of the grandparents’ wealth distribution. Given that the average graduation rate from this track is about 31 percent (see Table 1), this gap is very large. With controls for grandparents’ SES in Model 2, the coefficient falls to .10, which is still substantial. However, when we control for 9th-grade GPA (Model 3), which we have focused on so far, we find that this measure of educational achievement accounts for a large part—about four fifths (1 – .0230/.1140)—of the association between family wealth and educational attainment. The GPA coefficient estimate is .75, meaning that a shift by one percentile rank in the GPA distribution translates into .75 of a percentage-point change in graduation rates.
Linear Probability Model of Graduation from Academic Upper-Secondary Track (0/1) on Family Wealth and Control Variables
Note: Standard errors are adjusted for clustering within patrilineal grandparents. C = children, P = parents, GP = grandparents. This analysis is limited to cohorts born 1980 to 1992. The estimates are OLS regression coefficients (from a linear probability model) and have been corroborated with average marginal effects from a logit regression.
p < .05; **p < .01; ***p < .001 (two-tailed tests).
We can draw the same conclusion from models with the full set and sequence of further parental controls (Models 4 through 7). As before, controls for parents’ wealth alone (Model 4) explain a substantial part of the grandparents’ wealth association, and so does controlling for parents’ SES (Model 5). The parents’ wealth association net of other parental socioeconomic characteristics indicates a 10 percentage-point difference in graduation rates between children whose grandparents are the wealthiest and the poorest. Also as before, controlling for father’s cognitive ability and school selectivity (Model 6) has a small impact on these wealth associations. However, by again introducing controls for GPA, the parental wealth effect, too, is almost fully mediated. Hence, we conclude that grandparents’ wealth is associated with track choice in upper-secondary school but primarily via its association with children’s educational achievement as manifest in 9th-grade GPA, lending support to our decision to focus on the analysis of educational achievement.
Discussion
Our analyses address concerns about the long-term consequences of wealth inequality for the distribution of opportunity in following generations—concerns that are all the more relevant given the extreme and rising level of wealth inequality throughout most of the industrialized world. We find that wealth in prior generations is important for educational achievement even in the rather egalitarian context of Sweden. Family wealth establishes inequality in the cognitive dimensions of schooling as captured in grade point averages, which suggests a rather fundamental inequality generating mechanism that will likely have consequences for later life outcomes.
Our analyses reveal family wealth effects to be quite large in comparison to the effects of other socioeconomic characteristics, and, in particular, that the influence of grandparents’ wealth and parents’ wealth is about equal in size. Moving from the bottom to the top of the wealth distribution in either the parents’ or grandparents’ distribution suggests a gain of 10 percentile points in children’s 9th-grade GPA score—or 20 percentile points if we consider both generations together. In other words, if we had restricted our focus to a two-generational perspective, as is done in much prior stratification research, we would have missed half of the inequality in educational achievement by family wealth. Furthermore, we found that the influence of grandparents’ wealth can be partitioned into a direct, three-generational effect on grandchildren’s educational achievement and a sequence of two-generational associations via parents’ wealth and parents’ education—all of which are of similar size. To reach this conclusion, we relied on marginal structural models (MSM) that account for confounders on the causal pathway from grandparents’ wealth to children’s educational achievement. The MSM approach also enabled us to gain a better understanding of the total role of wealth spread within family lineages, which is not adequately captured if we focus exclusively on the “direct” multigenerational effect of grandparents’ wealth. We did, however, take great care in estimating such direct effects—based on a new methodological approach that we call cousin fixed effects—and found it to persist even with ample controls for observed and unobserved parental characteristics.
Our results yield further insights. First, the rank association between family wealth and education is appreciably linear. Although the full population register data used for this study include true wealth elites, our analyses demonstrate that the advantages from family wealth accrue throughout the distribution and not just at the very top. If interpreted through the prism of the normative function of wealth, this finding corresponds to our supposition that such a function spreads across the wealth distribution rather than being exclusive to processes of elite closure.
Second, establishing a direct effect of grandparents’ wealth on children’s education—that is, grandparents’ wealth matters directly and beyond the sequence of two-generational transmissions processes from grandparents to parents and parents to children—is important, especially as the great majority of today’s children grow up while their grandparents are still alive. Analyzing grandparents’ wealth measured at the end of their careers may have the additional benefit of fully capturing grandparents’ lifetime success, because education and occupation are largely fixed in the first half of individuals’ careers. Lifetime income encompasses the full working life but captures only one specific labor market outcome. In contrast, wealth at career end may provide an informative summary of the degree of advantage accumulated by grandparents. Our results suggest that this total accumulated advantage—beyond grandparents’ educational, occupational, and income attainment—can be passed on to grandchildren in the form of educational achievement. This may be one reason why grandparents’ wealth shows such strong associations compared to other dimensions of grandparents’ SES.
Third, we show that family wealth effects are tied to a range of different asset components but most strongly to financial wealth. In Sweden, home wealth—an asset held more widely in other contexts, especially in the United States—does not produce educational benefits to the same extent as financial wealth does.
Fourth, family wealth effects in Sweden on educational achievement translate into wealth gaps in educational transitions. This likely affects children beyond their educational outcomes and carries over into their labor market careers.
Overall, our results emphasize that family wealth independently adds to our understanding of the intergenerational determinants of educational outcomes—especially when considered in a multigenerational perspective. Much previous research has been restricted to the analysis of select socioeconomic characteristics of parents, chiefly their occupation, income, and own education. Our analyses indicate that wealth of prior generations is an integral part of socioeconomic background.
Our empirical analyses focused on the identification of family wealth effects but did not set out to test the social mechanisms underlying them or to empirically separate their relative importance. We hope that future research will make further progress in this direction, but we end by discussing how our results may still lend some credibility to different explanations of family wealth effects in Sweden and, importantly, what expectations about the size of multigenerational wealth effects may be drawn for other nations, in particular, the United States.
We proposed three theoretical mechanisms that may account for the observed intergenerational role of family wealth—purchasing, insurance, and normative mechanisms—and noted that their relative importance likely depends on the specific institutional and macro-social contexts of a given country. We argued that Sweden provides a context that severely limits the purchasing function of wealth. Sweden’s strong public education system and its tuition-free universities may effectively eliminate direct economic barriers to accessing high-quality schools and higher education. In line with that argument, we found that controls for school quality had minimal influence on our estimates. Similarly, we considered recent research that fails to find a significant intergenerational payoff to lottery wins in Sweden (Cesarini et al. 2015) as supportive of the idea that the purchasing function of wealth in Sweden is limited at best. Rather, we considered the normative and insurance mechanisms as the more likely candidates to explain our finding of strong associations between family wealth and educational outcomes in Sweden.
First, the potential influence of a normative channel is in line with our finding that the association between wealth and the transition into academic upper-secondary education is practically fully mediated by educational achievement. Normative values on the importance of educational success—as fostered by wealth—exert their effect on early motivation and achievement, largely predetermining later educational attainment (see also Morgan 2005). Furthermore, our finding of quite linear wealth effects is in line with our hypothesis that the normative mechanism should not be thought of as exclusively taking effect in the uppermost echelons of the wealth distribution. Second, we have argued elsewhere that the insurance function of wealth is more universal because the need for insurance against educational risks is largely unmet by public insurance mechanisms (Pfeffer and Hällsten 2012). Here, the insurance function of wealth may allow children to explore their capabilities more freely and thereby promote achievement. We also note that the importance of wealth’s insurance function may remain or even increase during later transitions, such as college enrollment, labor market entry, or early unemployment.
To derive expectations about the potential importance of family wealth for education in other nations, we need to compare their institutional and macro-social contexts to those described here. For instance, our findings for Sweden might underestimate the long-term consequences of wealth inequality in other contexts where—unlike in Sweden—a purchasing mechanism operates on top of insurance and normative mechanisms. We would thus be surprised if the profound role of wealth that we documented for Sweden is any smaller in the United States, where all three mechanisms of intergenerational wealth effects are likely at work. In the United States, the normative influence of wealth on children should be relevant, because Americans’ strong belief in a mobile society spurs the quest for status maintenance via education. The most apparent difference between Sweden and the United States, of course, lies in the purchasing mechanism. In the United States, economic barriers to high-quality schools and higher education should be substantially higher, thanks to a tight link between the quality of schools and housing wealth—the most central component of the typical U.S. family’s wealth portfolio—as well as the high and rising costs of higher education.
The resulting hypothesis of a profound multigenerational significance of wealth in the United States should be addressed empirically in future research. If it is valid, current research on educational inequality in the United States that focuses only the immediate family’s background and socioeconomic characteristics, exclusive of family wealth—although already producing alarming findings (Duncan and Murnane 2011)—still underestimates the degree, and incompletely captures the nature of, educational inequality. The need to improve the description and understanding of educational inequality in the United States is particularly acute given the country’s sharply rising levels of wealth inequality.
Footnotes
Appendix
The Distribution of Wealth
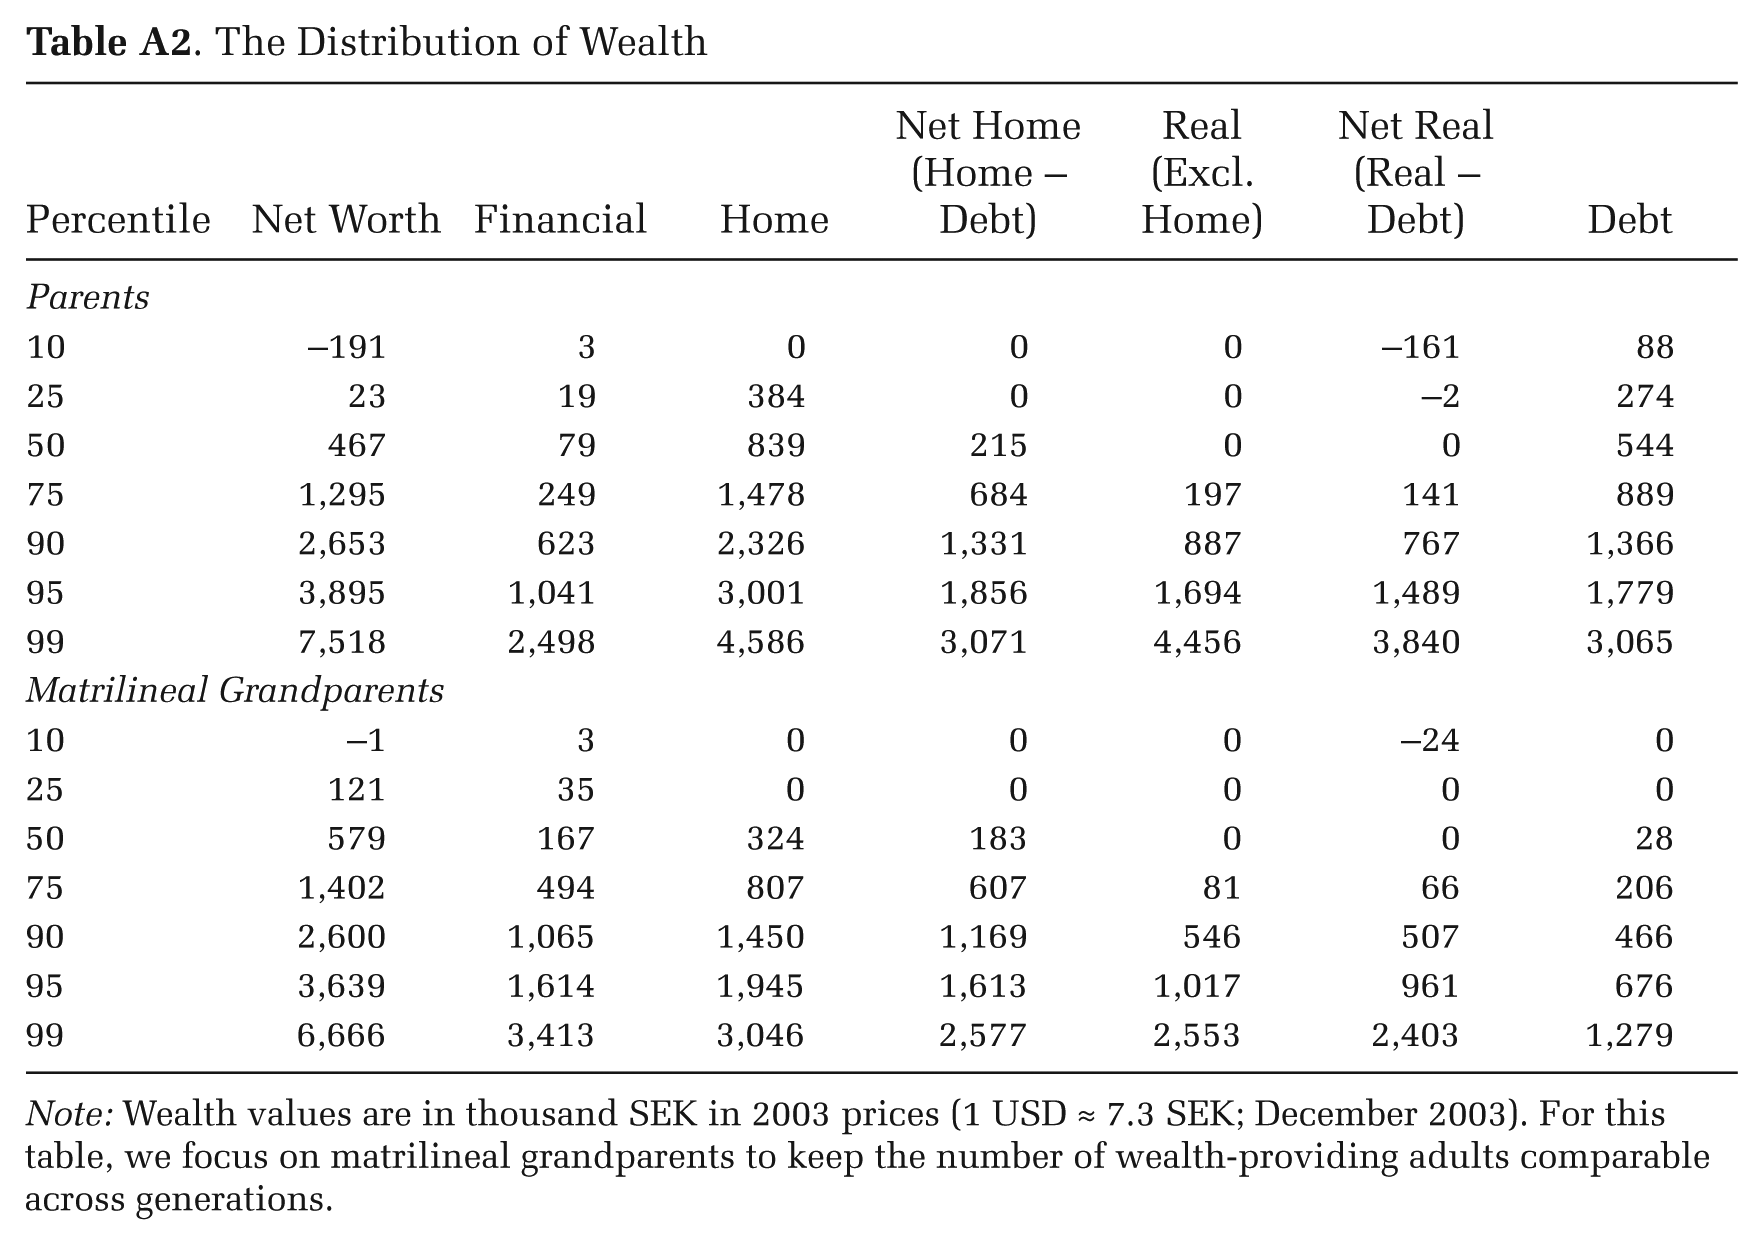
| Percentile | Net Worth | Financial | Home | Net Home |
Real |
Net Real |
Debt |
|---|---|---|---|---|---|---|---|
| Parents | |||||||
| 10 | –191 | 3 | 0 | 0 | 0 | –161 | 88 |
| 25 | 23 | 19 | 384 | 0 | 0 | –2 | 274 |
| 50 | 467 | 79 | 839 | 215 | 0 | 0 | 544 |
| 75 | 1,295 | 249 | 1,478 | 684 | 197 | 141 | 889 |
| 90 | 2,653 | 623 | 2,326 | 1,331 | 887 | 767 | 1,366 |
| 95 | 3,895 | 1,041 | 3,001 | 1,856 | 1,694 | 1,489 | 1,779 |
| 99 | 7,518 | 2,498 | 4,586 | 3,071 | 4,456 | 3,840 | 3,065 |
| Matrilineal Grandparents | |||||||
| 10 | –1 | 3 | 0 | 0 | 0 | –24 | 0 |
| 25 | 121 | 35 | 0 | 0 | 0 | 0 | 0 |
| 50 | 579 | 167 | 324 | 183 | 0 | 0 | 28 |
| 75 | 1,402 | 494 | 807 | 607 | 81 | 66 | 206 |
| 90 | 2,600 | 1,065 | 1,450 | 1,169 | 546 | 507 | 466 |
| 95 | 3,639 | 1,614 | 1,945 | 1,613 | 1,017 | 961 | 676 |
| 99 | 6,666 | 3,413 | 3,046 | 2,577 | 2,553 | 2,403 | 1,279 |
Note: Wealth values are in thousand SEK in 2003 prices (1 USD ≈ 7.3 SEK; December 2003). For this table, we focus on matrilineal grandparents to keep the number of wealth-providing adults comparable across generations.
Acknowledgements
We are grateful for comments made by participants at presentations at IFAU in Uppsala, April 2015; the UNITRAN workshop in Copenhagen, June 2015; the SASE conference in London, July 2015; the Annual Meeting of the American Sociological Association in Seattle, August 2016; the Department of Human Sciences at Ohio State University, October 2016; the Swedish Institute for Social Research in Stockholm, November 2016; the Department of Sociology and Human Geography in Oslo, November 2016; the Stone Center on Socio-Economic Inequality at the City University of New York Graduate Center, December 2016; as well as the anonymous ASR reviewers, Adrian Adermon, and an anonymous IFAU reviewer.
Funding
Data Note
The data in this article come from confidential administrative registers with restricted access. We do share syntax and information, for example, on how we set up analyses; anyone interested can contact the corresponding author to get access to those files.
Notes
References
Supplementary Material
Please find the following supplemental material available below.
For Open Access articles published under a Creative Commons License, all supplemental material carries the same license as the article it is associated with.
For non-Open Access articles published, all supplemental material carries a non-exclusive license, and permission requests for re-use of supplemental material or any part of supplemental material shall be sent directly to the copyright owner as specified in the copyright notice associated with the article.