
Abstract
Background
Proximal gastrectomy (PG) is one of function‐preserving gastrectomy (FPG). In this study, we compared the long-term results of proximal gastric cancer (PGC) patients undergoing proximal gastrectomy and total gastrectomy (TG).
Method
Patients diagnosed with PGC and receiving PG or TG between 2004 and 2020 were selected from the Surveillance, Epidemiology, and End Results (SEER) database. Propensity score matching (PSM) was applied to minimize confounding factors. Kaplan-Meier analysis and log-rank test were used to compare overall survival (OS) and cancer-specific survival (CSS) between the PG and TG groups. Univariate and multivariate Cox regression analyses were performed to identify independent risk factors affecting OS.
Result
A total of 3916 patients were recruited according to the inclusion and exclusion criteria, with 2614 undergoing PG and 1302 undergoing TG. After 1:1 PSM matching, 912 pairs of data were included for analysis. Before PSM matching, PG group tended to have better OS and CSS outcomes. However, after PSM matching, both surgical approaches showed similar long-term results.
Conclusion
PG for PGC yields comparable long-term outcomes to TG and demonstrates safety in terms of oncologic outcomes.
Keywords
Introduction
Gastric cancer (GC) is a common malignant tumor worldwide. According to the statistical data from GLOBOCAN (https://gco.iarc.fr/), it ranks fifth in terms of incidence and fourth in terms of mortality. 1 In recent decades, the incidence and mortality of GC have significantly decreased due to continuous improvement in prevention, screening, and diagnostic and therapeutic approaches.2-4 However, the incidence of PGC has been increasing annually,5-8 with PGC patients accounting for approximately one-third of all GC patients. 9
According to the definition by JGCA (Japanese Gastric Cancer Association), PGC is located in the upper one-third of the stomach, including the 1 cm above and 5 cm below the gastroesophageal junction, the upper one-third of the stomach body, and the greater curvature. 10 TG with D2 lymph node dissection is the standard surgical approach for PGC.11-12 However, after TG, the storage, mechanical grinding, secretion, and other functions of the stomach are permanently lost, inevitably leading to nutritional and metabolic disturbances, particularly in early-stage PGC patients.13-15 Takiguchi 13 observed that 5-50% of patients undergoing TG experience post-gastrectomy syndrome, including dumping syndrome due to the lack of food storage, weight loss due to impaired appetite and oral intake, and anemia due to intrinsic factor loss and poor absorption of vitamin B12.13,16
Proximal gastrectomy (PG) is a functional-preserving gastrectomy. The indications for PG are defined by JGCA as early-stage upper one-third gastric cancer (cT1a/1bN0), where at least half of the stomach can be preserved. 11 PG is expected to preserve the storage function of the residual distal stomach, maintain pyloric function to prevent duodenal reflux, and be associated with a lower incidence of dumping syndrome.17-20 However, for locally advanced (T2 or higher) PGC, which is considered to have a high risk of lymph node metastasis, the safety of PG remains controversial, and TG combined with standard D2 lymph node dissection is considered the standard treatment.11-12
Based on SEER data, Wei et al 21 conducted an analysis comparing the long-term oncological outcomes of PG and TG for PGC. The study revealed that TG might not be necessary for patients with PGC, and PG could be considered an ideal surgical approach. However, in Wei et al’s study, there was baseline imbalance between the PG group and the TG group, with statistically significant differences in gender, race, tumor differentiation, tumor size, and T stage (P < .05). The presence of these confounding factors could potentially influence the final results. On the other hand, Uprak et al's study 22 employed PSM to balance the baseline characteristics of the PG and TG groups, eliminating the impact of confounding factors. Nevertheless, after 1:1 matching using PSM, the final analysis included only 46 patients in each group, resulting in a small sample size that might affect the accuracy of the results.
The survival benefits of PG and TG for PGC are currently a matter of debate. Previous studies have been limited by small sample sizes and single-center designs, thus further research is needed to confirm the long-term survival outcomes of PG for PGC. In this study, based on the SEER database, we compared the long-term survival prognosis of PGC patients undergoing PG vs TG, aiming to clarify the survival benefits after PG and identify independent prognostic factors for PGC.
Material and Method
Patient Selection and Inclusion Criteria
The SEER database compiles cancer incidence, prevalence, and survival rate data for approximately one-third of the US population 23 . Using SEER*Stat 8.4.1 software, we retrospectively recruited patients diagnosed with PGC (including gastroesophageal junction cancer) (site code: C16.0, C16.1) and undergoing either PG (surgery code: A330, A510, A610) or TG (surgery code: A400, A410, A420, A520, A620) between January 1, 2004, and December 31, 2020. We included adenocarcinoma and signet ring cell carcinoma with histology codes (ICD-O-3): 8140-8142, 8144-8145,8210-8211,8230,8255,8260-8263,8323,8480-8481,8490,8510,8512,8560,8574. Patients aged 18 years or older were eligible for inclusion.
Exclusion Criteria
(1). Non -GC patients. (2). Patients with multiple primary tumors (GC as a non-primary tumor). (3). Tumors located in other parts of the stomach or tumors of unknown location. (4). Other pathological types of gastric malignancies (eg, lymphoma, GIST, GNT, fibrosarcoma, or liposarcoma). (5). Tumors with distant metastasis (M1). (6). Patients with incomplete clinical, pathological, or survival information.
Clinical and Pathological Parameters Included in the Analysis
Information extracted for each patient included marital status, race, gender, age, primary site, histologic type, pathological grade, number of positive lymph nodes, number of lymph nodes examined, tumor size, AJCC T stage, AJCC N stage, AJCC stage, surgical method, radiotherapy, chemotherapy, vital status, survival months, OS, and CSS.
Survival time was calculated based on the date of surgery, date of death, or last follow-up. Overall survival was defined as the time from surgery to death from any cause or last follow-up. Cancer-specific survival was defined as the time from surgery to death specifically from PGC or last follow-up. AJCC TNM staging, 6th and 7th editions, were converted to the 8th edition.
Survival Analysis of PG Group and TG Group
Patients were divided into two groups, the PG group and the TG group, based on the surgical procedure. To minimize confounding factors, PSM 24 was performed for clinical and pathological factors (race, gender, age, primary site, histologic type, pathological grade, number of positive lymph nodes, number of lymph nodes examined, tumor size, AJCC T stage, AJCC N stage, AJCC stage, radiotherapy, and chemotherapy) other than the surgical approach. 25 Matching was conducted using the nearest-neighbor method, with a caliper value set at .002. Kaplan-Meier analysis and log-rank test were applied to compare OS and CSS between the PG group and the TG group before and after PSM.
Univariate and Multivariate Analysis
Univariate Cox, LASSO, and multivariate Cox regression analyses were performed using the glmnet (version 2.0.18) and survival (version 2.44.1.1) packages in R software to validate the correlation between OS and clinical-pathological features in patients with PGC. First, univariate Cox regression was conducted to determine the correlation between clinical-pathological features and OS in patients with PGC. Subsequently, LASSO regression analysis was performed on the parameters that met the criteria. This approach allowed further selection of candidate prognostic parameters, with the minimum λ value used as the inclusion criterion, representing the optimal number of variables for the model. Multivariate Cox regression analysis was then performed on the selected parameters from the aforementioned methods to evaluate the independent contributions of each parameter to prognosis and hazard ratio (HR), and to calculate the 95% confidence intervals (CIs) for key parameters. Finally, it was determined whether these parameters were independent prognostic factors for OS in patients with PGC.
Statistical Analysis
All statistical analyses were performed using R software (version 4.2.2, https://www.r-project.org/). Descriptive statistics were presented as median (interquartile range) for continuous variables that did not follow a normal distribution. Frequency and percentage were used to describe categorical variables. t-tests were used for between-group comparisons of continuous variables that followed a normal distribution, while Mann-Whitney U tests were used for those that did not. Chi-square (χ2) tests or Fisher’s exact tests were used for between-group comparisons of categorical variables. Cox regression analysis presented features as HR and corresponding 95% CI. A P-value <.05 (two-tailed) was considered statistically significant.
Moral Recognition
We have retrieved all patient information used in our study from the SEER database, and the study was reviewed by the Institutional review board (IRB) of Chongqing University Fuling Hospital. The study was conducted in accordance with the Declaration of Helsinki (revised in 2013).
Results
The PGC Patients’ Characteristics
Characteristics Among PGC Patients Before and After PSM.
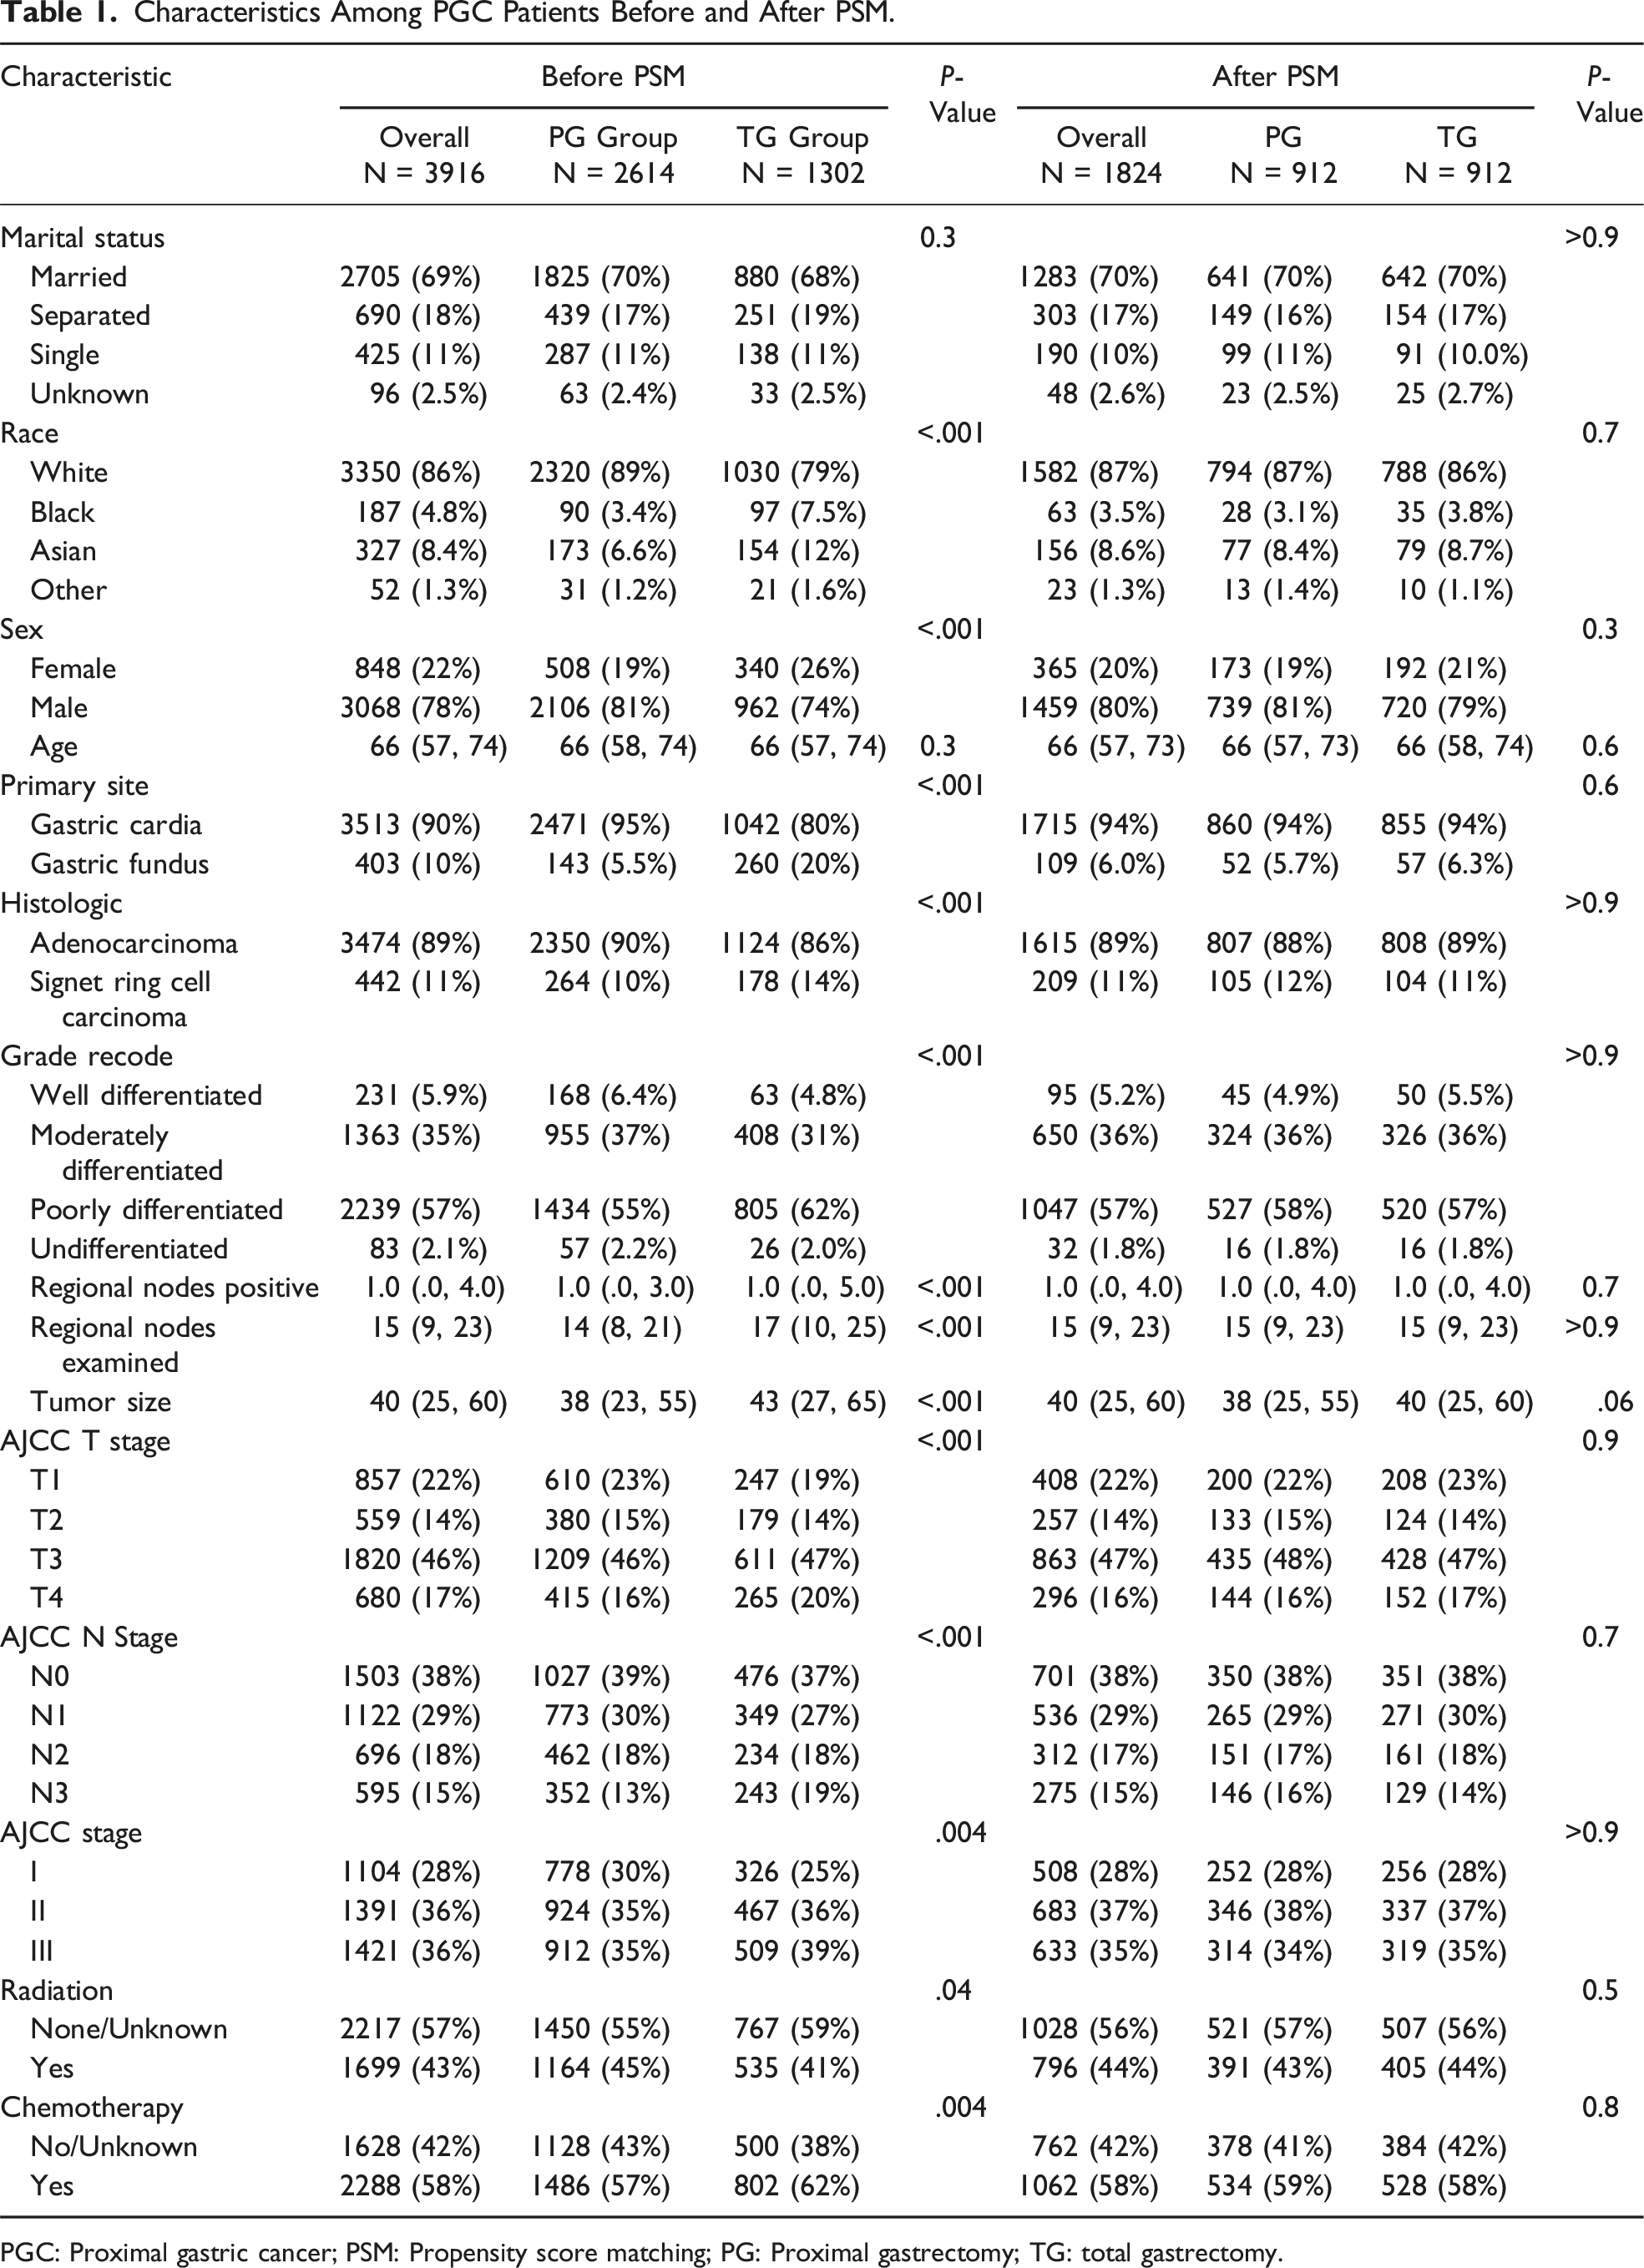
PGC: Proximal gastric cancer; PSM: Propensity score matching; PG: Proximal gastrectomy; TG: total gastrectomy.
Tumor Size
During PSM matching, initially, we set the caliper at .05, resulting in 1146 pairs of matched cases. However, there was a significant difference in tumor size between the two groups, with a P-value of .006. Subsequently, we set the caliper at .01 and obtained 1074 pairs of data, but there was still a significant difference in tumor size between two groups, with a P-value of .022. We then set the caliper at .009、0.006、0.004, but still could not achieve between-group data without differences. Finally, we set the caliper at .002, and after 1:1 PSM matching, we obtained 912 cases in the PG group and 912 cases in the TG group, resulting in a total of 1824 cases. After matching, between-group balance was achieved. The median tumor size was 40 mm, and the median tumor sizes before PSM matching were 38 mm and 43 mm in the PG and TG groups, respectively (Supplement Figure 2).
Survival Analysis
Before PSM matching: The median OS in the PG group was 3.25 years, with 1-, 3-, 5-, 8-, and 10-year OS rates of .798、0.517, 0.407, 0.33, and .287, respectively. In the TG group, the median OS was 2.67 years, with 1-, 3-, 5-, 8-, and 10-year OS rates of .764, 0.468, 0.367, 0.306, and .281, respectively. The median CSS in the PG group was 4.33 years, with 1-, 3-, 5-, 8-, and 10-year OS rates of .832, 0.569, 0.478, 0.424, and .404, respectively. In the TG group, the median CSS was 3.67 years, with 1-, 3-, 5-, 8-, and 10-year OS rates of .798, 0.528, 0.443, 0.398, and .388, respectively. Kaplan-Meier survival curves showed that the OS in the PG group was longer than that in the TG group, with an HR of 1.0851 and a P-value of .038, indicating a statistically significant difference. Although the CSS in the PG group was slightly better than that in the TG group, with an HR of 1.0873, there was no statistically significant difference (P-value = .064) (Figure 1(A), 1(B)). (A-D): Comparison of OS and CSS between two groups. A: Comparison of OS between the PG group and TG group before PSM; B: Comparison of CSS between the PG group and TG group before PSM; C: Comparison of OS between the PG group and TG group after PSM; D: Comparison of CSS between the PG group and TG group after PSM.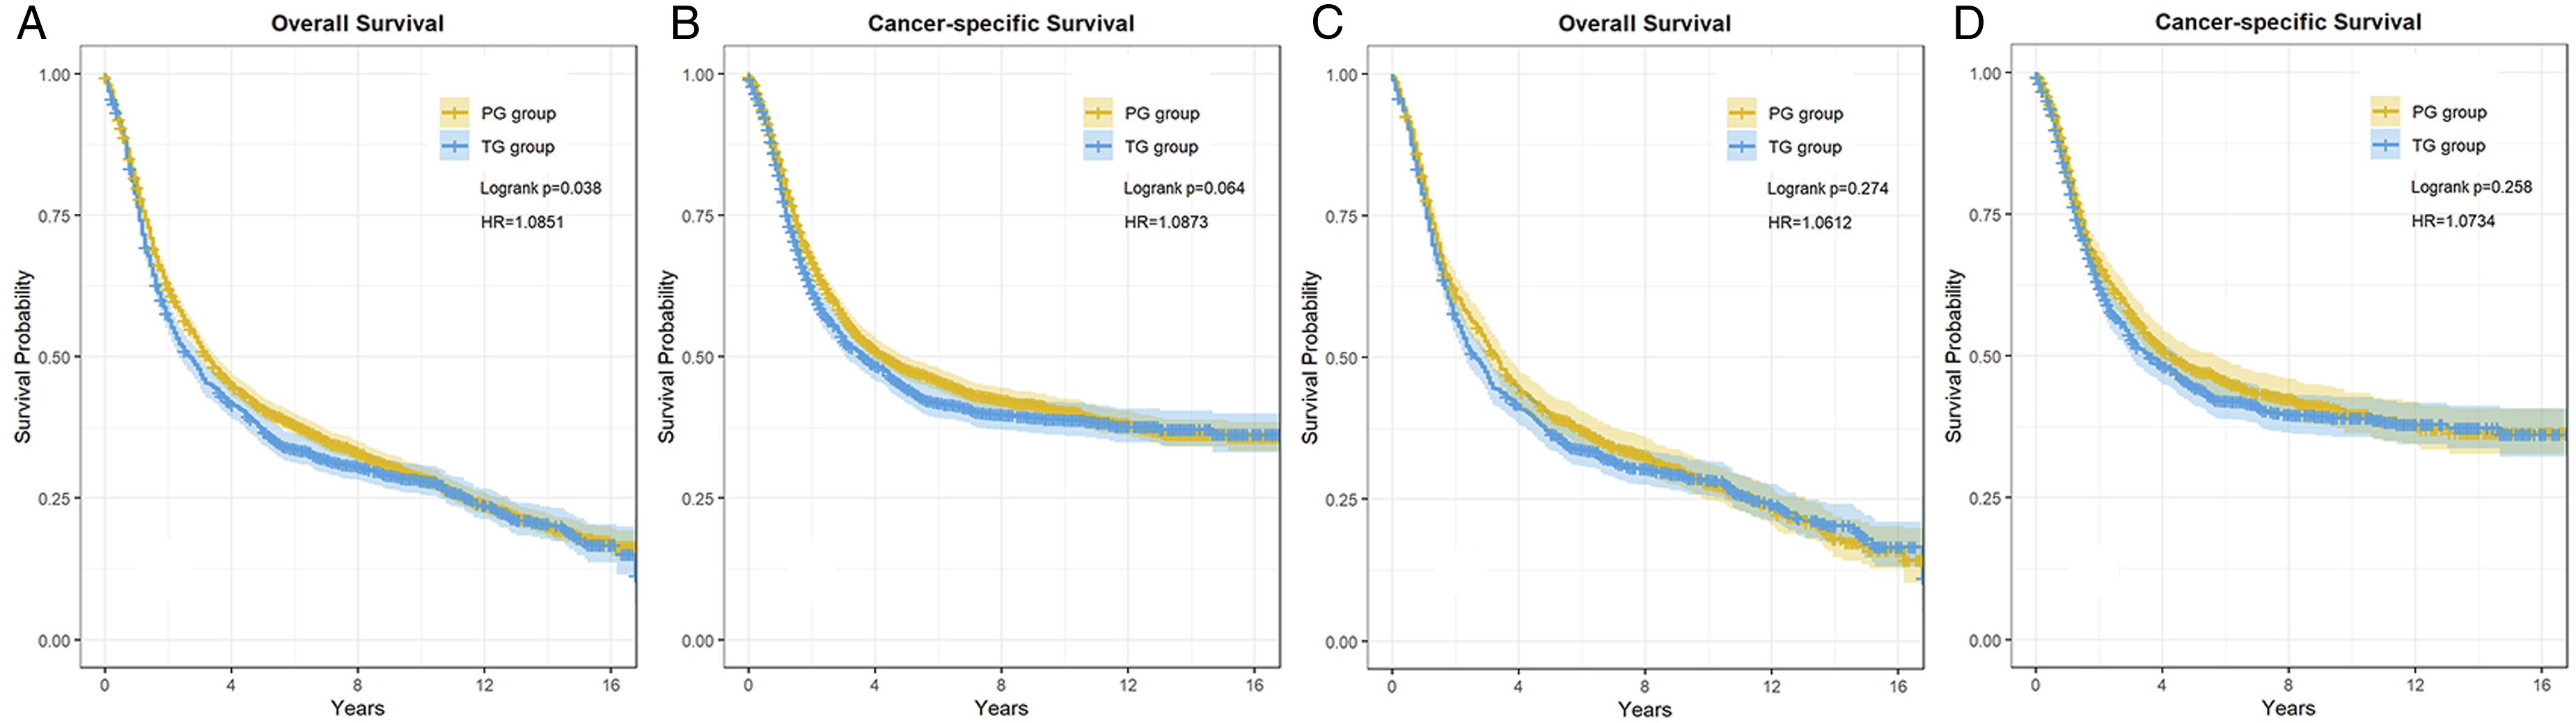
After PSM matching: The median OS in the PG group was 3.33 years, with OS at 1, 3, 5, 8, and 10 years being .797, .522, .399, .325, and .278, respectively. The median OS in the TG group was 2.58 years, and the OS at 1, 3, 5, 8, and 10 years was .769, .464, .364, .305, and .285, respectively. The median CSS of the PG group was 4.33 years, with 1, 3, 5, 8, and 10 years of CSS being .828, .575, .476, .424, and .398, respectively. The median CSS in the TG group was 3.58 years, and the CSS at 1, 3, 5, 8, and 10 years was .808, .529, .444, .398, and .391, respectively. Survival analysis showed that there was no statistically significant difference in OS (P = .274) and CSS (P = .258) between the PG and TG groups. (Figure 1(C), (D))
Multivariable and Univariable Analysis
Univariate and Multivariate Analyses.
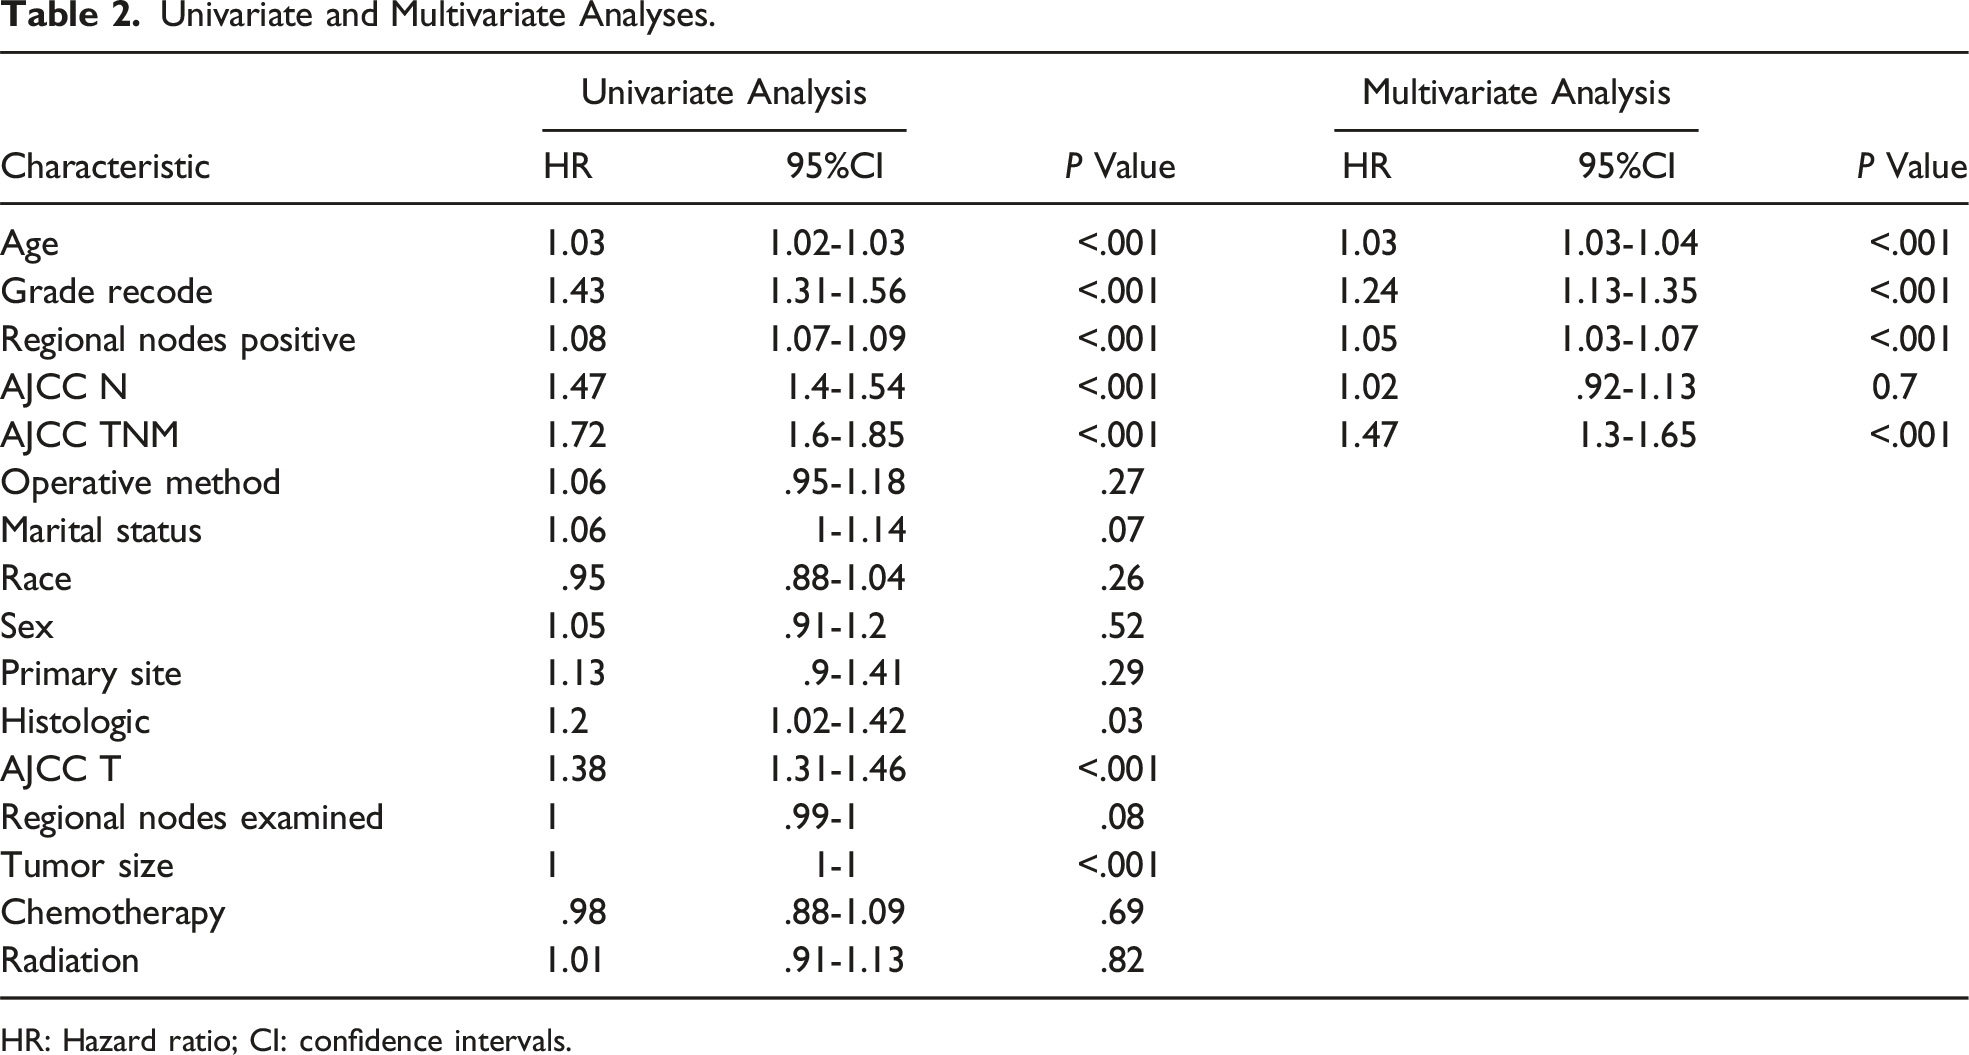
HR: Hazard ratio; CI: confidence intervals.
Subgroup Analysis
Impact of pathological grade on long-term survival
OS and CSS Comparisons Between PG and TG Before and After the PSM in the Subgroup Analysis.
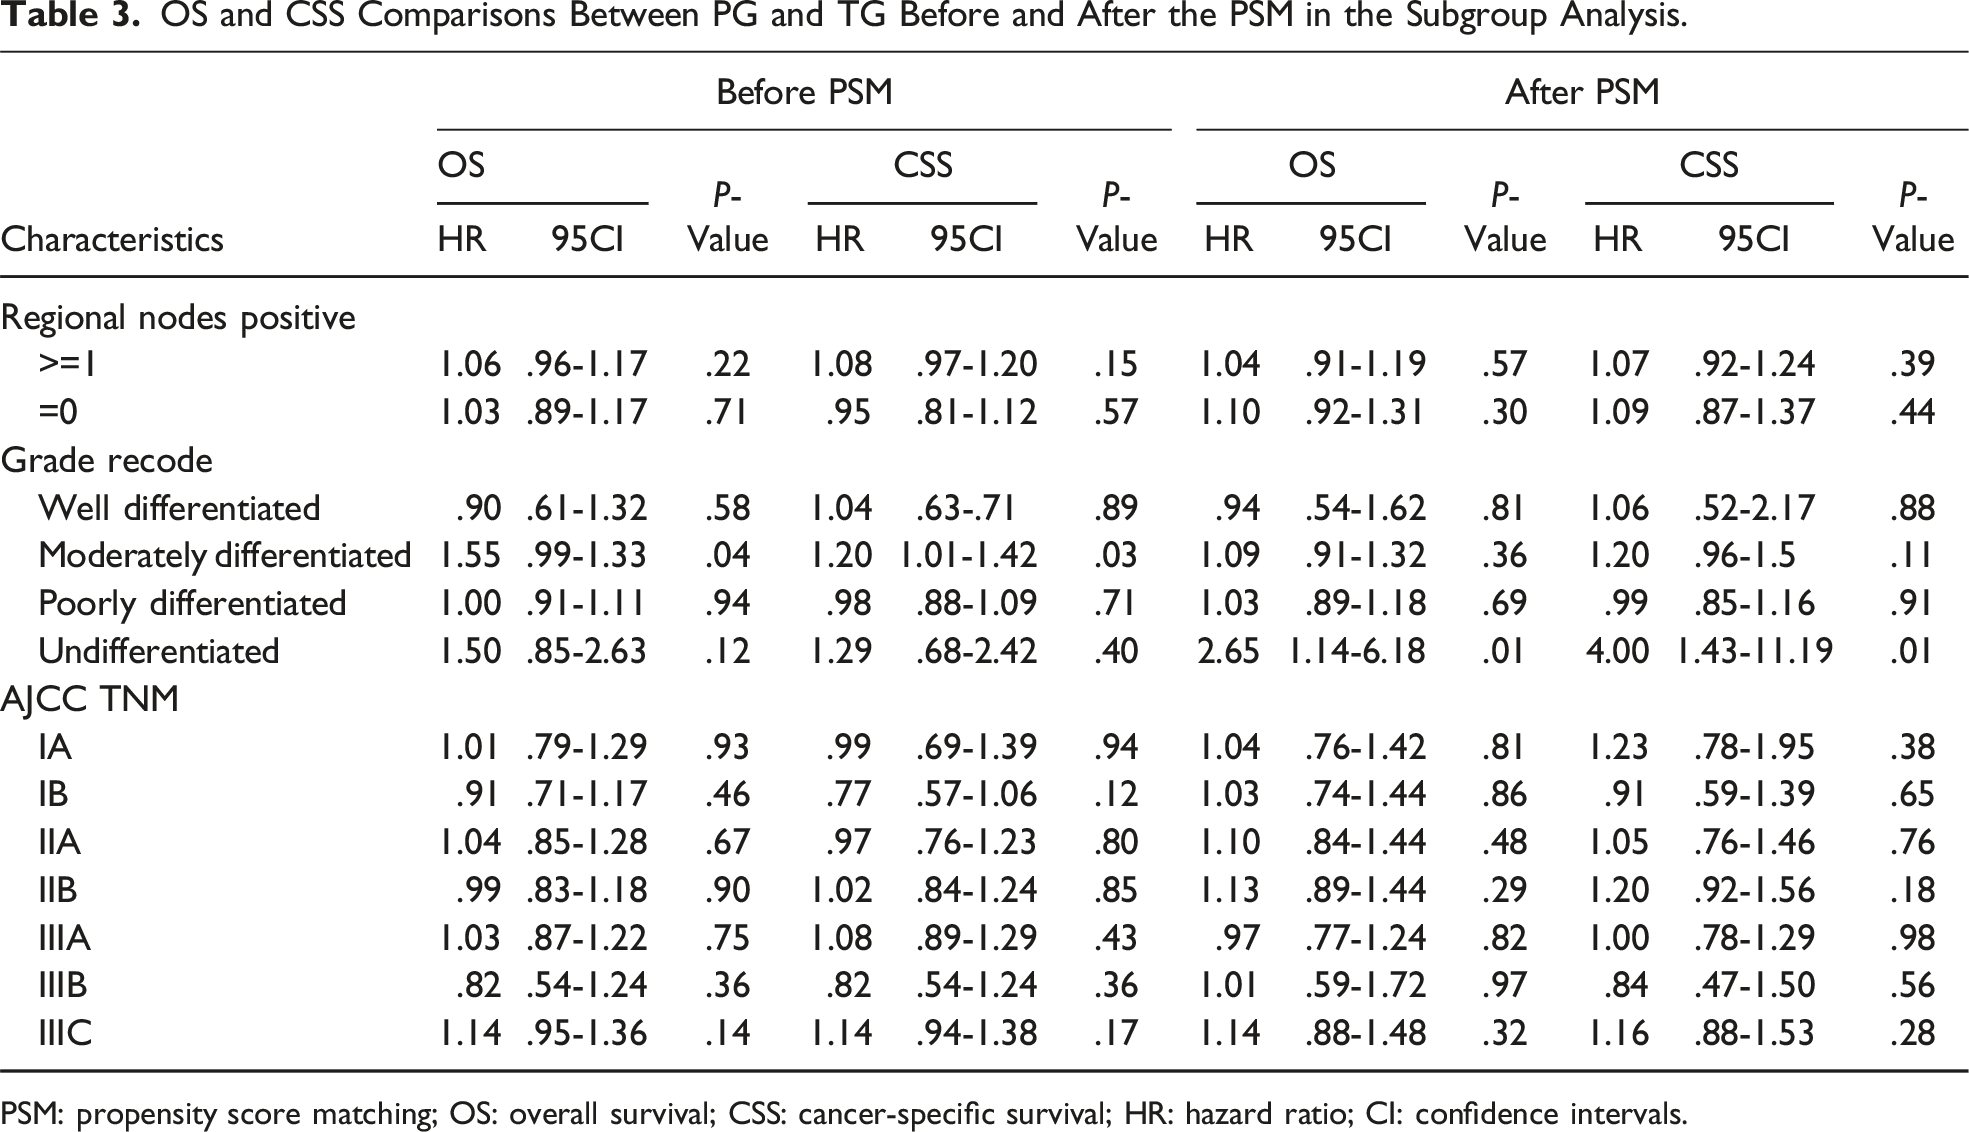
PSM: propensity score matching; OS: overall survival; CSS: cancer-specific survival; HR: hazard ratio; CI: confidence intervals.
Impact of TNM stage on long-term survival
The guidelines recommend PG surgery for cT1a/1bN0 (IA) stage upper one-third gastric cancer. 11 Our survival analysis did not find any differences in OS(HR = 1.039, 95%CI: 0.76-1.43, P = .81) and CSS(HR = 1.231, 95%CI: .778-1.948, P = .375) between the two surgical approaches for IA stage patients. We also compared other AJCC TNM stages separately and did not find statistically significant differences in OS and CSS between the two surgical approaches. (Table 3)
Discussion
In terms of statistics, although the incidence of GC has shown a declining trend, the number of PGC cases continues to rise. After TG, patients experience nutritional and metabolic disturbances, leading to a subsequent decline in quality of life. In cases where endoscopic procedures such as endoscopic mucosal resection (EMR) and endoscopic submucosal dissection (ESD) are not feasible, PG may be a reasonable choice. Despite the increasing research on the safety and technical feasibility of PG, there is currently no standardized treatment guideline for PGC undergoing PG internationally. In our analysis comparing the long-term survival outcomes of PGC patients undergoing PG and TG, we found that there was almost no difference in long-term OS and CSS between the two surgical approaches.
The meta-analysis by Chen 26 also demonstrated that PG and TG have similar 5-year overall survival, recurrence rates, reflux symptoms, and anastomotic leakage rates. However, TG had longer operative time, more estimated blood loss, and higher incidence of intestinal obstruction. In terms of serum nutritional levels, PG showed advantages over TG. Therefore, it is considered that for upper one-third gastric cancer, PG may be preferable over TG.
One of the main reasons why PG is not widely accepted is its inability to perform lymph node dissection around the distal stomach. 11 It is considered non-standard. Our study found that although the TG group had a higher total number of lymph nodes examined and positive lymph nodes than the PG group (P < .001), survival analysis revealed that the total number of lymph nodes examined was not an independent risk factor for patient OS. Moreover, when the positive lymph nodes were grouped using the optimal cutoff value and analyzed again, the PG and TG groups showed similar OS and CSS. Katai’s study 27 found that early PGC rarely metastasizes to distant lymph nodes. Yamashita 28 also found that tumors in the gastroesophageal junction with a diameter smaller than 4 cm rarely metastasized to lymph node groups 4sa, 4sb, 4d, 5, and 6, and this was independent of tumor location and T stage. Yura’s study 29 found that the 5-year survival rate of PGC undergoing PG in T2 and T3 stages was 72.9%, and the metastasis rates to lymph node groups 4SA, 4sb, 4d, 5, 6, 8A, and 12A were 3.47%, 1.49%, .99%, .00%, .00%, 2.02%, and .006%, respectively. Ri 30 also did not find lymph node metastasis to groups 4, 5, 6, and 12a in advanced gastric cancer (T2-T4) near the cardia. Takeuchi 31 also found no potential for lymph node metastasis to groups 5, 6, 10, or 11D in early upper one-third gastric cancer (T1N0). Therefore, it is considered unnecessary to anatomically dissect and clear these regions. 27
Furthermore, An 32 and Ronellenfitsch 33 suggested that patients undergoing PG may experience symptoms such as gastric reflux or gastroesophageal reflux caused by gastric filling, leading to a decrease in postoperative quality of life (QOL). Therefore, the choice of reconstruction method after PG is challenging, as it needs to prevent reflux esophagitis while ensuring adequate dietary intake. In addition to considering the short-term effects of the reconstruction method, long-term nutritional outcomes, anemia status, and residual gastric cancer recurrence should also be taken into account. 34 Esophagogastrostomy and small bowel reconstruction are common reconstruction methods after PG. Esophagogastrostomy includes simple esophagogastrostomy, tube‐like stomach esophagogastrostomy, side overlap with fundoplication by Yamashita (SOFY), and the double‐flap technique. Small intestine reconstruction methods include double-tract reconstruction, jejunal interposition, and jejunal pouch interposition. 34 Ahn 35 found that side-to-side esophagogastrostomy (SSEG) using linear staplers did not result in grade IV reflux esophagitis, making it potentially the most suitable reconstruction method after PG when combined with anti-reflux therapy. Unfortunately, the SEER database does not provide corresponding data on this matter.
Gastric undifferentiated carcinoma has a higher rate of lymph node metastasis and exhibits significant infiltrative growth. 36 Therefore, TG surgery may be more suitable for undifferentiated gastric cancer. However, our study results are contrary to this expectation, as the PG surgery group actually achieved better OS and CSS outcomes, and the reasons for this are not clear. However, the number of cases included in our study was small, which may have introduced selection bias, and we hope that larger prospective studies can confirm these findings.
There are still limitations to this study. 1. The study design is retrospective, which may introduce selection bias. 2. The SEER database lacks some important information, such as BMI, patients' underlying diseases, preoperative cardiopulmonary function evaluation, surgical margins, neural and vascular invasion, MSI status, and specific details of the chemotherapy and radiotherapy regimens. 3. Although we used PSM to reduce the impact of confounding factors on the results, there may still be some unaccounted confounders. 4. Some subgroups have a small number of cases, which may result in unreliable results. Despite these limitations, the SEER database remains a valuable resource for analyzing patient epidemiology, survival outcomes, and cancer treatments.
Conclusion
Patient age, pathological grade, the number of positive lymph nodes, and TNM overall staging are independent risk factors for OS in patients with PGC. Despite the theoretical advantage of TG in thoroughly clearing lymph nodes around the stomach, it demonstrates similar long-term outcomes compared to PG. Therefore, PG for treating PGC is considered safe in terms of long-term oncological results.
Supplemental Material
Supplemental Material - The Long-Term Results of Proximal Gastrectomy for Proximal Gastric Cancer: A Propensity Score Matching Analysis Based on SEER Database
Supplemental Material for The Long-Term Results of Proximal Gastrectomy for Proximal Gastric Cancer: A Propensity Score Matching Analysis Based on SEER Database by Wei Dai, Feng Wen, Xiang Li, and Zhongxue Fu in The American Surgeon™.
Data Availability Statement
The data used to support the results of this study can be provided to the corresponding authors upon request.
Footnotes
Declaration of Conflicting Interests
The author(s) declared no potential conflicts of interest with respect to the research, authorship, and/or publication of this article.
Funding
The author(s) received no financial support for the research, authorship, and/or publication of this article.
Supplemental Material
Supplemental material for this article is available online.
References
Supplementary Material
Please find the following supplemental material available below.
For Open Access articles published under a Creative Commons License, all supplemental material carries the same license as the article it is associated with.
For non-Open Access articles published, all supplemental material carries a non-exclusive license, and permission requests for re-use of supplemental material or any part of supplemental material shall be sent directly to the copyright owner as specified in the copyright notice associated with the article.