
Abstract
Background
Major lower extremity amputations (LEA) are frequently performed by vascular, trauma, and orthopedic surgeons, yet comparative outcomes across services and the role of frailty remain unclear.
Materials and Methods
We conducted a single-center retrospective review of adults undergoing major LEA (above-knee, through-knee, and below-knee) from 2015-2022. Frailty was assessed using the 5-factor modified Frailty Index (mFI-5). Outcomes included complications, length of stay (LOS), readmission, re-amputation, mortality, and prosthetic ambulation. We evaluated 30-day return to the operating room (RTOR) overall and separated planned staged open guillotine amputation (OGA)-to-closure returns from unplanned RTOR.
Results
Among 684 patients (689 LEAs), vascular surgery (VS) performed 44% of procedures, trauma surgery (TS) 37%, and orthopedic surgery (OS) 19%. Median LOS was 14 days and 30-day mortality was 10.8%; 36% achieved prosthetic ambulation. OS had higher ambulation than VS and TS in both non-frail and frail subgroups. Overall, 30-day RTOR differed by service and was highest after TS; however, these differences were largely attributable to planned staged OGA-to-closure returns, while unplanned RTOR did not significantly differ by service. On multivariable analysis, both VS and TS had lower odds of prosthetic ambulation than OS (adjusted OR ≈0.34).
Discussion
Surgical service line and frailty are associated with outcomes after major LEA. Differences in ambulation, particularly among non-frail patients, suggest that service-specific pathways and perioperative processes may influence functional recovery and represent targets for standardized LEA pathways.
Keywords
Key Takeaways
• Surgical service and patient frailty were associated with outcomes after major lower extremity amputation: orthopedic surgery achieved the highest prosthetic ambulation in both non-frail (60.2%) and frail (72.7%) patients. • 30-day RTOR (overall, including planned staged OGA closure) differed by service (highest TS, lowest VS); however, after separating RTOR into planned staged OGA-to-closure vs unplanned RTOR, only planned staged returns differed by service, while unplanned RTOR did not. • Unadjusted mortality differed by service (lowest after orthopedic surgery), while unadjusted 1-year re-amputation did not differ significantly; in adjusted models, 1-year re-amputation was higher after vascular surgery compared with orthopedic surgery, but this finding should be interpreted cautiously given limited event counts.
Introduction
Major lower extremity amputations (LEA) have become increasingly common, with approximately 2 million people in the United States living with limb loss. 1 These amputations can occur due to severe infection, ischemia, and/or trauma. 2 While the amount of trauma and cancer-related amputations has decreased, amputations related to vascular compromise have increased substantially in recent years. 3 Increased prevalence of diabetes, obesity, smoking, hypertension, and hyperlipidemia, significant risk factors for peripheral vascular disease (PVD), may explain these findings.3-5 Major LEA can cause profound physical and psychological consequences in a patient’s life. 6 Therefore, maintaining ambulatory status with a prosthesis following amputation is imperative for one’s independence, everyday function, and quality of life.
Various surgical services perform major LEA, including vascular (VS), trauma (TS), and orthopedic (OS) surgery. Prior work suggests that surgeon specialty and service line may influence outcomes, with studies in other domains (eg, lung resection and colorectal hepatic metastasectomy) demonstrating differences in mortality and recurrence by subspecialty.7-10 In the LEA literature, Pei et al reported higher pneumonia, sepsis, and mortality after below-knee amputation when procedures were performed by general rather than vascular surgeons, and Sebekos et al found fewer complications when orthopedic surgeons performed below-knee amputation (BKA) compared to vascular and general surgeons.11,12
Frailty is increasingly recognized as a key determinant of postoperative outcomes in vascular surgery, including higher rates of wound complications and mortality.14,15 However, few studies examining major LEA have incorporated frailty, and none to our knowledge have evaluated how frailty and surgical service jointly relate to outcomes across above- (AKA), through- (TKA), and below-knee (BKA) amputations.
This retrospective study evaluated whether the primary surgical service performing major LEA—vascular, trauma, or orthopedic—is associated with complications, return to the operating room (RTOR), re-amputation, mortality, and prosthetic ambulation, and whether these relationships differ by frailty status using the 5-factor modified Frailty Index (mFI-5). We hypothesized that patient frailty would be a strong predictor of adverse outcomes and that service-line variation in outcomes would persist after accounting for baseline differences in case mix.
Methods
We performed a single-center retrospective review of all patients receiving major LEA at a tertiary care center between 2015 and 2022. This study was approved by the Institutional Review Board (IRB) (HP-00085462_4) at the University of Maryland. Because of the retrospective nature of the study, consent of individual patients was waived. Guidelines for Good Clinical Practice were followed in all research methods.
Patient data were obtained from the institutional electronic medical record (EMR) using Current Procedural Terminology (CPT) codes for major LEA (AKA CPT: 27590, TKA CPT: 27592, BKA CPT: 27880). Inclusion criteria were patients ≥18 years of age who underwent a BKA, TKA, or AKA. Patients were excluded if they underwent only minor amputations (transmetatarsal, Syme, or Boyd procedures) or if documentation was insufficient to determine baseline characteristics, operative details, and at least 30-day postoperative outcomes (RTOR, complications, mortality, and ambulation). Data obtained from chart review included patient demographics (age, sex, race, ethnicity, body mass index (BMI), primary insurance coverage, smoking history) and medical comorbidities. Preoperative data included indication for amputation. Indication for amputation was abstracted from the attending surgeon’s documentation and categorized as ischemia, infection, trauma, sarcoma, or other. Patients with mixed etiologies (eg, traumatic injury with subsequent ischemia) were classified according to dominant cause leading to amputation. Perioperative data included primary amputation date, surgical service performing the procedure, amputation level, and operative time.
The primary outcome was prosthetic ambulation at follow-up. Postoperative ambulation was defined as independent community ambulation with a prosthesis, without a cane, walker, or wheelchair, documented by a physician or physical therapist in the medical record. 13
Secondary outcomes included the following: • 30-day RTOR: any return to the operating room within 30 days of the index amputation. Because open guillotine amputations (OGA) often undergo an intentionally planned staged return for definitive revision/closure, we also categorized RTOR as (1) planned staged RTOR for definitive revision/closure after OGA and (2) unplanned RTOR within 30 days, defined as any RTOR excluding planned staged OGA-to-closure returns. • Surgical site infection (SSI) and sepsis: abstracted from clinician documentation using institutional definitions based on CDC criteria. • Length of stay (LOS): total days from index amputation admission to discharge. • Readmission: 30-day and 90-day hospital readmission following discharge after the index amputation. • Re-amputation: any subsequent ipsilateral or contralateral amputation at any level; planned OGA revision/closure and debridement/washout procedures were not considered re-amputations. • Mortality: death within 30 days, 1 year, and 5 years of the index amputation.
For time-to-event outcomes, time zero was the date of the index amputation; patients were censored at death or end of follow-up.
Frailty status was calculated with the mFI-5. 14 Patient frailty was scored on a scale of 0 to 5 and was calculated based on the presence of 5 comorbidities: congestive heart failure (CHF) within 30 days before surgery, insulin-dependent or noninsulin-dependent diabetes mellitus, chronic obstructive pulmonary disease or pneumonia, partially dependent or totally dependent functional health status at the time of surgery, and hypertension.
Continuous variables were summarized as mean ± standard deviation (SD) or median [interquartile range, IQR] as appropriate; age is reported as mean ± SD and LOS as median [IQR]. Categorical variables are presented as counts (percentages). Group comparisons used χ2 tests or Kruskal-Wallis tests (two-sided α = 0.05). Adjusted analyses included logistic regression for ambulation, surgical site infection (SSI), 30-day readmission, and 1-year re-amputation, and negative binomial regression for LOS. Covariates were prespecified: age, sex, race, BMI ≥30, mFI-5, indication, amputation level, OGA, end-stage renal disease (ESRD), PVD, and year of surgery; service line was the exposure. Multiple amputations per patient were accounted for using cluster-robust standard errors. Analyses were performed in Jamovi v2.3 (Sydney, Australia) and Python (statsmodels 0.14).
Results
Cohort Characteristics
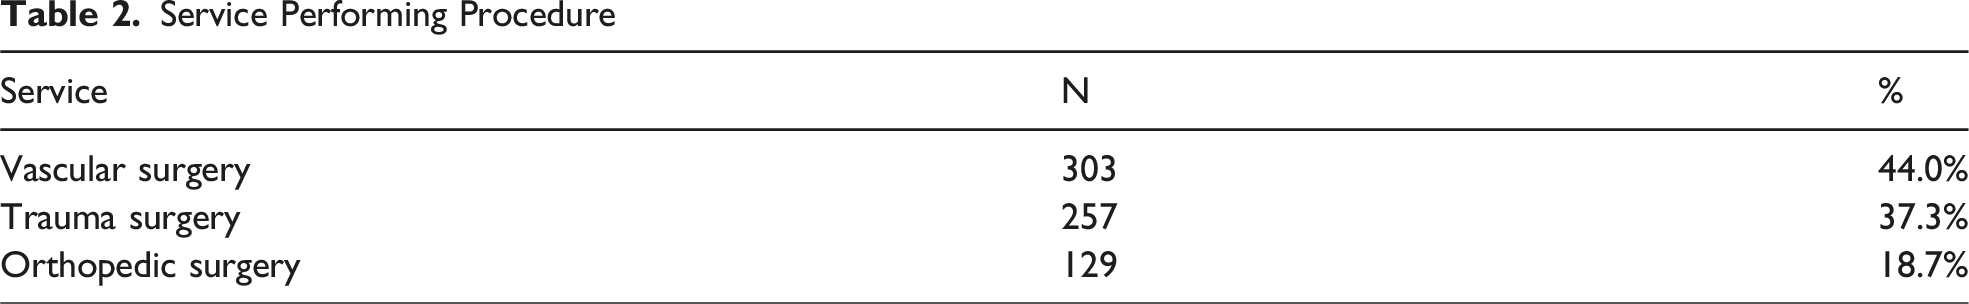
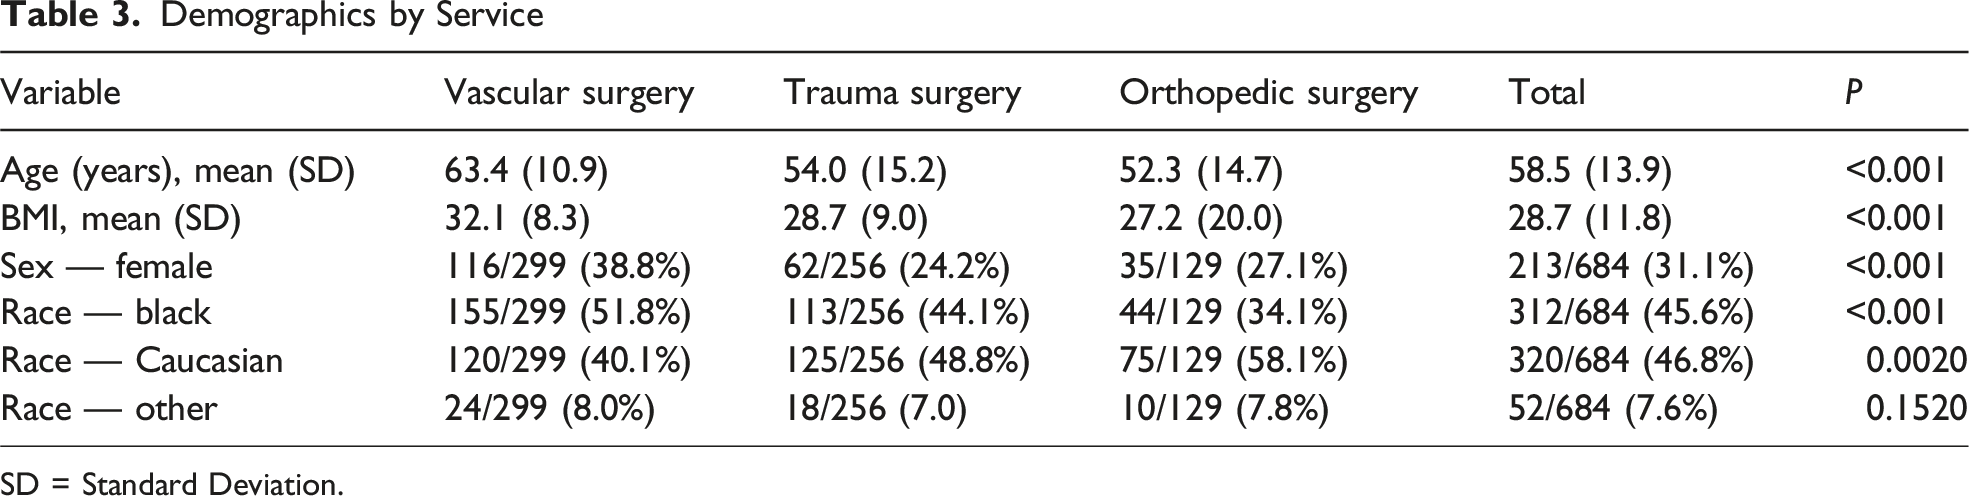
Between 2015 and 2022, 684 patients (470 male; mean age, 58.5 ± 13.9 years; 312 [45.6%] were Black) underwent 689 major LEA (51.2% BKAs, 17.3% TKAs, and 31.5% AKAs) for ischemia (n = 286 [41.5%]), infection (n = 274 [39.8%]), trauma (n = 101 [14.7%]), sarcoma (n = 6 [0.9%]), and other causes (n = 22 [3.2%]). 97.8% of patients had health insurance (50.9% with Medicare, 24.7% with Medicaid, and 24.4% with other forms of insurance). The mean BMI was 28.7, with 34.3% of patients having a BMI greater than 30. VS performed 303 amputations (44%), TS performed 257 amputations (37.3%), and OS performed 129 amputations (18.7%) (Tables 1-3).
Baseline Characteristics by Service
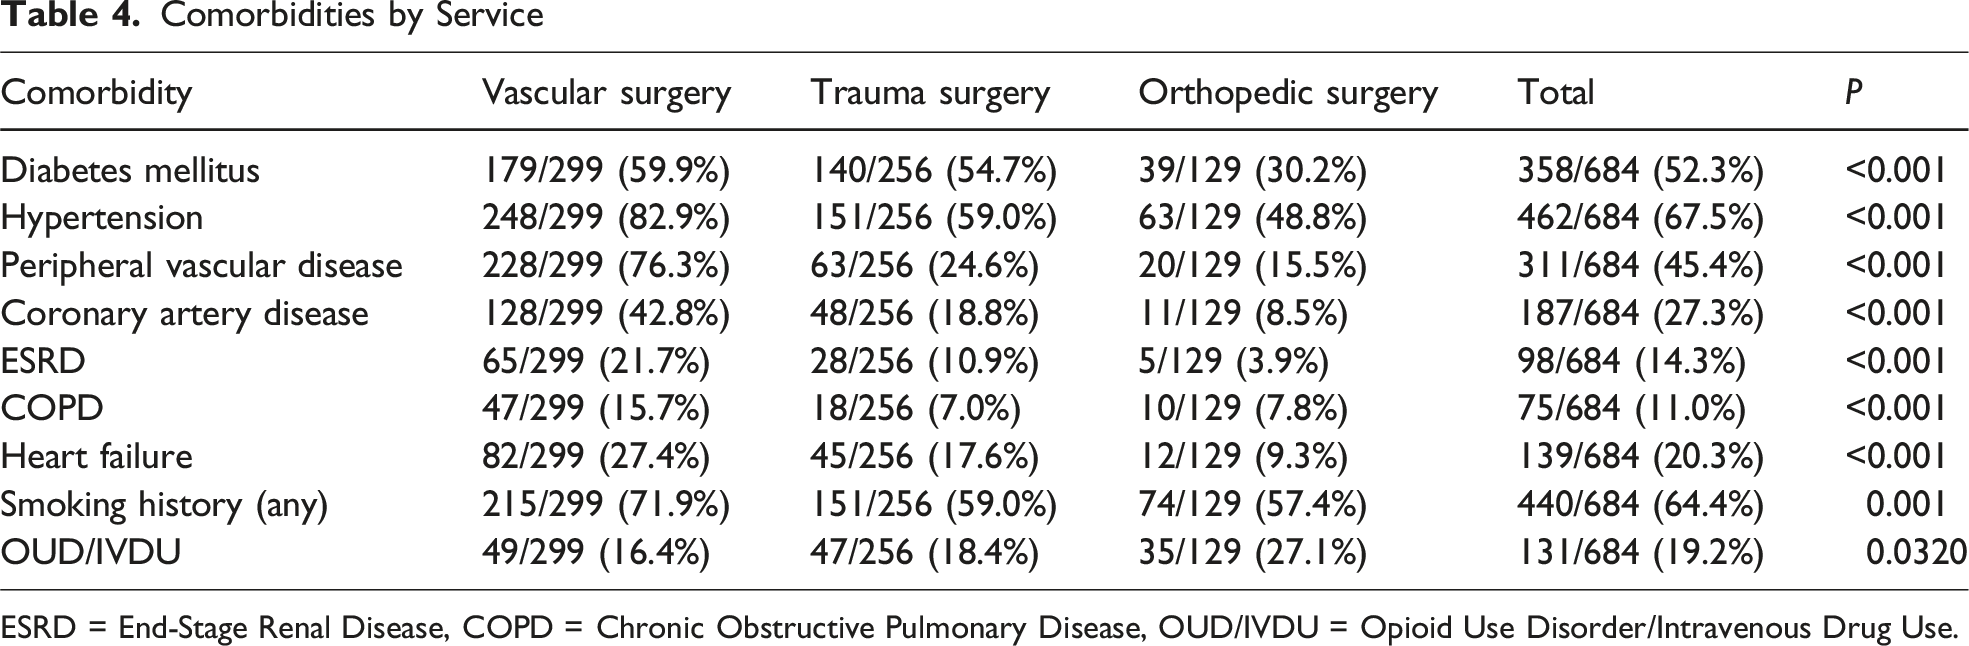
Common comorbidities in the population included diabetes mellitus in 358 patients (52.3%), hypertension in 462 patients (67.5%), PVD in 311 patients (45.4%), coronary artery disease in 187 patients (27.3%), opioid use disorder in 131 patients (19.2%), and ESRD in 98 patients (14.3%). 64.4% of the patient population had a smoking history, either currently or formerly (Table 4). Among patients treated by VS, TS, and OS services, ethnicity, current marriage, primary insurance coverage, amputation level, and surgical indication did not differ significantly among services. VS patients were older, with a mean age of 63.4 years, compared to OS patients with a mean age of 52.3 years (P < 0.001). Patients treated by TS were more likely to have BMI <30 (57.6%), whereas patients treated by VS were more likely to have BMI ≥30 (56.3%). VS patients were more likely to be Black (51.8%), while TS and OS patients were more likely to be Caucasian (49% and 58.1%, respectively). Overall, 549 patients (80.3%) were non-frail (mFI-5 < 3) and 135 (19.7%) were frail (mFI-5 ≥ 3). Patients treated by VS had higher frailty scores than those treated by TS or OS, with a greater proportion of frail patients in the VS cohort.
Operative and In-Hospital Outcomes
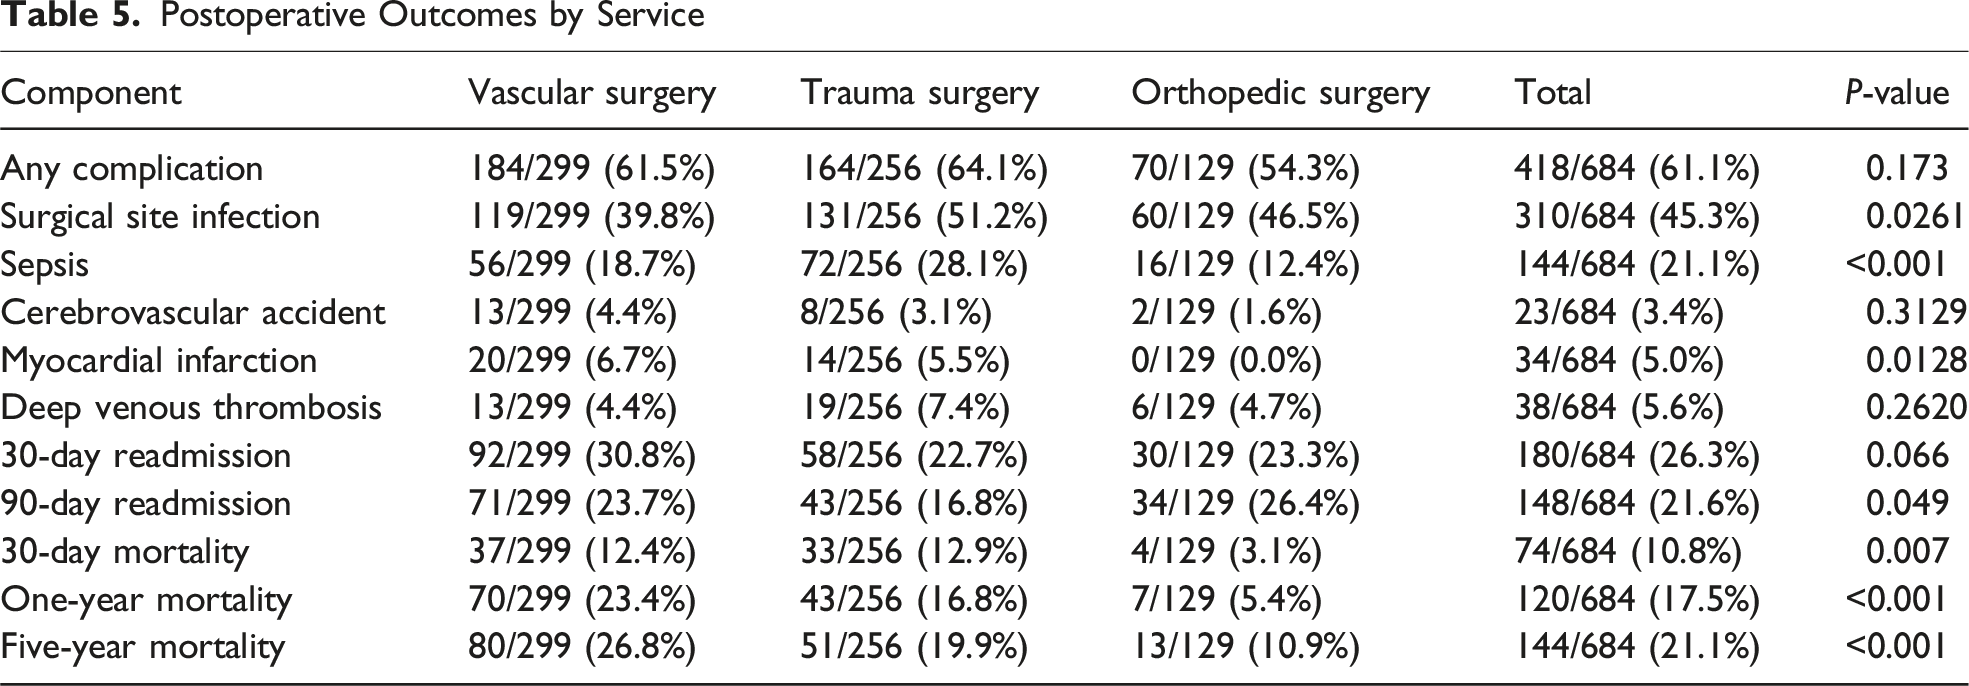
There were 370 OGAs; planned definitive revision/closure after OGA was categorized as planned staged RTOR. The average operative time was 105.9 minutes. Major LEA complications were present in 61% of the population. The most common complication was surgical site infection in 310 patients (45.3%). 30-day mortality occurred in 10.8% of major LEA patients (Table 5). Overall hospital LOS was 14 days [9-22]; by service: VS 14, TS 15, OS 12. 36% of patients were able to achieve ambulation with a prosthesis.
Outcomes Stratified by Frailty and Service
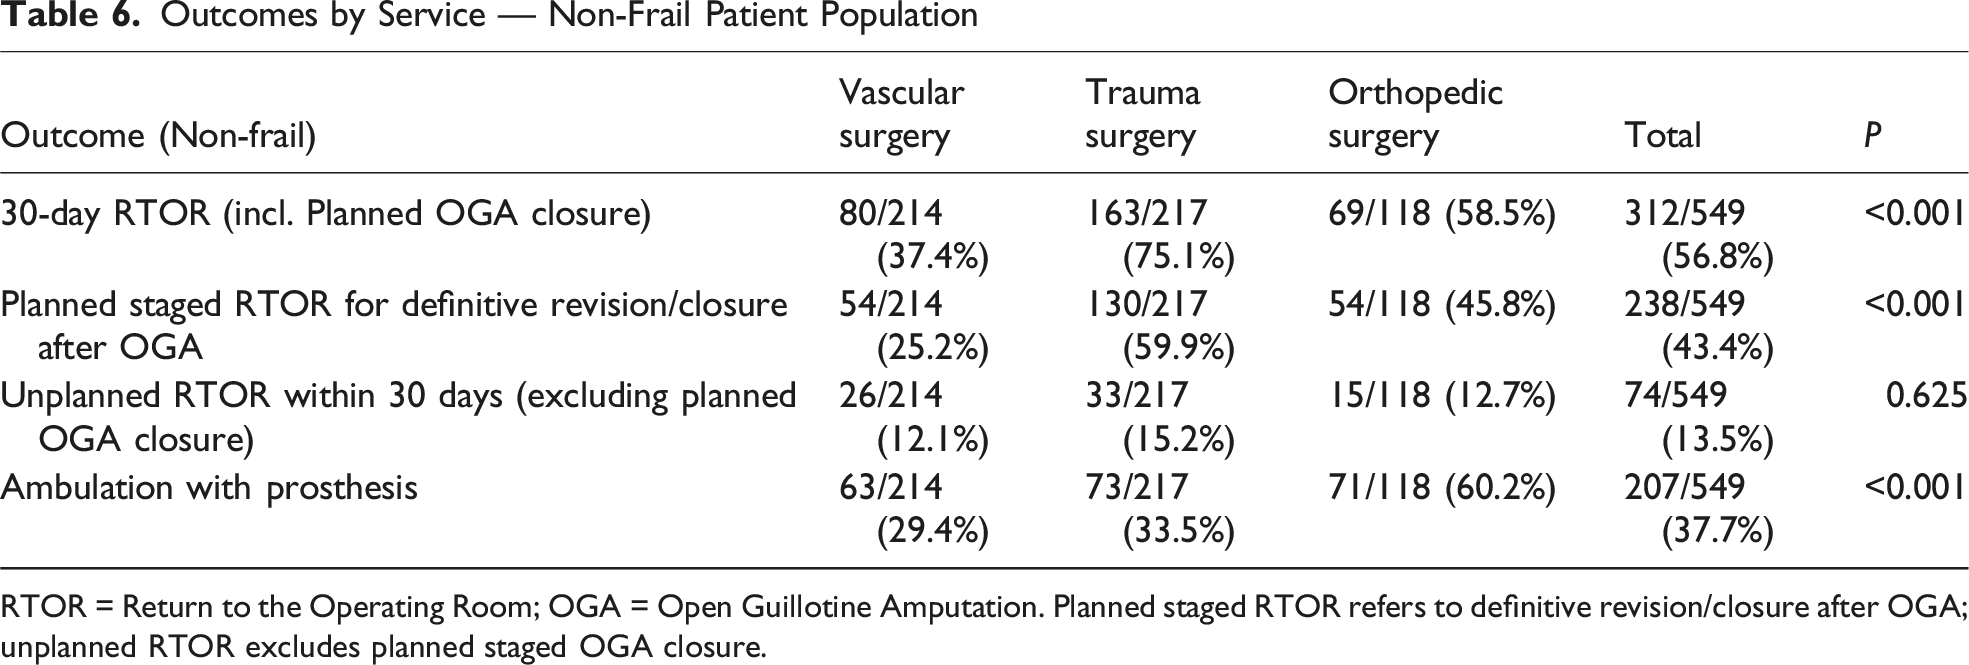
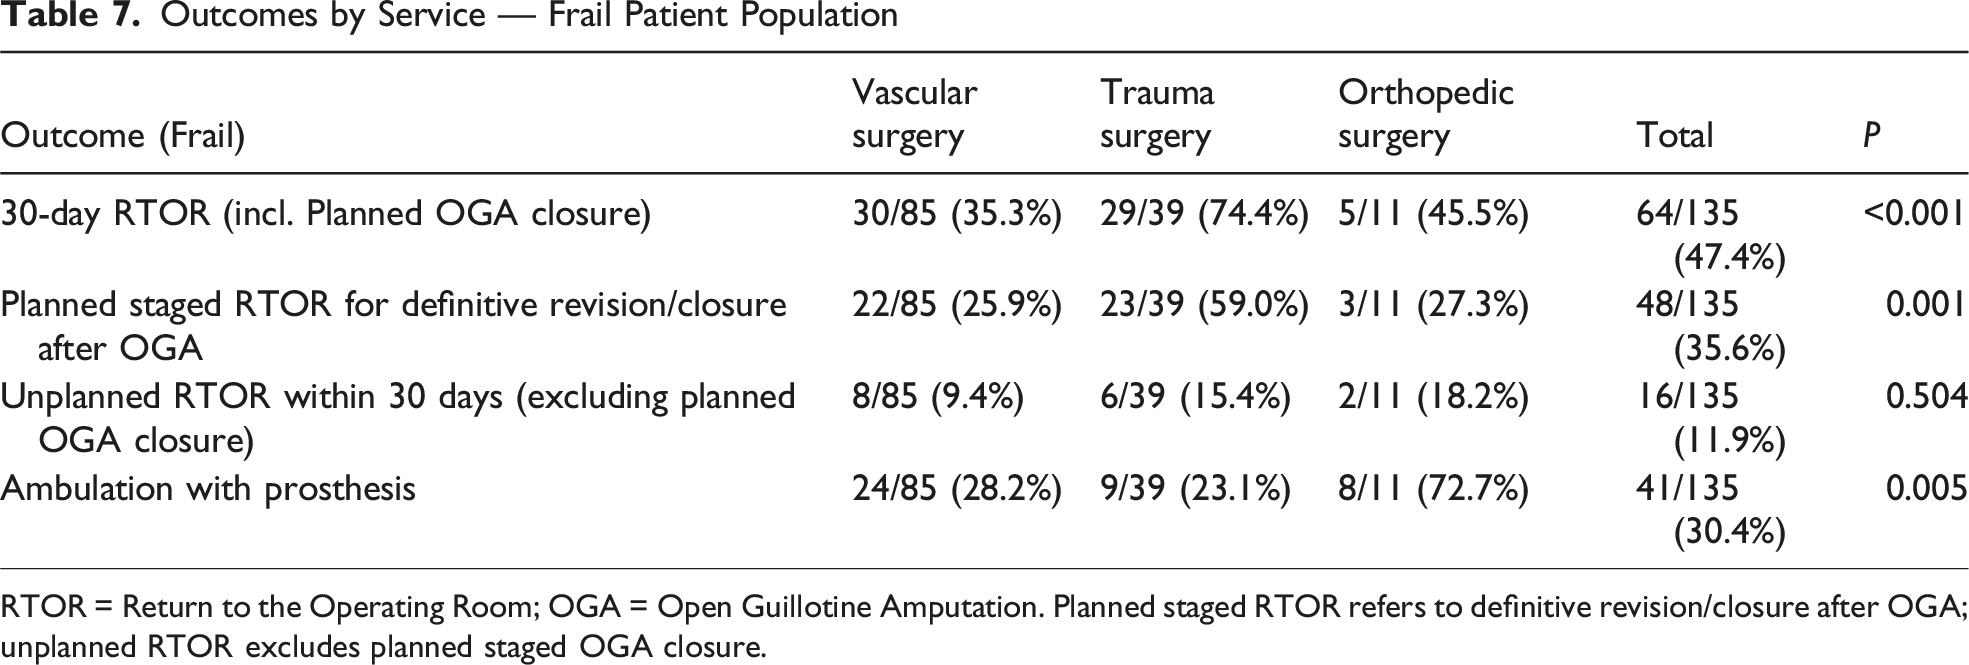
In the 549 non-frail patients, 30-day RTOR differed by service (VS 37.4%, TS 75.1%, OS 58.5%; P < 0.001). When RTOR was separated into planned staged OGA-to-closure vs unplanned RTOR, the observed differences in overall 30-day RTOR were largely attributable to planned staged returns. In the non-frail cohort, planned staged RTOR differed significantly by service (VS 25.2%, TS 59.9%, OS 45.8%; P < 0.001), while unplanned RTOR did not differ (VS 12.1%, TS 15.2%, OS 12.7%; P = 0.625). In the frail cohort, planned staged RTOR also differed by service (VS 25.9%, TS 59.0%, OS 27.3%; P = 0.001), whereas unplanned RTOR did not (VS 9.4%, TS 15.4%, OS 18.2%; P = 0.504). Orthopedic surgeons’ successful postoperative ambulation rate of 60.2% was significantly greater than 33.5% for trauma and 29.4% for VS patients (P < 0.001). There were no significant differences between surgical specialties in the 30-day or 1-year mortality and 1-year re-amputation rates. Among the 135 frail patients, the hospital LOS medians were 14.5 days for VS, 17 days for TS, and 12 days for OS. There were no significant differences between surgical specialties in 30-day or 1-year mortality or 1-year re-amputation rates. TS patients were significantly more likely to require a 30-day RTOR (P < 0.001) and OS patients were significantly more likely to achieve ambulation with a prosthesis (P = 0.005) (Tables 6 and 7).
Multivariable Analysis of Prosthetic Ambulation and Secondary Outcomes
Overall, 36% of patients achieved prosthetic ambulation after major LEA. In unadjusted analyses, OS had substantially higher prosthetic ambulation (79/129; 61.2%) compared with TS (82/256; 32.0%) and VS (87/299; 29.1%) (overall P < 0.001). Increasing age and more proximal amputation level (TKA/AKA vs BKA) were also associated with reduced odds of prosthetic ambulation, whereas sex, race, BMI ≥30, OGA, ESRD, PVD, and year of surgery were not significantly associated with ambulation in unadjusted models.
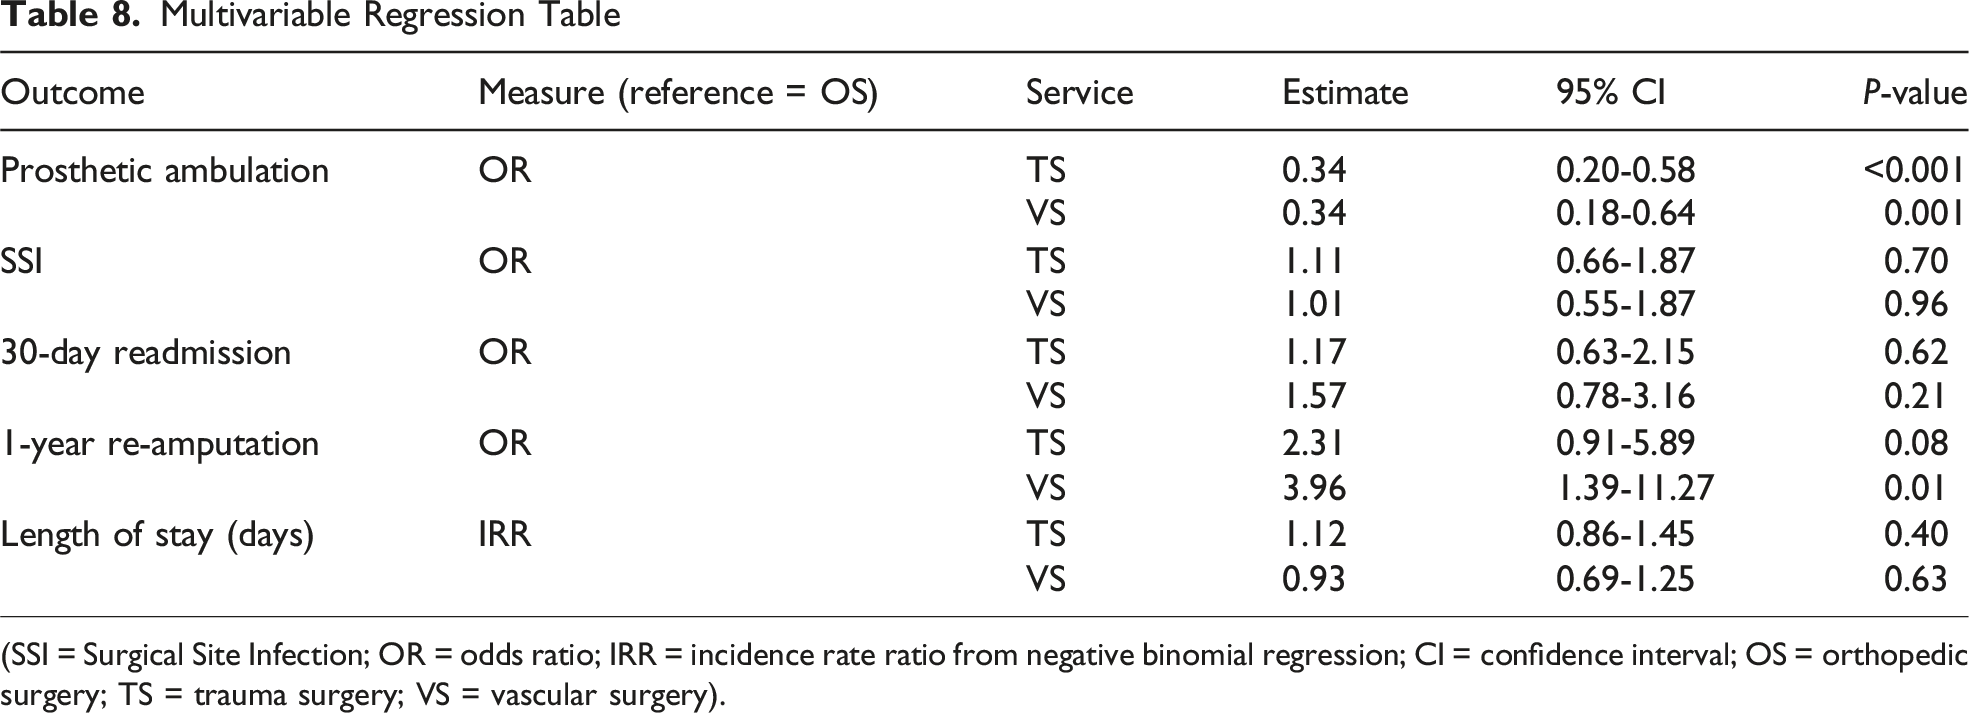
In the multivariable logistic regression adjusting for age, sex, race, BMI ≥30, mFI-5, indication, amputation level, OGA, ESRD, PVD, and year of surgery, service line remained a strong predictor of prosthetic ambulation. Compared with OS, both VS (adjusted odds ratio [OR] 0.34, 95% CI 0.18-0.64, P = 0.001) and TS (adjusted OR 0.34, 95% CI 0.20-0.58, P < 0.001) had significantly lower odds of prosthetic ambulation (Table 8). Older age and more proximal amputation level remained independently associated with lower ambulation, while mFI-5, BMI ≥30, ESRD, PVD, and year of surgery were not significantly associated with prosthetic ambulation after adjustment.
In adjusted models, surgical service line was not significantly associated with SSI, LOS, or 30-day readmission. Compared with OS, TS (adjusted OR 1.11, 95% confidence interval [CI] 0.66-1.87, P = 0.70) and VS (OR 1.01, 95% CI 0.55-1.87, P = 0.96) had similar odds of SSI. For 30-day readmission, adjusted odds were 1.17 (95% CI 0.63-2.15, P = 0.62) for TS and 1.57 (95% CI 0.78-3.16, P = 0.21) for VS vs OS. LOS was likewise similar by service line (TS vs OS incidence rate ratio [IRR] 1.12, 95% CI 0.86-1.45; VS vs OS IRR 0.93, 95% CI 0.69-1.25).
In contrast, the adjusted 1-year re-amputation model suggested higher odds of re-amputation after VS compared with OS (adjusted OR 3.96, 95% CI 1.39-11.27, P = 0.01), with a nonsignificant trend for TS (OR 2.31, 95% CI 0.91-5.89, P = 0.08). Unadjusted 1-year re-amputation rates did not differ significantly by service (global P≈0.06). These secondary analyses should be interpreted cautiously given the limited re-amputation events and potential residual confounding.
Discussion
In this single-center retrospective study of 689 major LEAs, we evaluated whether surgical service line and frailty were associated with complications, RTOR, mortality, re-amputation, and prosthetic ambulation. We observed service-line variation in functional outcomes: OS had higher prosthetic ambulation. TS had the highest overall 30-day RTOR; importantly, after separating planned staged OGA-to-closure returns from unplanned RTOR, differences in overall RTOR were largely driven by planned staged returns, while unplanned RTOR did not significantly differ by service. Unadjusted mortality differed by service (lowest in OS), which likely reflects differences in baseline case mix and comorbidity burden.
VS performed 44% of major LEAs, TS 37.3%, and OS 18.7%. Ischemia was the most common indication, and amputations for ischemia or infection were frequently performed by TS, likely reflecting our trauma center’s case mix and referral patterns and, at other institutions, the availability of dedicated vascular services or reliance on general surgeons. Patients had substantial comorbid burden—most commonly hypertension (67.5%), diabetes mellitus (52.3%), and PVD (45.4%)—and overall lower baseline functional status.
OS patients had higher prosthetic ambulation, particularly among non-frail patients, and a numerically lower composite complication rate than TS and VS, although this composite difference was not statistically significant. SSI differed by service, highest after TS and lowest after VS, paralleling prior work by Sebekos et al showing fewer overall complications, including wound and cardiovascular complications and prolonged LOS, when orthopedic surgeons performed BKA. 12 In our broader cohort including AKA, TKA, and BKA across 3 services, we likewise observed higher ambulation after OS and higher 30-day RTOR after TS. The OS cohort was younger and less comorbid, which likely contributed to these findings. Even after adjustment for measured comorbidities, frailty, and amputation level, unmeasured factors such as pre-amputation functional status, social support, and rehabilitation intensity likely influence service-line differences and limit causal inference.
Adjusted analyses confirmed that higher ambulation after OS was not explained by age, case mix, comorbidities, or frailty. In multivariable models adjusting for demographic, clinical, and operative factors, VS and TS had roughly one-third the odds of prosthetic ambulation compared with OS. This supports a role for service-specific factors—such as patient selection, operative technique, perioperative pathways, and early rehabilitation—in shaping functional recovery after LEA. Older age and more proximal level remained strong predictors of lower ambulation, emphasizing careful limb-preservation and level selection. The absence of an independent effect of continuous mFI-5 in adjusted models likely reflects overlap between frailty, comorbidity, and service-level practice patterns rather than a lack of prognostic value.
Frailty, assessed with the mFI-5, was a strong determinant of postoperative outcomes: patients with mFI-5 ≥ 3 had higher complications, RTOR, and mortality than non-frail patients. These findings parallel those of Karam et al, who reported increasing wound infection and mortality with higher frailty indices in vascular surgery. 15 The prevalence of comorbidities in our cohort underscores the importance of frailty assessment and risk stratification preoperatively, as well as tailored perioperative planning and goals-of-care discussions.
These results parallel work linking surgical specialization to outcomes in other domains, reinforcing that service-specific training and pathways influence results.9,10,16-18 Standardizing LEA care—particularly OGA-to-closure protocols and early prosthetics/rehabilitation—and embedding routine mFI-5 screening may reduce variability and improve function, while acknowledging that pre-amputation function and rehabilitation practices likely also contribute to service-line differences.
This study has limitations, including its retrospective single-center design, potential misclassification of indications, limited data on preoperative function, time to amputation, and service-specific rehabilitation pathways, and the potential for residual confounding, which may limit generalizability of findings to other settings. We did not capture time from admission to amputation or the number of procedures before the index amputation, which may differ by service and influence outcomes. Ambulation was abstracted from clinician documentation rather than standardized testing, and there was no institutional LEA rehabilitation pathway; prosthetics referral and physical therapy were at the discretion of the treating service. Nonetheless, surgical service line and frailty appear to be important correlates of postoperative outcomes after major LEA. Service-line differences in prosthetic ambulation, coupled with similar mortality and modest differences in 1-year re-amputation, suggest potentially modifiable processes of care—such as timing of amputation, perioperative optimization, and early prosthetics/rehabilitation—that could be standardized. Future multicenter studies should clarify which elements of LEA care pathways most strongly influence functional recovery in diverse practice settings and how frailty-informed, standardized protocols can be implemented to reduce variation and improve patient-centered outcomes.
Footnotes
Ethical Considerations
This study received ethical approval from the University of Maryland Institutional Review Board (approval HP-00085462_4). This is an IRB-approved retrospective study, all patient information was de-identified and patient consent was not required. Patient data will not be shared with third parties.
Consent to Participate
Informed consent to participate was waived by the IRB.
Funding
The authors received no financial support for the research, authorship, and/or publication of this article.
Declaration of Conflicting Interests
The authors declared no potential conflicts of interest with respect to the research, authorship, and/or publication of this article.
Data Availability Statement
De-identified data and analytic code are available upon reasonable request.
Prior Presentation
Portions of this work were presented as a podium presentation at the Southeastern Surgical Congress (SESC) Annual Meeting in 2023.
Appendix
Frailty mFI-5 ≥3 = Frail. Amputation Level and Indication BKA = Below-Knee Amputation, TKA = Through-Knee Amputation, AKA = Above-Knee Amputation. Service Performing Procedure Demographics by Service SD = Standard Deviation. Comorbidities by Service ESRD = End-Stage Renal Disease, COPD = Chronic Obstructive Pulmonary Disease, OUD/IVDU = Opioid Use Disorder/Intravenous Drug Use. Postoperative Outcomes by Service Outcomes by Service — Non-Frail Patient Population RTOR = Return to the Operating Room; OGA = Open Guillotine Amputation. Planned staged RTOR refers to definitive revision/closure after OGA; unplanned RTOR excludes planned staged OGA closure. Outcomes by Service — Frail Patient Population RTOR = Return to the Operating Room; OGA = Open Guillotine Amputation. Planned staged RTOR refers to definitive revision/closure after OGA; unplanned RTOR excludes planned staged OGA closure. Multivariable Regression Table (SSI = Surgical Site Infection; OR = odds ratio; IRR = incidence rate ratio from negative binomial regression; CI = confidence interval; OS = orthopedic surgery; TS = trauma surgery; VS = vascular surgery).
Amputation level
N
%
BKA
353
51.2%
TKA
119
17.3%
AKA
217
31.5%
Indication
Indication
N
%
Ischemia
286
41.5%
Infection
274
39.8%
Trauma
101
14.7%
Sarcoma
6
0.9%
Other
22
3.2%
Service
N
%
Vascular surgery
303
44.0%
Trauma surgery
257
37.3%
Orthopedic surgery
129
18.7%
Variable
Vascular surgery
Trauma surgery
Orthopedic surgery
Total
P
Age (years), mean (SD)
63.4 (10.9)
54.0 (15.2)
52.3 (14.7)
58.5 (13.9)
<0.001
BMI, mean (SD)
32.1 (8.3)
28.7 (9.0)
27.2 (20.0)
28.7 (11.8)
<0.001
Sex — female
116/299 (38.8%)
62/256 (24.2%)
35/129 (27.1%)
213/684 (31.1%)
<0.001
Race — black
155/299 (51.8%)
113/256 (44.1%)
44/129 (34.1%)
312/684 (45.6%)
<0.001
Race — Caucasian
120/299 (40.1%)
125/256 (48.8%)
75/129 (58.1%)
320/684 (46.8%)
0.0020
Race — other
24/299 (8.0%)
18/256 (7.0)
10/129 (7.8%)
52/684 (7.6%)
0.1520
Comorbidity
Vascular surgery
Trauma surgery
Orthopedic surgery
Total
P
Diabetes mellitus
179/299 (59.9%)
140/256 (54.7%)
39/129 (30.2%)
358/684 (52.3%)
<0.001
Hypertension
248/299 (82.9%)
151/256 (59.0%)
63/129 (48.8%)
462/684 (67.5%)
<0.001
Peripheral vascular disease
228/299 (76.3%)
63/256 (24.6%)
20/129 (15.5%)
311/684 (45.4%)
<0.001
Coronary artery disease
128/299 (42.8%)
48/256 (18.8%)
11/129 (8.5%)
187/684 (27.3%)
<0.001
ESRD
65/299 (21.7%)
28/256 (10.9%)
5/129 (3.9%)
98/684 (14.3%)
<0.001
COPD
47/299 (15.7%)
18/256 (7.0%)
10/129 (7.8%)
75/684 (11.0%)
<0.001
Heart failure
82/299 (27.4%)
45/256 (17.6%)
12/129 (9.3%)
139/684 (20.3%)
<0.001
Smoking history (any)
215/299 (71.9%)
151/256 (59.0%)
74/129 (57.4%)
440/684 (64.4%)
0.001
OUD/IVDU
49/299 (16.4%)
47/256 (18.4%)
35/129 (27.1%)
131/684 (19.2%)
0.0320
Component
Vascular surgery
Trauma surgery
Orthopedic surgery
Total
P-value
Any complication
184/299 (61.5%)
164/256 (64.1%)
70/129 (54.3%)
418/684 (61.1%)
0.173
Surgical site infection
119/299 (39.8%)
131/256 (51.2%)
60/129 (46.5%)
310/684 (45.3%)
0.0261
Sepsis
56/299 (18.7%)
72/256 (28.1%)
16/129 (12.4%)
144/684 (21.1%)
<0.001
Cerebrovascular accident
13/299 (4.4%)
8/256 (3.1%)
2/129 (1.6%)
23/684 (3.4%)
0.3129
Myocardial infarction
20/299 (6.7%)
14/256 (5.5%)
0/129 (0.0%)
34/684 (5.0%)
0.0128
Deep venous thrombosis
13/299 (4.4%)
19/256 (7.4%)
6/129 (4.7%)
38/684 (5.6%)
0.2620
30-day readmission
92/299 (30.8%)
58/256 (22.7%)
30/129 (23.3%)
180/684 (26.3%)
0.066
90-day readmission
71/299 (23.7%)
43/256 (16.8%)
34/129 (26.4%)
148/684 (21.6%)
0.049
30-day mortality
37/299 (12.4%)
33/256 (12.9%)
4/129 (3.1%)
74/684 (10.8%)
0.007
One-year mortality
70/299 (23.4%)
43/256 (16.8%)
7/129 (5.4%)
120/684 (17.5%)
<0.001
Five-year mortality
80/299 (26.8%)
51/256 (19.9%)
13/129 (10.9%)
144/684 (21.1%)
<0.001
Outcome (Non-frail)
Vascular surgery
Trauma surgery
Orthopedic surgery
Total
P
30-day RTOR (incl. Planned OGA closure)
80/214 (37.4%)
163/217 (75.1%)
69/118 (58.5%)
312/549 (56.8%)
<0.001
Planned staged RTOR for definitive revision/closure after OGA
54/214 (25.2%)
130/217 (59.9%)
54/118 (45.8%)
238/549 (43.4%)
<0.001
Unplanned RTOR within 30 days (excluding planned OGA closure)
26/214 (12.1%)
33/217 (15.2%)
15/118 (12.7%)
74/549 (13.5%)
0.625
Ambulation with prosthesis
63/214 (29.4%)
73/217 (33.5%)
71/118 (60.2%)
207/549 (37.7%)
<0.001
Outcome (Frail)
Vascular surgery
Trauma surgery
Orthopedic surgery
Total
P
30-day RTOR (incl. Planned OGA closure)
30/85 (35.3%)
29/39 (74.4%)
5/11 (45.5%)
64/135 (47.4%)
<0.001
Planned staged RTOR for definitive revision/closure after OGA
22/85 (25.9%)
23/39 (59.0%)
3/11 (27.3%)
48/135 (35.6%)
0.001
Unplanned RTOR within 30 days (excluding planned OGA closure)
8/85 (9.4%)
6/39 (15.4%)
2/11 (18.2%)
16/135 (11.9%)
0.504
Ambulation with prosthesis
24/85 (28.2%)
9/39 (23.1%)
8/11 (72.7%)
41/135 (30.4%)
0.005
Outcome
Measure (reference = OS)
Service
Estimate
95% CI
P-value
Prosthetic ambulation
OR
TS
0.34
0.20-0.58
<0.001
VS
0.34
0.18-0.64
0.001
SSI
OR
TS
1.11
0.66-1.87
0.70
VS
1.01
0.55-1.87
0.96
30-day readmission
OR
TS
1.17
0.63-2.15
0.62
VS
1.57
0.78-3.16
0.21
1-year re-amputation
OR
TS
2.31
0.91-5.89
0.08
VS
3.96
1.39-11.27
0.01
Length of stay (days)
IRR
TS
1.12
0.86-1.45
0.40
VS
0.93
0.69-1.25
0.63