
Abstract
Background
Transportation access, a recently recognized key social determinant of health, has an understudied relationship to gun violence. We hypothesized that poor transportation access would be associated with increased firearm violence.
Methods
This cross-sectional analysis examined indices of transportation access using University of Minnesota Access Across America (UMAAA) data, which assigns separate rankings based on transit, auto, biking, and walking access scores. Violent firearm injuries and deaths were obtained from the Gun Violence Archive (GVA). Data for educational attainment, income, employment, and housing characteristics came from the US Census’s American Community Survey. Data was aggregated from 2019 to 2021 by the 56 largest metropolitan statistical areas (MSA) in the US. Negative binomial Poisson regression models (univariate and multivariate) were used to examine the association between transportation indices and violent firearm injuries and deaths.
Results
Negative Binomial Poisson regression analysis found that lowered overall transit and auto access scores were associated with slightly lower risk of violent firearm injury and death. This relationship persisted even when adjusted for Gini and ICE. Poverty, unemployment, Gini, and the percentage of persons without a vehicle were directly associated and had higher effects compared to AAA score.
Discussion
This study does not support a strong protective effect of transportation access on firearm violence rates, instead suggesting a relatively small, inverse relationship. These findings underscore the complex nature of urban violence, which is influenced by multiple socioeconomic and community factors. Further studies are needed to determine how injury preventive strategies can target important determinants of firearm injury.
Key Takeaways
• This study does not support a strong protective effect of transportation access on firearm violence rates, instead suggesting a relatively small, inverse relationship where areas with worse transportation access appear to have slightly lower firearm violence rates. • Inequality (indicated by the Gini index), unemployment, and increased racial inequity (indicated by the ICE index) demonstrated positive associations with increased rates of firearm violence, underscoring the multifaceted nature of urban violence.
Introduction
Firearm violence remains a significant public health crisis in the United States (US), disproportionately affecting marginalized communities, including those of color, of lower income, and in urban areas with high population density. 1 Recent studies have demonstrated relationships between firearm homicide and structural determinants such as systemic racism and food insecurity, especially in urban areas.2,3 Transportation access has been linked to various health outcomes including mental health, chronic disease management, and overall well-being. 4 However, the relationship between transportation insecurity and firearm violence has not been examined.
There is a growing recognition of the importance and role of social determinants of health (SDOH)—non-medical factors that significantly influence health outcomes. 1 The US Department of Health and Human Services SDOH workgroup has recently added transportation access to its 5 categories of SDOH. 5 The US Department of Transportation (DOT) has similarly identified transportation insecurity, defined as the lack of adequate means to safely and reliably move to sites providing daily necessities, as being understudied and its influence being insufficiently understood. 6 Via the 2021 Justice40 initiative, DOT has been exploring transportation insecurity and health vulnerability as they apply to transportation investment. 7 Hospitals and physician offices have been encouraged to track and address transportation as it relates to health. The Center for Medicare and Medicaid Services (CMS) made reporting of screening for Social Drivers of Health and Positive Rate for Social Drivers of Health (which both include transportation) mandatory beginning calendar year 2024. 5
These policy trends have direct professional implications for trauma program leadership. American College of Surgeons (ACS) trauma center accreditation standards mandate that verified trauma centers implement evidence-based injury prevention programs grounded in data-driven community risk assessment. 8 Trauma centers are required to analyze their trauma registry data to identify the leading mechanisms of injury and highest-risk populations in their service area, and to design prevention activities that specifically target those documented risks. Additional federal, state, county, and city level standards guide how trauma centers allocate prevention resources and design community outreach interventions. This study examines whether transportation access, a recently prioritized SDOH variable, should be included in such assessments.
Areas with poorer levels of transportation access may also have worse health outcomes. 4 It is possible that limited transportation options affect mental health treatment access, cause social isolation and weakened social bonds, and restrict access to jobs leading to economic stress, all of which may increase the risk of involvement in violence. In this study, we sought to examine the association between poor transportation access and firearm violence in the 56 largest metropolitan statistical areas in the United States. We hypothesized that poor transportation access would be associated with increased firearm violence.
Methods
An ecological, cross-sectional study was employed to examine the association between transportation access and firearm violence. This study did not require Institutional Review Board oversight as all data used were obtained from publicly available databases. We identified n=56 of the most populous Metropolitan Statistical Areas (MSAs) from the US Census and identified n=48 with University of Minnesota Access Across America (UMAAA) transportation ranking. 9
Gun violence data from the years 2019-2021 was queried from Gun Violence Archive (GVA), which includes injuries and deaths by gun violence related to homicides, murders, unintentional gun use, and defensive gun use. 10 The GVA is a not-for-profit database of US gun-related violence taken from 7500 sources, including law enforcement, public media, and commercial publications. 11 GVA incidents are tracked by county, enabling the calculation of injuries and killings per US Census MSA. 12 We aggregated the total shootings for every selected city from 2019-2021. 13
Transportation data was collected using 2019-2021 indices of transportation access from the University of Minnesota Access Across America (UMAAA) archive. 14 UMAAA assigns rankings based on transit, auto, biking, and walking access scores. “Transit” measures job access between 7 and 9 am using public transit (including walking segments and transfers). “Auto” measures typical conditions for an 8 am departure from home to work. “Biking” is divided into 2 separate measures, low and medium stress—based on roadway motor vehicle density, speed of cycling, and curb lane width. “Walking” scores were only available for 2014. Walking and biking were included as control variables to verify the consistency of the various transportation access measures. We used the largest 56 MSAs in order to include all 50 cities in the UMAAA ranking. This included 8 MSAs without a UMAAA ranking (Fresno, Grand Rapids-Kentwood, Greenville-Anderson, Omaha-Council Bluffs, Rochester, Tucson, Tulsa, and Urban Honolulu) that were not included in the analysis. UMAAA ranked the MSAs in order from 1-50; therefore, the lower the ranking, the better the transportation access.
Other variables explored included socioeconomic factors such as unemployment rate, MSA poverty rate, high school graduation rate, population age >/ = 25yrs with bachelor’s degree, and the Gini Index. 15 The Gini index is an inequality measure between 0 and 1 where a value of 0 reflects perfect equality and a score of 1 reflects maximal inequality. For ease of interpretability, this study rescaled the Gini Index by 100x: a range of −100 to 100. The Income and Race-based Index of Concentration of the Extremes (ICE) – a measure of segregation calculated by subtracting the number of privileged persons from the number of disadvantaged persons, divided by the total number of persons in that areal unit - was calculated using ACS data. 16 All of the aforementioned socioeconomic variables were obtained from the US Census’s American Community Survey (ACS 1 year estimate) data from 2019-2021 17 and mean values were calculated for the study period in the final dataset of n=48 observations.
In this cross-sectional study, all analyses and cleaning were performed using RStudio (RStudio Team, 2020). “Tidycensus” (Walker, Herman, 2024) was used to incorporate MSA and year-matched demographic data for each GVA observation. Due to overdispersion of our outcome, negative binomial Poisson regression models offset for the log average population from 2019-2021 were used to examine the association of transportation index and inequality and the rate of fatal shootings, presented as incidence rate ratios (IRR) with 95% confidence intervals (95% CI). A P-value of 0.05 was set to determine statistical significance of predictors.
Results
Demographic Characteristics of MSAs
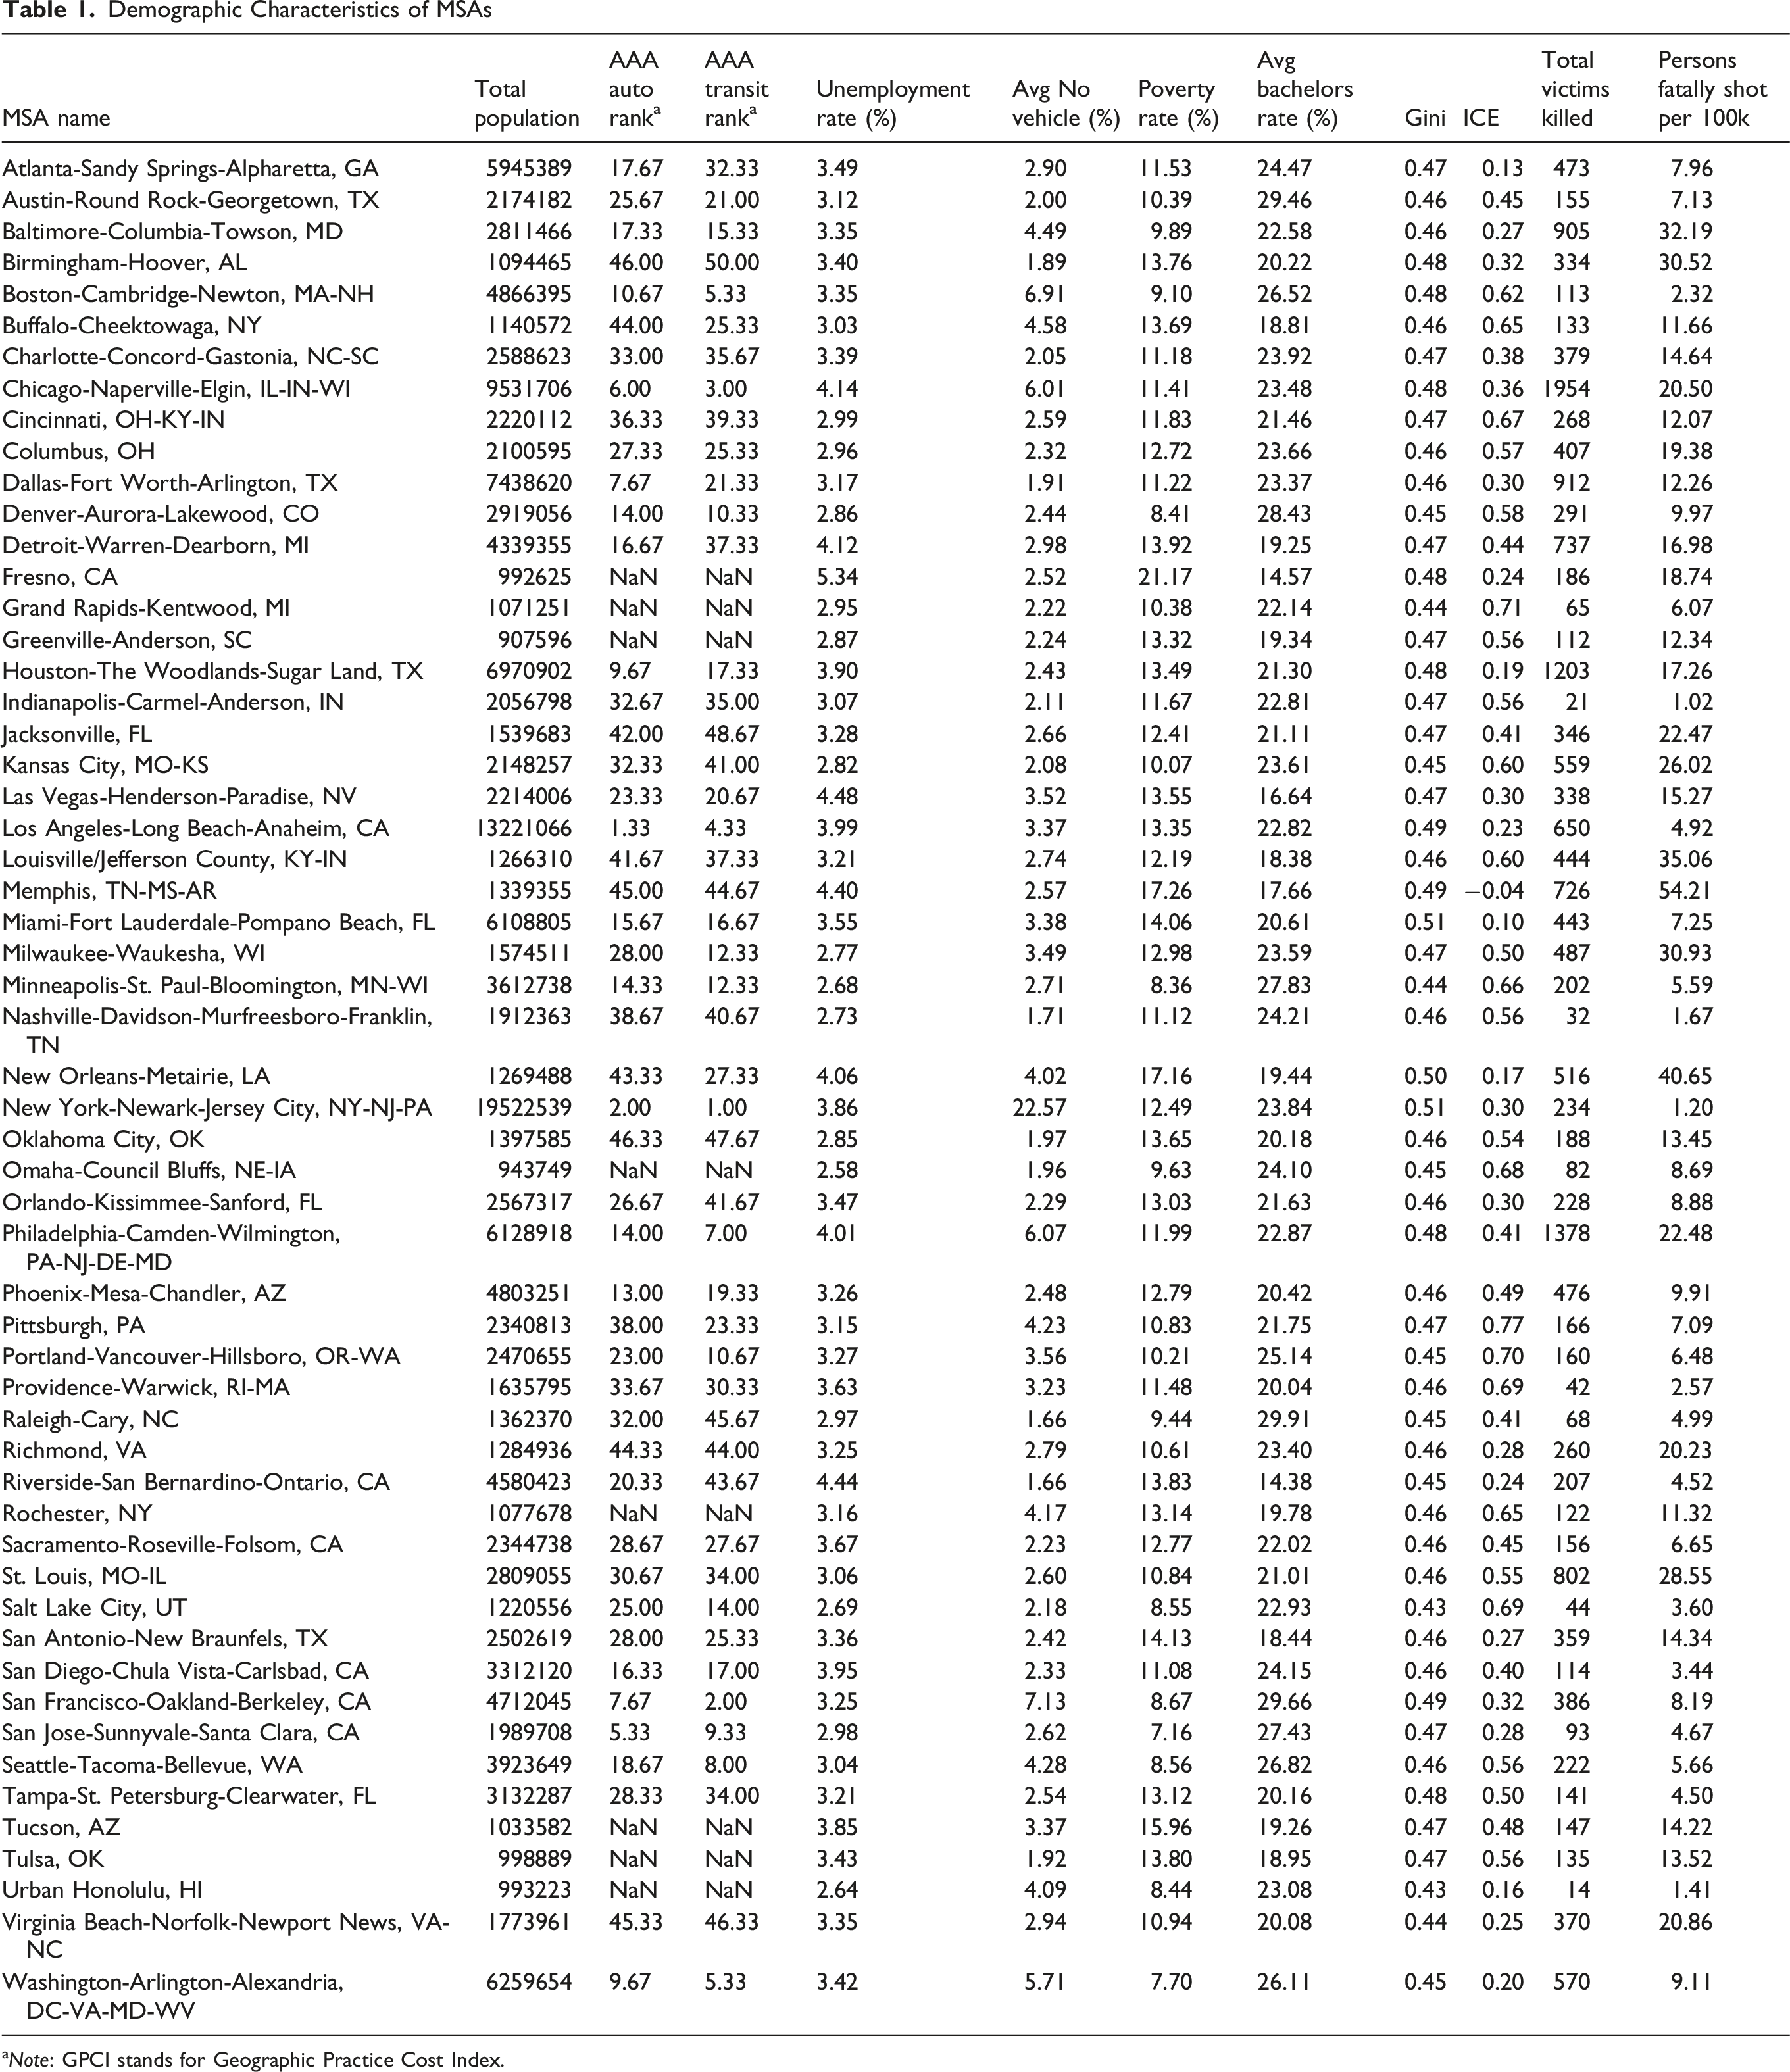
aNote: GPCI stands for Geographic Practice Cost Index.
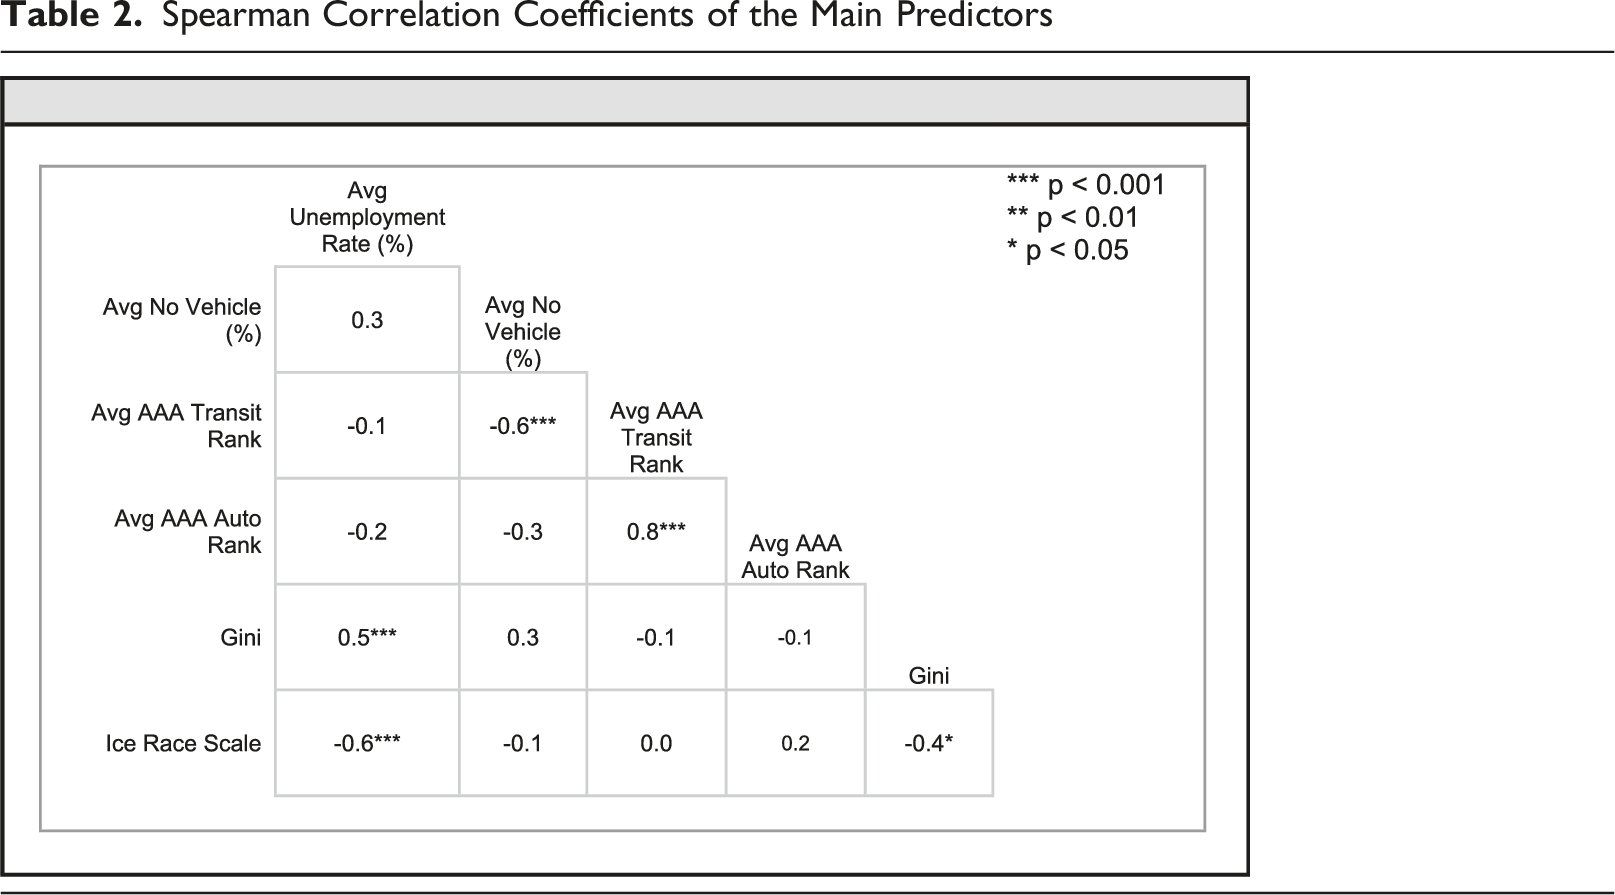
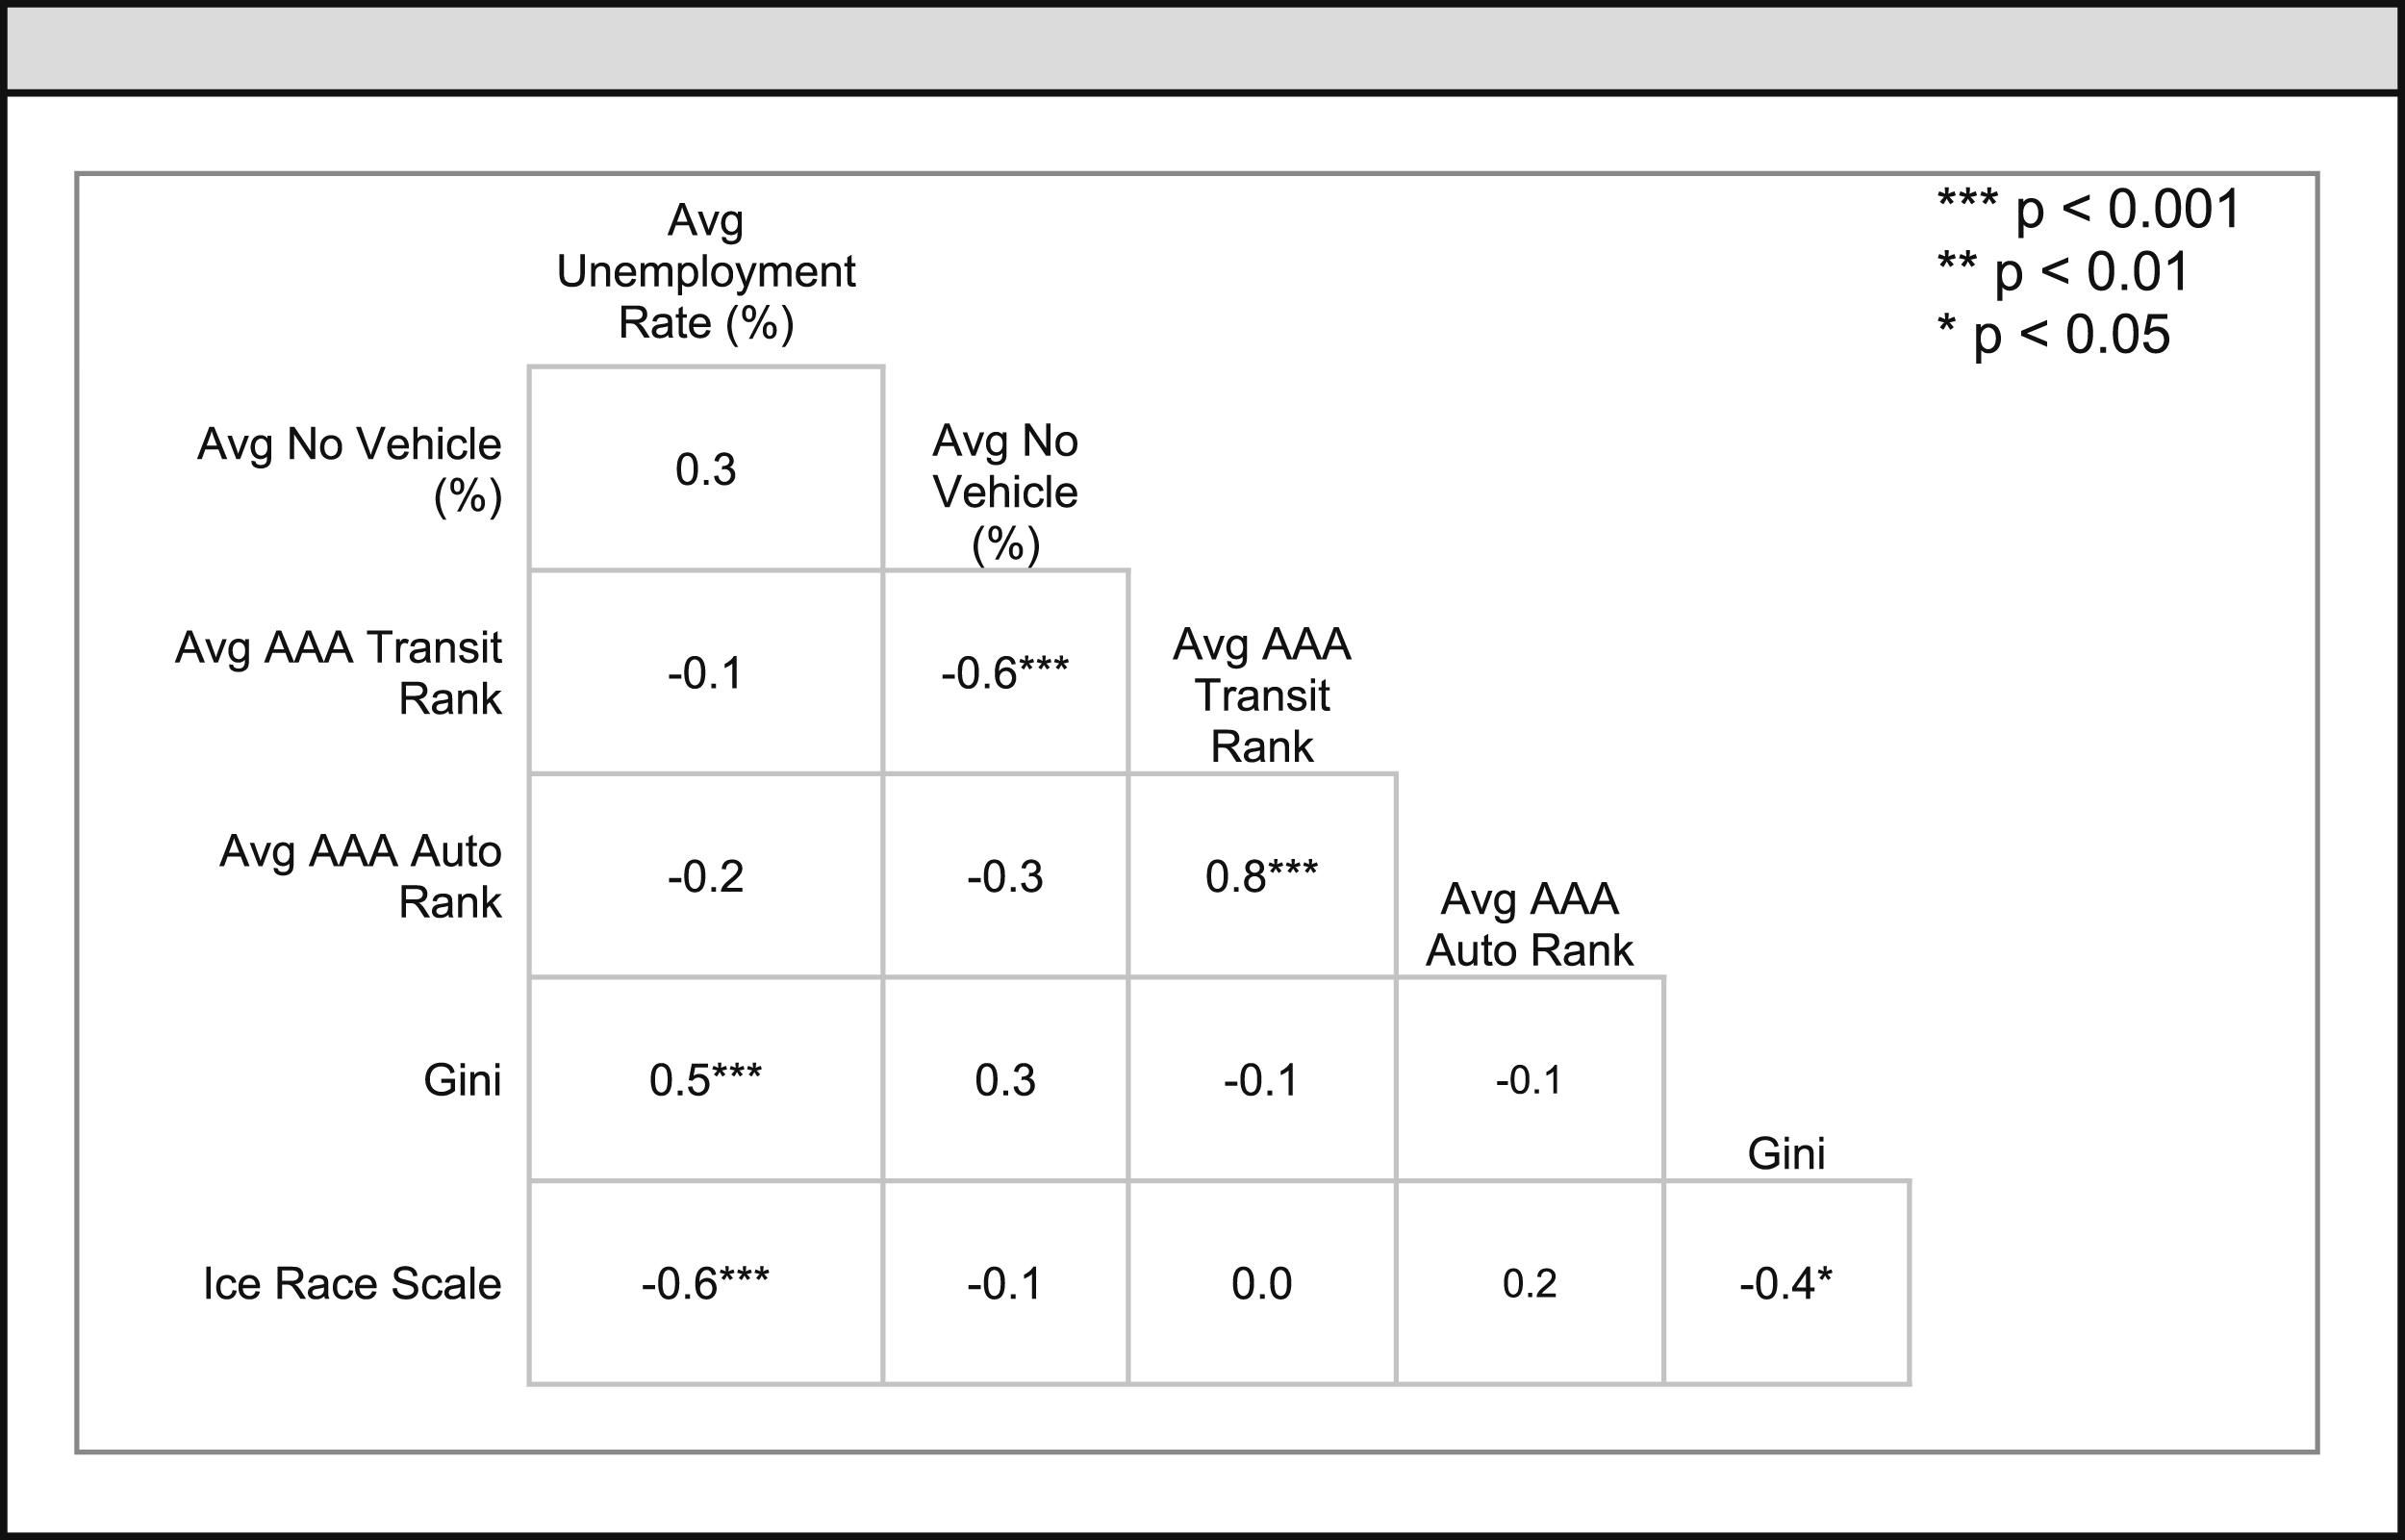
Spearman Correlation Coefficients of the Main Predictors
Univariate IRR Values
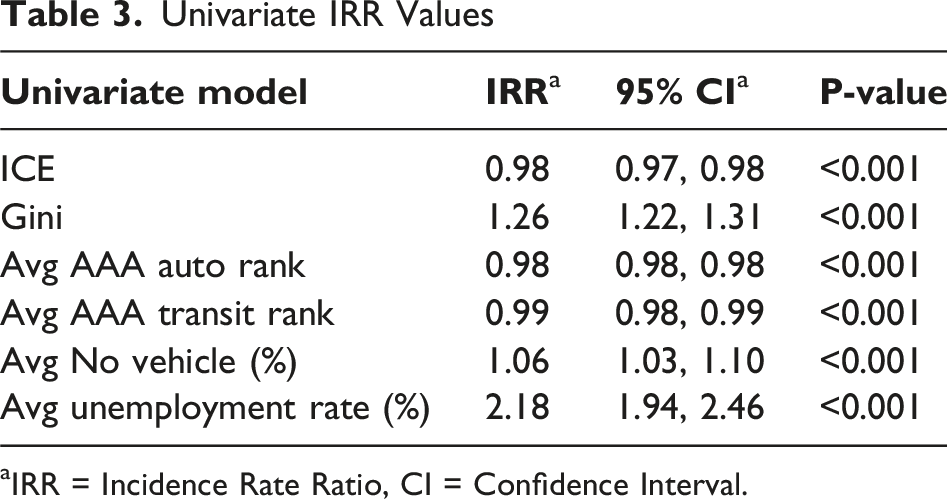
aIRR = Incidence Rate Ratio, CI = Confidence Interval.
Multivariate IRR Values (Gini - Auto)

aIRR = Incidence Rate Ratio.
CI = Confidence Interval.
AIC = Akaike Information Criteria.
Multivariate IRR Values (Ice - Auto)
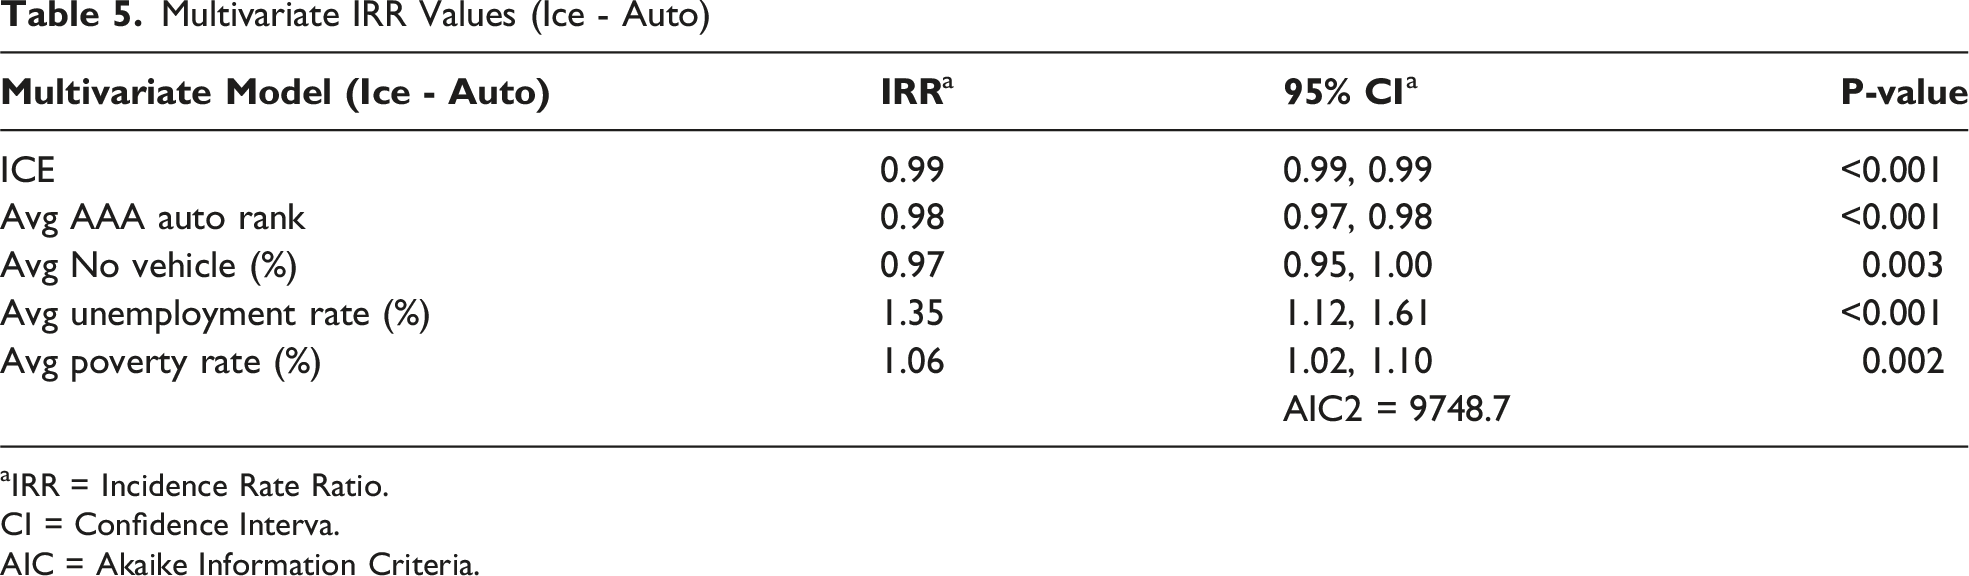
aIRR = Incidence Rate Ratio.
CI = Confidence Interva.
AIC = Akaike Information Criteria.
Discussion
Reduced transportation access has been linked to various poorer health outcomes. 4 Firearm violence has been shown to disproportionately affect racial and ethnic minority communities. The combination highlights the intersection of transportation, socioeconomic status, and gun violence. We hypothesized that areas with higher levels of transportation access would lead to better health outcomes and reduced violence rates, especially if integrated with additional efforts to reduce socioeconomic barriers. 3 Our analysis, however, suggests a relatively small, counter-intuitive relationship. Areas with worse transportation access appear to have slightly lower firearm violence rates, especially for those without a vehicle. Inequality (indicated by the Gini index), unemployment, and increased racial inequity (ICE) confirmed previously reported significant positive associations with increased rates of firearm violence. 2
The inverse nature of these findings may be explained by several factors grouped under the label community severance, which is the separation of people from goods, services, and each other by busy roads or other transport infrastructure. 16 First, areas with poorer transportation access, as measured by morning job-related commuting, might have more localized employment patterns, potentially reducing exposure to violence in other parts of the city. 18 Additionally, areas with better transportation could have higher violent crime rates due to population concentration, social disorganization, increased mobility, and accessibility for potential offenders. Public transit hubs may serve as convergence points for diverse populations, potentially increasing opportunities for social conflict. Conversely, communities with limited transportation options might develop stronger social ties and informal social control mechanisms. Community violent crime “along-the-route” also appears to deter people from using transport that may expose riders to the potential of personal injury, such as walking, bicycling and transit ridership. 19
This study also demonstrates the complex, multifactorial nature of firearm violence. No single structural variable, including transportation access, determines firearm violence outcomes. The percentage of households without a vehicle, on deeper analysis, shows a positive association with firearm violence in the crude model, but this relationship reverses in the multivariate models underscoring the multifaceted nature of urban violence.1,2 This complexity aligns with previous research highlighting the multifaceted nature of urban violence and its various contributors.1,3 Thus, better transportation access alone may not necessarily lead to reduced firearm violence in urban areas. It is important to note, though, that these relationships, while statistically significant, were relatively small in magnitude.
In contrast to the weak transportation-violence associations, traditional socioeconomic measures demonstrated substantially stronger relationships. Gini index (IRR: 1.26) and unemployment (IRR: 2.18) showed effects 12-100 times larger than any transportation access measure. These findings suggest that single-variable interventions focused on transportation access alone are unlikely to substantially reduce firearm violence.
Despite the complex nature of gun violence, some structural variables appear to exert less influence than assumed. In addition to transportation, poverty alone may not play as large of a role as initially assumed. Johnson et al. found that income disparity (areas with high and low income neighborhoods) increased gun violence. 20 While in counties with only low median income, poverty was not a factor in gun violence. This suggests that other factors, like segregation, may play a larger role. Further studies need to be done to assess the relative strength of individual factors on gun violence, rather than assessing structural barriers at large.
These competing mechanisms at the metropolitan level may obscure neighborhood-level relationships. Many MSA’s included segregated and concentrated pockets of disadvantaged populations. As discussed, Johnson et al. found that income disparity exists within a county and has an impact on gun violence. 20 The granularity that can occur within an MSA, but can be lost when assessing a larger area, is especially important for trauma catchment areas, which typically serve a neighborhood rather than a much larger MSA.
This study cautions against single-variable interventions: the weak transportation-violence association in multivariate models suggests that trauma centers designing prevention strategies should prioritize comprehensive approaches addressing multiple documented socioeconomic determinants in their specific service areas, rather than isolated interventions targeting transportation alone. Null and inverse outcomes, however, can be valuable information for driving future research and public policy decisions. Fixing structural variables in isolation will likely not solve the gun violence epidemic.
For trauma centers tasked with data-driven injury prevention, this study offers critical insights aligned with ACS accreditation standards. The metropolitan-level analysis used here can inform broader resource allocation and partnership priorities, but should not be mistaken for the neighborhood, or patient-level, actionability required for community-based interventions. ACS requirements mandate that trauma centers conduct community risk assessment using trauma registry data and design prevention activities targeting identified local risks, a fundamentally different analytical scope than the metropolitan analyses presented here.
It is important to note the limitations of our study. The use of metropolitan statistical areas as the unit of analysis may obscure important variations at smaller geographic scales. Future research should consider examining these relationships at more granular levels, such as neighborhoods, census tracts, or city block-groups, to better understand local dynamics. Additionally, our transportation access measures, while comprehensive, are morning employment commute-related, and may not capture all aspects of transportation insecurity. Future studies could incorporate more nuanced measures of transportation quality, reliability, and affordability to provide a more complete picture of how transportation systems impact community health and safety.
Conclusion
As no significant relationship between transportation access and firearm violence at the MSA level was found, our study does not support a strong protective effect of transportation access on firearm violence rates, instead suggesting a relatively small, inverse relationship. Areas with worse transportation access appear to have slightly lower firearm violence rates, especially for those without a vehicle. These findings underscore the complex nature of urban violence, which is influenced by multiple socioeconomic and community factors. To tease out the complex relationships, future research should include additional measures of transportation, especially in smaller/local geographies. Policymakers and trauma center leaders should approach transportation improvements as part of comprehensive strategies that address multiple documented socioeconomic determinants simultaneously informed by neighborhood-level trauma registry data and tailored to the unique characteristics and needs of each community.
Footnotes
Funding
The authors received no financial support for the research, authorship, and/or publication of this article.
Declaration of Conflicting Interests
The authors declared no potential conflicts of interest with respect to the research, authorship, and/or publication of this article.