
Abstract
Low albumin and the albumin–globulin ratio (AGR) were associated with vascular adverse events. Our study explores the AGR as a predictor of mortality after non-ST-segment elevation myocardial infarction (NSTEMI). In an observational study of 570 NSTEMI patients admitted to a tertiary center between 2004 and 2006, patients were stratified into equal tertiles according to AGR. The primary outcome was 4-year all-cause mortality. The 4-year mortality rates in the first, second, and third AGR tertiles were 88 (47%) of 189, 48 (25%)of 190 , and 19 (10%) of 191, respectively (P < .0001). After adjusting for 20 confounding variables, AGR first tertile (AGR <1.12) had a higher mortality versus second tertile (hazard ratio [HR] 2.6, P < .001). Likewise, the AGR second tertile had higher mortality versus the third tertile (AGR ≥1.34; HR 2.3, P = .004). The albumin–globulin ratio is a significant independent predictor of long-term mortality after NSTEMI in patients with normal serum albumin levels. Further studies are needed to explain the underlying mechanisms.
Introduction
The measured serum total proteins are mainly divided into 2 groups, albumin and globulins. 1 Immunoglobulins (0.5-1.6 g/dL) represent the major portion of the globulins 1 and also a major player in immunity and inflammatory cascades. The serum total protein also includes other prothrombotic proteins, the fibrinogen (200-400 mg/dL), prothrombin (90 mg/dL), and other inflammatory proteins (eg, C-reactive protein [CRP], interleukins, leukotrienes, and others). 1 The albumin–globulin ratio (AGR), frequently reported in the comprehensive blood panel, is calculated from the following equation: AGR = Albumin/[Total Protein − Albumin]. Thus, AGR is actually a reflection of all nonalbumin proteins (this includes globulin and other prothrombotic proteins and inflammatory protein particles).
Many studies demonstrated the inverse relationship between serum albumin and major cardiovascular adverse outcomes. 2 –10 In a survey using the Framingham equation, a negative correlation between serum albumin and calculated cardiovascular risk was observed in nonsmokers referred to a specialist university-based clinic for screening vascular risk. 11 Moreover, diffusion of gamma globulin to the subendothelial layer plays a role in the progression of atheromatous lesion. 12 Interestingly, higher AGR was found to be significantly associated with higher plasma renin activity among patients with essential hypertension. 13 Also low AGR was associated with red blood cell aggregability in both acute and chronic cerebrovascular disease. 14
Methods
Our NSTEMI/neutrophil–lymphocyte ratio (NLR) database 16 was used to explore the predictive value of AGR on all-cause long-term mortality among 570 NSTEMI patients discharged from the only tertiary angioplasty center in Staten Island, between September 2004 and December 2006. Patients were included if they had liver function tests on admission and a NSTEMI diagnosis. The NSTEMI diagnosis required a documented gradual rise and fall in serum troponin levels with a peak value of >0.5 ng/mL and confirmed by a cardiologist. Exclusion criteria included age older than 85 years, clinical evidence of active infection, active cancer, hematological proliferative diseases, active or chronic inflammatory or autoimmune diseases, chronic liver disease, steroid therapy or chemotherapy around the index diagnosis, negative cardiac enzymes, concomitant ST elevation MI, or unavailable complete blood count or medical records. Our primary end point, all-cause 4-year mortality, was assessed by reviewing the electronic medical record and the social security death index till February 2011.
Complete blood count was obtained from the initial (within 1 hour of admission), second, and last blood cell counts in the same index hospitalization and was determined by the Coulter counter technique (Coulter Gen.S Hematology Analyzer, Beckman Coulter Corp, Hialeah, Florida). Serum chemistries were determined by Beckman coulter (Synchron System, Anaheim, California). The total protein was measured through a reaction between cupric ions in an alkaline solution with proteins and polypeptides containing at least 2 peptide bonds to produce a violet-colored complex. The combination between albumin and bromcresol purple (BCP) reagent to form a colored complex product was the basis of albumin measurement in our study.
The AGR is calculated from the following equation: AGR = Albumin/[Total Protein − Albumin].
The medical record for each patient was independently reviewed by 2 physicians for the baseline characteristics, clinical presentation, and the modalities of management (Table 1). We obtained left ventricular ejection fraction from echocardiography reports. Positive smoking status included both current and prior smokers. The appropriate discharge and admission Global Registry of Acute Coronary Events (GRACE) scores 17 were calculated for each index case. The GRACE score was used because of its superiority and validity to predict up to 4-year mortality. 18 GRACE score involved age, systolic pressure, heart rate, Killip class, serum creatinine, cardiac enzyme status, presence of ST-segment deviation, occurrence of reversible cardiac arrest, in-hospital coronary artery bypass graft (CABG), or percutaneous coronary intervention (PCI). The study was approved by our institution review board.
Baseline Characteristics of the Non-ST-Segment Elevation Myocardial Infarction Population According to Albumin–Globulin Ratio Tertilesa
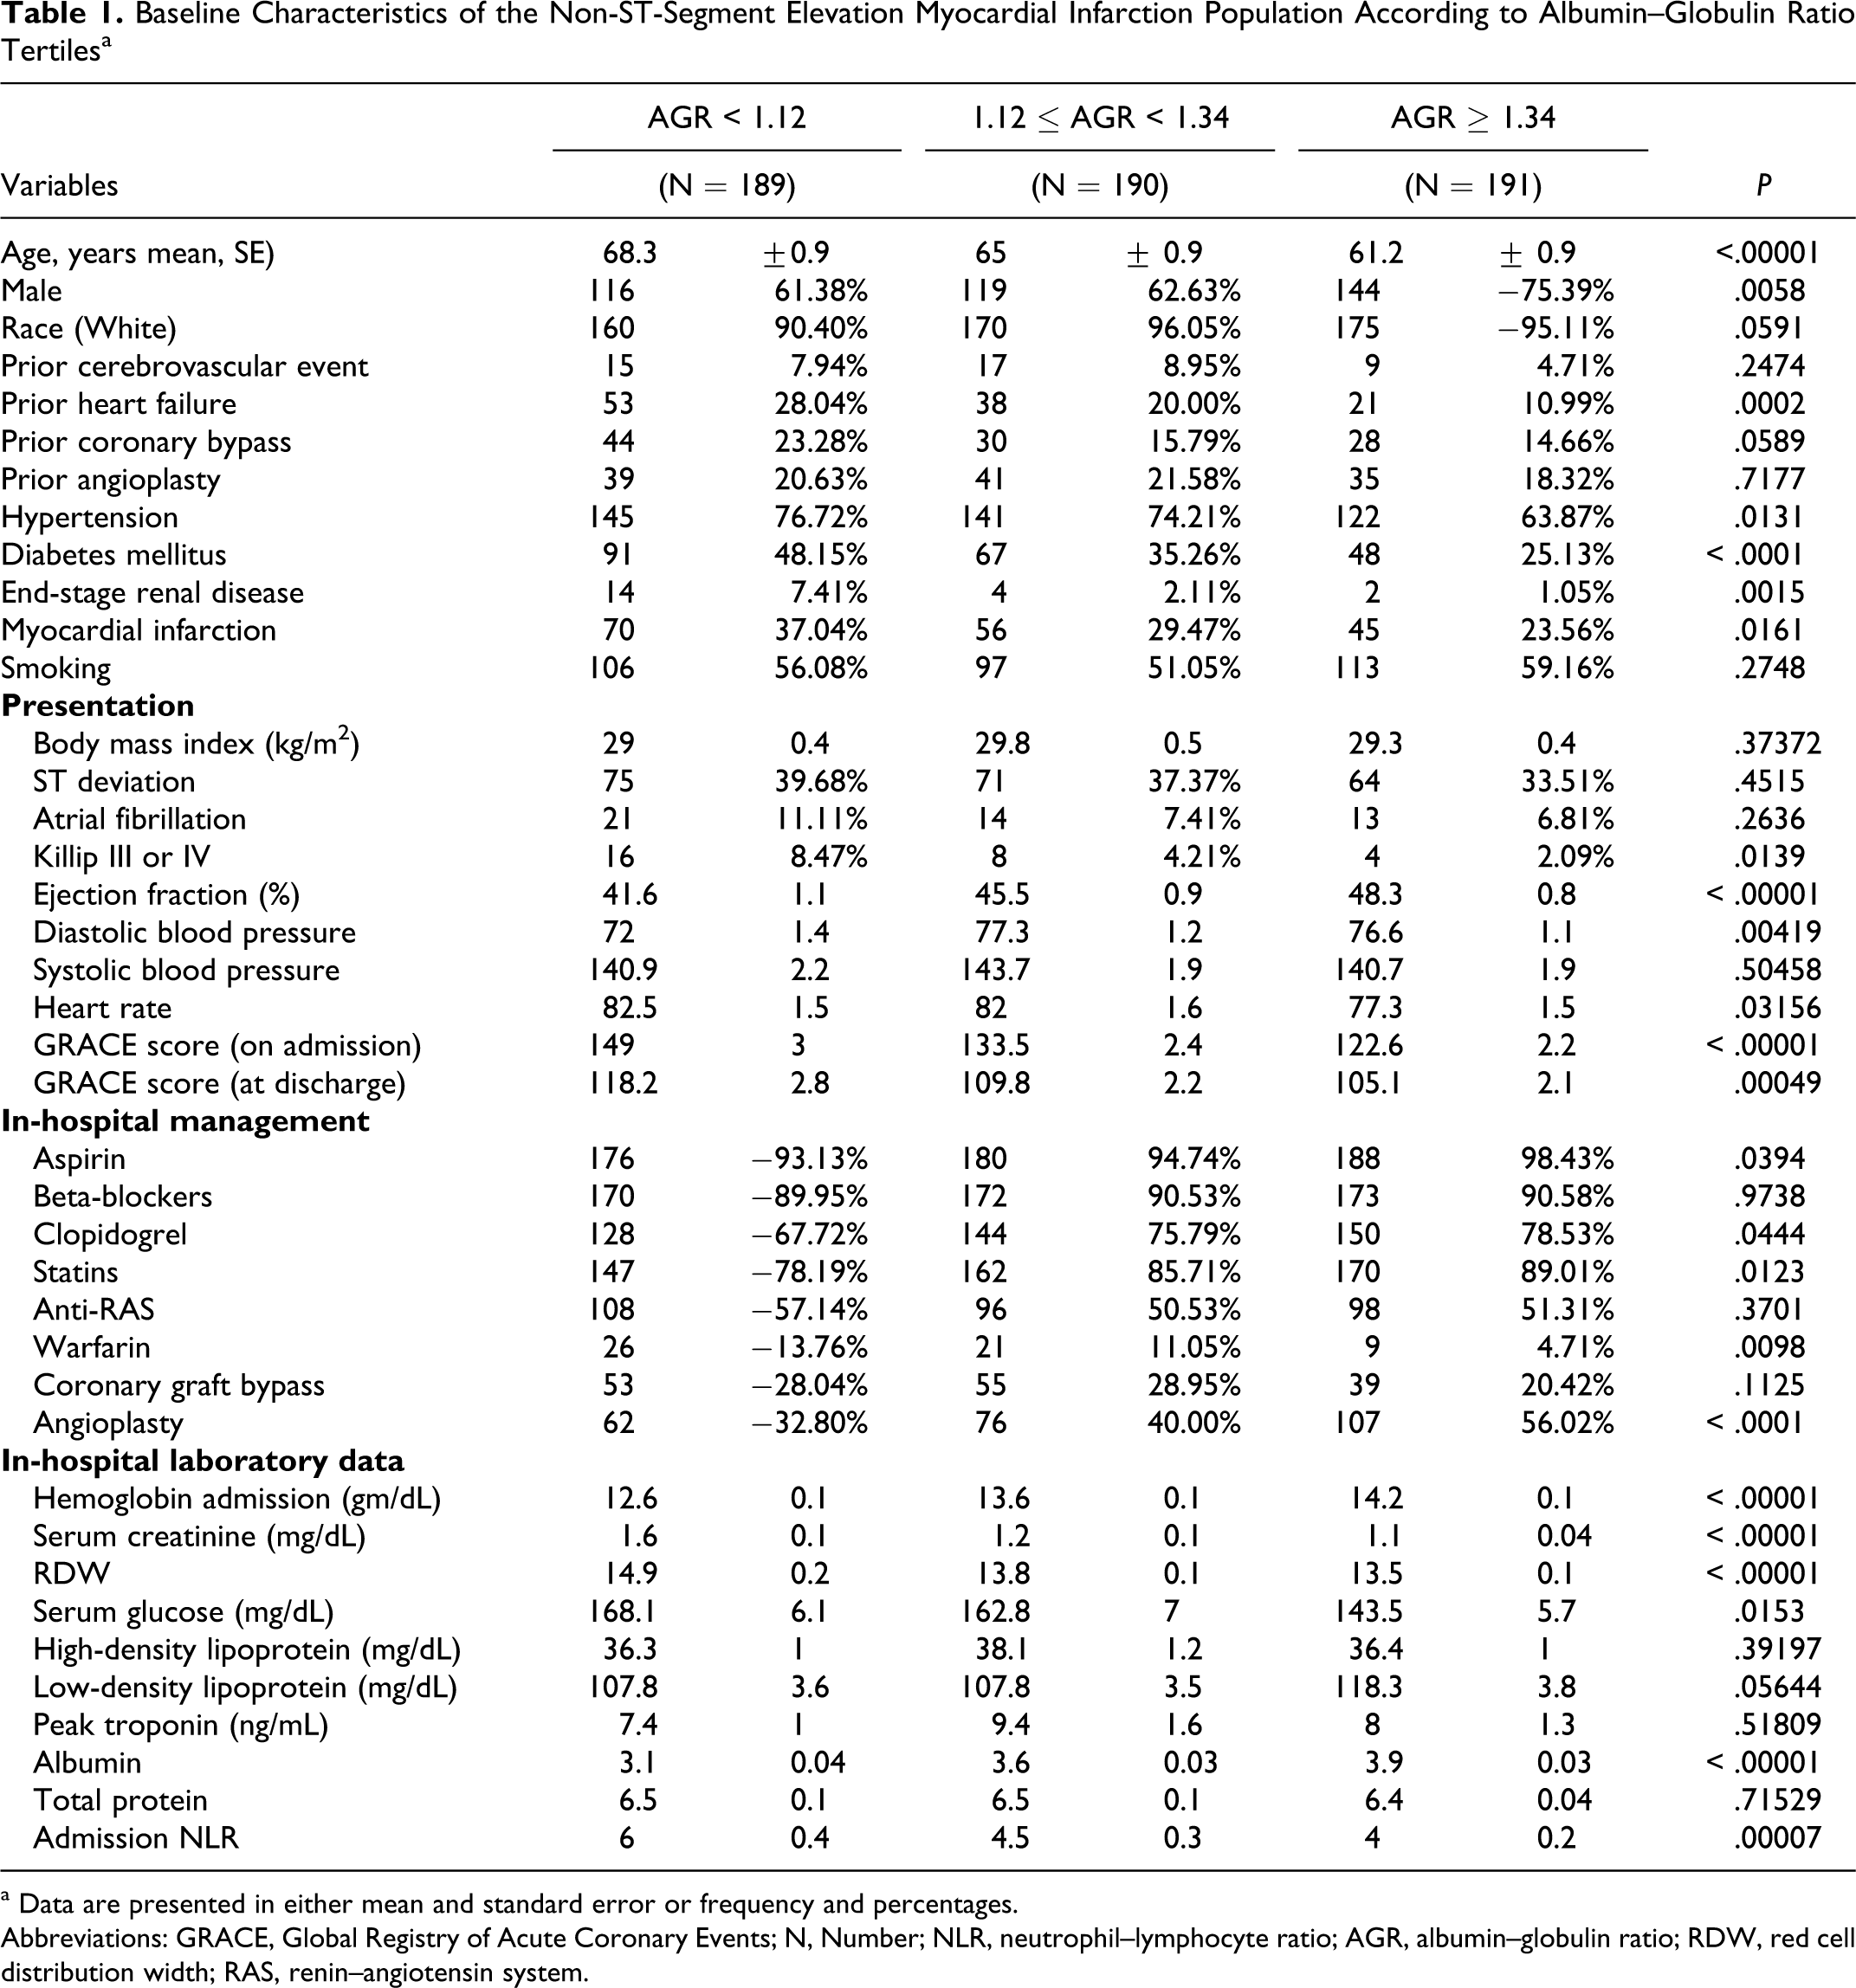
a Data are presented in either mean and standard error or frequency and percentages.
Abbreviations: GRACE, Global Registry of Acute Coronary Events; N, Number; NLR, neutrophil–lymphocyte ratio; AGR, albumin–globulin ratio; RDW, red cell distribution width; RAS, renin–angiotensin system.
Statistical Methods
Patients were divided into equal tertiles according to the 33rd and 66th AGR percentile (ie, the 3rd or highest AGR tertile included the patients with the uppermost 33% AGR values). These AGR tertiles were analyzed using either the chi-square test or Fisher exact test, as appropriate, for categorical variables and analysis of variance (ANOVA) for continuous variables. The distributions of continuous and categorical variables were presented as means ± standard errors and frequencies and percentages, respectively. A univariate screening of all potential predictors of mortality using a separate Cox proportional hazards model for each variable was performed. GRACE score was divided into low risk (≤108), moderate risk (108-141), and high risk (≥141). Those variables that were found to be significant (P < .10) as well as clinically meaningful in the univariate analyses were included in a multivariate Cox regression model. Backward selection was used to remove variables that did not significantly contribute information to this model, given other factors included in the model.
Twenty candidate variables (ie, categorical AGR tertiles, categorical GRACE 3 risk groups, categorical red cell distribution width [RDW] tertiles, history of congestive heart failure, admission hemoglobin, use of aspirin or clopidogrel, admission NLR, history of coronary artery bypass surgery, history of angioplasty, ejection fraction, history of diabetes mellitus, end-stage kidney disease, Coumadin, history of cerebrovascular events, the use of statins, admission serum glucose, history of hypertension, atrial fibrillation, body mass index, and gender) were included in the selection process as they were potential risk factors associated with mortality. Albumin and total protein were excluded, as they are used in the calculation of AGR. Age, admission creatinine, Killip class, systolic blood pressure, pulse, in-hospital angioplasty, ST-segment deviation, cardiac arrest, and history of MI were also excluded from the selection process as they are used in the calculation of GRACE score. Our final model included k = 8 predictors (ie, AGR, GRACE, RDW, congestive heart failure, use of aspirin or clopidogrel, end-stage renal disease, use of statin, and admission glucose) that were included in the final multivariate model for prediction of mortality (Table 2). The analysis of mortality was accomplished by applying standard methods of survival analysis, that is computing the Kaplan-Meier product limit curves (Figure 1), where the data were stratified by AGR tertiles. In cases where the end point event, “death,” had not yet occurred, the number of months until last follow-up was used and considered “censored.” The 3 AGR groups were compared using the log-rank test. Analyses were performed using SAS version 9.2 (SAS Institute, Cary, North Carolina). A 2-sided P < .05 was considered significant.
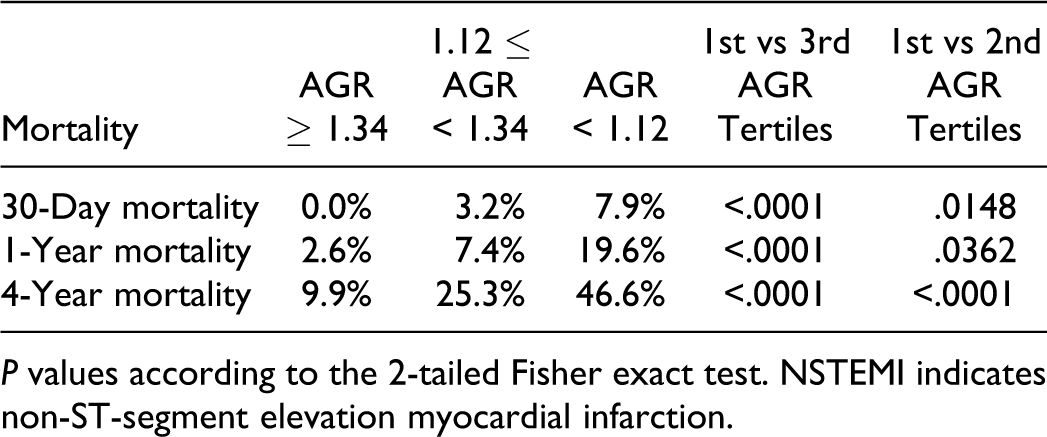
P values according to the 2-tailed Fisher exact test. NSTEMI indicates non-ST-segment elevation myocardial infarction.
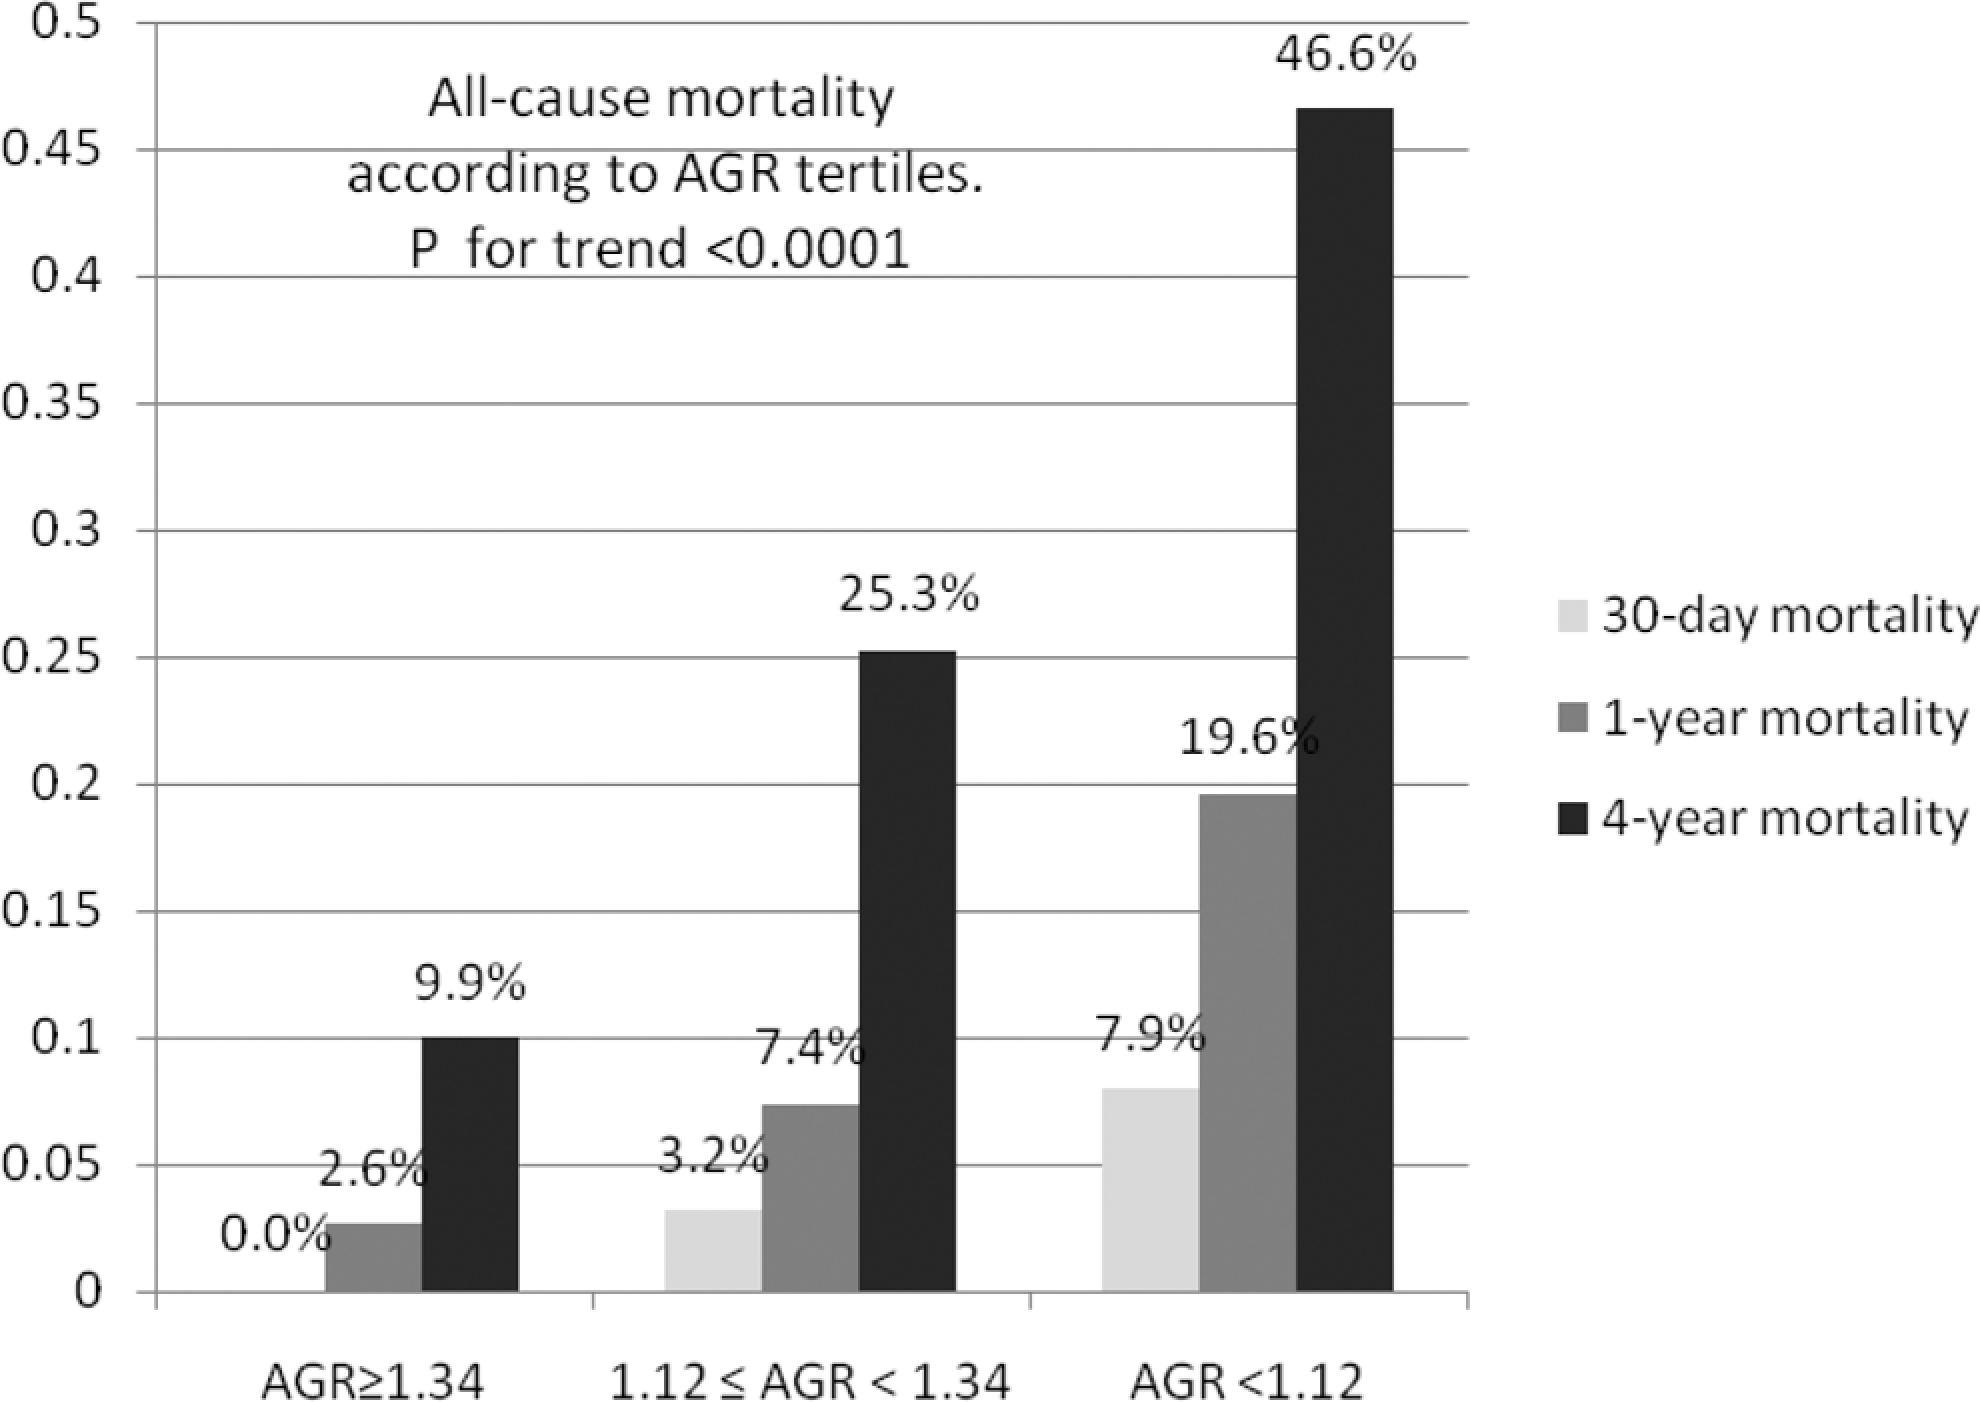
The 30-day, 1-year, and 4-year all-cause mortality rates after non-ST-segment elevation myocardial infarction according to the albumin–globulin ratio (AGR) tertiles.
The Univariate Screening of the Significant Predictors of 4-Year All-Cause Mortality After NSTEMI
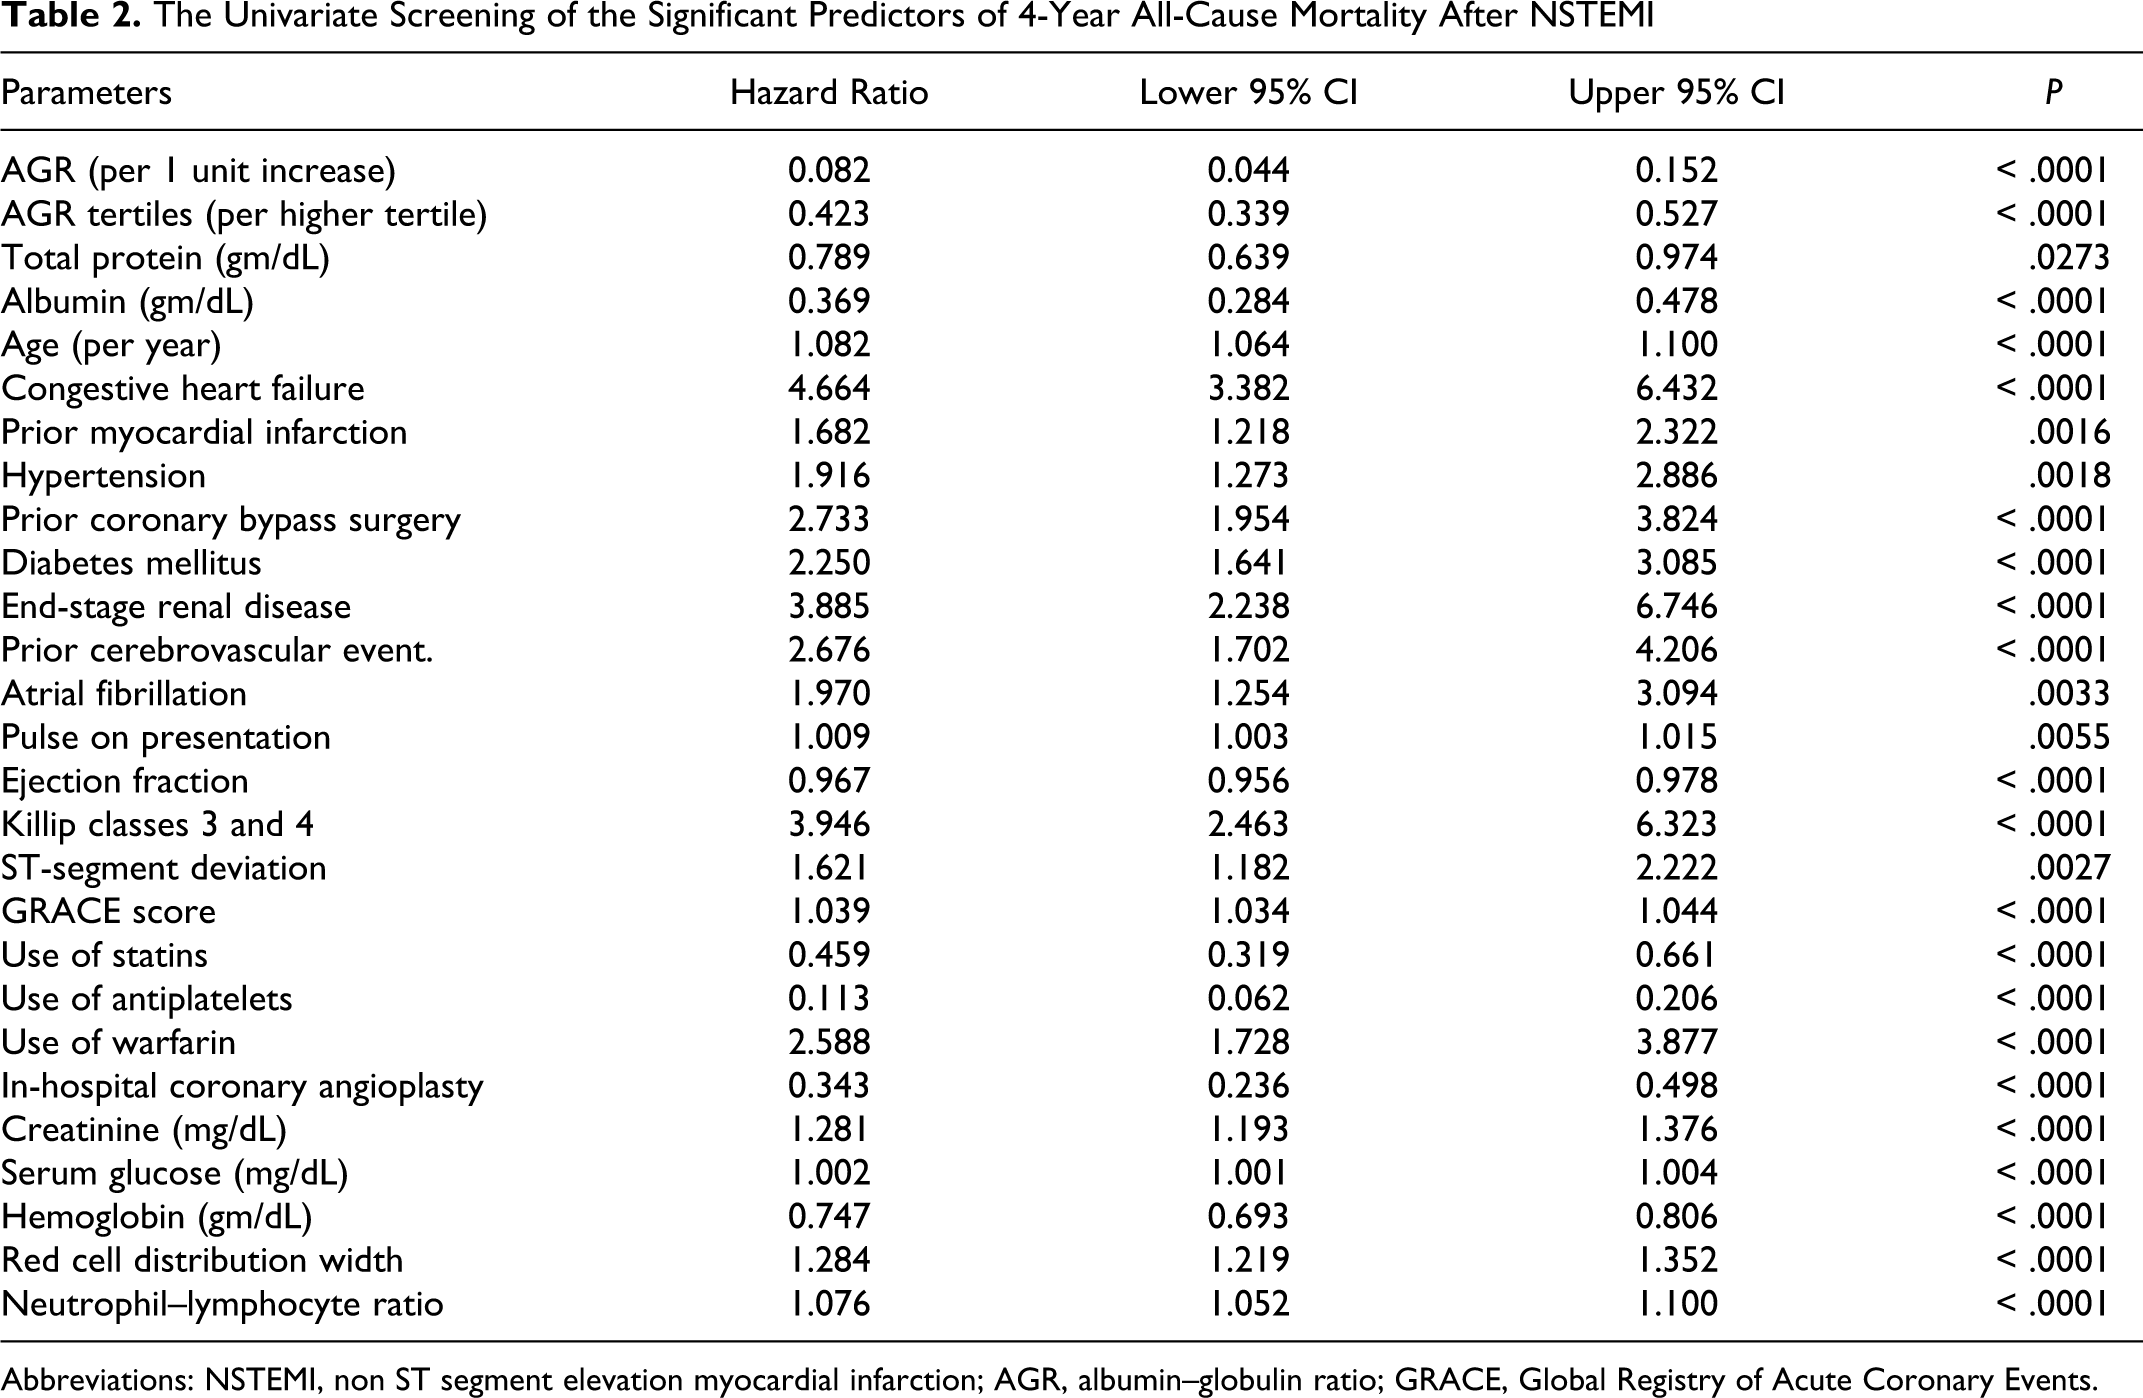
Abbreviations: NSTEMI, non ST segment elevation myocardial infarction; AGR, albumin–globulin ratio; GRACE, Global Registry of Acute Coronary Events.
Results
Baseline Characteristics
Table 1 demonstrates the baseline characteristics of our NSTEMI patients sorted by their AGR tertiles. The patients in the lowest AGR tertile (AGR <1.12) were significantly older with higher prevalence for most of the cardiovascular risk factors (ie, male gender, hypertension, diabetes, end-stage renal disease, prior MI) compared with those in the highest AGR tertile (AGR ≥ 1.34). Additionally, patients in the lowest AGR tertile had a worse presentation than those in the highest AGR tertile (ie, higher GRACE score, lower ejection fraction, more prevalence of Killip class ≥3). According to the admission laboratory workup, patients in the lowest AGR tertile (AGR < 1.12) had significantly higher serum creatinine, glucose, NLR, RDW, and lower hemoglobin values than those in the highest AGR tertile. We also observed among the patients within the lowest AGR tertile, a lower rate of aspirin, clopidogrel, statin, and in-hospital coronary angioplasty treatments compared with those in the highest AGR tertile.
The Primary Outcome and the Univariate Screening of Mortality
Of the 570 included patients, 155 died (27.1%) over an average 55 months of follow-up period. The 30-day, 1-year, and 4-year all-cause mortality rates were significantly higher in the lowest AGR tertile (8%, 20%, and 47%, respectively) compared with those of the highest AGR tertile (0%, 3%, and 10%, respectively) with P < .0001 according to 2-tailed Fisher exact test (Figure 1). Likewise, the Kaplan-Meier curves of the all-cause mortality for the 3 AGR tertiles demonstrated significant higher mortality in the lower AGR groups compared with the highest AGR tertile log-rank test: chi-square = 67.80, P < .0001 (Figure 2). According to the univariate screening of all potential predictors of mortality, and by elevated AGR ratios to higher AGR tertiles, (ie, AGR as a categorical variable) the hazard ratios per unit increase in AGR (ie, AGR as a continuous variable) decreased by 0.082 and 0.423, respectively (P < .0001). Similarly, both albumin and total protein as continuous variables were significant predictors of mortality in the univariate screening (Table 2).
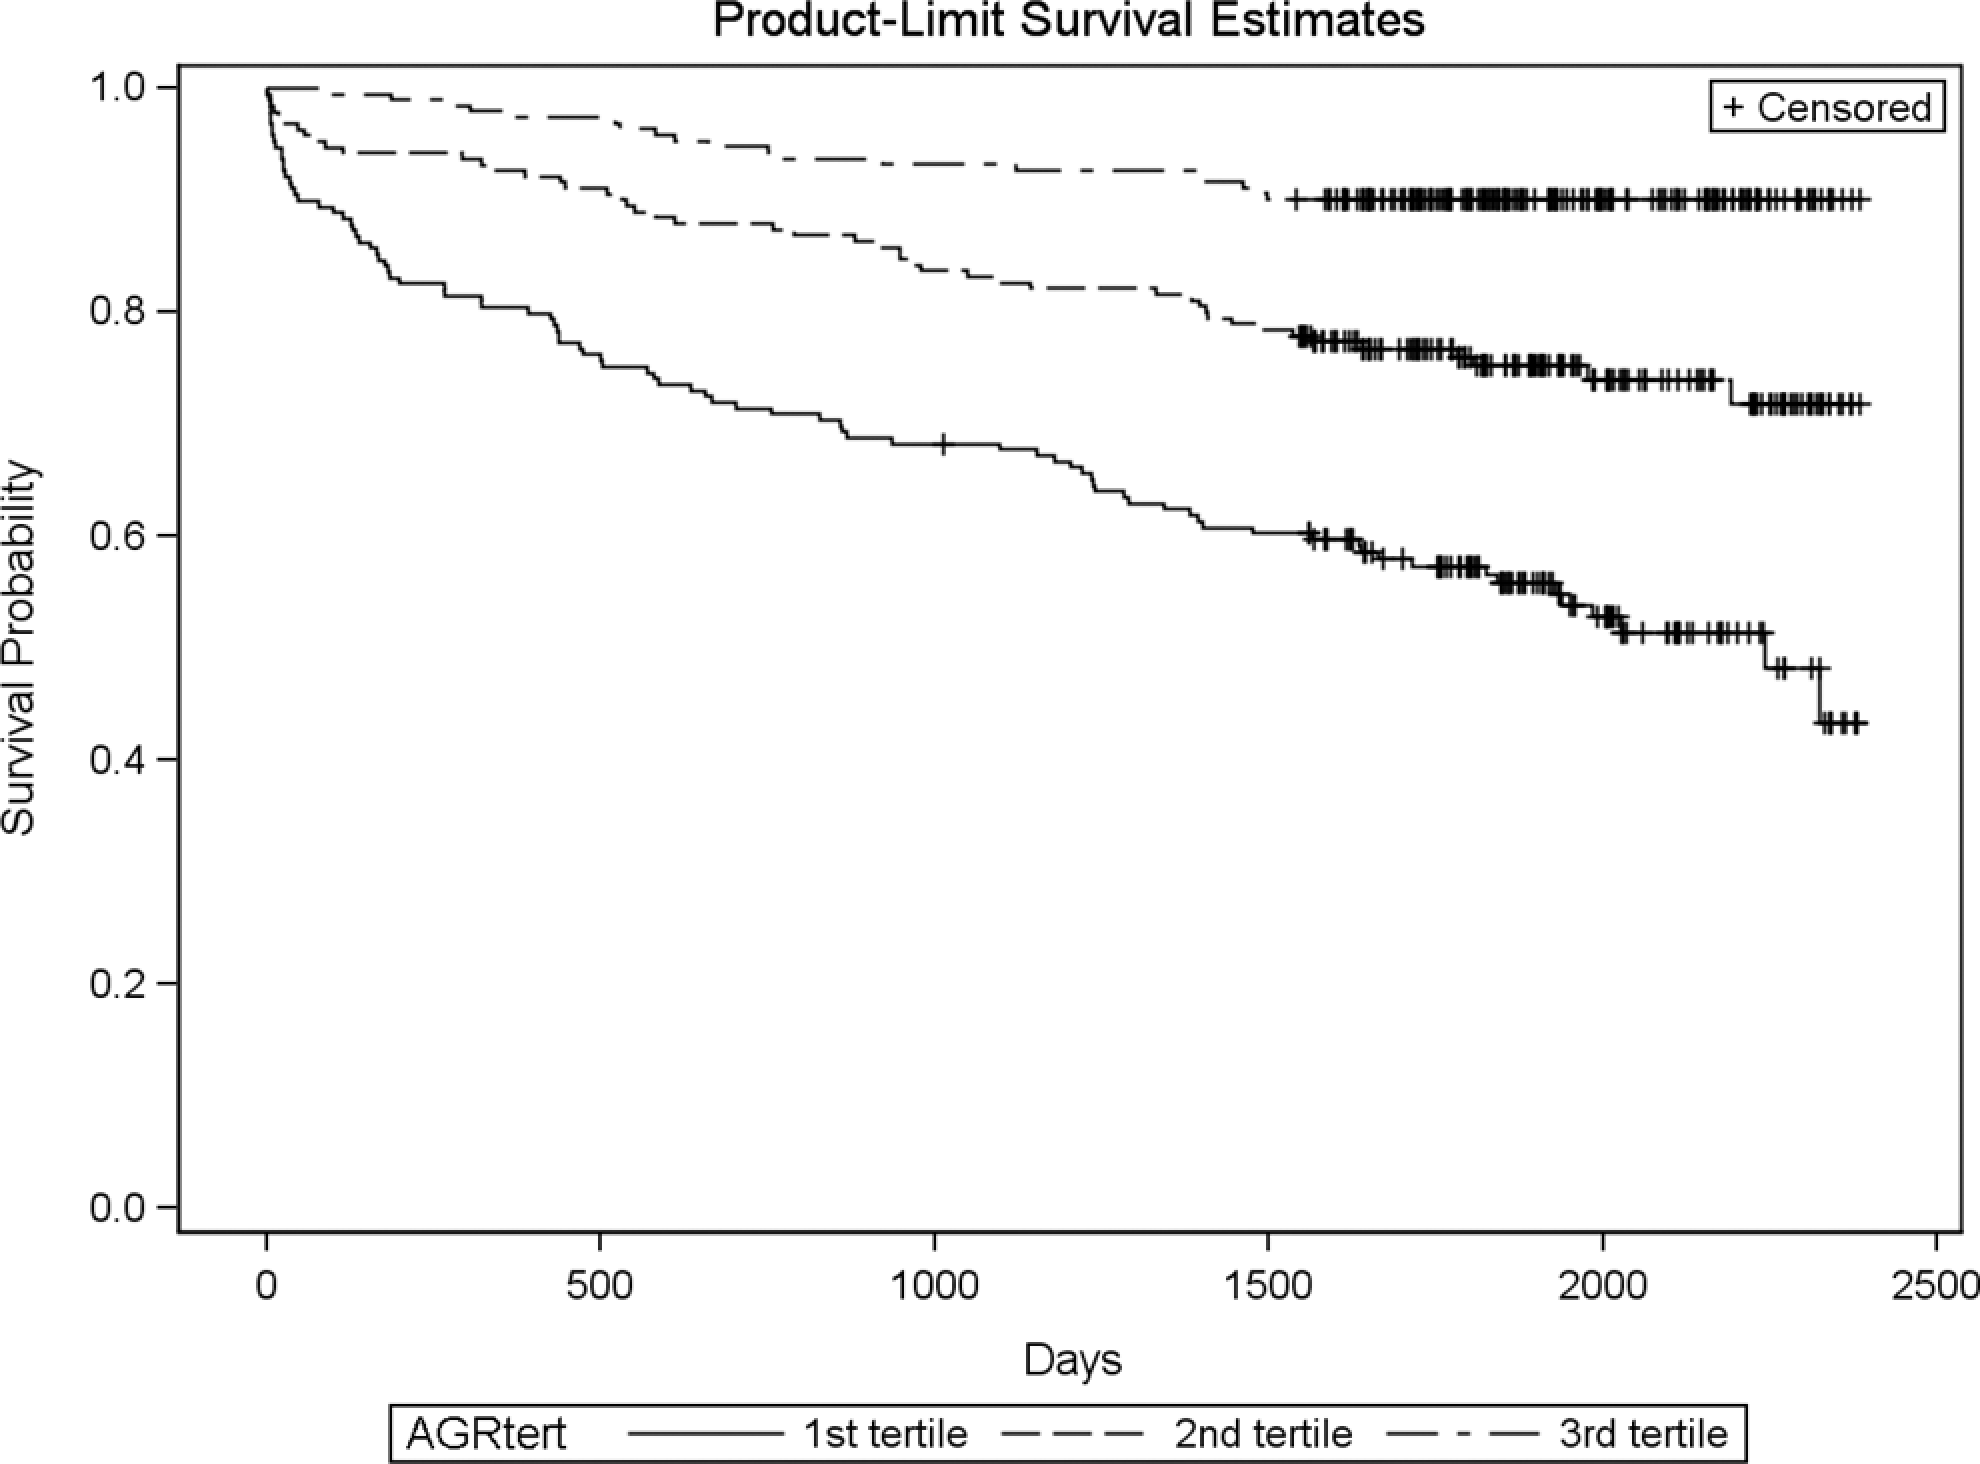
Kaplan-Meier survival curves for all-cause mortality after non-ST-segment elevation myocardial infarction according to albumin–globulin ratio (AGR) tertiles. NSTEMI indicates non-ST-segment elevation myocardial infarction. Log-rank test: chi-square = 67.80, P <.0001.
Multivariate Model
After controlling for 20 confounding variables (Table 3), AGR first tertile had a higher mortality versus second tertile (hazard ratio [HR] 2.597, 95% confidence interval [CI] 1.540-4.380; P < .0003). Similarly, AGR second tertile had a higher mortality versus the third tertile (HR 2.256, 95% CI 1.303-3.906; P = .0037). The total protein and albumin were not included in the model due to their high correlation with AGR.
Adjusted Cox Proportional Hazards Model for 4-Year All-Cause Mortality After NSTEMI
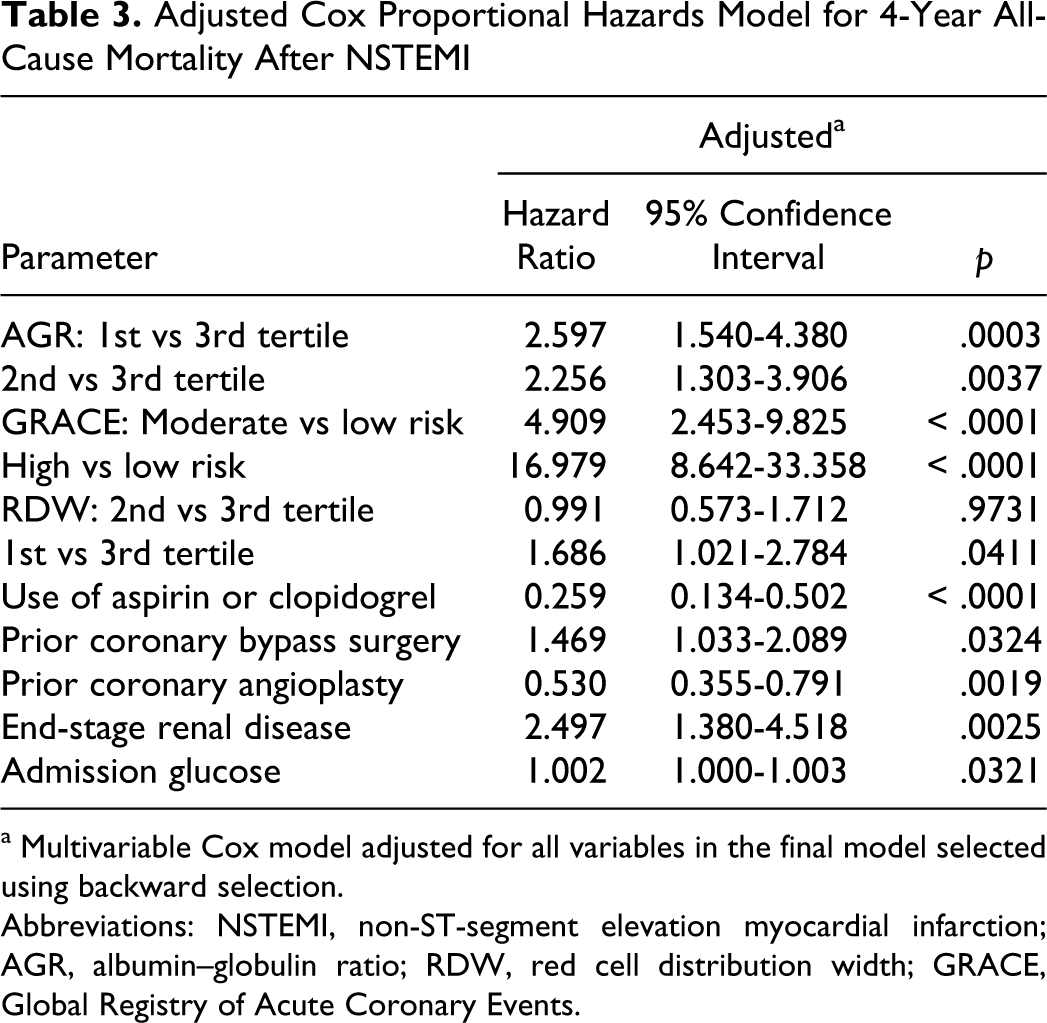
a Multivariable Cox model adjusted for all variables in the final model selected using backward selection.
Abbreviations: NSTEMI, non-ST-segment elevation myocardial infarction; AGR, albumin–globulin ratio; RDW, red cell distribution width; GRACE, Global Registry of Acute Coronary Events.
Long-Term Mortality According to AGR Subgroups
We ran additional sets of analysis to evaluate whether the AGR is a predictor of 4-year all-cause mortality for patient with different ranges of serum albumin. Out of the 570 patients, we had 492 patients with albumin ≥3 g/dL and 346 patients with albumin ≥3.5 g/dL. The lowest AGR tertile (AGR <1.12) had a significantly higher mortality than the highest AGR tertile in these different albumin ranges (Figure 3). Due to the small number of patients with albumin >3.9 g/dL (171 patients), we compared the mortality in patients with AGR ≥ 1.34 (AGR highest tertile) to the patients with AGR < 1.34 (combined middle and lowest AGR tertiles) using the 1-tail Fisher exact test. The patients with albumin >3.9 and AGR ≥1.34 had a significant lower 4-year mortality (10/99 = 10%) compared with those patients with albumin >3.9 g/dL and AGR <1.34 (15/72 = 21%); P = .0414 (Figure 4).
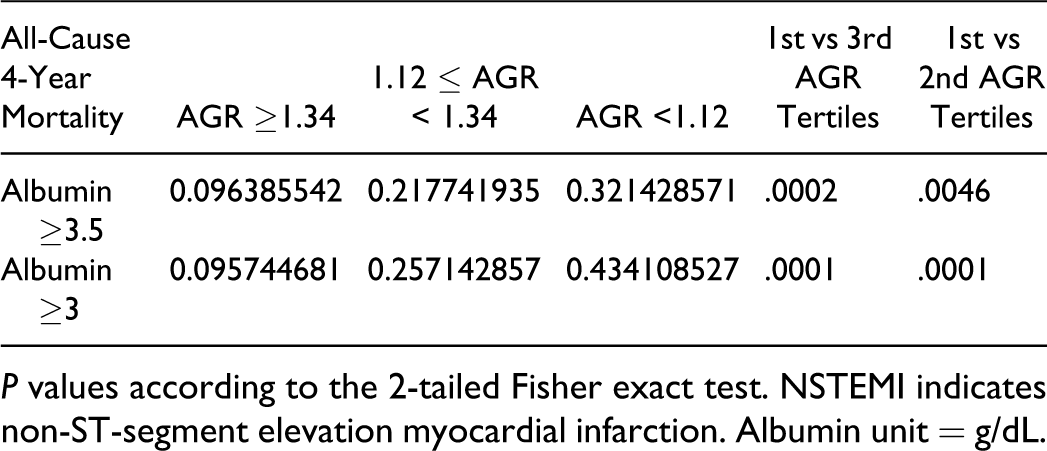
P values according to the 2-tailed Fisher exact test. NSTEMI indicates non-ST-segment elevation myocardial infarction. Albumin unit = g/dL.
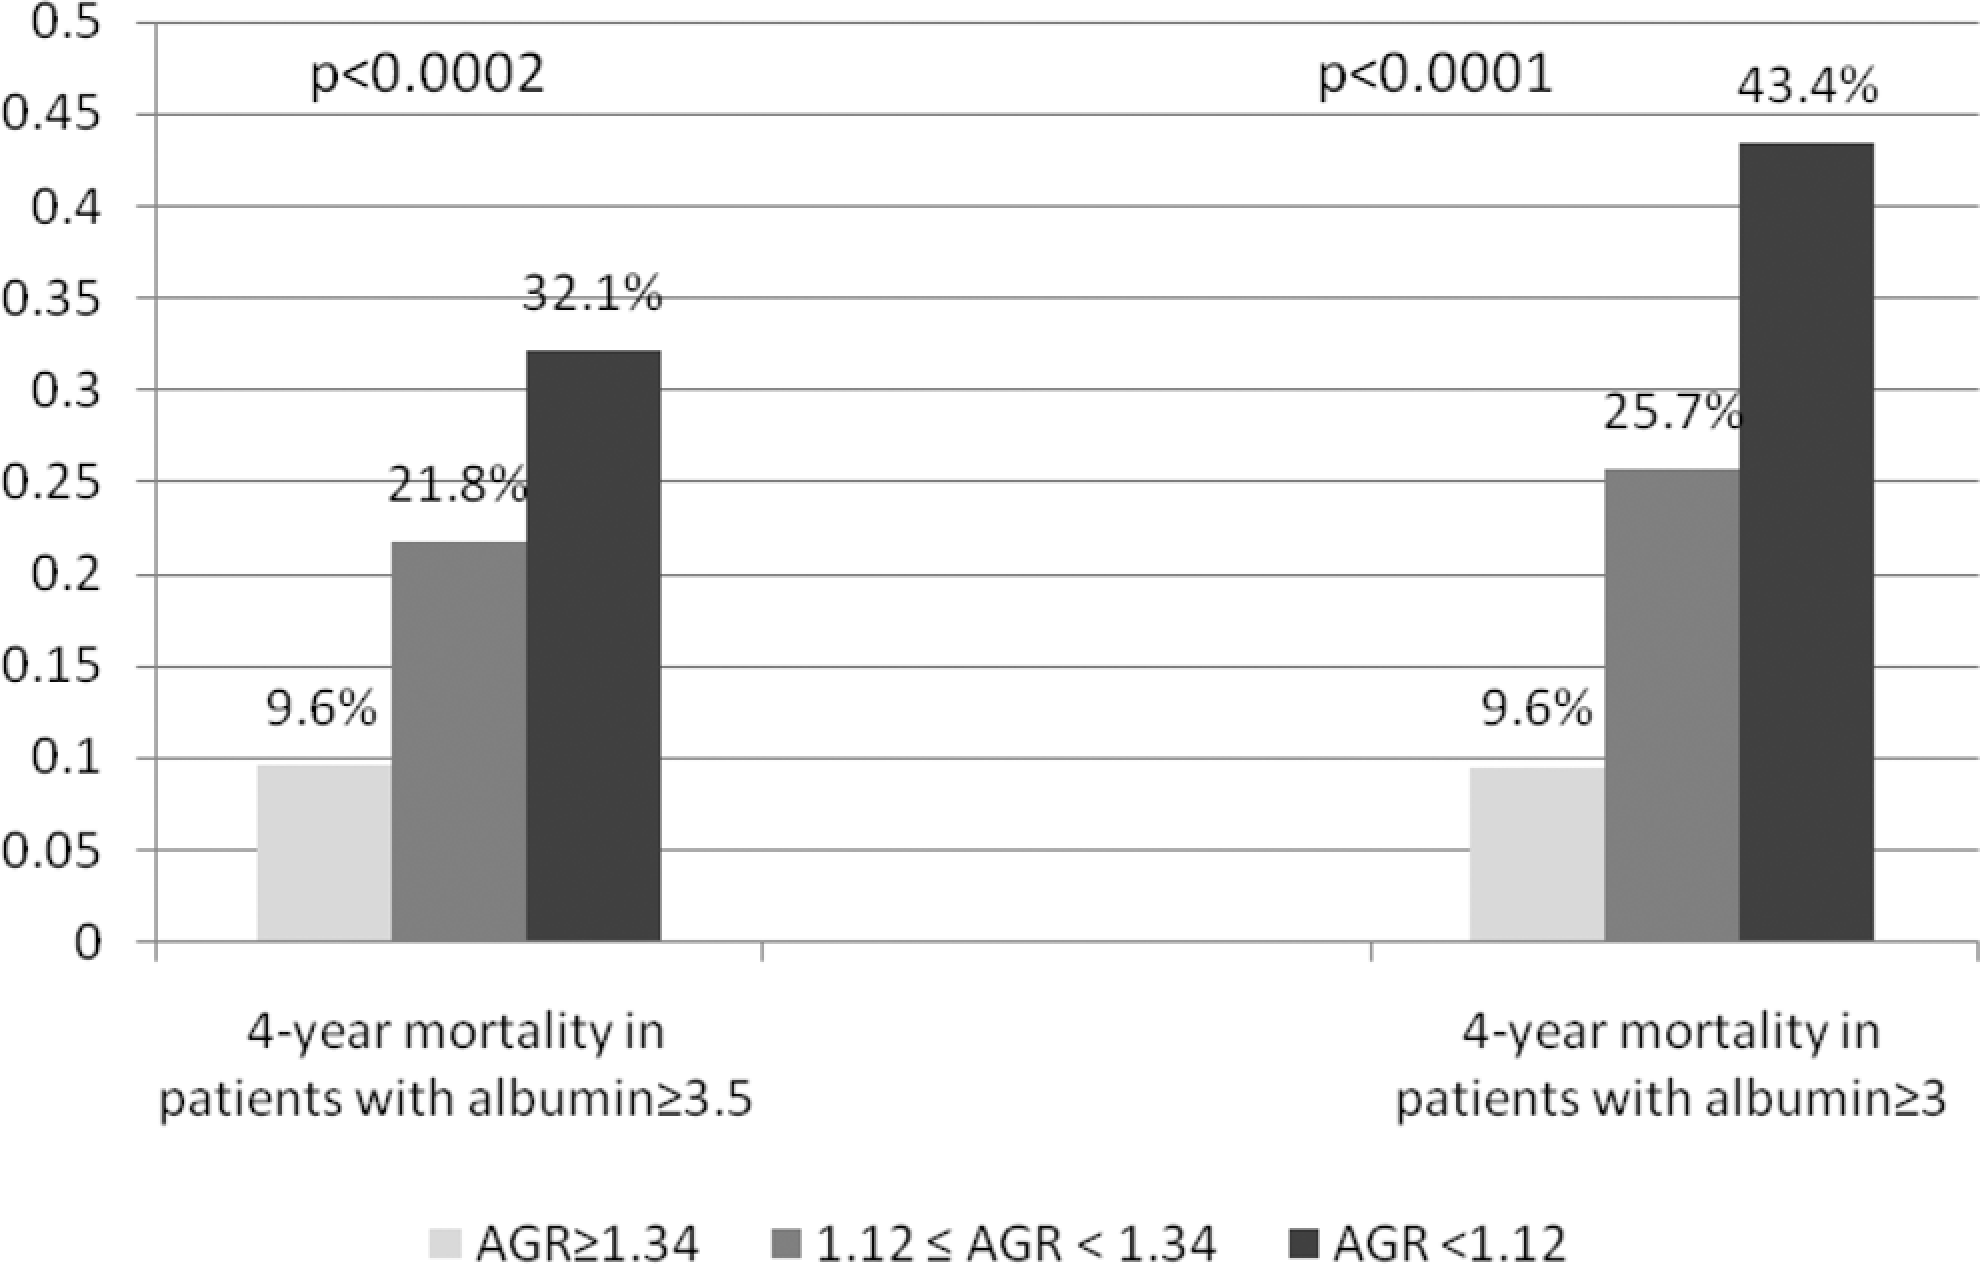
The 4-year all-cause mortality rates after non-ST-segment elevation myocardial infarction according to the serum albumin and albumin–globulin ratio (AGR) tertiles.
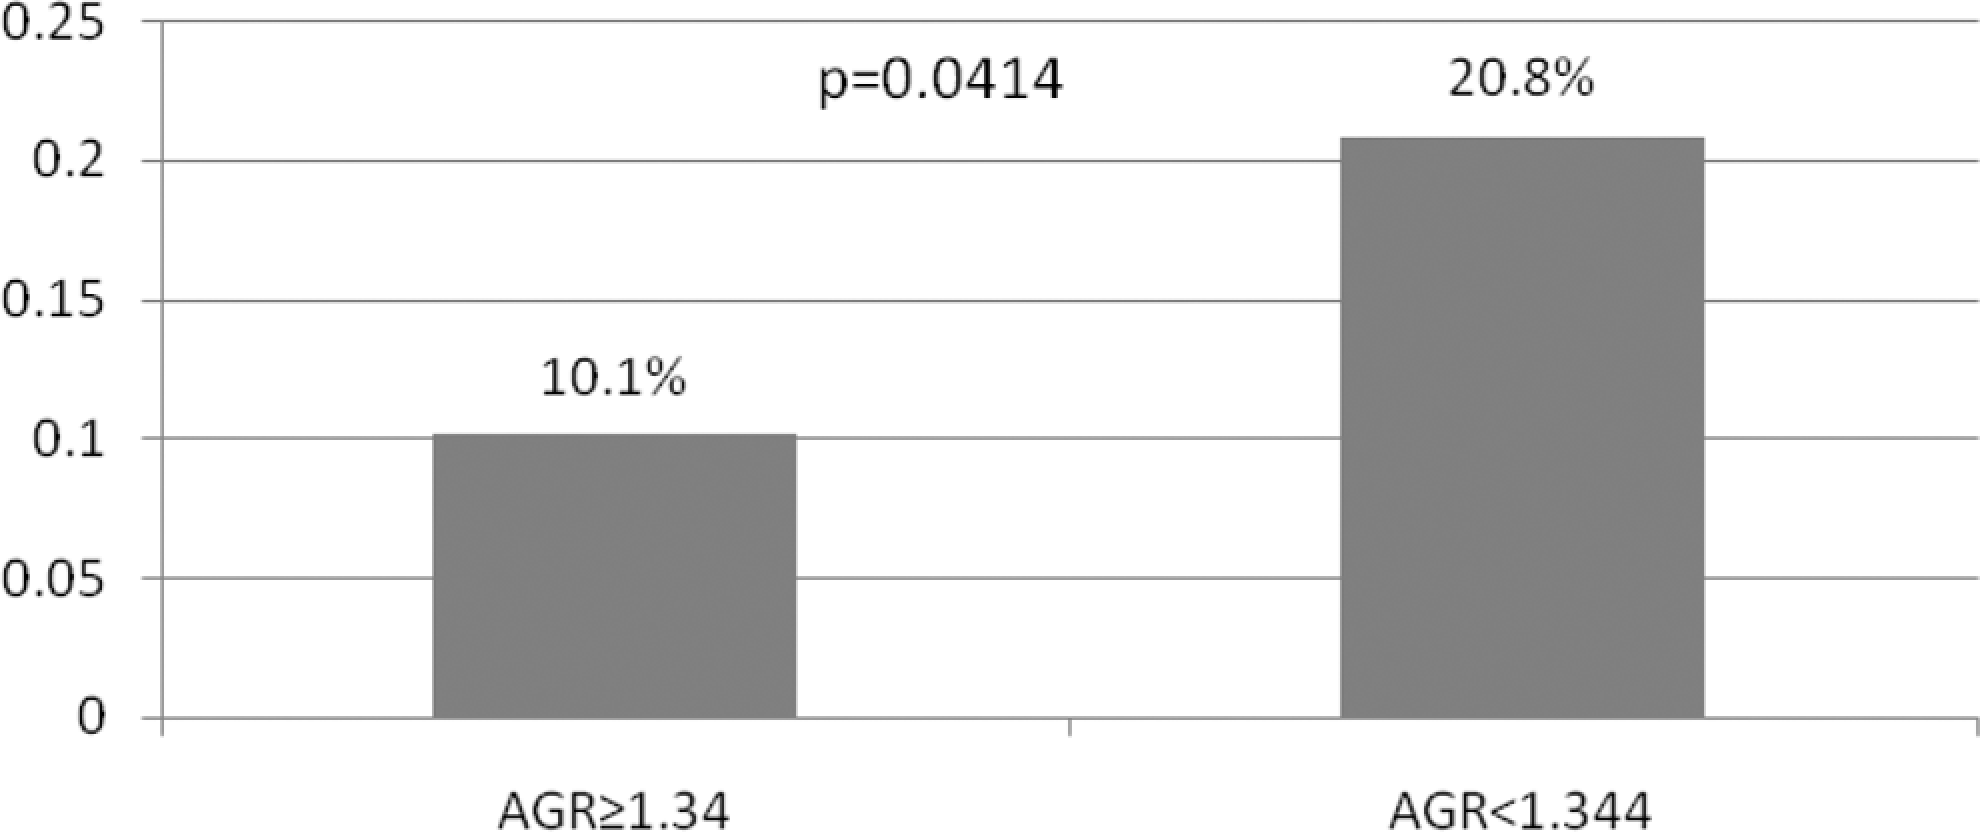
The all-cause 4-year mortality according to AGR among the non-ST segment elevation myocardial infarction patients with albumin >3.9 g/dL.
We also ran another additional analysis to evaluate the predictive value of AGR among the 6-month survivors after NSTEMI. Out of the 570, there were 466 patients who had albumin ≥3 g/dL on admission and also survived after 6 months of the NSTEMI. We divided these 466 patients (post 6-month NSTEMI survivors) according to AGR tertiles. The lowest AGR tertile (AGR < 1.12) had a significantly higher 4-year all-cause mortality (39/112 = 35%) than the middle (35/166 = 21%) and the highest AGR tertiles (17/188 = 9%), P = .0129 and P < .0001, respectively (Figure 5).
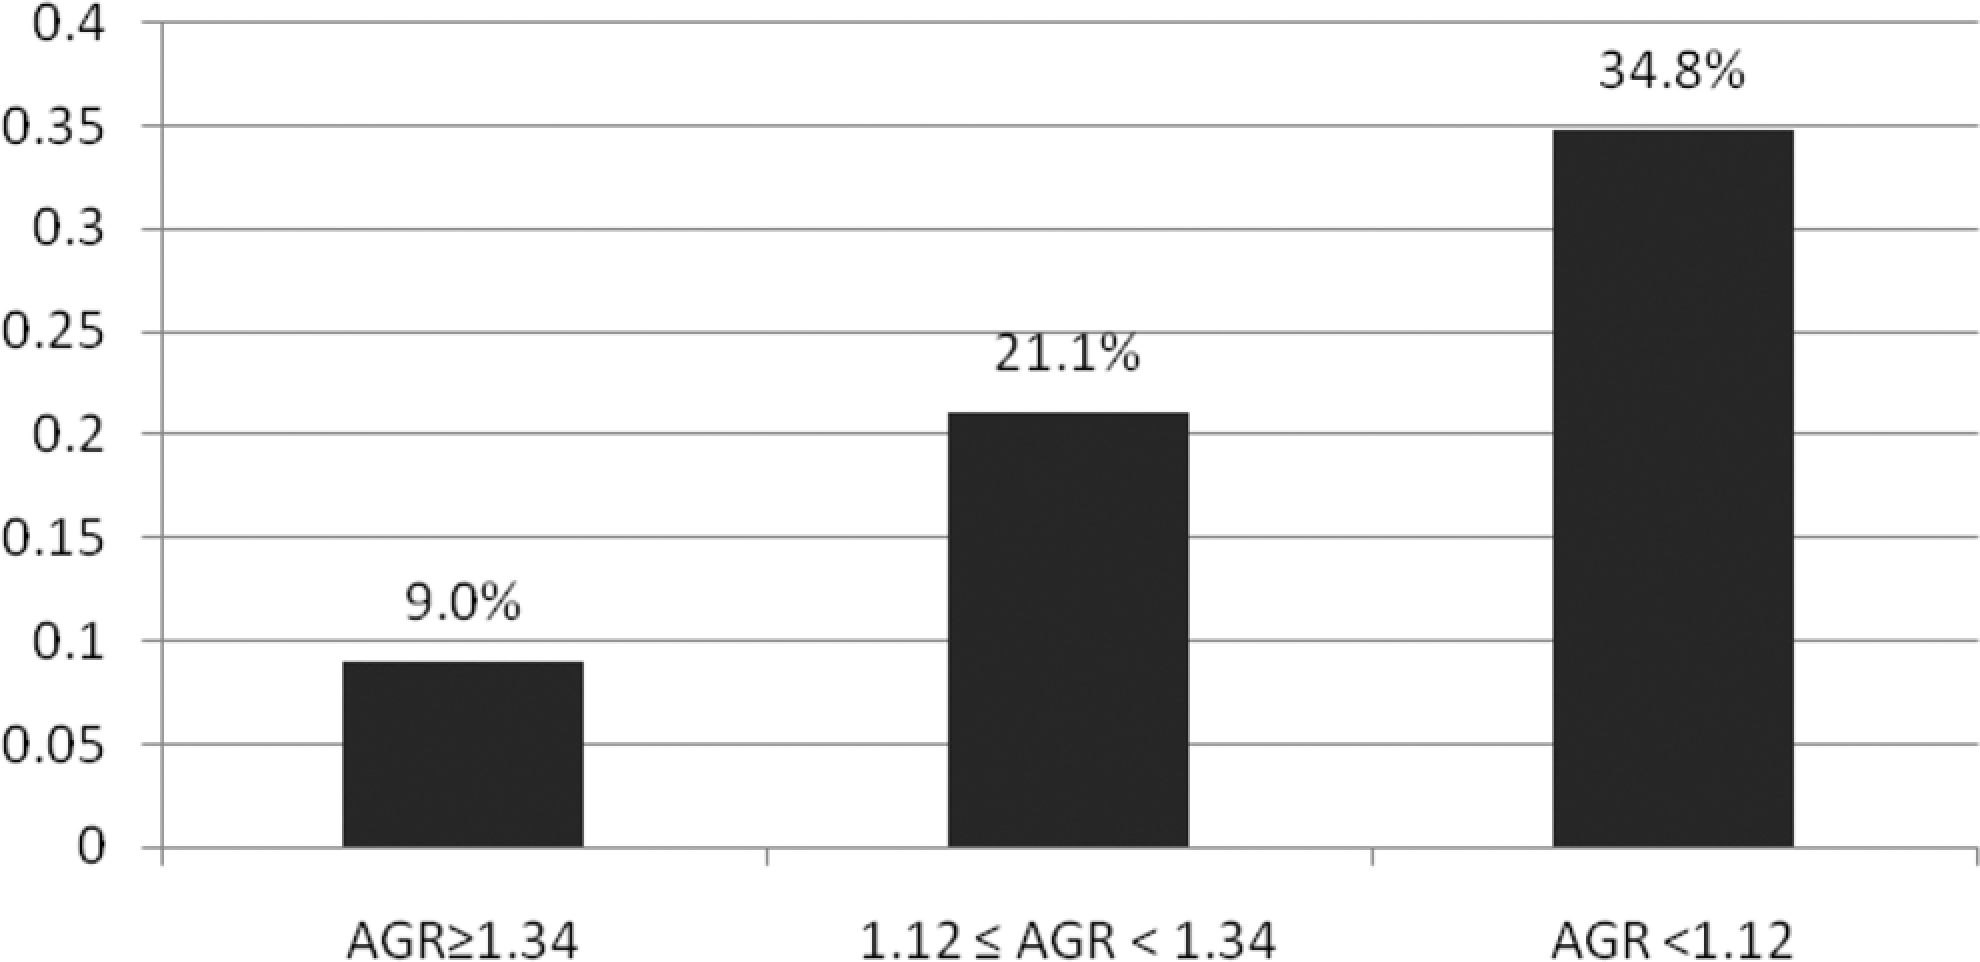
The all-cause 4-year mortality according to AGR tertiles among the post 6-month non-ST segment elevation myocardial infarction (NSTEMI) survivors with albumin ≥3 g/dL.AGR indicates albumin–globulin ratio; NSTEMI, non-ST segment elevation myocardial infarction. P < .0001 for the mortality rate in the 1st vs 3rd AGR tertiles and P = .0129 for the mortality rate in the 1st vs 2nd AGR tertiles (P values according to the 2-tailed Fisher exact test).
Discussion
Main Finding
Our main finding was that low AGR is an independent significant predictor of long-term mortality after NSTEMI, even after adjusting for possible confounding predictors. This association between low AGR and higher mortality was not solely explained by low albumin as the same finding was preserved even in patients with normal albumin (>3.9 g/dL). Interestingly, after exclusion of the patients that died in the first 6 months post-NSTEMI and those with albumin <3 g/dL, the low AGR remained a significant predictor of 4-year, all-cause mortality. This striking finding (among the 6 months post-NSTEMI survivors with albumin >3 g/dL) indicates that low AGR is a predictor of long-term mortality rather than just a marker of an acute medical condition. We also observed the significant association between low AGR and most of the chronic cardiovascular risk factors (ie, old age, diabetes, hypertension, renal insufficiency), which did not affect the significant association between AGR and mortality in the multivariate analysis.
The Impact of Hypoalbuminemia as a Confounding Variable
While we found 1 published study demonstrating the association between AGR and major adverse cardiac and cerebrovascular events (MACCEs), 15 there are many prior studies demonstrating the association between hypoalbuminemia and MACCEs. 2 –10 While Beamer et al 15 focused on patients with stroke, they did not study the association of AGR and the MACCEs in a multivariate analysis, and they did not report this association in different albumin ranges. Similar to our study, Beamer et al 15 observed a significant low albumin in the low AGR group that could be a confounding variable to AGR. In our study, we have found a significant association between mortality and low AGR group even among patients with normal albumin values (ie, albumin >3.9 g/dL). We do believe larger studies are needed to confirm this finding (ie, low AGR is a predictor of mortality in patients with normal albumin values) after adjusting for all the possible confounders in multivariate models.
Superiority of AGR to Albumin as a Predictor of Mortality
We attribute the superiority of AGR to albumin as a predictor of adverse outcomes to 2 causes. First, while many physiological and pathological conditions could affect the laboratory measurement of the serum concentrations of albumin and total protein (ie, false higher and lower albumin values in dehydration and fluid retention, respectively), these conditions have less effect on AGR. Second and most importantly, the AGR is a ratio of 2 significant and inversely related predictors. Albumin–globulin ratio is reflecting the ratio between the albumin and nonalbuminous proteins (including globulins, acute phase reactants, cytokines, and other inflammatory proteins). Therefore, the low AGR represents either low albumin values, high nonalbuminous protein values, or both. While hypoalbuminemia was a predictor of adverse outcomes, elevated nonalbumin proteins (eg, globulin and acute phase reactants) were also found to be predictors of adverse outcomes. Bhatia et al demonstrated that not only low albumin but also high globulin 19 was associated with higher adverse outcomes in cardiovascular patients. Additionally, higher levels of nonalbumin proteins (including interleukin 6, serum amyloid A protein, CRP, the factor VIII von Willebrand factor [vWF] complex) were associated with MACCEs. 20 Thus, we advocate the use of low AGR as a risk factor rather than separate low albumin or high “globulin.”
Albumin and AGR Relationship to Inflammatory Markers
Experimental studies showed that decreased albumin and not total protein is mediated by inflammatory mediators especially interleukin 1 monocytic products. 21 In a study of hemodialysis patients, 22 hypoalbuminemia was attributed to decreased albumin synthesis without any association with nutritional variables. Also in this study hypoalbuminemia was negatively correlated with alpha2-macroglobulin, CRP, and ferritin, which suggest that inflammation and not malnutrition is the culprit of hypoalbuminemia in these patients. Interestingly, as the albuminuria is a well-known significant predictor of MACCEs, in a large observational study using a diabetic population of 1715, both low serum albumin and albuminuria were independent predictors of MACCEs after adjusting for the confounding variables 23 ; which raises the question whether hypoalbuminemia is a sequel to albuminuria, malnutrition or an inflammatory response.
In our study, there was a significant association between the low AGR tertiles and both higher RDW and higher NLR. Prior studies demonstrated the association between RDW and inflammatory biomarkers. 24,25 Both NLR, 26 –29 as a known inflammatory marker, and RDW, 30 –33 were found to be strong independent predictors of major cardiovascular adverse outcomes.
Prior studies demonstrated the in vitro antiplatelet aggregation effect of albumin 34 and other plasma proteins. 35 Ishikawa et al attributed this albumin antithrombogenicity function to the albumin negatively charged molecules. 36 In other studies, albumin was also found to have an inhibitory effect on thromboxane A2 synthesis via its action on liberated arachidonic acid. 37 –39 In a study including animal models of nephrotic syndrome, hypoalbuminemia was associated with increased platelet aggregation, which was corrected by increasing the albumin concentration of the plasma. 40 Interestingly, in a study of patients with chronic renal failure undergoing peritoneal dialysis, the patients acquired reduced platelet aggregation after they received albumin to correct their hypoalbumeniemia. 41 Mikhailidis and Ganotakis reviewed the possible mechanisms involved in albumin antithrombogenicity and the clinical relevance of this finding (eg, in diabetes mellitus, nephrotic syndrome, and smoking). 42 In our literature search, we found studies discussing the thrombogenic effect of some nonalbumin serum proteins (eg, CRP, 43 complement system 44 ). Although these proteins do not constitute a major component of the non-albumin proteins, we postulate that the majority of the nonmeasured nonalbumin proteins, “globulins,” have inflammatory and thrombogenic functions. We speculate that AGR would be superior to albumin alone to demonstrate the influence of plasma proteins on platelet function. Further studies are needed to investigate the role of the various nonalbumin proteins on atherosclerosis and platelet function.
Limitations
Our study inherited the same limitations of our NSTEMI/NLR database (i.e. an observational study, missing other adverse outcomes than all-cause mortality). The study is lacking other data that could be relevant to the AGR (e.g. prealbumin). Additional limitations of our study are the relative small number of high prevalent disease and single center study status. Despite these limitations, our work represents the first study that focuses on the predictive value of AGR in NSTEMI patients.
Conclusions
Albumin–globulin ratio <1.34 is a significant independent predictor of long-term mortality after NSTEMI. Low AGR remained a significant predictor of long-term mortality in NSTEMI patients who survived after 6 months of NSTEMI and those with albumin >3.9 g/dL. Further studies are needed to clarify this finding. A larger, prospective, multicenter, study is needed to verify and explore the mechanisms at the molecular level for the association of AGR with survival.
Footnotes
Acknowledgments
We thank Jason Selim, MS, and Silivia Khalil for their contribution to data collection and Mrs Yelena Friedman for her contribution in literature search.
Declaration of Conflicting Interests
The authors declared no potential conflicts of interest with respect to the research, authorship, and/or publication of this article.
Funding
The authors received no financial support for the research, authorship, and/or publication of this article.