
Abstract
We compared therapeutic lipid target achievements among patients with diabetes or coronary heart disease (CHD) in Oman. A retrospective chart review of 94 patients was conducted at an outpatient clinic in Sultan Qaboos University Hospital, Muscat, Oman. The variables included low-density lipoprotein cholesterol (LDL-C), high-density lipoprotein cholesterol (HDL-C), and apolipoprotein B (apo B). The overall mean age of the cohort was 59 ± 12 years, 54% were male, 66% were diabetic, 48% hypertensive, 45% had CHD, 94% were on simvastatin, 4% were on fenofibrate, and 2% were on both simvastatin and fenofibrate. Lipid goal attainments of calculated LDL-C (<2.6 mmol/L), apo B (<0.9 g/L), and non-HDL-C (<3.36 mmol/L) were reached in 52%, 39%, and 53% of the patients, respectively. A significant proportion of high-risk patients treated with lipid-lowering agents reach LDL-C but not the apo B treatment targets, suggesting that the use of apo B target values should also be considered.
Keywords
Introduction
Low-density lipoprotein cholesterol (LDL-C) is recognized as an important cardiovascular disease (CVD) risk marker. 1 In addition, LDL-C is adopted by various guidelines as a therapeutic target for both primary and secondary prevention. 2,3
Research has shown that discordance exist between LDL-C and apolipoprotein B (apo B). 4 Furthermore, several epidemiological studies showed that both nonhigh-density lipoprotein cholesterol (non-HDL-C) and apo B are better predictors of cardiovascular events than LDL-C. 5 –7 In fact, apo B has proven to be a superior predictor of response to lipid-lowering therapy. 8 –11
Non-HDL-C is included in the National Cholesterol Education Program (NCEP) guidelines as a secondary therapeutic target for hypertriglyceridemic patients. 2 In addition, apo B has been suggested as a new therapeutic goal by the recent joint Consensus Statement (American Diabetes Association and American College of Cardiology Foundation) in patients with atherogenic dyslipidemia and cardiometabolic risk. 12 An apo B level <0.9 g/L is recommended for patients without diabetes or known CVD but with ≥2 major CVD risk factors or with diabetes and without major CVD risk factors, and apo B level <0.8 g/L is recommended for patients with CVD or diabetes plus one or more additional major CVD risk factor. 12
The aim of this study was to compare therapeutic target achievement between LDL-C and apo B among patients with diabetes or coronary heart disease (CHD) in Oman.
Methods
A retrospective chart review of 94 patients with diabetes or CHD was conducted at the outpatient clinic of Sultan Qaboos University Hospital, Muscat, Oman. The demographic data are shown in Table 1. All the patients had long-term follow-up and are regularly assessed at the outpatient clinic. The recorded variables included total cholesterol (TC), LDL-C, HDL-C, triglycerides (TGs), and apo B.
Demographic and Clinical Characteristics of the Study Cohort (n = 94).
Abbreviations: SD, standard deviation; CHD, coronary heart disease; LDL-C, low-density lipoprotein cholesterol; HDL-C, high-density lipoprotein cholesterol; apo B, apolipoprotein B.
Blood samples were taken after a 12-hour fast (water only allowed). The TC, TG, LDL-C, and HDL-C were analyzed using automated Roche INTEGRA 800 (Rotkreuz, Switzerland). Enzymatic colorimetric methods were used for the estimation of TC and TG. The HDL-C was assessed by homogeneous plus third-generation enzymatic colorimetric assay. In the presence of magnesium sulfate and dextran sulfate, water-soluble complexes with LDL, very low-density lipoprotein (VLDL), and chylomicrons are formed, which are resistant to polyethylene glycol-modified enzyme. The cholesterol concentration of HDL-C is determined by enzymatic colorimetric method using cholesterol esterase and cholesterol oxidase coupled with Polyethylene glycol (PGE) to the amino groups (approximately 40%). The LDL-C was measured by homogeneous plus second-generation enzymatic colorimetric assay. This automated method for the direct determination of LDL-C takes advantage of the selective micellary solublization of LDL-C by a nonionic detergent and the interaction of a sugar compound and lipoproteins (VLDL and chylomicrons). When a detergent is included in the enzymatic method for cholesterol determination (cholesterol esterase and cholesterol oxidase coupling reaction), the relative reactivities of cholesterol in the lipoprotein fractions increase in the order HDL: < chylomicrons < VLDL < LDL. This direct assay meets the 1995 NCEP goals of <4% total coefficient of variation (CV), bias ≤4% versus reference method, and ≤12% total analytical error. 13 In addition, LDL-C levels were calculated using Friedewald formula. 14 The apo B was measured on the Beckman Coulter IMMAGE 800 (Immunochemistry System, Chaska, Minnesota). Determination of apo B is carried out by rate nephelometry, where a patient’s apo B reacts with specific antibody to produce antibody–antigen complex, and the rate of increase in light scattered from this complex is measured. The quality controls were traceable to the World Health Organization-International Federation of Clinical Chemistry International Reference Base for apo B. 15 The interassay CV for apo B was 3.7% and 4.2% for values of 1.81 and 0.86 g/L, respectively.
Statistical Analysis
Descriptive statistics were used to describe the data. For categorical variables, frequencies and percentages were reported. For continuous variables, mean and standard deviation were used to present the data. Correlations between the different lipid fractions were performed using Pearson product-moment correlation coefficient. An a priori 2-tailed level of significance was set at .05. Statistical analyses were conducted using STATA version 12.1 (STATA Corporation, College Station, Texas
Results
The overall mean age of the cohort was 59 ± 12 years, 54% were male, 66% were diabetic, 48% hypertensive, 45% had CHD, 94% were on simvastatin, 4% patients were on fenofibrate, and 2% were on both simvastatin and fenofibrate. The mean TC on treatment was 4.83 ± 1.34 mmol/L, TG was 1.64 ± 0.79 mmol/L, HDL-C was 1.20 ± 0.33 mmol/L, LDL-C was 2.88 ± 1.23 mmol/L, apo B was 1.05 ± 0.34 g/L, and non-HDL-C was 3.64 ± 1.32 mmol/L.
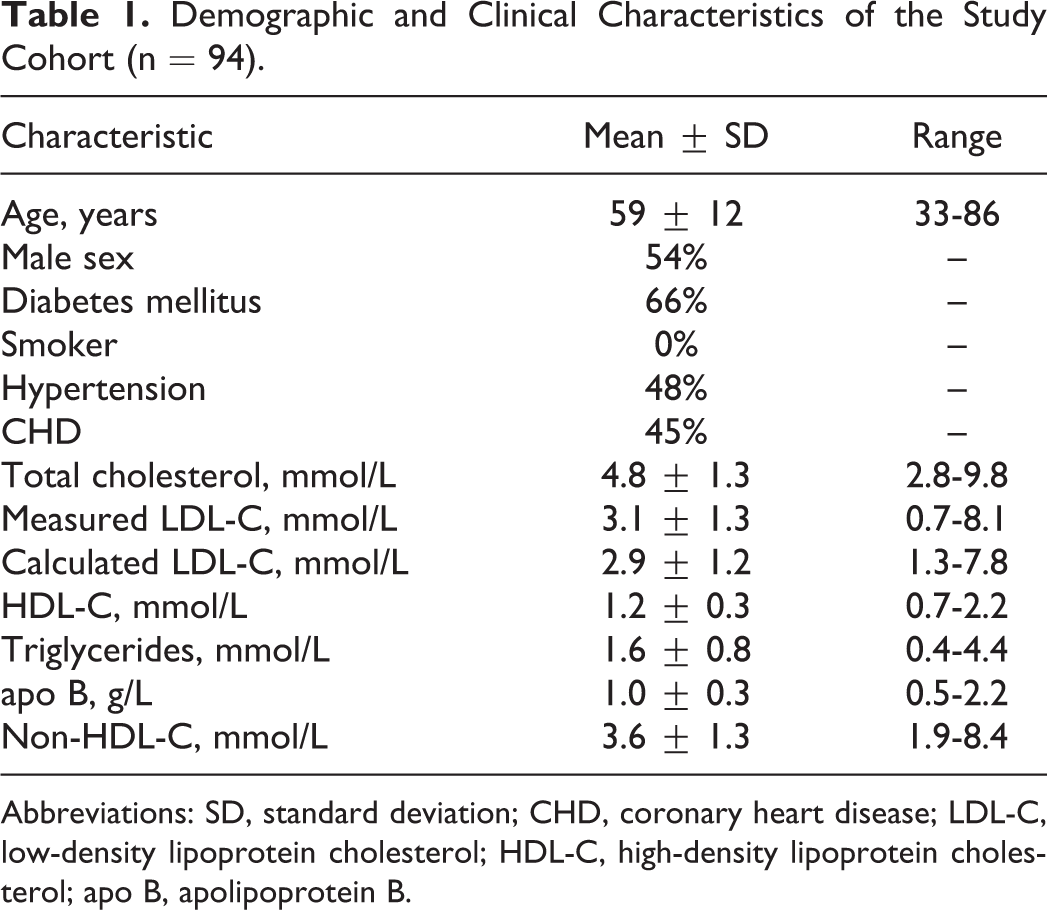
Lipid goal attainments are outlined in Figure 1. The LDL-C target of <2.6 mmol/L was reached in 52% of the patients, while only 39% achieved dual targets (LDL-C of <2.6 mmol/L and apo B of <0.9 g/L). Of those patients who had elevated TG levels of ≥1.7 mmol/L but controlled LDL-C of <2.6 mmol/L, 30% did not achieve apo B target of <0.9 g/L. Non-HDL-C target of <3.36 mmol/L was attained only in 52% of the cohort. All those who attained LDL-C goal of 2.6 mmol/L also attained non-HDL-C of <3.36 mmol/L.
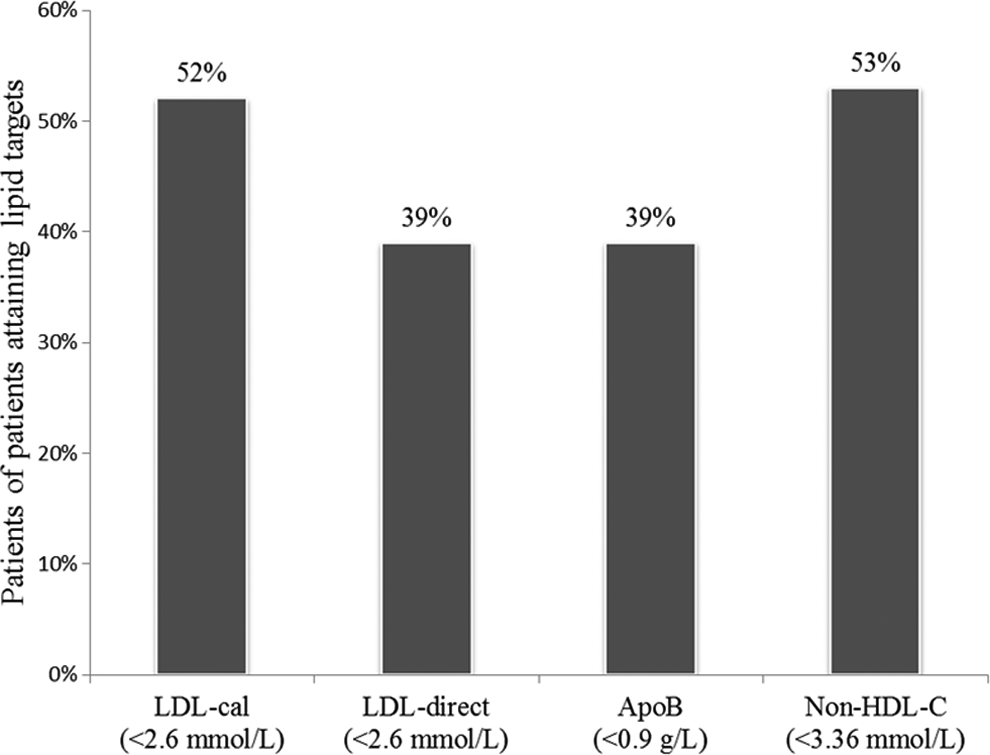
Percentage of patients attaining lipid goals (LDL-C calculated, LDL-C direct, apo B, and non-HDL-C). apo B indicates apolipoprotein B; HDL-C, high-density lipoprotein cholesterol; LDL-C, low-density lipoprotein cholesterol.
Univariate correlations of various lipid fractions are displayed in Figures 2 to 5. Figure 2 demonstrates a strong correlation between the measured and the calculated LDL-C (ρ = 0.979; P < .001). Figures 3 and 4 show a strong correlations between the calculated LDL-C and the apo B (ρ = 0.892; P < .001) and the non-HDL-C (ρ = 0.961; P < .001), respectively. The analysis also demonstrated a strong correlation between apo B and non-HDL-C (ρ = 0.941; P < .001). In spite of this strong correlation between the calculated LDL-C and the apo B, nearly a quarter of the patients that attained their LDL-C did not achieve their apo B levels (24%; n = 12; N=49).
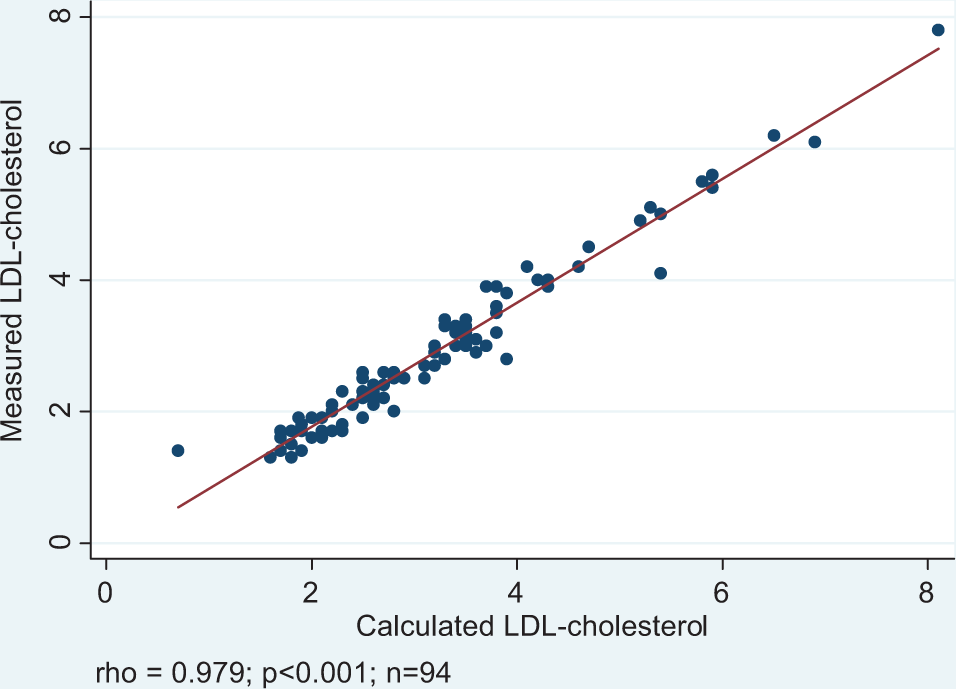
Correlation between calculated LDL-cholesterol and measured LDL cholesterol. LDL indicates low-density lipoprotein.
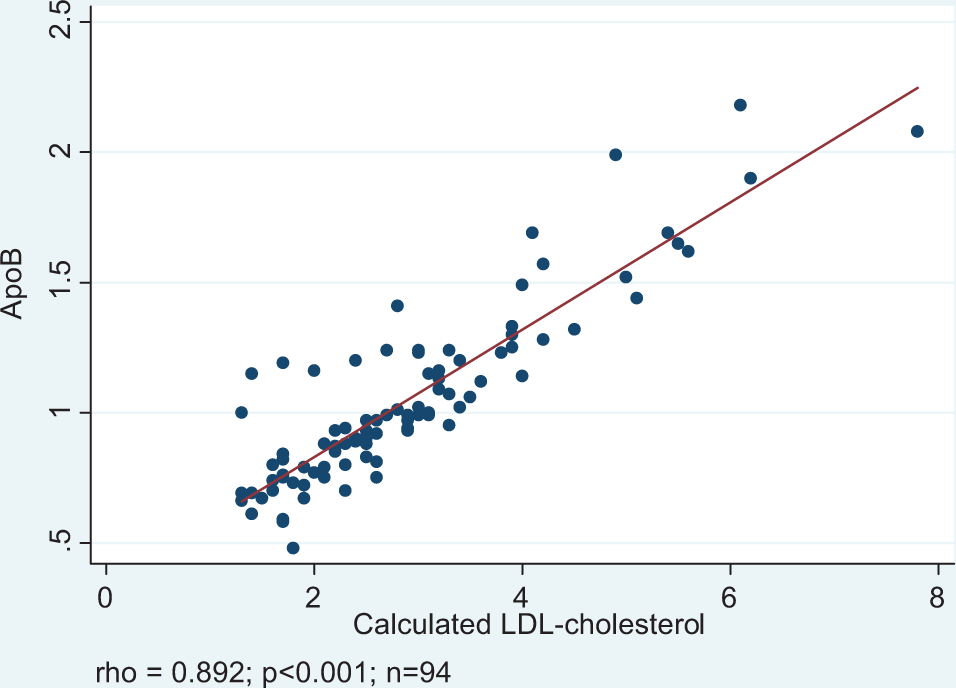
Correlation between calculated LDL cholesterol and apo B. apo B indicates apolipoprotein B; LDL, low-density lipoprotein.
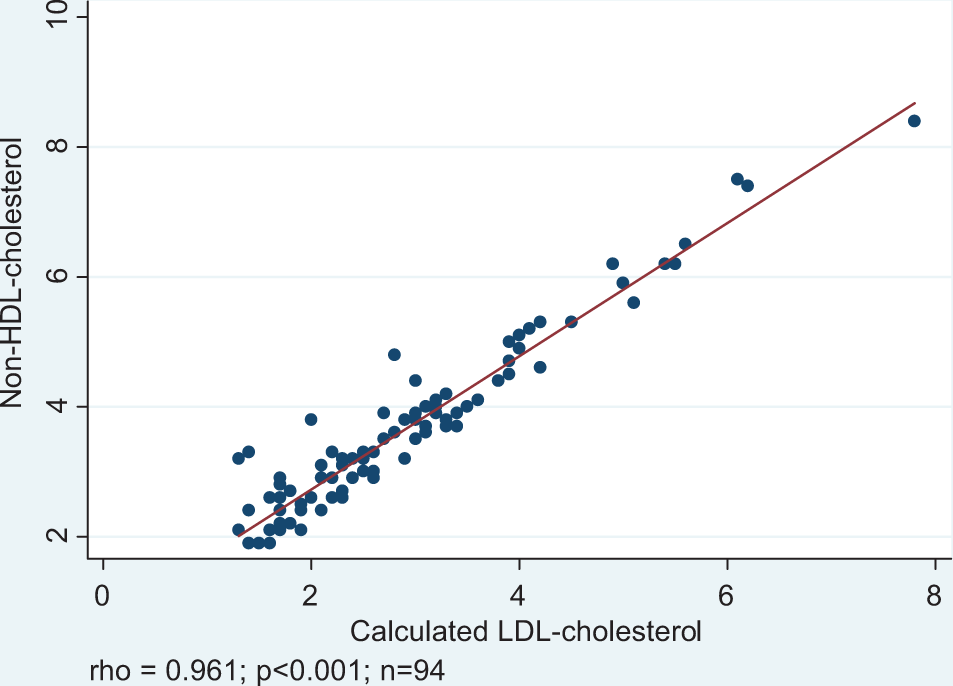
Correlation between calculated LDL-cholesterol and non-HDL-cholesterol. ; HDL-C indicates high-density lipoprotein cholesterol; LDL, low-density lipoprotein.
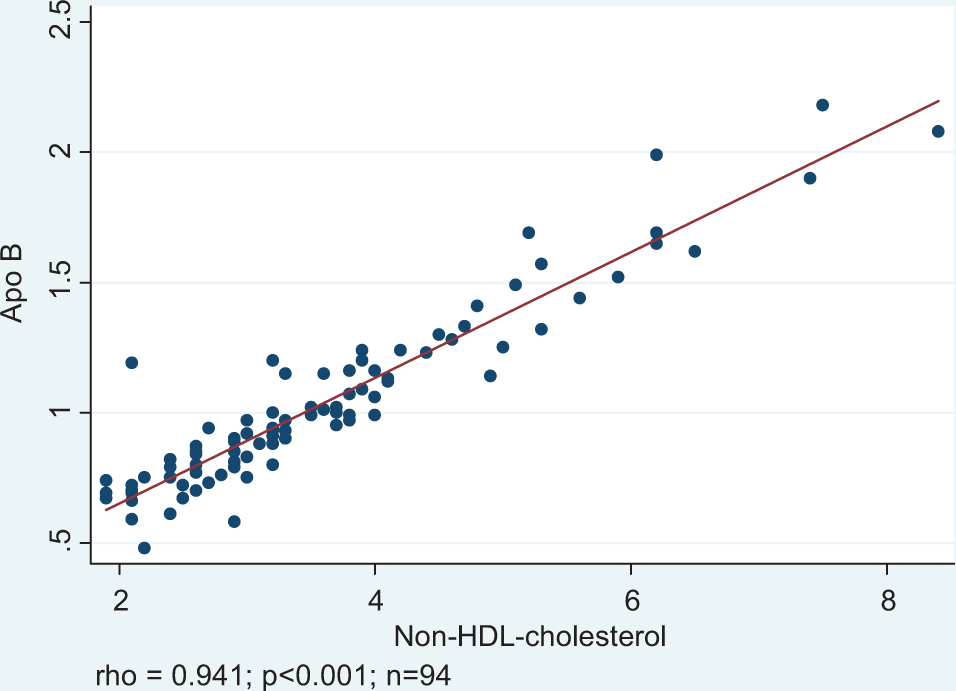
Correlation between apo B and non-HDL-cholesterol. apo B indicates apolipoprotein B; HDL, high-density lipoprotein.
Discussion
In this study, we compared the achievement of on treatment lipid-lowering goals between LDL-C and apo B in patients with diabetes or CHD. Among the patients that achieved LDL-C target of <2.6 mmol/L, 30% of them did not achieve apo B of <0.9 g/L.
The apo B had been shown to be a better on treatment predictor of major coronary events than on treatment LDL-C in the AFCAPS/TexCAPS, 16 LIPID, 17 and the Leiden Heart Studies. 18 In addition, apo B had been shown to be a better predictor of response to lipid-lowering therapy than LDL-C. 8 –11 In our study, we showed significant correlation between apo B and LDL-C (ρ = 0.89, P < .001), which is in agreement with previous studies. 19,20 Despite this agreement, significant number of patients in our study did not achieve their apo B goals, although they had achieved LDL-C goals. There is growing evidence showing increased CVD residual risk in patients with low LDL-C but high apo B levels. This suggests the limitations of using only LDL-C as a target for lipid-lowering therapy. The American College of Cardiology recognizes apo B as the best currently available maker of the adequacy of lipid-lowering therapy. 12
The apo B and non-HDL-C are highly correlated with each other. It was on the basis of this correlation that the NCEP Adult Treatment Panel III concluded that non-HDL-C is an acceptable surrogate measure for apo B. 21,22 In the INTERHEART study, 23 non-HDL-C and apo B were more closely associated with myocardial infarction than LDL-C. Post hoc analyses of the UK InPractice study 19 showed the overall apo B to have a slightly greater correlation with non-HDL-C than with LDL-C across all treatment groups, for baseline and posttreatment values. Similarly, in our study, apo B was slightly better correlated with non-HDL-C (ρ = 0.94; P < .001) than with LDL-C (ρ = 0.89, P < .001). Despite the high correlation, only 53% of the patients reached the non-HDL-C goal (<3.36 mmol/L) compared with 39% for the apo B target goal (<0.9 g/L). In the Quebec Cardiovascular Study, 4 in population without CVD, approximately 25% had discordant non-HDL-C and apo B concentration. The variation between apo B and non-HDL-C may be attributed to the size and metabolic heterogeneity of the population under study. In the Lovastatin-Niacin comparative trial, 24 the correlation between the change in apo B and LDL-C was only 0.72, whereas the correlation between the change in apo B and non-HDL-C was slightly less at 0.685.
Discordance between LDL-C and non-HDL-C can be increased in the presence of diabetes and metabolic syndrome. 25 –27 In the Insulin Resistance Atherosclerosis Study, 28 patients with normal LDL-C but elevated apo B had stronger associations with abdominal obesity, other dyslipidemias, hyperinsulinemia, and thrombosis than hyper-LDL-C patients with normal apo B. The prevalence of diabetes in our study was 66%, and the patients who reached the LDL-C target (<2.6 mmol/L) also attained the non-HDL-C threshold of <3.36 mmol/L in both diabetic and nondiabetic patients. In addition, 23% of diabetic patients achieved the LDL-C target (<2.6 mmol/L) but not the apo B threshold <0.9 g/L compared to 33% of nondiabetic patients. These unexpected findings may be explained by the nonsignificant differences in TG levels between diabetics and nondiabetics (1.51 vs 1.56 mmol/L; P = .839). The apo B can also increase the discordance between non-HDL-C and apo B (21% of diabetic patients achieved the non-HDL-C goal of <3.36 mmol/L but not the apo B level of <0.9 g/L, compared with 33% in nondiabetic patients). Studies have shown that apo B performs better in predicting patients with low CVD risk and/or with normal TG levels, whereas non-HDL-C performs better in patients with high CVD risk or with high TG levels or cardiometabolic condition. 4,12,26,27,29 –31 Data from 1430 diabetic patients in non-HDL-C goal of <3.5 mmol/L have shown that there was a discordance with apo B level goal of <0.9 g/L in 31% of the patients. 31 In the same study, there was underestimation of risk as suggested by the non-HDL-C cutoffs, in females, compared with males. Furthermore, Wägner et al 32 showed that in diabetic patients with normal TG levels, 48% of the patients with normal non-HDL-C had high apo B levels. In our study, 62% of the diabetic patients with normal TG levels (<1.7 mmol/L) had achieved the non-HDL-C goal but failed to achieve the apo B goal compared to 38% diabetic patients with high TG levels (>1.7 mmol/L).
In this study we also assessed the correlation between calculated LDL-C and measured LDL-C. Overall, they were highly correlated (ρ = 0.98; P < .001). An LDL-C of <2.6 mmol/L was achieved in 52% of the patients using calculated methods and in 39% of the patients using the direct method. Can et al 33 found similar significant correlation between calculated LDL-C and measured LDL-C. However, in their study, the calculated LDL-C had a negative bias in regard to the direct method. They attributed that to the difference in the TG/cholesterol ratio in the VLDL particles and to the concentration of cholesterol in the intermediate-density lipoprotein that can be measured by the direct method. Furthermore, the correlation between the measured LDL-C and the apo B was better correlated compared with the correlation between LDL-C calculated and apo B. Whether measured LDL-C can be used as a surrogate marker for apo B needs to be confirmed in a larger cohort study.
There is a growing evidence to use lower target of LDL-C <1.7 mmol/L to decrease the residual cardiovascular risk. 34 This is in addition to the growing data showing the degree of discordance between LDL-C and apo B or non-HDL-C. Strategies are needed to review and update the existing guidelines and considering the inclusion of apo B (or non-HDL-C in the absence of apo B) along with LDL-C both as risk predictor and therapeutic guidance for the effectiveness of lipid-lowering therapy.
This study has limitations. The small sample size could affect the overall results. The lipid measurement was done at one time, and the effect of the weight and the duration of the therapy are not well documented.
This study demonstrated that despite a high correlation between LDL-C and apo B levels, a significant proportion of patients with CHD or diabetes on lipid lowering therapy reached LDL-C but not the apo B treatment targets. Furthermore, fewer patients achieved apo B targets compared with non-HDL-C targets. These findings support the use of apo B (or non-HDL-C in the absence of apo B) along with LDL-C both as CVD risk predictor and as therapeutic guidance for the effectiveness of lipid-lowering therapy in patients with CHD or diabetes.
Footnotes
Acknowledgment
We thank the Hospital Information System department at Sultan Qaboos University Hospital for providing the required information for the study.
Declaration of Conflicting Interests
The author(s) declared no potential conflicts of interest with respect to the research, authorship, and/or publication of this article.
Funding
The author(s) received no financial support for the research, authorship, and/or publication of this article.