
Abstract
We assessed the relationship between insulin resistance, serum insulin-like growth factor 1 (IGF-1) levels, and common carotid intima–media thickness (CC-IMT) in morbidly obese young patients. A total of 249 patients (aged 37.9 ± 9.8 years, body mass index [BMI] 45.6 ± 8.3 kg/m2) were evaluated (metabolic tests, serum IGF-1 measurements, homeostasis model assessment—insulin resistance [HOMA-IR], and ultrasonographically assessed CC-IMT) in a research program for bariatric surgery candidates. After adjusting for age, gender, BMI, systolic blood pressure, uric acid, antihypertensive and lipid-lowering treatment, metabolic syndrome, and metabolic class, both HOMA-IR and IGF-1 z-score were significantly associated with CC-IMT. These results were confirmed in logistic regression analysis, in which age (β = 1.11, P = .001), gender (β = 3.19, P = .001), HOMA-IR (β = 1.221, P = .005), and IGF-1 z-score (β = 1.734, P = .009) were the only independent determinants of abnormal CC-IMT, presumably modulating the effect of the other risk factors included in the regression. Area under the receiver–operating characteristic curve for the model was 0.841 (confidence interval: 0.776-0.907; P < .001). In conclusion, in morbidly obese young adults, insulin resistance and IGF-1 z-score are significantly associated with CC-IMT, independent of other major cardiovascular risk factors.
Introduction
Obesity is an established risk factor for clinical cardiovascular diseases (CVDs). 1 A number of studies showed an association between obesity and increased common carotid intima–media thickness (CC-IMT), 2,3 a marker of subclinical atherosclerosis 4 and a predictor of cardiovascular events. 5 This relationship seems to be established from a very young age, 6 and one of its possible early mediators is insulin resistance and the associated hyperinsulinemia. 7
It has been suggested that insulin-like growth factor 1 (IGF-1) system contributes to atherosclerosis, acting on vascular smooth muscle cells as a potent stimulator of cell proliferation as well as an inhibitor of apoptosis. 8 Obesity, especially in severe forms, is characterized by low IGF-1 levels, 9 and there are population-based studies showing an association between decreased IGF-1 levels and risk of heart failure, coronary disease, and cardiovascular mortality. 10,11 However, there is a lack of consensus regarding the relationship between IGF-1 concentrations and IMT, with studies showing both positive 12 and negative 13 correlations. It is noteworthy that the majority of the studies on this topic were restricted to middle-aged or older patients, probably because the data linking CC-IMT with cardiovascular events are stronger in this age range.
The aim of this study was to evaluate the relationship between CC-IMT, insulin resistance estimated by homeostasis model assessment—insulin resistance (HOMA-IR), IGF-1 concentrations, and major cardiovascular risk factors, in a group of severely obese young patients.
Methods
Patients
The study population was selected from 350 obese patients (BMI >30 kg/m2) consecutively admitted in the Department of Endocrinology, Diabetes and Metabolic Diseases of an University Hospital between June 2008 and December 2012 to be evaluated as candidates for bariatric surgery. To analyze the early influence of IGF-1 and metabolic factors on CC-IMT values, we decided to limit our study population to young patients (aged <55 years). All patients met the 1991 National Institute of Health Consensus Conference guidelines for bariatric surgery, with BMI ≥40 kg/m2 or a BMI ≥ 35 kg/m2 with associated comorbidities, as described previously. 14 Exclusion criteria were patients with severe chronic kidney disease (estimated glomerular filtration rate <30 mL/min), insulin requiring or uncontrolled diabetes (fasting glucose levels >300 mg/dL), liver failure, cancer, and other systemic severe diseases; patients without available measurements of common CC-IMT were also excluded. According to these criteria, a total of 249 patients (164 women) were included in the analysis. All patients gave a written informed consent before commencing the protocol. This study was conducted according to the standards of good clinical practice and the Declaration of Helsinki and was approved by the ethics committee of our hospital.
Study Protocol
Patient workup included anthropometrical and clinical evaluation, blood tests, and carotid ultrasound. Body weight was measured in light clothing and without shoes to the nearest 0.5 kg, height was measured to the nearest 0.5 cm, and waist circumference (WC) was measured at the midway between the lower border of the rib cage and the iliac crest. Blood pressure (BP) was measured by a physician, with the patient seated for at least 10 minutes, and the average of 2 measurements was considered for the analysis. After overnight fasting, blood samples were obtained and used for the determination of glucose, total cholesterol, high-density lipoprotein cholesterol (HDL-C), low-density lipoprotein cholesterol (LDL-C), triglycerides, and uric acid. In all patients not previously diagnosed with diabetes mellitus, we performed a 75-g oral glucose tolerance test (OGTT), with blood samples taken at 0 and 2 hours. In conformity with the American Diabetes Association criteria, 15 all patients with fasting plasma glucose ≥126 mg/dL or 2-hour plasma glucose ≥200 mg/dL during OGTT were considered as having diabetes mellitus. Patients with fasting plasma glucose between 100 and 125 mg/dL or with 2-hour plasma glucose between 140 and 200 mg/dL were considered as having prediabetes. 15
Serum samples of C-reactive protein, insulin, and IGF-1 were assayed using a 2-site, solid-phase, and enzyme-labeled chemiluminescent immunometric assay (Immulite 2000; Siemens Healthcare Diagnostics Products Ltd, Erlangen, Germany). For IGF-1, the analytical sensitivity was 20 ng/mL, the intra-assay coefficient of variation (CV) was 2.3% to 3.9%, and the interassay CV was 3.7% to 8.1%. Since IGF-1 levels are age dependent, we calculated the standard deviation (SD) score of IGF-1 levels according to age (z-score). Age-adjusted IGF-1 values were referenced from the study of Elmlinger et al 16 who used the same assay as this study.
Insulin resistance was estimated using the homeostasis model (HOMA-IR), 17 which is the product of fasting plasma insulin concentration (mIU/L) and glucose concentration (mg/dL) divided by 405. Patients were considered to have metabolic syndrome according to the Adult Treatment Panel III definition. 18
The CC-IMT was measured using high-resolution B-mode ultrasonography (Fukuda Denshi UF-850 XTD Tellus system, Tokyo, Japan), and an 8-MHz linear array transducer. All measurements were performed by the same trained investigator throughout the study, to avoid interobserver variation. For each patient, IMT measurements were obtained with the patient lying in the supine position and with the neck rotated to the opposite side of examination. 19 Measurements were manually performed bilaterally in triplicate on far wall of the distal 1 cm of the common carotid artery. Average CC-IMT values from each side were reported and also a mean value of right and left side (mean of means). In conjunctions with measuring CC-IMT, evaluation for the presence of carotid plaque was performed. Carotid plaque was defined as focal wall thickening that is at ≥50% than that of the surrounding vessel wall or as a focal region with CC-IMT >1.5 mm that protrudes into the lumen that is distinct from the adjacent boundary. 4 Values of CC-IMT were considered abnormal if they were higher than the 75th percentile for age and gender derived from the Carotid Atherosclerosis Progression Study, 20 in conformity with The Consensus Statement from the American Society of Echocardiography Carotid Intima–Media Thickness Task Force. 4 We also considered CC-IMT as abnormal in the presence of a carotid plaque.
Statistics
Statistical analysis was performed using SPSS software (SPSS Inc, Chicago, Illinois), version 17.0. Continuous variables with normal distribution were expressed as mean ± SD, while those with nonparametric distribution were expressed as medians (interquartile ranges). Between-group comparisons were carried out by means of parametric or nonparametric tests, as appropriate (independent samples t test/analysis of variance/Mann-Whitney U test for continuous variables; Pearson chi-square test for categorical ones). Correlations were performed using Pearson analysis, and linear regression was used to identify the influence of different parameters CC-IMT values. A logistic regression model was developed to analyze the association between CC-IMT and clinical and biological factors. The overall validity of the model was measured using area under the receiver–operating characteristic (AUROC) curve with 95% confidence interval (CI). Two-sided P < .05 was considered significant for all tests.
Results
Among the 249 obese patients included in the study, 40 (16.1%) had type 2 diabetes mellitus, 64 (25.7%) had prediabetes, and the rest had normal glucose tolerance. Mean age in the study group was 37.9 ± 9.8 years (no gender difference) and mean BMI was 45.6 ± 8.3 kg/m2 (49.0 ± 8.3 kg/m2 in men and 43.9 ± 8.1 kg/m2 in women, P < .001). The characteristics of the study participants, according to their metabolic class (normal glucose tolerance, prediabetes, or overt diabetes), are shown in Table 1.
Characteristics of Study Participants, According to their Metabolic Status.a
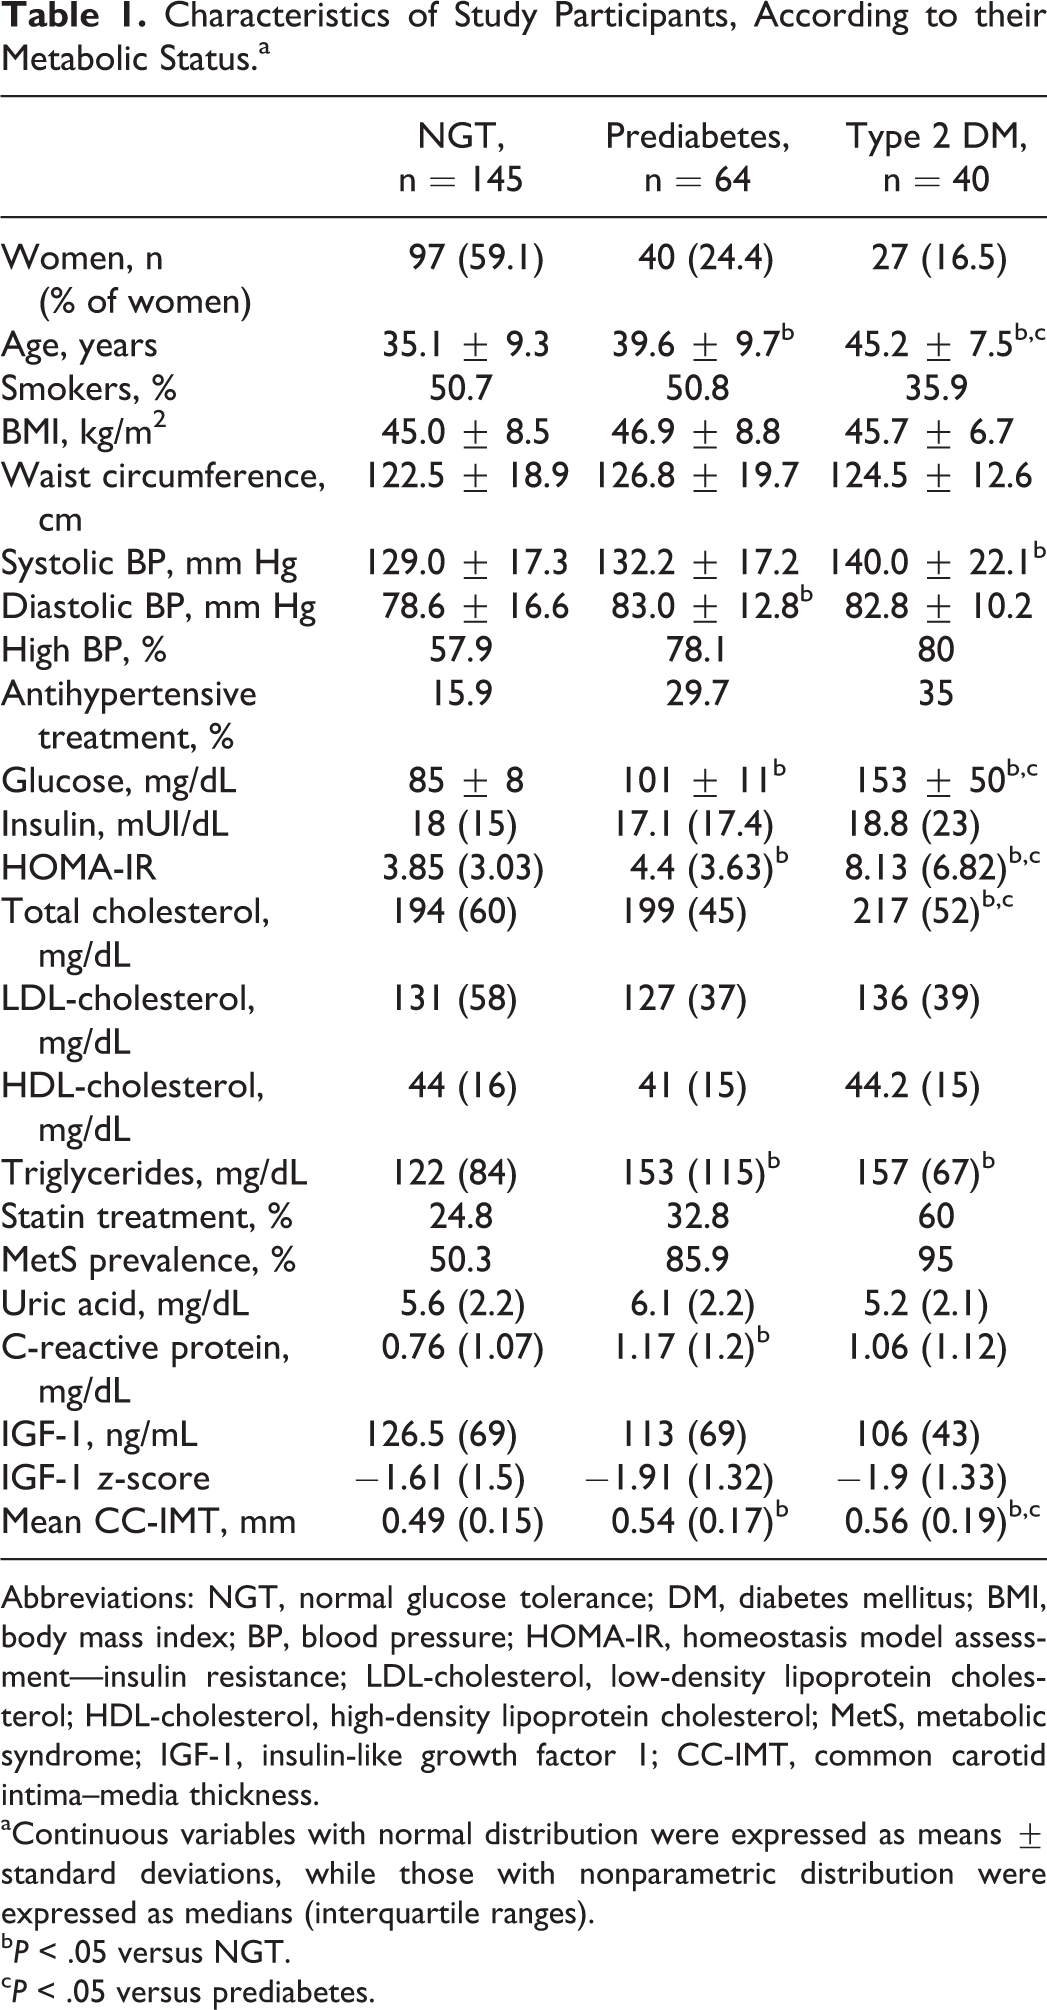
Abbreviations: NGT, normal glucose tolerance; DM, diabetes mellitus; BMI, body mass index; BP, blood pressure; HOMA-IR, homeostasis model assessment—insulin resistance; LDL-cholesterol, low-density lipoprotein cholesterol; HDL-cholesterol, high-density lipoprotein cholesterol; MetS, metabolic syndrome; IGF-1, insulin-like growth factor 1; CC-IMT, common carotid intima–media thickness.
aContinuous variables with normal distribution were expressed as means ± standard deviations, while those with nonparametric distribution were expressed as medians (interquartile ranges).
b P < .05 versus NGT.
c P < .05 versus prediabetes.
There was no difference regarding BMI or other anthropometric measurements between the 3 categories, but, as expected, patients with metabolic disturbances were older, more insulin resistant, and in a higher proportion hypertensive (newly diagnosed or already treated), in need for lipid medication, or affected by metabolic syndrome. Mean CC-IMT increased gradually but significantly together with the alteration in glucose metabolism status (Table 1).
Clinical and Biological Parameters Associated With CC-IMT
As expected, mean CC-IMT was significantly higher in men than in women: 0.59 (0.2) versus 0.5 (0.15) mm, P < .001. There was also a very strong correlation between mean CC-IMT and age (r = .491, P < .001 in men and r = .694, P < .001 in women). Therefore, all analyses including CC-IMT were adjusted for gender and age.
In univariate analysis, after age and gender adjustment, mean CC-IMT significantly correlated with BMI (r = .149, P < .05) systolic BP (r = .176, P < .01), basal insulin (r = .222, P < .01), HOMA-IR (r = .252, P < .01), uric acid (r = .145, P < .05), and IGF-1 z-score (r = .124, P < .05). There was no relationship with total or LDL-C, but CC-IMT was significantly higher in patients who were already on lipid-lowering treatment: 0.55 (0.14) versus 0.50 (0.18) mm, P < .001. The CC-IMT was also increased in patients with metabolic syndrome: 0.54 (0.17) versus 0.47 (0.15), P < .001. To assess which of the variables significantly associated with mean CC-IMT in preliminary analysis are in fact independent contributors to its variability, we performed multiple regression linear analysis, stepwise method. Factors independently related to mean CC-IMT were age, gender, HOMA-IR, BMI, IGF-1 z-score, and lipid-lowering treatment, together explaining almost 50% of its variability (Table 2). In this model, we found no significant association between mean CC-IMT and systolic BP, antihypertensive treatment, uric acid, metabolic syndrome presence, or metabolic class. Subsequent correlation analysis proved that, after controlling for each of the significant factors, it was HOMA-IR that mediated the relationship between CC-IMT and systolic BP or uric acid.
Stepwise Multiple Regression Analysis of Mean CC-IMT Determinants.
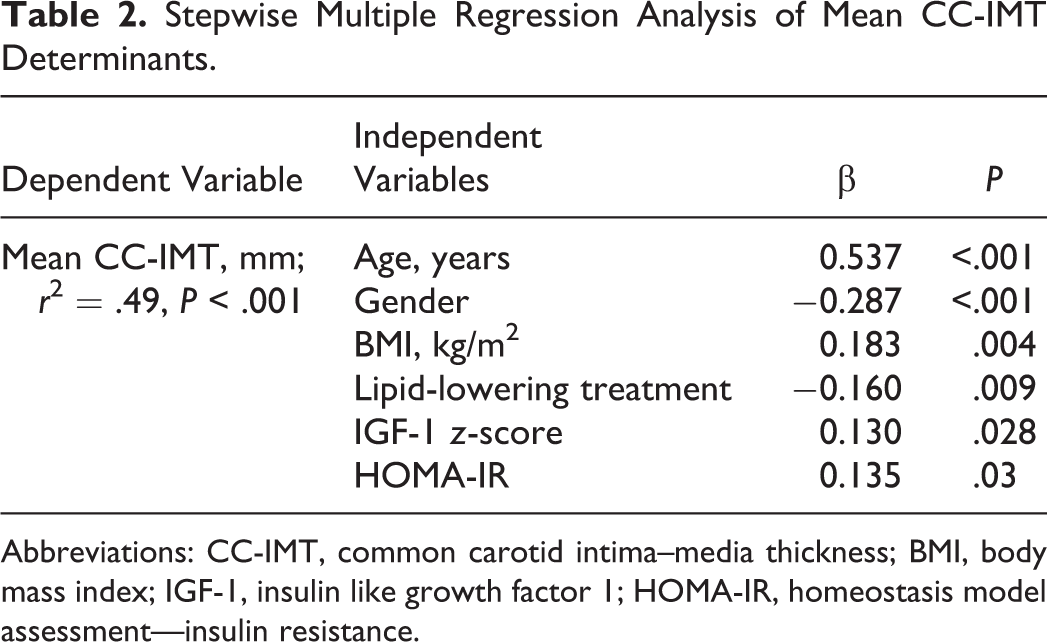
Abbreviations: CC-IMT, common carotid intima–media thickness; BMI, body mass index; IGF-1, insulin like growth factor 1; HOMA-IR, homeostasis model assessment—insulin resistance.
Determinants of Abnormal CC-IMT
In our group of 249 young- and middle-aged obese individuals, we identified 62 (24.9%) individuals with abnormal CC-IMT values (mean common carotid IMT ≥75th percentile for age and gender, in conformity with The Consensus Statement from the American Society of Echocardiography Carotid Intima–Media Thickness Task Force 4 ; or presence of carotid plaque). Prevalence of abnormal CC-IMT status was higher in men than in women (42.4% vs 15.9%, P < .001). Patients with abnormal CC-IMT were older, with increased adiposity, higher BP, and increased prevalence of hypertension and dyslipidemia (Table 3). They were also more insulin resistant and had significantly higher IGF-1 z-scores.
Determinants of Common Carotid Artery Thickness.a
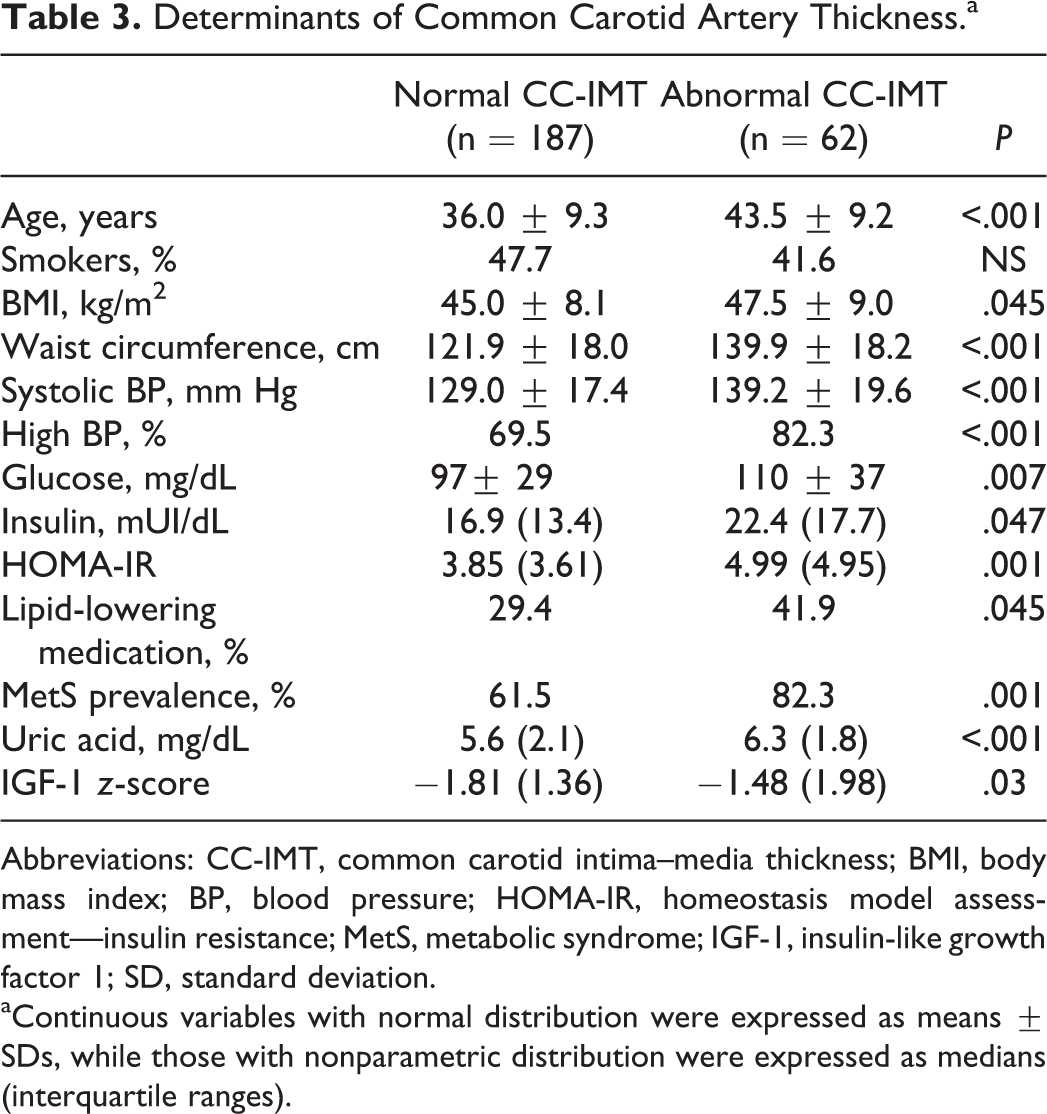
Abbreviations: CC-IMT, common carotid intima–media thickness; BMI, body mass index; BP, blood pressure; HOMA-IR, homeostasis model assessment—insulin resistance; MetS, metabolic syndrome; IGF-1, insulin-like growth factor 1; SD, standard deviation.
aContinuous variables with normal distribution were expressed as means ± SDs, while those with nonparametric distribution were expressed as medians (interquartile ranges).
Multiple logistic regression analysis confirmed that age (β = 1.11, P = .001), gender (β = 3.19, P = .001), HOMA-IR (β = 1.221, P = .005), and IGF-1 z-score (β = 1.734, P = .009) remained significantly associated with abnormal CC-IMT, in a model that also included adiposity (BMI and WC, alternatively), systolic BP, lipid-lowering medication, uric acid, and presence of MetS. The ability of each of these individual parameters in differentiating between normal and inadequate CC-IMT was quite poor, with best AUROC values for age (0.719) followed by HOMA-IR (0.625); nevertheless, AUROC for the entire model had a good value of 0.841 (CI: 0.776-0.907; P < .001), Figure 1.
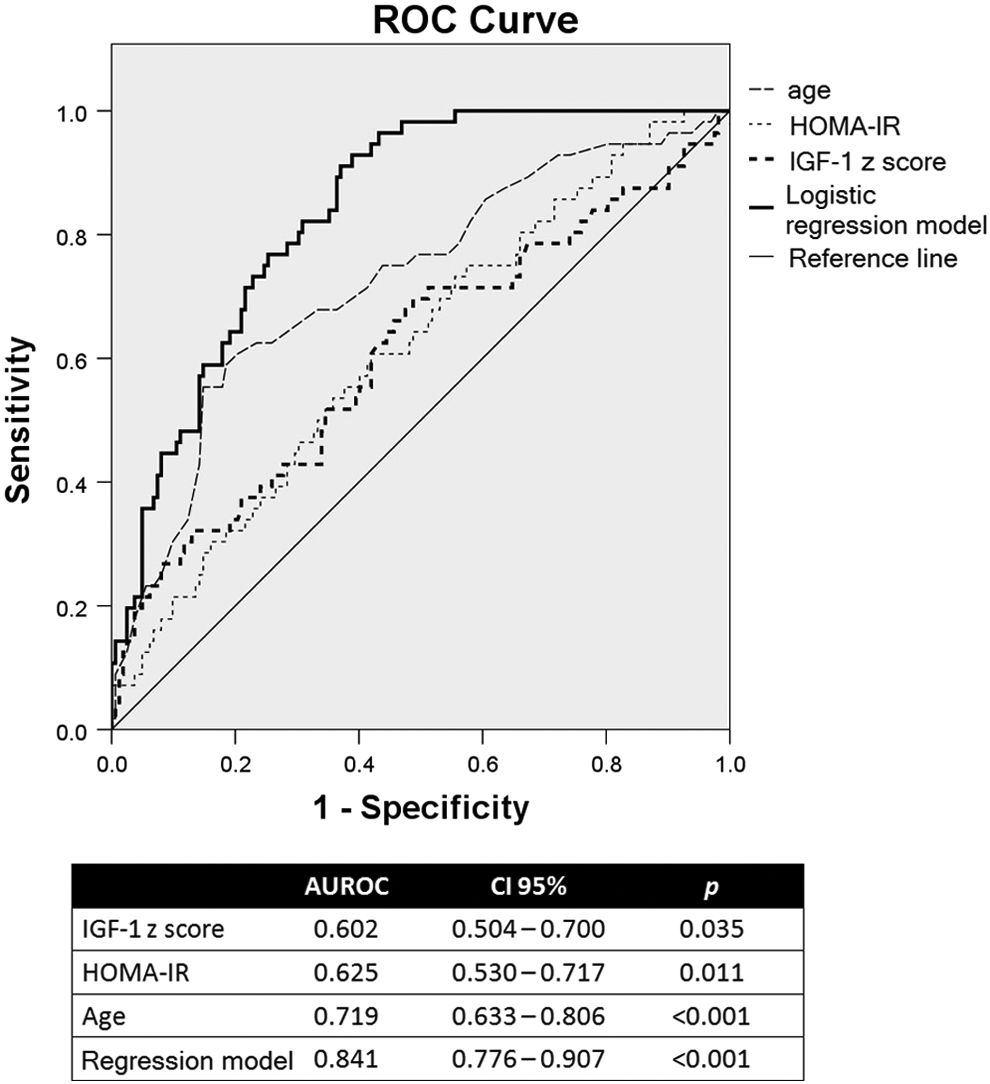
Predictive values of age, homeostasis model assessment—insulin resistance (HOMA-IR), insulin-like growth factor 1 (IGF-1) z-scores, and the logistic regression model for distinguishing between normal and abnormal intima media thickness (IMT).
Discussion
This study showed that serum IGF-1 concentrations and insulin resistance (estimated by HOMA-IR) are both positively correlated with CC-IMT and, together with age and gender, are independently associated with abnormal CC-IMT, in young- and middle-aged severely obese patients.
The CC-IMT is a well-known and validated marker of subclinical atherosclerosis and a predictor of cardiovascular risk. Obesity has been associated with increased CC-IMT from the earliest stages. 21 In the Cardiovascular Risk in Young Finns study, youth overweight predicted increased adult CC-IMT, 6 while in the Bogalusa Heart Study, asymptomatic young participants overweight or obese with metabolic syndrome were reported to have increased IMT values. 22 In our study, mean IMT correlated with BMI, after adjustment for age and gender but, quite surprisingly, not with WC, waist–hip ratio, or waist–height ratio, surrogate parameters of visceral adiposity (data not shown). A number of studies have reported that measures of abdominal obesity (such as WC) are better than the general obesity indicators (ie, BMI) in predicting subclinical atherosclerosis evaluated by CC-IMT. 23,24 The discrepancies might come from the particularities of our patients, mostly young- or middle-aged women with severe obesity. There are data suggesting that, in severely obese women, WC might not be the best parameter to assess visceral obesity or the prevalence of metabolic abnormalities. 25 It should be noted that, in the logistic model of the independent determinants of abnormal CC-IMT values, BMI lost its independent association with CC-IMT.
Insulin resistance is a key feature of obesity and is associated with multiple cardiovascular risk factors (visceral adiposity, dyslipidemia, hypertension, and chronic inflammation). 26 Molecular studies have shown that insulin resistance has a key role in every stage of atherosclerosis from the initiation and progression of early atherosclerosis to the formation of clinically significant plaques. 27 Hyperinsulinemia has direct proatherogenic effects, as it was shown to promote the secretion of endothelin 1, a potent vasoconstrictor, the expression of vascular cell adhesion molecule 1, and monocytes adhesion to cultured endothelial cells. 28 However, the clinical importance of insulin resistance to the development of atherosclerosis remains unclear. In a clinical study including over 900 participants followed up to 15 years, Bonora et al showed that HOMA-IR was associated with subsequent symptomatic CVD in the general population independent of all classic and several nontraditional risk factors, suggesting that insulin resistance may be an important target to reduce cardiovascular risk. 29 On the other hand, a cross-sectional study reported that the relationship between insulin resistance and subclinical atherosclerosis is mainly due to increasing abdominal adiposity, 30 while others have also shown that the association between HOMA-IR and subclinical atherosclerosis was not independent of the risk factors that comprise metabolic syndrome. 31
In our study, HOMA-IR independently correlated with CC-IMT values and had a significant association with abnormal arterial wall thickness, and this relationship was maintained after controlling for the traditional cardiovascular risk factors (BMI, BP, lipids, and smoking). Furthermore, our research showed that insulin might modulate the effect of high BP and even high BMI on the arterial thickness. A different conclusion was drawn by Viscogliosi et al who suggested that hypertension, low HDL-C, and central obesity are independently associated with increased carotid IMT in nondiabetic elderly participants, and these associations are not affected by insulin resistance. 32 These discrepancies might come from the different characteristics of study groups, especially age (elderly patients vs young patients) and BMI (our study was limited to morbidly obese patients). In a similar trial, Megias-Rangil et al observed that in morbidly obese patients, dysglycemia is more closely associated with subclinical atherosclerosis than hypertension or dyslipidemia. 33 In the same line, recent data reported by Lupattelli et al 34 in a small group of morbidly obese participants with a similar age pattern as our group show that HOMA-IR is better than BMI for identifying early vascular impairment in patients with morbid obesity. It should be noted that most (95.6%) of our patients had IMT values less than 1 mm, which is the classic cut-point for established atherosclerosis, and only 8.4% had carotid plaques. In the CAtanzaro MEtabolic RIsk factors Study (CATAMERIS) study including 366 caucasian nondiabetic participants, Andreozzi et al also showed an association between HOMA and increased (but within normal ranges) C-IMT, irrespective of the age. 7
One of the most important results of our study was the detection of an association between age-adjusted IGF-1 levels and CC-IMT. Obesity has been associated with low IGF-1 levels in epidemiological studies, 35 and this hormonal status is related to increased cardiovascular risk 36 and a deleterious metabolic profile. 37 However, when overall mortality was analyzed, there were conflicting results, with some authors suggesting a U-shaped relationship between IGF-1 levels and mortality. 38 Thickening of the intima–medial layer of the carotid artery has been associated both with decreased 13 and with increased 12 levels of circulating IGF-1 levels. Our study showed a positive correlation between IGF-1 z-scores and CC-IMT that was maintained after adjusting for age, gender, BMI, insulin resistance, and other cardiovascular risk factors. In accordance with our results, a study including 330 normal-weighted Japanese men described a similar positive correlation between IGF-1 and IMT 39 ; the association between high IGF-1 and IGF-1/IGF-binding protein 3 (IGF-BP3) ratio and increased carotid artery thickness was also confirmed by epidemiological data from the Study of Health in Pomerania, a population-based research that included 2286 participants aged 45 years or older. 40
The IGF-1 has a significant and complex interaction with endothelial physiology. Human endothelial cells express IGF-1 receptors, and IGF-1 has been shown to be a potent mitogen and antiapoptotic factor for vascular smooth muscle cells. 8 Targeted expression of IGF-1 to smooth muscle by an α-actin promoter in transgenic mice resulted in smooth muscle hyperplasia in arteries, veins, and other smooth muscle-rich tissues. 41 This nicely explains the relationship between IGF-1 and carotid thickness observed in our study. However, this effect of IGF-1 is mainly seen in the early stages of atherosclerotic plaque formation characterized by hypertrophy/hyperplasia of vascular smooth muscle; in more advanced disease, IGF-1 has an important contribution to plaque stability. 42 The dual role of IGF-1 in atherosclerosis is translated in clinical studies, where both IGF-1 deficiency and IGF-1 excess are associated with increased morbidity and mortality 43,44 and might explain the differences between our research and other articles. Our group consisted of young- and middle-aged obese patients, mostly exhibiting values of CC-IMT in the physiological range, without established atherosclerosis, although the vast majority of the published research on this participant included older patients. Other possible explanations might be the difference in IGF-BP-3 levels, as low IGF-BP-3 level has been associated with a poor cardiovascular prognosis 45 or, as suggested by Ameri et al, 13 the interaction with vitamin D levels. Of course, we cannot exclude the possibility of the difference between the studies coming from the use of different analytical platforms as demonstrated recently by Muller et al in an elegant reanalysis of the published data from the Study of Health in Pomerania. 46 After reinvestigating the association between IGF-1 and IMT using a new assay for IGF-1 measurement, they no longer found a significant relationship between the 2 parameters. We agree with the authors’ suggestion that a meta-analysis is necessary in order to validate the results of single-center studies.
We acknowledge that our study has some limitations. We only measured total IGF-1 and not the free fraction, which is the form that interacts with IGF-1 receptor and is responsible for the peripheral effect. 47 Measurements of carotid wall only included common carotid and no other sites, mainly because CC-IMT determination is more standardized. However, there are data suggesting that in young obese adults, arterial thickness may develop earlier at sites of turbulence (ie, the internal carotid and the bulb) with the common carotid being affected later. 48 Finally, our data refer to a group of severely obese young patients, so one cannot generalize these findings to normal weight or older patients. On the other hand, this might also be one of the strength of this study, as it is one of the very few studies that analyzes the relationship between insulin resistance, IGF-1, and carotid thickness early in the evolution of subclinical atherosclerosis.
In conclusion, we showed that increased CC-IMT is associated with HOMA-IR, an estimate of insulin resistance, and serum IGF-1 levels, independent of age, gender, or major cardiovascular risk factors, in young- and middle-aged obese patients. This relationship occurs early in the progression of the atherosclerotic process, when carotid IMT is still in the normal range. Further prospective studies are necessary to validate our results and establish the dynamics of these associations in more advanced disease.
Footnotes
Author Contributions
AS led the design development, coordinated the data collection and interpretation, performed the statistical analysis, drafted the article, and participated in the final approval of the version to be published. HN performed carotid ultrasounds and participated in the final approval of the version to be published. SM and CB developed the design, helped in data collection, and participated in the final approval of the version to be published. CC referred some of the patients, drafted the article, and participated in the final approval of the version to be published. SF coordinated laboratory analysis, drafted the article, and participated in the final approval of the version to be published. CP coordinated ultrasound data acquisition, revised the article, and participated in the final approval of the version to be published. SF supervised data collection and interpretation, revised the article, and participated in the final revision and approval of the version to be published.
Declaration of Conflicting Interests
The author(s) declared no potential conflicts of interest with respect to the research, authorship, and/or publication of this article.
Funding
The author(s) disclosed receipt of the following financial support for the research, authorship, and/or publication of this article: This article is partly supported by the Sectorial Operational Program Human Resources Development (SOPHRD), financed by the European Social Fund and the Romanian Government under the contract number POSDRU 141531.