
Abstract
SYNTAX score II (SS II) uses 2 anatomical and 6 clinical variables for the prediction of mortality after coronary artery bypass graft and percutaneous coronary intervention. The aim of this study was to investigate the relationship between glycated hemoglobin (HbA1c), fasting blood glucose (FBG), postprandial glucose (PPG), and SYNTAX Score (SS) and SS II in patients with type 2 diabetes mellitus and coronary artery disease (CAD). We enrolled 215 consecutive diabetic patients with stable angina pectoris who underwent coronary angiography. The SS II was calculated using a nomogram that was based on the findings of a previous study. There was a moderate correlation between HbA1c and SS (r = .396, P < .001), but there was a good correlation between HbA1c and SS II (r = .535, P < .001). There was also a weak correlation between FBG (r = .270, P = .001), PPG (r = .177, P = .027), and SS, but there was a weak–moderate correlation between FBG (r = .341, P < .001), PPG (r = .256, P = .001), and SS II. A better correlation has been detected between HbA1c and SS II compared to the correlation between HbA1c and SS.
Introduction
Previously, glycated hemoglobin (HbA1c) has been suggested for the determination of glucose control in patients with diabetes mellitus (DM), and recently the American Diabetes Association has recommended the use of HbA1c in the diagnosis of DM. 1 Also, it has been reported that an elevated HbA1c level is a risk factor for macrovascular diseases 2 and indicates increased mortality risk in patients with coronary artery disease (CAD). 3 There is also a significant correlation between HbA1c levels and the extent of CAD. 4
The SYNTAX score (SS) has been developed to quantify the complexity of CAD, aiming to grade the coronary anatomy according to the number of lesions and their functional impact, location, and complexity. 5,6 Higher SS indicates a more complex condition. The SS II has been recently developed by Farooq et al 7 for the prediction of mortality after coronary artery bypass graft surgery (CABG) and percutaneous coronary intervention (PCI) in patients with complex CAD. The SS II uses 2 anatomical variables and 6 clinical variables not including DM, which is not an independent predictor of mortality and did not have an interaction effect with CABG and PCI for long-term mortality. 8
According to our knowledge, no study has evaluated the association between fasting blood glucose (FBG), postprandial glucose (PPG), HbA1c levels, and CAD complexity using both SS and SS II in patients with DM. Thus, we investigated the relationship between these parameters and SS and SS II in patients with type 2 DM and CAD.
Materials and Methods
Patient Selection
We enrolled 215 consecutive type 2 DM patients with stable angina pectoris (SAP) who underwent coronary angiography for suspected CAD from January 2013 to September 2014. Patients with acute coronary syndrome (ACS; n = 11), acute or chronic inflammatory and infectious diseases (n = 6), or using steroids (n = 3) or with a history of previous myocardial infarction (n = 17), CABG (n = 9), or PCI (n = 13) were excluded from the study. Ultimately, 156 patients constituted the study population. All participants provided written informed consent for participation in the study, which was approved by the institutional ethics committee.
Blood Sampling and Definitions
Diabetes mellitus was defined as having at least 2 FPG >126 mg/dL, HbA1c ≥ 6.5%, or using antidiabetic drugs. Blood samples were obtained after an overnight fast (12 hours) for FBG. The HbA1c values were measured at admission using high-performance liquid chromatographic analysis by a Bio-Rad Variant II analyzer (Bio-Rad Laboratories, Hercules, California) with a reference range of 4.1% to 6.5%.
Hypertension was defined based on known elevation in blood pressure over 140/90 mm Hg on at least 2 separate occasions according to the medical chart or the use of antihypertensive medications. Dyslipidemia was defined according to medical history or the use of lipid-lowering medications or low-density lipoprotein cholesterol (LDL-C) concentrations ≥160 mg/dL in the fasting state. Smoking status was ascertained by the medical history. Active smoker was defined as a patient who smoked in the past month. Blood sample for LDL-C, high-density lipoprotein cholesterol (HDL-C), and triglycerides (TGs) was collected in a fasting state 1 day before coronary angiography.
Calculation of SS and SS II
SYNTAX score is an angiographic tool used in grading the complexity of CAD. Each coronary lesion with a diameter stenosis >50%, in vessels >1.5 mm, must be scored. The online version (2.03) was used to calculate the SS (www.syntaxscore.com). The SS was divided into 2 groups: low SS (≤22) and intermediate–high SS (>22). All angiographic variables of SS were computed by 2 experienced cardiologists who were blinded to procedural data and clinical outcome. These cardiologists had previously calculated SS in more than 100 patients before participating in our study. In case of disagreement, the final decision was made by consensus.
SYNTAX score II was calculated using a nomogram, consisting of 2 anatomical variables (anatomical SS and unprotected left main coronary artery disease) and 6 clinical variables (age, creatinine clearance, left ventricular ejection fraction, sex, chronic obstructive pulmonary disease, and peripheral arterial disease) which were based on the findings of a previous study. 7
Statistical Analysis
Continuous variables are expressed as mean ± standard deviation, whereas categorical variables are expressed as percentage. Categorical data were compared using the chi-square or Fisher exact test. The Kolmogorov-Smirnov test was used to test the normality of distribution of continuous variables. Correlation between different variables was assessed by Pearson correlation test for continuous variables and Spearman test for noncontinuous variables. Continuous variables between the 2 groups were compared with the Student t test or Mann-Whitney U test. Multivariate logistic regression analysis was performed to identify the independent predictors of SS II using variables showing marginal association with it on univariate testing. Receiver–operating characteristic (ROC) analysis was used to detect the cutoff value of HbA1c in prediction of median SS and SS II. A 2-sided P value < .05 was considered significant in all the analyses. Data were analyzed using SPSS 15.0 version (SPSS Inc, Chicago, Illinois).
Results
The study population consisted of 156 diabetic patients with SAP (mean age: 61 ± 9 years; 54.5% were males) who underwent coronary angiography for suspected CAD. The baseline clinical and laboratory characteristics of the patients are shown in Table 1. Although there was a moderate correlation between HbA1c and SS (r = .396, P < .001), a good correlation was detected between HbA1c and SS II (r = .535, P < .001; Figure 1A and B). There was also a weak correlation between FBG (r = .270, P = .001), PPG (r = .177, P = .027), and SS, however, there was a weak–moderate correlation between FBG (r = .341, P < .001), PPG (r = .256, P = .001), and SS II.
Baseline Clinical and Laboratory Characteristics of the Patients.
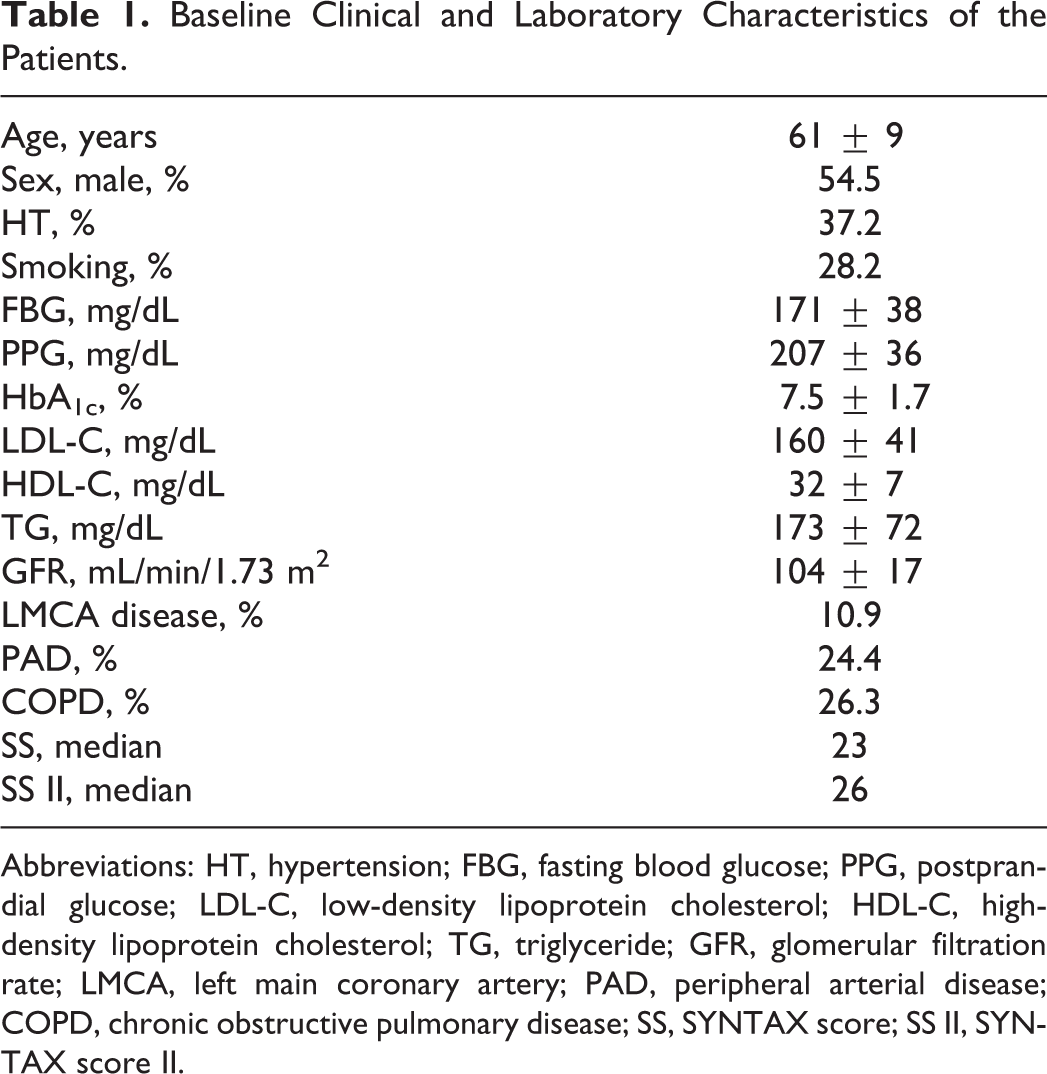
Abbreviations: HT, hypertension; FBG, fasting blood glucose; PPG, postprandial glucose; LDL-C, low-density lipoprotein cholesterol; HDL-C, high-density lipoprotein cholesterol; TG, triglyceride; GFR, glomerular filtration rate; LMCA, left main coronary artery; PAD, peripheral arterial disease; COPD, chronic obstructive pulmonary disease; SS, SYNTAX score; SS II, SYNTAX score II.
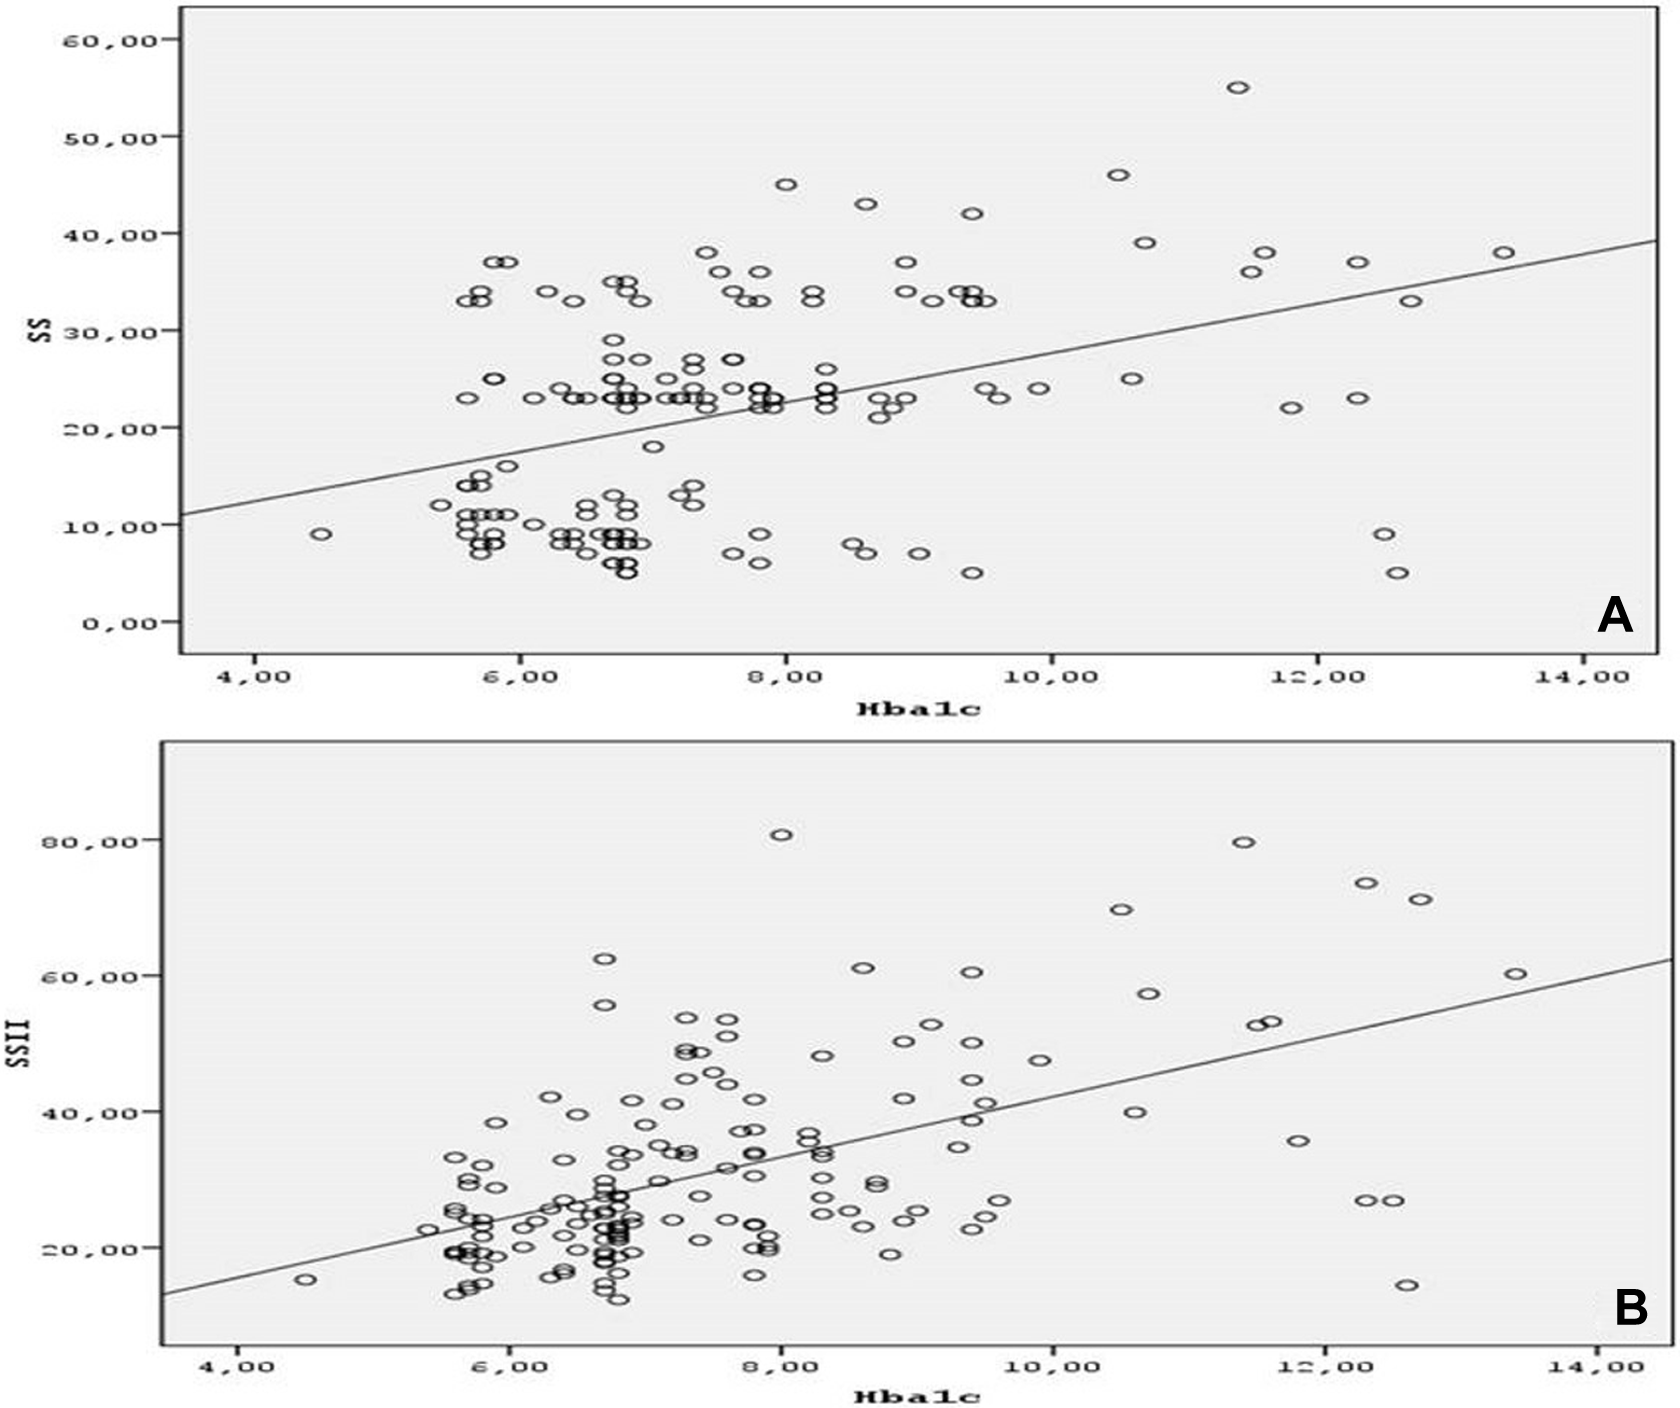
A and B, Correlation between HbA1c, SS, and SS II. HbA1c indicates glycated hemoglobin; SS, SYNTAX Score; SS II, SYNTAX Score II.
The SS of the patients ranged from 5 to 54 (median 23), and calculated SS II ranged from 12 to 80 (median 26). The histogram of the SS II in the study group is shown in Figure 2. Sixty-seven patients had SS ≤ 22 and 89 had SS > 22. In the patients with low SS (≤22), the mean FBG, PPG, and HbA1c levels were 161 ± 35, 198 ± 30, and 6.9 ± 1.5, respectively. In the patients with intermediate–high SS (>22), the mean FBG, PPG, and HbA1c levels were 179 ± 39, 214 ± 38, and 7.9 ± 1.7, respectively. A statistically significant difference was detected in FBG (161 ± 35 vs 179 ± 39, P = .003), PPG (198 ± 30 vs 214 ± 38, P = .006), and HbA1c (6.9±1.5 vs 7.9±1.7, P < .001) levels between low (≤22) and intermediate–high SS (>22) groups. The mean glomerular filtration rate (GFR) levels in all patients were 104 ± 17, and there was a statistically significant difference between low (≤22) and intermediate–high SS (>22) groups (109 ± 14 vs 100 ± 19, P = .002, respectively; Table 2). A moderate negative correlation was detected between GFR and SS (r = −.370, P < .001), however, there was a good negative correlation between GFR and SS II (r = −.584, P < .001) (Figure 3A and B). Forty-four (28.2%) patients had history of smoking, which did not differ between those with low (≤22) and intermediate–high SS (>22; 25.4% vs 30.3%, P = .495, respectively). There was an increasing trend in LDL-C and TG (153 ± 34 vs 166 ± 46 mg/dL, P = .228, and 160 ± 64 vs 183 ± 76 mg/dL, P = .029, respectively) and decreasing trend in HDL-C levels (34 ± 7 vs 31 ± 7 mg/dL, P = .004, respectively) between low (≤22) and intermediate–high SS (>22) groups.
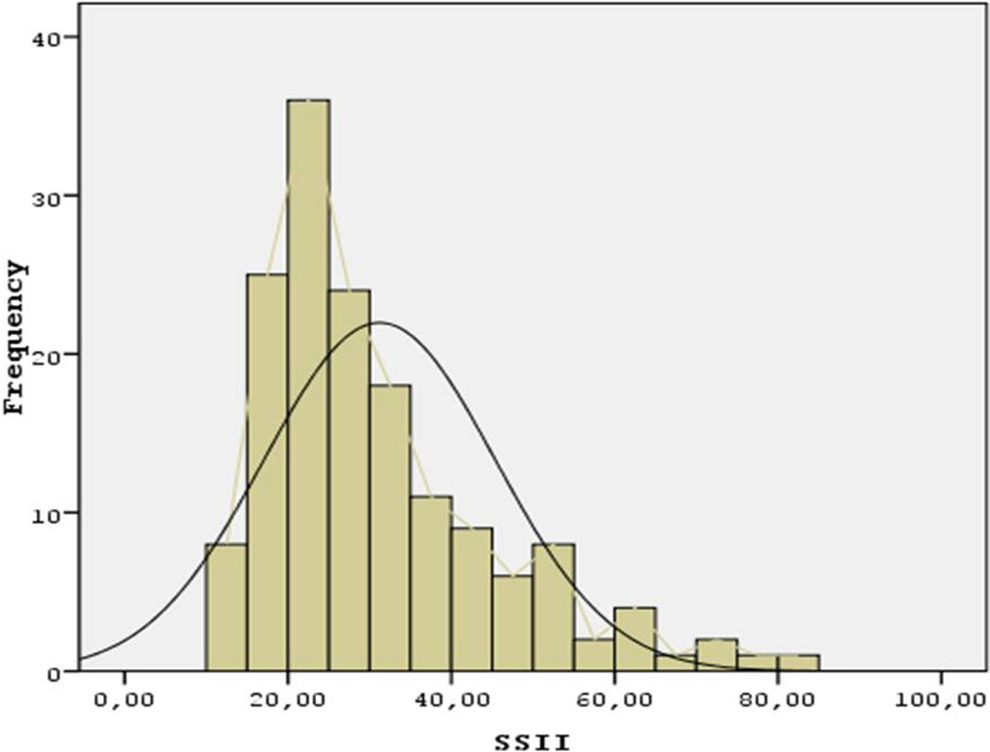
The histogram of the SS II in the study group. SS II indicates SYNTAX Score II.
The Baseline Clinical and Laboratory Characteristics of the Patients According to SS.
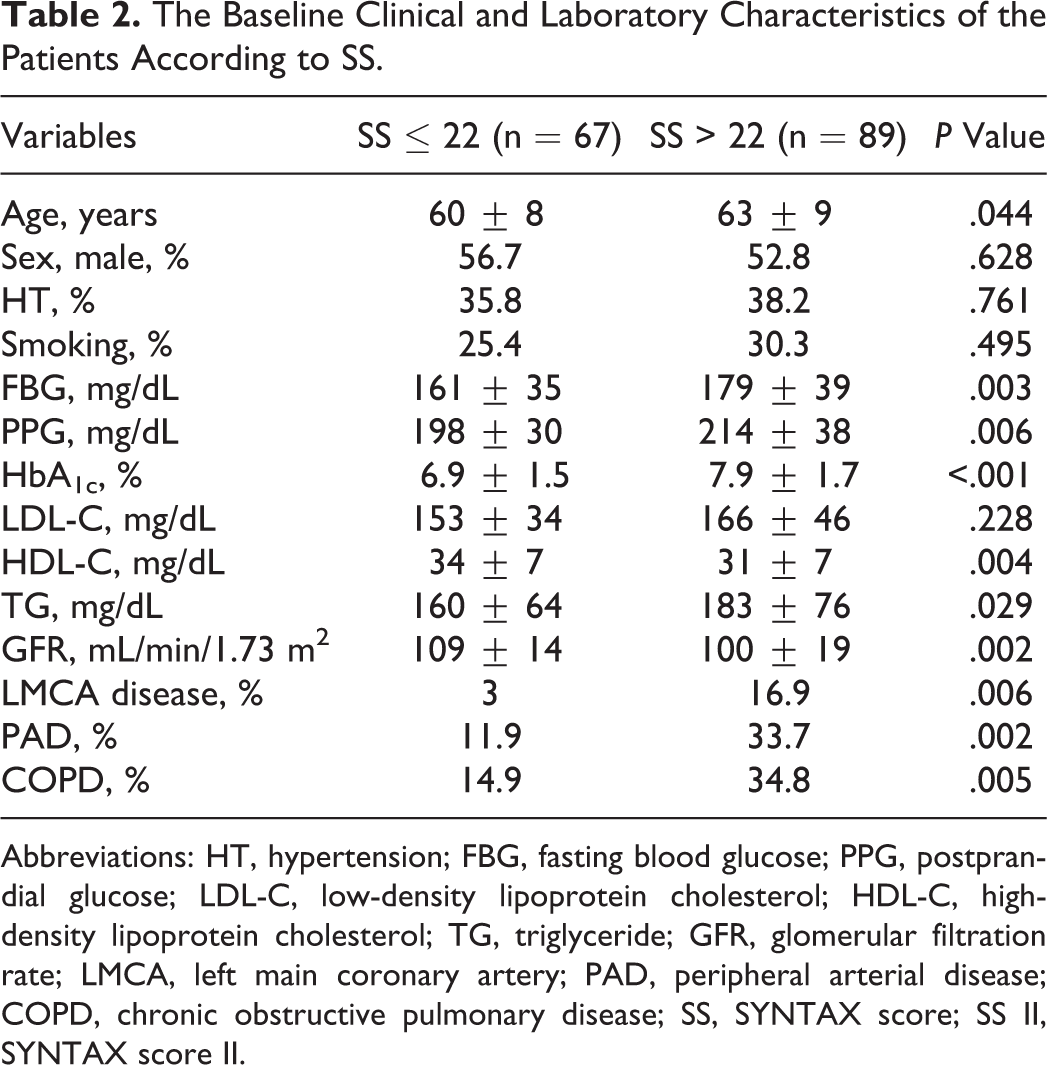
Abbreviations: HT, hypertension; FBG, fasting blood glucose; PPG, postprandial glucose; LDL-C, low-density lipoprotein cholesterol; HDL-C, high-density lipoprotein cholesterol; TG, triglyceride; GFR, glomerular filtration rate; LMCA, left main coronary artery; PAD, peripheral arterial disease; COPD, chronic obstructive pulmonary disease; SS, SYNTAX score; SS II, SYNTAX score II.
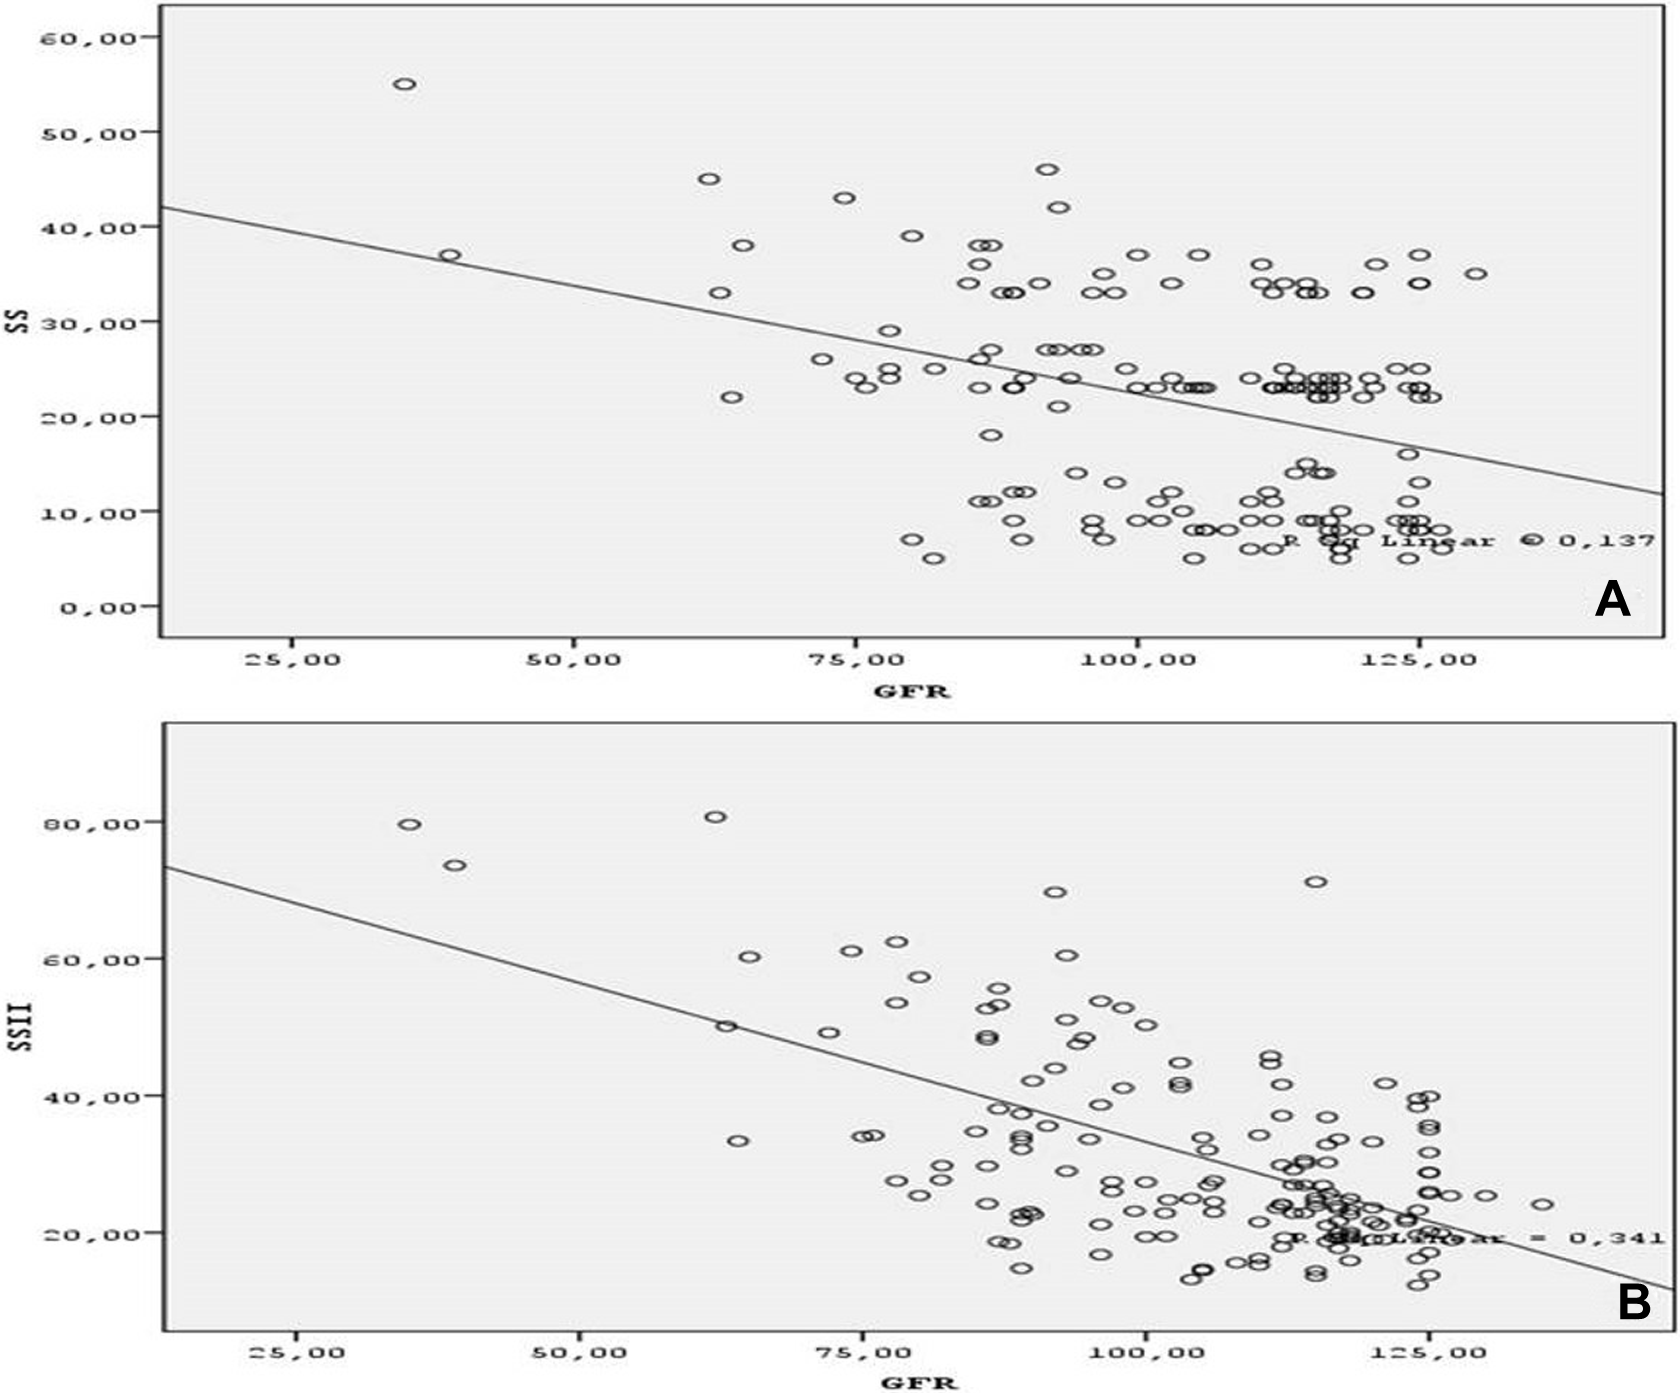
A and B, Correlation graphics between GFR, SS, and SS II. GFR indicates glomerular filtration rate; SS, SYNTAX Score; SS II, SYNTAX Score II.
The baseline clinical and laboratory characteristics of the patients according to median SS II are shown in Table 3. Definite classification of SS II is not available; therefore, ROC curve analysis was performed on the basis of median values of both SS and SS II. The ROC curve analysis was performed to detect the best cutoff value of HbA1c in the prediction of median SS (>23). An HbA1c value >6.95 yielded an AUC value of 0.690 (95% CI 0.605-0.776; P = .044). Furthermore, The HbA1c value >6.95 demonstrated a sensitivity of 68% and a specificity of 64% for the prediction of high median value of SS (>23). Also, the ROC curve analysis was performed to detect the best cutoff value of HbA1c in the prediction of SS II >26 (the median value of the study group). An HbA1c value >6.85 yielded an AUC value of 0.762 (95% CI 0.686-0.837; P < .001). Furthermore, an HbA1c value >6.85 demonstrated a sensitivity of 75% and a specificity of 72% for the prediction of SS II > 26 (Figure 4A and B).
The Baseline Clinical and Laboratory Characteristics of the Patients According to Median SS II.
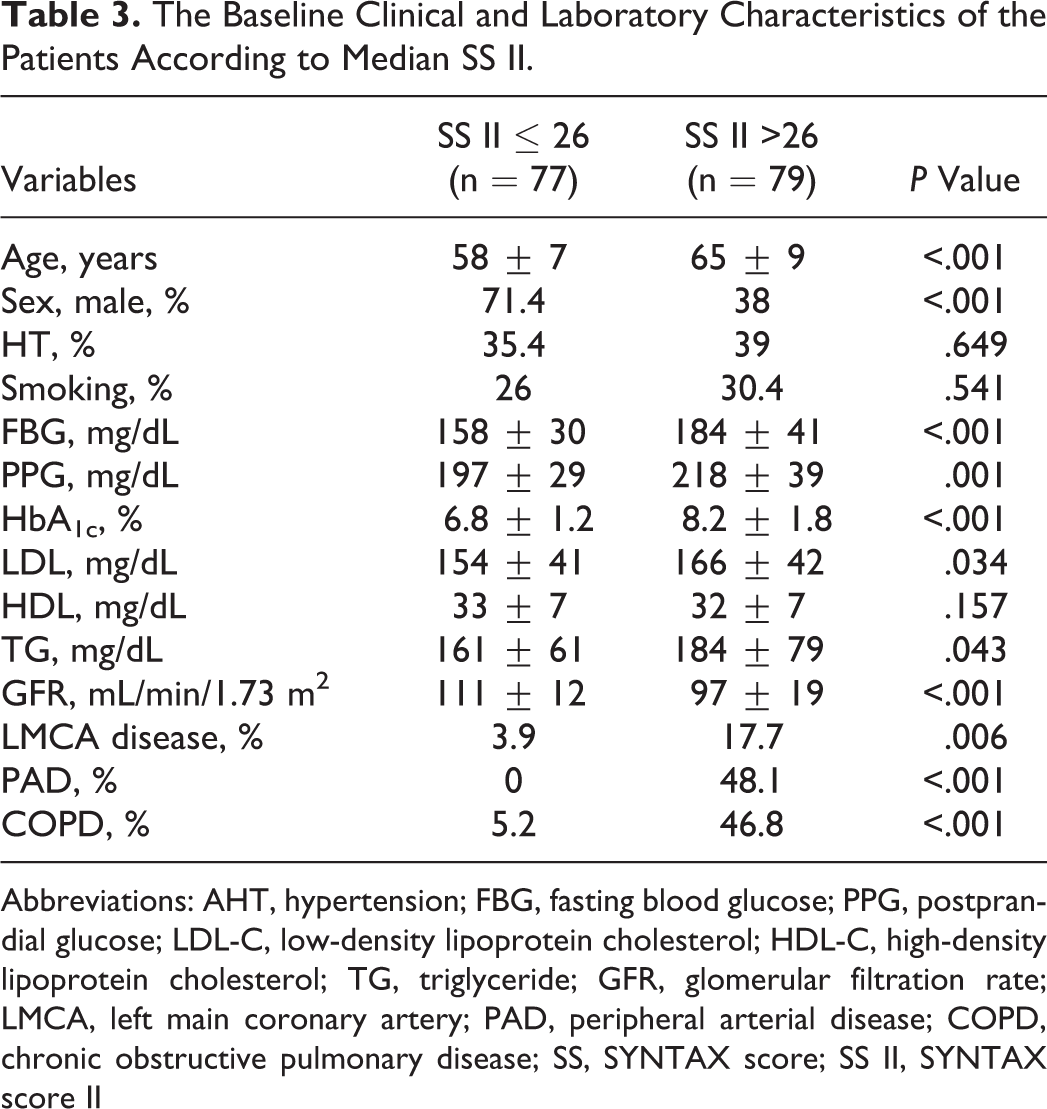
Abbreviations: AHT, hypertension; FBG, fasting blood glucose; PPG, postprandial glucose; LDL-C, low-density lipoprotein cholesterol; HDL-C, high-density lipoprotein cholesterol; TG, triglyceride; GFR, glomerular filtration rate; LMCA, left main coronary artery; PAD, peripheral arterial disease; COPD, chronic obstructive pulmonary disease; SS, SYNTAX score; SS II, SYNTAX score II
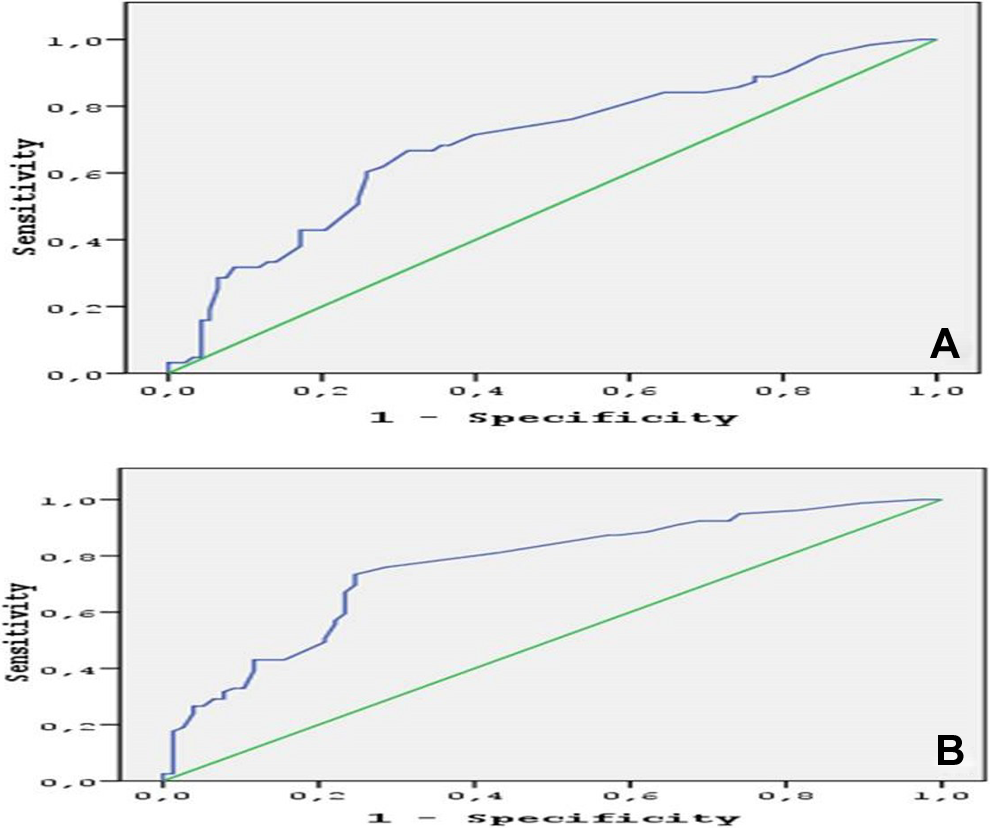
A and B, ROC graphics to detect the best cutoff value of HbA1c in the prediction of median SS (>23) and SS II (>26). ROC indicates receiver–operating characteristic; HbA1c, glycated hemoglobin; SS, SYNTAX Score; SS II, SYNTAX Score II.
Multivariate logistic regression test was used for determining the independent predictors of SS II >26. The variables that were found to have a significance in the univariate analysis (HbA1c, FBG, PPG, LDL, TG, age, and sex) were included in the multivariate model. Among those, HbA1c (OR: 1.683, 95% CI 1.228-2.307, P = .001), FBG (OR: 1.012, 95% CI 1.000-1.025, P = .042), PPG (OR: 1.015, 95% CI 1.003-1.028, P = .019), age (OR: 1.087, 95% CI 1.035-1.142, P = .001), and female sex (OR: 4.305, 95% CI 1.822-10.176, P = .001) were found to be the independent predictors of SS II >26 (Table 4).
Independent Predictors of SS II > 26 in Multivariate Logistic Regression Analysis.
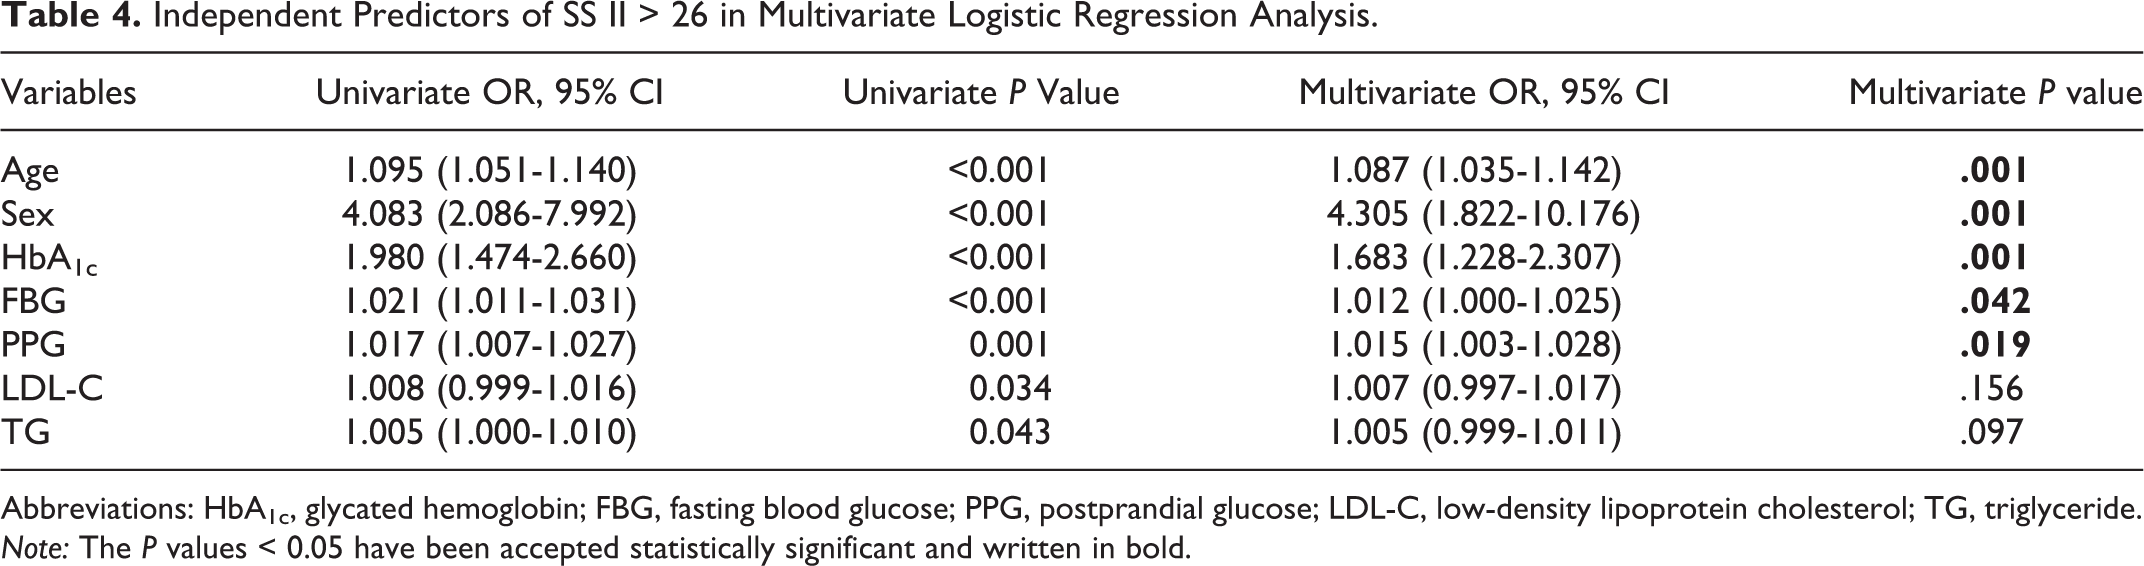
Abbreviations: HbA1c, glycated hemoglobin; FBG, fasting blood glucose; PPG, postprandial glucose; LDL-C, low-density lipoprotein cholesterol; TG, triglyceride. Note: The P values < 0.05 have been accepted statistically significant and written in bold.
Discussion
We found that higher HbA1c was significantly associated with elevated SS tertile and SS II in patients with DM and CAD. There was a better correlation between HbA1c and SS II compared to that between HbA1c and SS. However, a weak correlation was detected between FPG, PPG, and SS, and there was weak–moderate correlation between FPG, PPG, and SS II.
The HbA1c values reflect the last 3-month average endogenous exposure to glucose, including postprandial peaks in the blood glucose level. These features demonstrate the superiority of HbA1c over FBG in long-term macrovascular risk stratification. 2 Previous studies have suggested that elevated HbA1c values were an independent risk factor for CAD in patients with and without DM. 9 A recent study showed that HbA1c can determine individuals at increased risk of CAD, stroke, and death before the diagnosis of DM, suggesting that HbA1c is a beneficial marker of CV risk in non-diabetic patients. Also, this study reported that HbA1c levels exceeding 6.0% may be a clinically useful marker to identify individuals at risk for the development of CV disease. 2 Additionally, many studies demonstrated that atherosclerosis affects the coronary arteries diffusely in diabetic patients. 10 Ayhan et al reported that HbA1c values were correlated with the Gensini score in premature patients with CAD, irrespective of the presence of DM. But they studied patients younger than 40 years. 4 Consistent with the findings of this study, we also found that HbA1c values were correlated with the severity and complexity of coronary atherosclerosis and also with clinical features. The present study differs from the study by Ayhan et al, as our study included adult patients regardless of age with SAP and DM. Therefore, our results may be applied to a general population. In addition, we used SS and SS II instead of Gensini score for the assessment of CAD extensiveness.
SYNTAX score is an angiographic scoring system that was employed to quantify the complexity of CAD 5,11 and comprises several angiographic scoring systems such as the Leaman score, 12 the modified ACC/AHA (American College of Cardiology/American Heart Association) classification system, 13 the total occlusion classification system, 14 Dukes, 15 and ICPS classification scores for bifurcation lesions. 16 It assesses the morphology/location of CAD. The SS determines patients who are at highest risk of adverse events, regardless of clinical presentation. Higher scores estimate worse clinical prognosis. 17 On the other hand, the Gensini score identifies plaque burden and classify lesions into <25%, <50%, <75%, <90%, 99%, and 100% with respect to maximal lumen diameter stenosis. 18 The SS evaluates the number of lesions and the angiographic complexity of CAD including the presence of bifurcation disease, the type of bifurcation, tortuosity, and calcification. The SS II has been recently developed by applying a Cox proportional hazards model to the results of the SYNTAX trial, obtaining a combination of clinical and anatomical predictors. 7,19 Diabetes mellitus was not included in the SS II because it was not an independent predictor of mortality and did not have an interaction effect with CABG and PCI for long-term mortality. 8 The anatomical and clinical variables included in SS II are not present in the Gensini score. Thus, it is reasonable that SS and SS II would add further information to the analysis of the Gensini score in the assessment of CAD in patients with DM. So it is possible to suggest that elevated HbA1c is not only the marker of poor glucose control but also may be the marker of extensive and complex CAD in DM. Therefore, this situation should lead to more aggressive secondary preventive therapy, lifestyle modification, and antiplatelet therapy in this patient group.
This study has some limitations one of which was that we analyzed only a limited number of patients, which could reduce statistical power. Another limitation of this study was that evaluation was based on a single HbA1c, FBG, and PPG measurement.
The SS II has been recently defined by adding clinical parameters to anatomical SS and associated with higher mortality in patients with CAD undergoing CABG or PCI. 7 However, it has not been investigated yet whether there is an association between SS II and laboratory parameters such as HbA1c.
In conclusion, the present study is preliminary and provides further evidence that elevated HbA1c is associated with high SS tertile and SS II in patients with DM. Therefore, HbA1c may be superior to FBG and PPG in identification of patients who are at highest risk of CV events. A better correlation has been detected between HbA1c and SS II compared to SS. Therefore, relatively lower HbA1c values may accompany higher SS II values, necessitating strict glucose control in the presence of high SS II levels.
Footnotes
Authors’ Note
All authors provided (1) substantial contributions to conception and design, or acquisition of data, or analysis and interpretation of data; (2) drafting the article or revising it critically for important intellectual content; and (3) final approval of the version to be published.
Declaration of Conflicting Interests
The author(s) declared no potential conflicts of interest with respect to the research, authorship, and/or publication of this article.
Funding
The author(s) received no financial support for the research, authorship, and/or publication of this article.