
Abstract
We evaluated the association between automatically measured carotid total plaque area (TPA) and the estimated glomerular filtration rate (eGFR), a biomarker of chronic kidney disease (CKD). Automated average carotid intima–media thickness (cIMTave) and TPA measurements in carotid ultrasound (CUS) were performed using AtheroEdge (AtheroPoint). Pearson correlation coefficient (CC) was then computed between the TPA and eGFR for (1) males versus females, (2) diabetic versus nondiabetic patients, and (3) between the left and right carotid artery. Overall, 339 South Asian Indian patients with either type 2 diabetes mellitus (T2DM) or CKD, or hypertension (stage 1 or stage 2) were retrospectively analyzed by acquiring cIMTave and TPA measurements of their left and right common carotid arteries (CCA; total CUS: 678, mean age: 54.2 ± 9.8 years; 75.2% males; 93.5% with T2DM). The CC between TPA and eGFR for different scenarios were (1) for males and females −0.25 (P < .001) and −0.35 (P < .001), respectively; (2) for T2DM and non-T2DM −0.26 (P < .001) and −0.49 (P = .02), respectively, and (3) for left and right CCA −0.25 (P < .001) and −0.23 (P < .001), respectively. Automated TPA is an equally reliable biomarker compared with cIMTave for patients with CKD (with or without T2DM) with subclinical atherosclerosis.
Keywords
Introduction
Cardiovascular (CV) disease (CVD) and stroke are worldwide challenges for public health; they account for the annual death of 17.9 million people (31% of global mortality) worldwide. 1 A strong association between CVD/stroke events and renal disease has been reported. 2,3 The risk of CV mortality is 10 to 30 times higher in patients with the renal disease compared with the normal population. 4 Chronic kidney disease (CKD) is defined as a reduction in the estimated glomerular filtration rate (eGFR). 5 Lower values of eGFR are associated with higher risk CVD/stroke events. 2,3,5,6 Furthermore, patients with CKD with diabetes mellitus (DM) are more likely to die due to CVD/stroke before reaching end-stage renal disease (or kidney failure). 6,7 Thus, it is important to predict the risk of CVD/stroke in patients with CKD and DM. Furthermore, it is essential to evaluate primary preventive risk assessment biomarkers that are less expensive, efficient, and reliable to be adopted in routine clinical settings.
Carotid ultrasound image-based phenotypes (CUSIP) such as carotid intima–media thickness (cIMT) and carotid morphological total plaque area (also called the total plaque area [TPA]), are predictors of CVD/stroke events. 8,9 Both types of CUSIP provide the morphological variations in the atherosclerotic plaque, and thus, they can be used to assess the risk of CVD/stroke events. However, minimal efforts were made to link the morphological changes in automatically derived carotid atherosclerotic plaque burden (indicated by the TPA) with CKD (identified by the eGFR). On the other hand, several studies reported that the cIMT was associated with an elevated risk of CVD/stroke in patients with CKD. 7,10 –14 One common observation from all these studies is the inverse association between cIMT and eGFR. Thus, a reduction in eGFR is associated with the progression of cIMT, an indicator of future CVD/stroke events. Furthermore, all these studies follow either a manual or semiautomatic way of measuring cIMT within a 10-mm plaque-free region of carotid ultrasound (CUS) scans. Such manual measurements lead to intra- or interoperator variability. 15 Furthermore, it should be noted that atherosclerosis is a multifocal disease. Thus, measuring the cIMT within a 10-mm region of the carotid artery may not appropriately capture all the variations in atherosclerotic plaque. 16 This was the primary reason behind not recommending the use of cIMT for routine CVD risk assessment in recent guidelines published by the American College of Cardiology and American Heart Association. 17,18 To address this issue, recent studies have provided an automated measurement of cIMT and plaque area (PA) by extending the measurements throughout the length of CUS scans (also called as full-length measurements). 19 –22 Such automated full-length measurements (up to 100 sample readings following the plaque morphology) provide a high predictive power to assess the risk of CVD/stroke events.
In the present study, we investigated the association of automated cIMT and TPA measured from B-mode CUS (AtheroEdge system from AtheroPoint, Roseville, California) with eGFR in patients with CKD (mean eGFR = 74 min/mL/1.73 m2). In general, TPA is the sum of all the areas of all atherosclerotic plaques between the clavicle and the angle of the jaw on both sides of the neck. 23 In this study, since we only had the CUS scans for left and right common carotid artery (CCA), the TPA was defined as the sum of left CCA plaque area (PALCCA) and the right CCA plaque area (PARCCA). This is indicated by TPACCA. We hypothesized that, since the TPA is a biomarker of atherosclerotic disease which leads to CVD/stroke events, 9,23 –25 it can equally be considered as a potential CVD biomarker for patients with CKD.
This study has 4 objectives: (1) provide an association between automated cIMT and TPA measurements with eGFR in patients with type 2 diabetes mellitus (T2DM) with low–moderate CKD, (2) compare these associations between male and females, (3) compare these associations for diabetic versus nondiabetic patients, and (4) compare the left carotid and right carotid artery. Figure 1 provides an overview of the study.
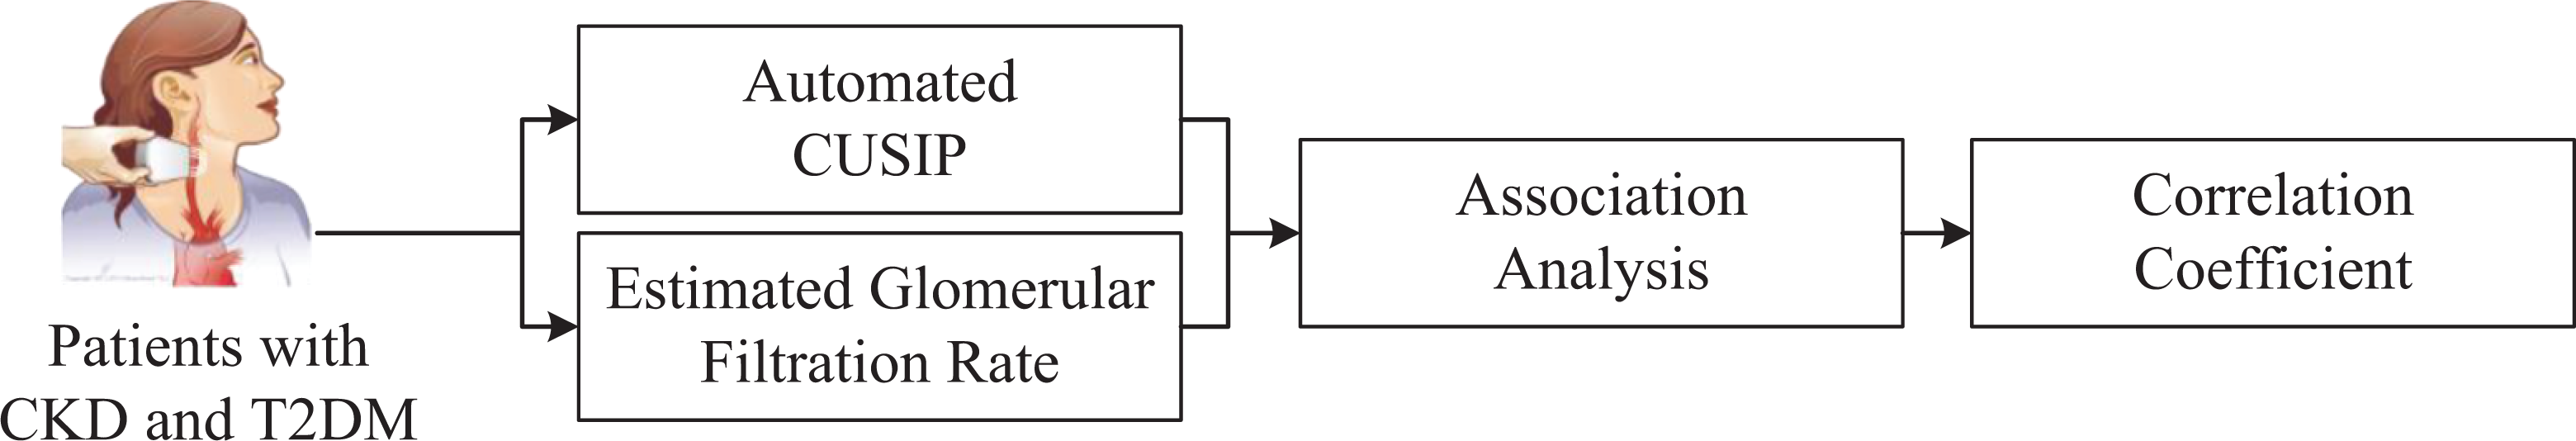
The generalized framework of the proposed automated system. CKD indicates chronic kidney disease; CUSIP: carotid ultrasound image-based phenotypes; t2dm, type 2 diabetes mellitus.
The Link Between Atherosclerosis and CKD
Chronic kidney disease may lead to kidney failure if left untreated. Atherosclerosis is a primary cause that increases the risk of CVD/stroke events in patients suffering from renal diseases. Thus, it is important to understand how CKD triggers the progression of atherosclerotic plaque development. Oxidative stress, endothelial dysfunction, and inflammation form a key triad that leads to atherosclerosis. 26 Patients with CKD exhibit oxidative stress in their earlier phases (stages 1 and 2). 26 Oxidative stress further accelerates the CKD process and leads to low-grade inflammation. 26,27 An increase in oxidative stress reduces nitric oxide availability on the surface of the endothelial layer. 28 Reduction in nitric oxide components modifies the permeability of the endothelium and allows low-density lipoprotein cholesterol (LDL-C) to enter the intimal region of the vessel wall. 26 Then, LDL-C is oxidized and initiates an inflammatory process that activates the leukocyte adhesion molecules on the endothelium. 29,30 Activation of leukocyte adhesion molecules allows the migration of monocytes into the subendothelial layer where they are transformed into foam cells by taking up oxidized LDL-C. 30 –32 This process is extended by migrating smooth muscle cells from the medial layer to the intimal layer where they proliferate and form a protective fibrous cap. 31 –33 This fibrous cap protects the protrusion of this atherosclerotic plaque lesion into the lumen. This process of atherosclerotic plaque-build is accelerated in patients with CKD. 34
If patients with CKD also have T2DM, the risk of CVD/stroke mortality is elevated 6,7 since T2DM accelerates atherosclerotic plaque formation. 35 Patients with diabetes have high blood glucose levels. 35 In turn, this leads to oxidative stress and the formation of advanced glycated products (AGP) and protein kinase C (PKC). 35 Both AGP and PKC lead to endothelial dysfunction and atherogenesis. 35 In addition, recent studies have pointed out that some factors like homocysteine, trimethylamine N-oxide, and p-cresyl sulfate have a strong association with atherosclerotic plaque burden in patients with renal disease. 36 –38 Furthermore, Pignanelli et al 38 reported that patients with renal disease have elevated plasma levels of gut-derived uremic toxins and they are at high risk of atherosclerosis. All the above-mentioned studies indicate a strong link between atherosclerosis and CKD.
Methods
Study Population
A cohort of 339 South Asian Indian patients with T2DM or CKD or hypertension (ie, either stage 1 or stage 2) was recruited for this study. The criterion for T2DM was HbA1c ≥6.5%, while the criterion for CKD was eGFR <60 min/mL/1.73 m2 (ie, high risk) or between eGFR ≥60 min/mL/1.73 m2 and eGFR <90 min/mL/1.73 m2 (ie, low to moderate risk). The criterion for stage 1 hypertension was systolic blood pressure (SBP) ≥130 mm Hg or diastolic blood pressure (DBP) ≥80 mm Hg and the criterion for stage 2 hypertension was SBP ≥140 mmHg or DBP ≥90 mmHg. Thus, during routine body checkup, the patients had either T2DM or CKD or hypertension. The cohort was selected from the inpatient department of M. V. Diabetes Hospital, Chennai, India. M. V. Diabetes Hospital is exclusively for diabetes care. Currently, it is a 100 bedded hospital for the treatment of diabetes and its complications. Over the years, it has grown to be one of the largest referral centers for diabetes. It is recognized as a tertiary care center for the referral of diabetic patients requiring superspecialist opinion and management. For this reason, the majority of the patients who come here are diabetic patients. Ultrasound examination in M. V. Diabetes Hospital was conducted between April 2016 and June 2017 and a total of 678 CUS scans (left and right CCA) were carried out. The CUS scans were retrospectively analyzed by 2 experts (L.S. and M.P.) with 10 and 15 years of experience, respectively. Written consent was obtained from all the participants. The study was approved by the Institutional Ethics Review Board of MV Diabetes Hospital, Chennai, India.
Ultrasound Image Acquisition
Carotid artery examination of the entire cohort was conducted using an ultrasound scanner (Logiq P5; General Electric, Bangalore, India) equipped with a linear transducer (L11) consisting of a resonant frequency of 10 MHz. All the scans were collected by a skilled sonographer with 15 years of experience. Patients were investigated in the supine position with the head tilted backward. Using transverse scanning, the carotid arteries were first identified. Then the probe was rotated by 90° to capture the images of walls of the carotid arteries. The study protocol was based on the guidelines recommended by the American Society of Echocardiography Task Force. 39 The average resolution factor for CUS scans was 0.0529 mm/pixel. The detailed study protocol has been described. 19 –22
Automated Measurement of CUSIP
Five types of CUSIP such as average cIMT (cIMTave), maximum cIMT (cIMTmax), minimum cIMT (cIMTmin), the variability of cIMT (cIMTV), and carotid PA (left carotid PA or PALCCA and right carotid PA or PARCCA) were measured from all the 678 CUS scans using automated software (AtheroEdge; AtheroPoint). 19 –22 The CUSIP measurement system comprised of automated detection of the region of interest followed by the detection of lumen-intima (LI) and media-adventitia (MA) interfaces through the length of the CUS scan. 19 Such type of measurements is also called a full-length measurement. 19 The full-length cIMTave was then measured as the average polyline distance between 100 connected set of points or vertices over the LI and MA interfaces. The cIMTmax and cIMTmin were the maximum and minimum distance between LI and MA borders of the far wall of the CCA. The recently proposed cIMTV is another type of CUSIP that captures the variations or irregularities within the LI and MA interfaces. 22 Carotid morphologic PA was measured by aggregating all the pixels within the LI and MA borders along full length of CUS scan. 35,40 This area also includes the focal thickening (ie, the area >1 mm baseline distance). 9,23,41,42 Figures 2 and 3 depict the full-length automated measurement of CUSIP from both the left CCA and right CCA. The red arrow in these figures shows the automated delineation of LI and ML interfaces by the AtheroEdge.
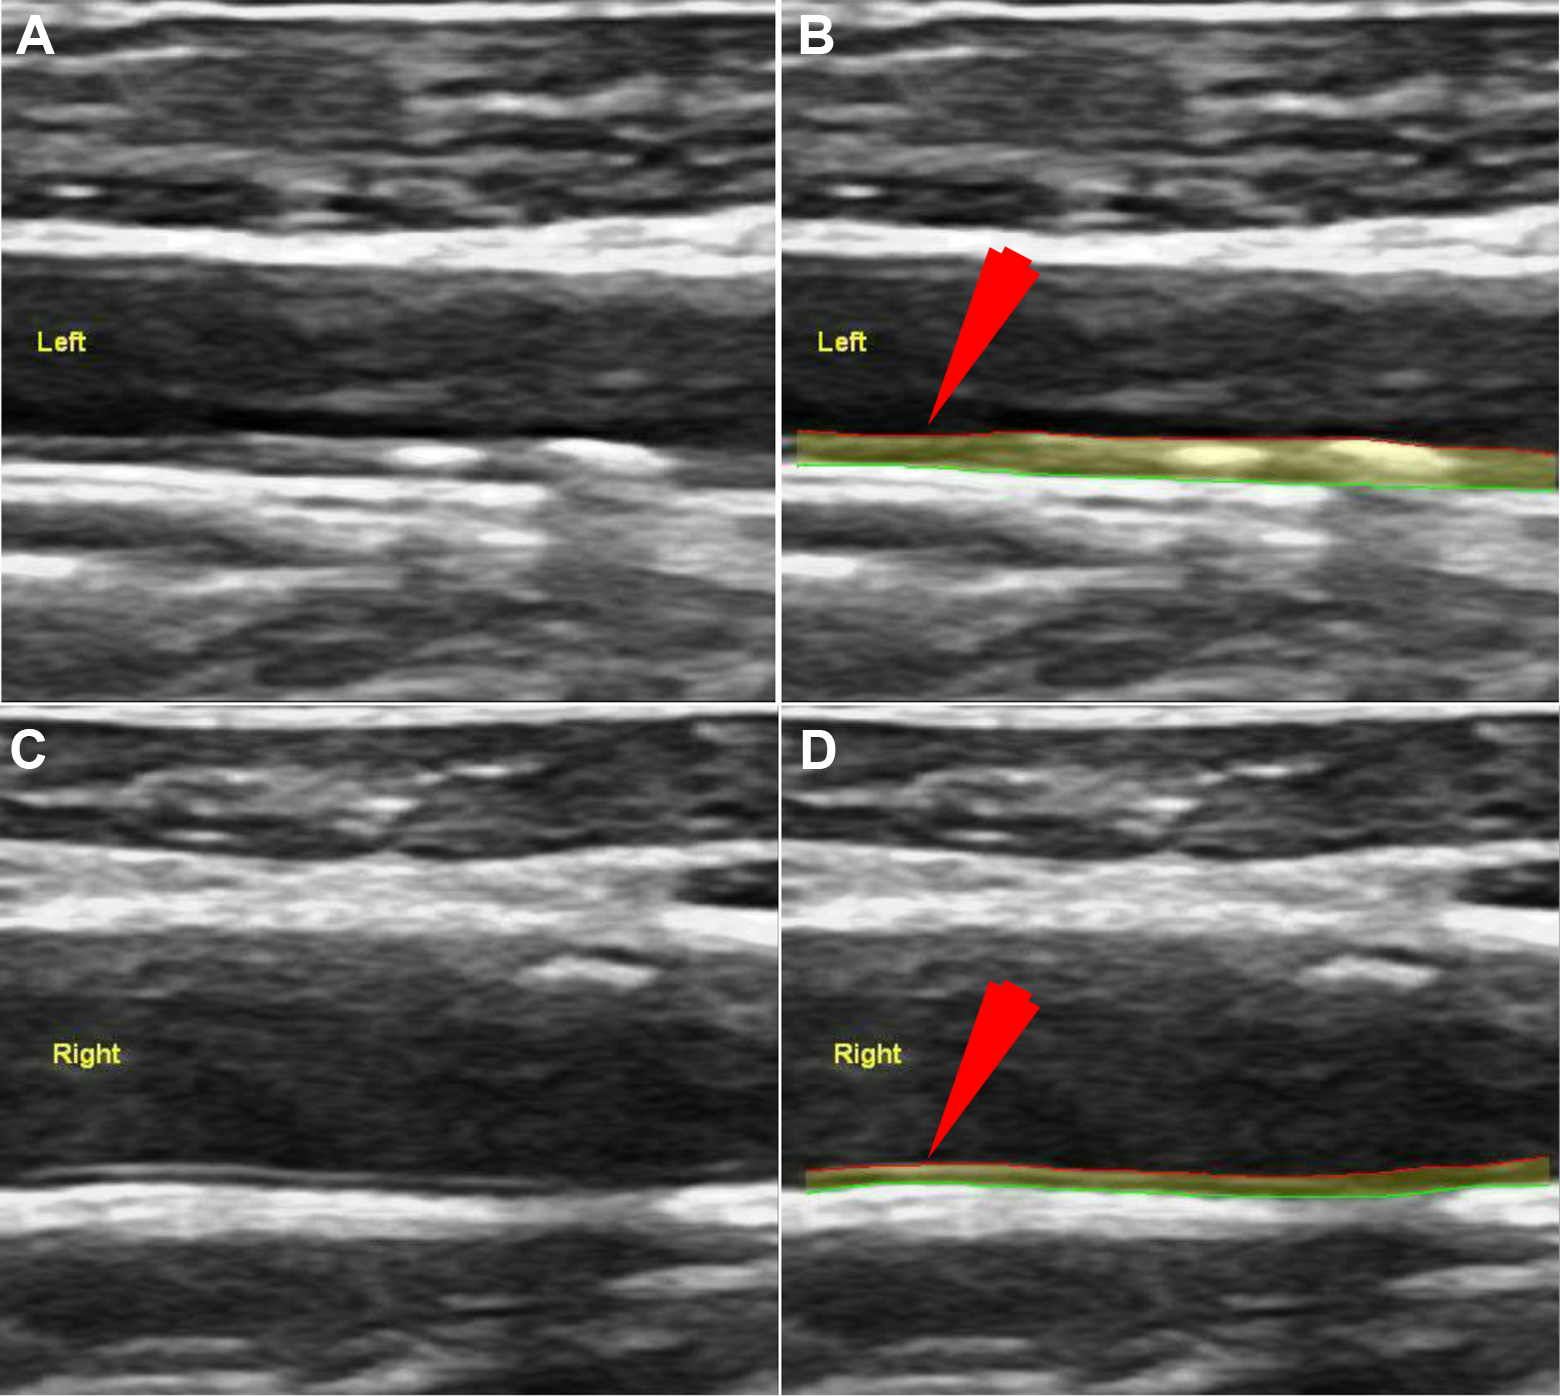
Full-length measurement of CUSIP from the moderate risk patient. A, Row 1: Original image. B, Row 1 (ID-215, LCCA): Processed image using AtheroEdge 2.0; left cIMTave = 0.62 mm, left cIMTmax = 0.83 mm, left cIMTmin = 0.49 mm, left cIMTv = 0.07 mm, left TPA = 13.78 mm2, eGFR = 87 mL/min/1.73 m2. C, Row 2: Original image. D, Row 2 (ID-215, RCCA): Processed image using AtheroEdge 2.0; right cIMTave = 0.79 mm, right cIMTmax = 0.82 mm, right cIMTmin = 0.64 mm, right cIMTv = 0.06 mm, right TPA = 15.05 mm2, eGFR = 87 mL/min/1.73 m2. cIMTave indicates average carotid intima–media thickness; cIMTmax, maximum carotid intima–media thickness; cIMTmin, minimum carotid intima–media thickness; cIMTv, variability in carotid intima–media thickness; CUSIP, carotid ultrasound image-based phenotypes; eGFR, estimated glomerular filtration rate; LCCA, left common carotid artery; RCCA, right common carotid artery; TPA, total plaque area.
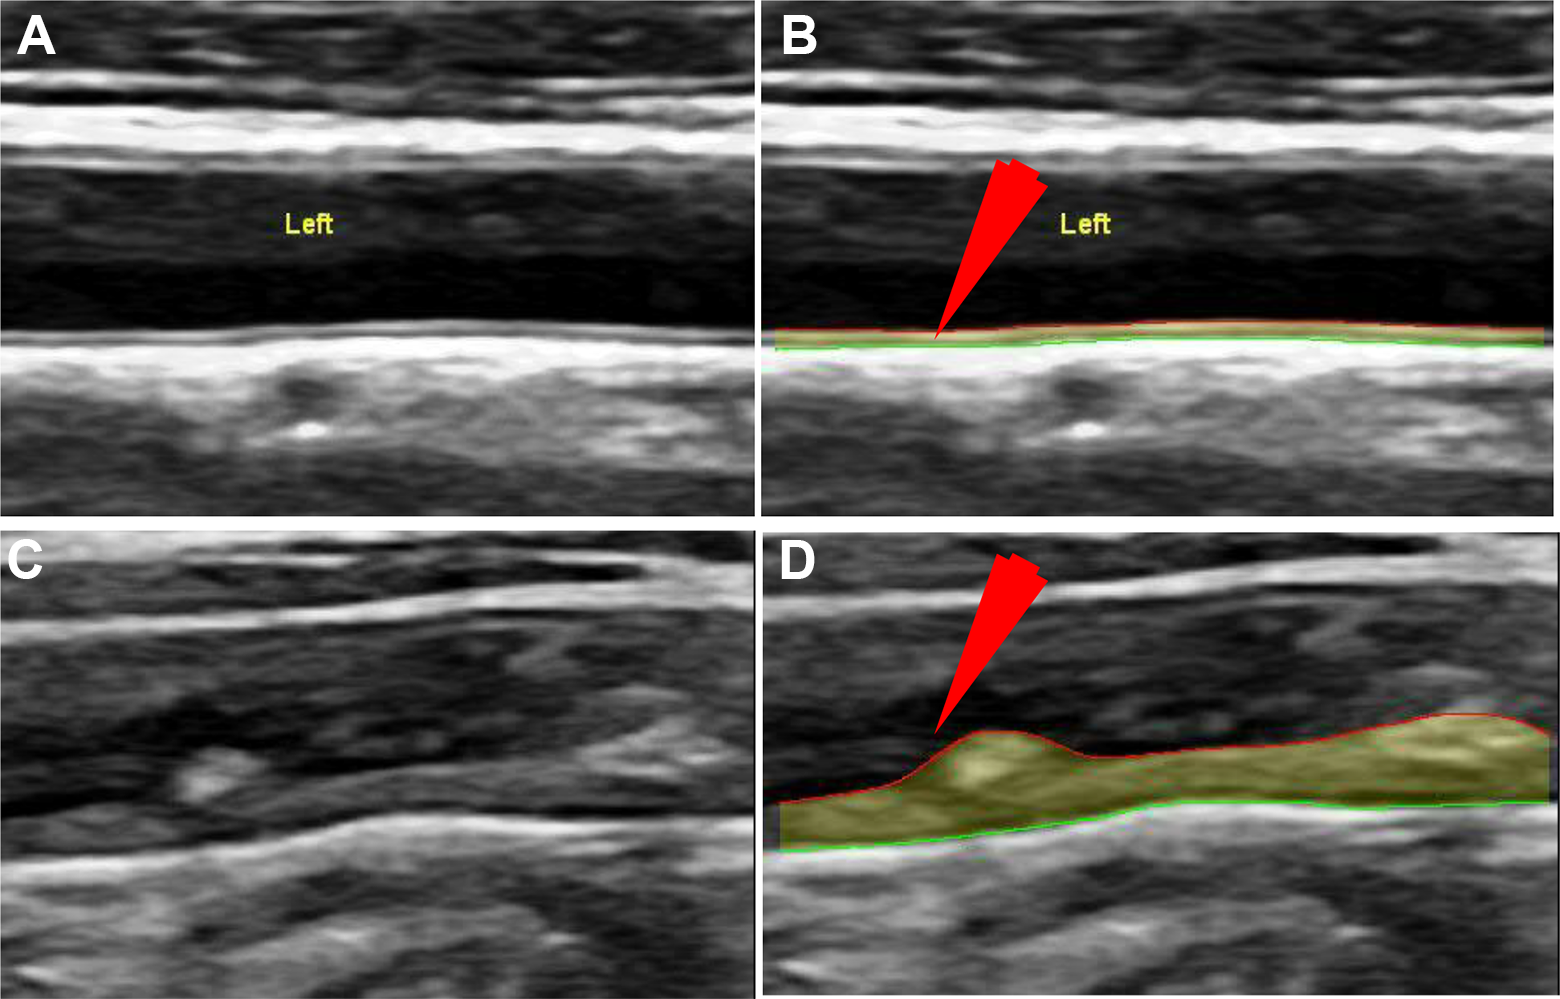
Risk assessment of patients based on the association between CUSIP and eGFR in patients suffering from CKD and T2DM. A, Row 1: Original image. B, Row 1 (ID-40, low risk): Processed image using AtheroEdge 2.0; mean cIMTave = 0.44 mm, mean cIMTmax = 0.54 mm, mean cIMTmin = 0.36 mm, mean cIMTv = 0.045 mm, mean TPA = 8.24 mm2, eGFR = 105 mL/min/1.73 m2. C, Row 2: Original image. D, Row 2 (ID-212, high risk): Processed image using AtheroEdge 2.0; mean cIMTave = 1.29 mm, mean cIMTmax = 1.77 mm, mean cIMTmin = 0.84 mm, mean cIMTv = 0.22 mm, mean TPA = 23.55 mm2, eGFR = 41 mL/min/1.73 m2. cIMTave indicates average carotid intima–media thickness; cIMTmax, maximum carotid intima–media thickness; cIMTmin, minimum carotid intima–media thickness; cIMTv, variability in carotid intima–media thickness; CKD, chronic kidney disease; CUSIP, carotid ultrasound image-based phenotypes; eGFR, estimated glomerular filtration rate; LCCA, left common carotid artery; RCCA, right common carotid artery; T2DM, type 2 diabetes mellitus; TPA, total plaque area.
In the proposed study, all the CUS scans were manually calibrated. 43 The proposed system remained insensitive due to slight variations in calibrations while measuring the 5 phenotypes. 43 The automated system used in this study was validated against the gold standard (an expert) and computed tomography. 44,45 The automated measurements were further compared against the manual tracing by expert neurologists (L.S. and M.P.). In our previous studies, we had developed a MATLAB17b (from www.mathworks.com)-based measurement system (called ImgTracer 43,46 –50 ) which was supplied to neurologists (L.S. and M.P.). The neurologists were able to trace the LI and MA borders along the LI and MA interfaces using the ImgTracer. The ImgTracer allowed the neurologists to zoom in the images and place the knots (or vertices or points) on the LI and MA interfaces. Once the neurologists approve the locations of LI and MA knots, these locations were then saved in the text file for the corresponding patient. The neurologists could remove a knot from the LI and MA interface if they were not able to place the point correctly in the first go. The ImgTracer has the facility to save the LI/MA borders traced by the neurologists before and after fitting the B-spline with the 100 normalized equidistance interpolated points. The ImgTracer is a user-friendly system and is adapted in several studies around the world. 44,47,48,51 –56 Several papers have been published with applications for lung cancer, 57,58 carotid CT imaging, 19,22,44,59,60 carotid MR imaging, 61 skin cancer imaging, 62,63 coronary studies, 43,48,52,53,64 –66 and CUS. 19,50,51,67 –71 The above manual tracing procedure was repeated by several neurologists over the course of time. These data were then used for inter- and intraobserver variability analysis. 15,56,72 The intra- and interobserver variability analysis indicated a minimum variation among the readings taken by the different observers at different times. The mean distance between the readings was computed using an innovative polyline distance metric. 59,73
All the 5 types of CUSIP were computed from 4 types of measurements of the CCA: (1) left CCA (LCCA), (2) right CCA (RCCA), (3) mean CCA (MCCA), and (4) and a maximum of the LCCA and RCCA. The CUSIP measurements for mean CCA are average values of CUSIP from LCCA and RCCA.
Measurement of Automated Carotid PA
Conventionally, there are 3 different approaches that define the carotid plaque. 9,23,39,41,74 –76
Stein et al 39 proposed guidelines for the measurement of cIMT and carotid plaque. They 39 defined carotid plaque as the focal wall thickening of 50% greater than surrounding cIMT of the vessel wall or a focal region with cIMT >1.5 mm protruding into the lumen.
Touboul et al 74,75 proposed the Mannheim guidelines which defined a carotid plaque as a focal thickening region encroaching into the lumen by at least 0.5 mm or 50% of surrounding cIMT or a focal thickening region with cIMT >1.5 mm. Spence et al 23 defined the carotid plaque as the local thickening of intima >1 mm.
Total plaque area
Once a carotid plaque is identified, all these conventional studies
9,23,39,41,74
–76
perform a count of all the pixels within the carotid plaque lesion by manually traced region of interest. Then the total count of all the pixels within the carotid plaque lesion is converted from pixel domain to the millimeter domain (mm2) by multiplying with the image resolution factor. The same process of computing the carotid plaque is repeated in the clavicle and the angle of the jaw on both sides of the neck. Finally, the individual carotid PA from all the sites were summed to obtain the TPA, which is mathematically expressed as TPA = PACCA + PABulb + PAECA + PARClavial, where, i. PACCA = PA of LCCA + PA of RCCA = (PALCCA + PARCCA) ii. PABulb = PA of LCB + PA of RCB = (PALCB + PARCB) iii. PAICA = PA of LICA + PA of RICA = (PALICA + PARICA) iv. PAECA = PA of LECA + PA of RECA = (PALECA + PARECA)
The notations have the following meaning: ICA stands for internal carotid artery, ECA stands for external carotid artery, and CCA stands for common carotid artery, LCCA stands for left common carotid artery, RCCA stands for right common carotid artery, LCB stands for left carotid bulb, RCB stands for right carotid bulb, LICA stands for left internal carotid artery, RICA stands for right internal carotid artery, LECA stands for left external carotid artery, and RECA stands for right external carotid artery.
Plaque area derived from the ultrasound scan
The common challenge in measuring the PA in all these studies is the involvement of manual analysis of plaque region 35,40 which leads to the intra- or interoperator variability. 35,40 In order to avoid this variability, we have used an automated method of PA computation. 35,40 In automated PA measurement, the first step is to delineate the LI and MA borders using a fully automated measurement tool (AtheroEdge; AtheroPoint). 19 Note that this delineation follows the morphology of atherosclerotic plaque. 19 –21,44,51,59,68 We further ensure that the LI and MA borders have the same common support, ensuring that the 2 lengths are the same. This means we choose to make both interfaces (LI and MA) of the same length which corresponds to shorter of the 2 lengths. Further, the envelope is constructed using these 2 LI and MA interfaces. Finally, all the pixels within this envelope were summed up and converted from pixel domain into the millimeter domain to obtain the PA in square millimeter. 35,40,73 Since this PA follows the morphology of atherosclerotic plaque, it was also termed as the morphologic PA or mPA. 35,40,73 Note that PA is the area between the envelope LI and MA borders which is automatically computed using AtheroEdge. This mimics the strategy of manual envelope tracing. 9,23,42 The automated PA includes the carotid PA as well, which is along with the previous definitions. 23,39,74,75 Note that both cIMT region and focal thickening as recommended by previous studies have been considered; hence, PA fully covers the carotid PA. 73 These automated PA measurements have been associated with patients with CVD outcomes. 35,40 Thus, such advanced metrics can be useful for the design of future guidelines. Figures 2 and 3 shows the pictorial representation of the measurement of automated carotid plaque. For representation in symbolic form, we use PA of LCCA and PA of RCCA as PALCCA and PARCCA. Thus, the TPA for CCA (TPACCA) is the sum of PALCCA and PARCCA, that is TPACCA = PALCCA + PARCCA, while the “mean TPACCA” = (PALCCA + PARCCA)/2. For simplicity of this study, we will refer PALCCA or PARCCA as TPA.
Statistical Analysis
SPSS23.0 and MATLAB17b were for statistical analysis. The baseline characteristics (Table 1) for continuous and categorical variables are represented as mean ± SD and percentages, respectively. Two-tailed t test and χ2 test were used for continuous and categorical variables, respectively. Pearson correlation coefficient (CC) was used to test the correlation of automated measurements of cIMTave and TPA against eGFR. The receiver operating characteristics (ROC) plot and area under the curve (AUC) were used to compare the performance of automated TPA against the cIMTave. The CC between TPA and IMTave was highest compared with the remaining 3 types of cIMT (cIMTmax, cIMTmin, cIMTV; see Table A1 in the Online Appendix). This is the reason for comparing the TPA against only cIMTave throughout this study. The correlation and univariate regression analysis between cIMTave/TPA and eGFR were further extended to compute (1) male versus female, (2) diabetic versus nondiabetic patients, and (iii) LCCA versus RCCA versus a maximum of LCCA and RCCA. Although all 4 types of measurements of CCA were presented in this study, more priority was given to MCCA measurement. This is because MCCA measurement captures the morphological effect from both left and right CCA. A 2-sided P < .05 was considered significant.
Baseline Characteristics of the Patients Divided Into Low-Risk and High-Risk Classes (According to eGFR).
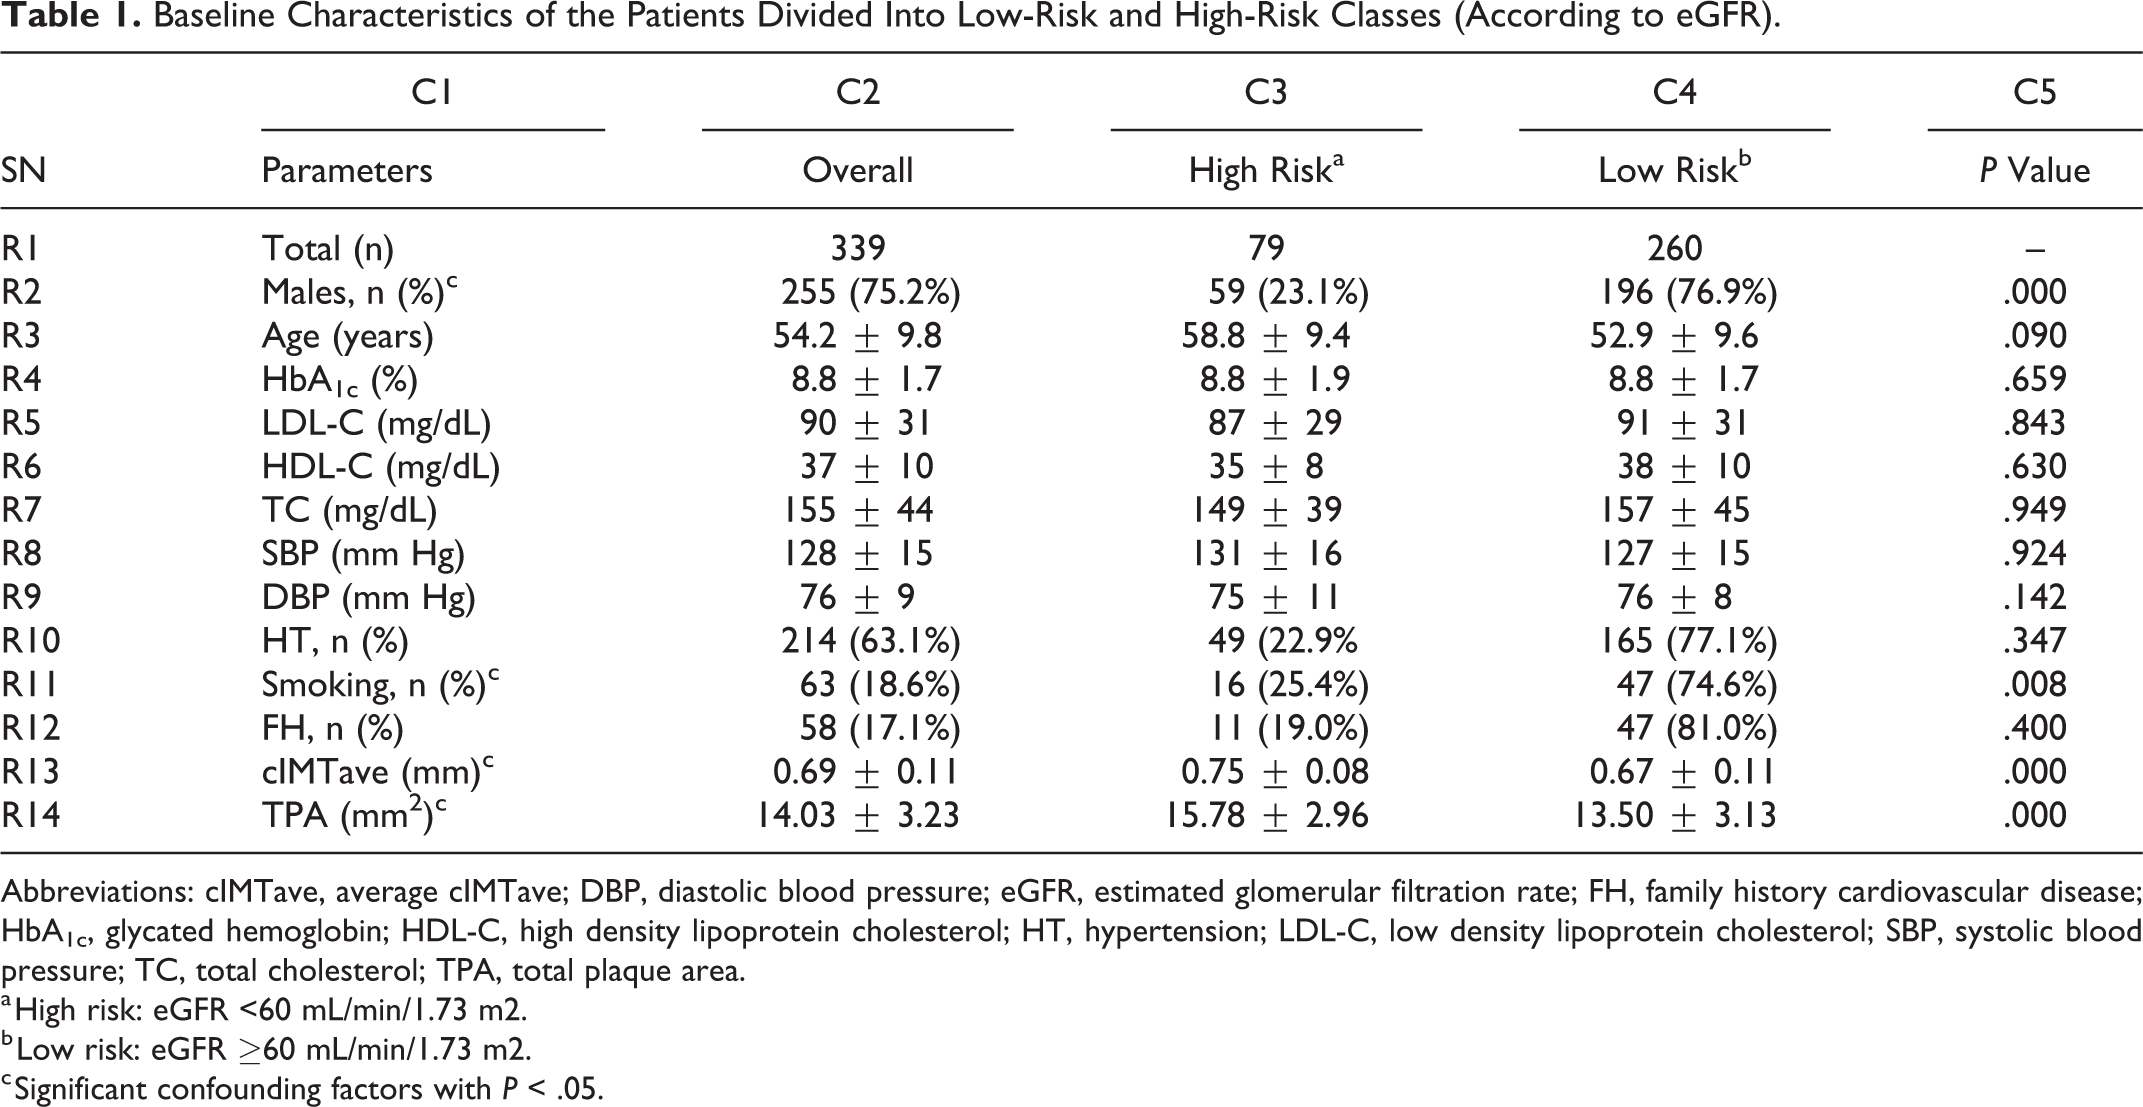
Abbreviations: cIMTave, average cIMTave; DBP, diastolic blood pressure; eGFR, estimated glomerular filtration rate; FH, family history cardiovascular disease; HbA1c, glycated hemoglobin; HDL-C, high density lipoprotein cholesterol; HT, hypertension; LDL-C, low density lipoprotein cholesterol; SBP, systolic blood pressure; TC, total cholesterol; TPA, total plaque area.
a High risk: eGFR <60 mL/min/1.73 m2.
b Low risk: eGFR ≥60 mL/min/1.73 m2.
c Significant confounding factors with P < .05.
Power Analysis and Sample Size
In general, a data sample must ensure that all the selected samples should be independent. The proposed study uses a standardized protocol for data collection which selects samples from the left and right CCA. Although the samples were selected from the same participant, they were measured from 2 completely different and independent locations representing the 2 sides of the neck.
20,49,53
It should be noted that although both the left and right carotid arteries have a similar genetic structure and function, they work independently along 2 diverse pathways.
70,77,78
Furthermore, since atherosclerosis is a multifocal and random disease, the deposition of plaque is also independent in both the left and right carotid arteries.
70,77,78
Thus, in this proposed study, a total sample size of 678 (339 patients × 2 CUS scans) was selected to perform the statistical analysis. In order to test the validity of the selected sample size of 678, we performed a power analysis. The objective of performing power analysis was to identify the smallest sample size required to perform the association analysis between carotid atherosclerosis and CKD using automated TPA and eGFR. Our study population refers to South Asian Indian patients with T2DM, CKD, or normal as defined in the “Study Population” section. This cohort had ∼93% of the patients with T2DM (ie, HbA1c ≥6.5%) and ∼7% were non-T2DM (ie, HbA1c <6.5%). The study uses a confidence interval (CI) of 95%, a margin of error (MoE) of 5%, and a data proportion (
Results
Baseline Characteristics
A cohort of 339 patients (255 males and 84 females) was analyzed. The baseline characteristics of the cohort are presented in Table 1. The average value of 4 types of CUSIP measurements (left, right, mean, and maximum) corresponding to CCA were: (1) LCCA (cIMTave: 0.70 ± 0.12 mm and TPA: 14.40 ± 3.59 mm2), (2) RCCA (cIMTave: 0.67 ± 0.12 mm and TPA: 13.67 ± 4.30 mm2), (3) MCCA (cIMTave: 0.69 ± 0.11 mm and TPA: 14.03 ± 3.23 mm2), and (4) the maximum between LCCA and RCCA (cIMTave: 0.76 ± 0.18 mm and TPA: 15.81 ± 4.82 mm2). Out of 339 patients, 317 patients (93.5%) had T2DM with HbA1c ≥6.5%, 214 were hypertensive (63.1%), 63 (18.6%) were smokers, and 58 (17.1%) had a family history of coronary artery disease. The patients were stratified into 2 risk categories (high risk and low risk) for CKD based on the values of eGFR. Studies have reported that an eGFR <60 mL/min/1.7m2 is associated with an increased risk of heart failure and stroke. 80,81 Hence, in our study, patients with eGFR <60 mL/min/1.7m2 were defined as high-risk patients.
Distribution of Automated CUSIP With the CKD Stages
The prevalence of automated measurements of 5 types of CUISIP (IMTave, IMTmax, IMTmin, IMTV, and TPACCA) in 6 stages of CKD is presented in Figure 4. As shown in Figure 4, both cIMT and TPA increase with the stage of CKD (ie, with the reduction of eGFR). Six stages of CKD are (1) no risk (NR; eGFR ≥90 min/mL/1.73 m2), (2) stage 1 (eGFR ≥60 min/mL/1.73 m2 and eGFR <90 min/mL/1.73 m2), (3) stage 2 (eGFR ≥45 min/mL/1.73m2 and eGFR <60 min/mL/1.73 m2), (4) stage 3 (eGFR ≥30 min/mL/1.73 m2 and eGFR <45 min/mL/1.73 m2), (5) stage 4 (eGFR ≥15 min/mL/1.73 m2 and eGFR <30 min/mL/1.73 m2), and (6) stage 5 (eGFR <15 min/mL/1.73 m2).
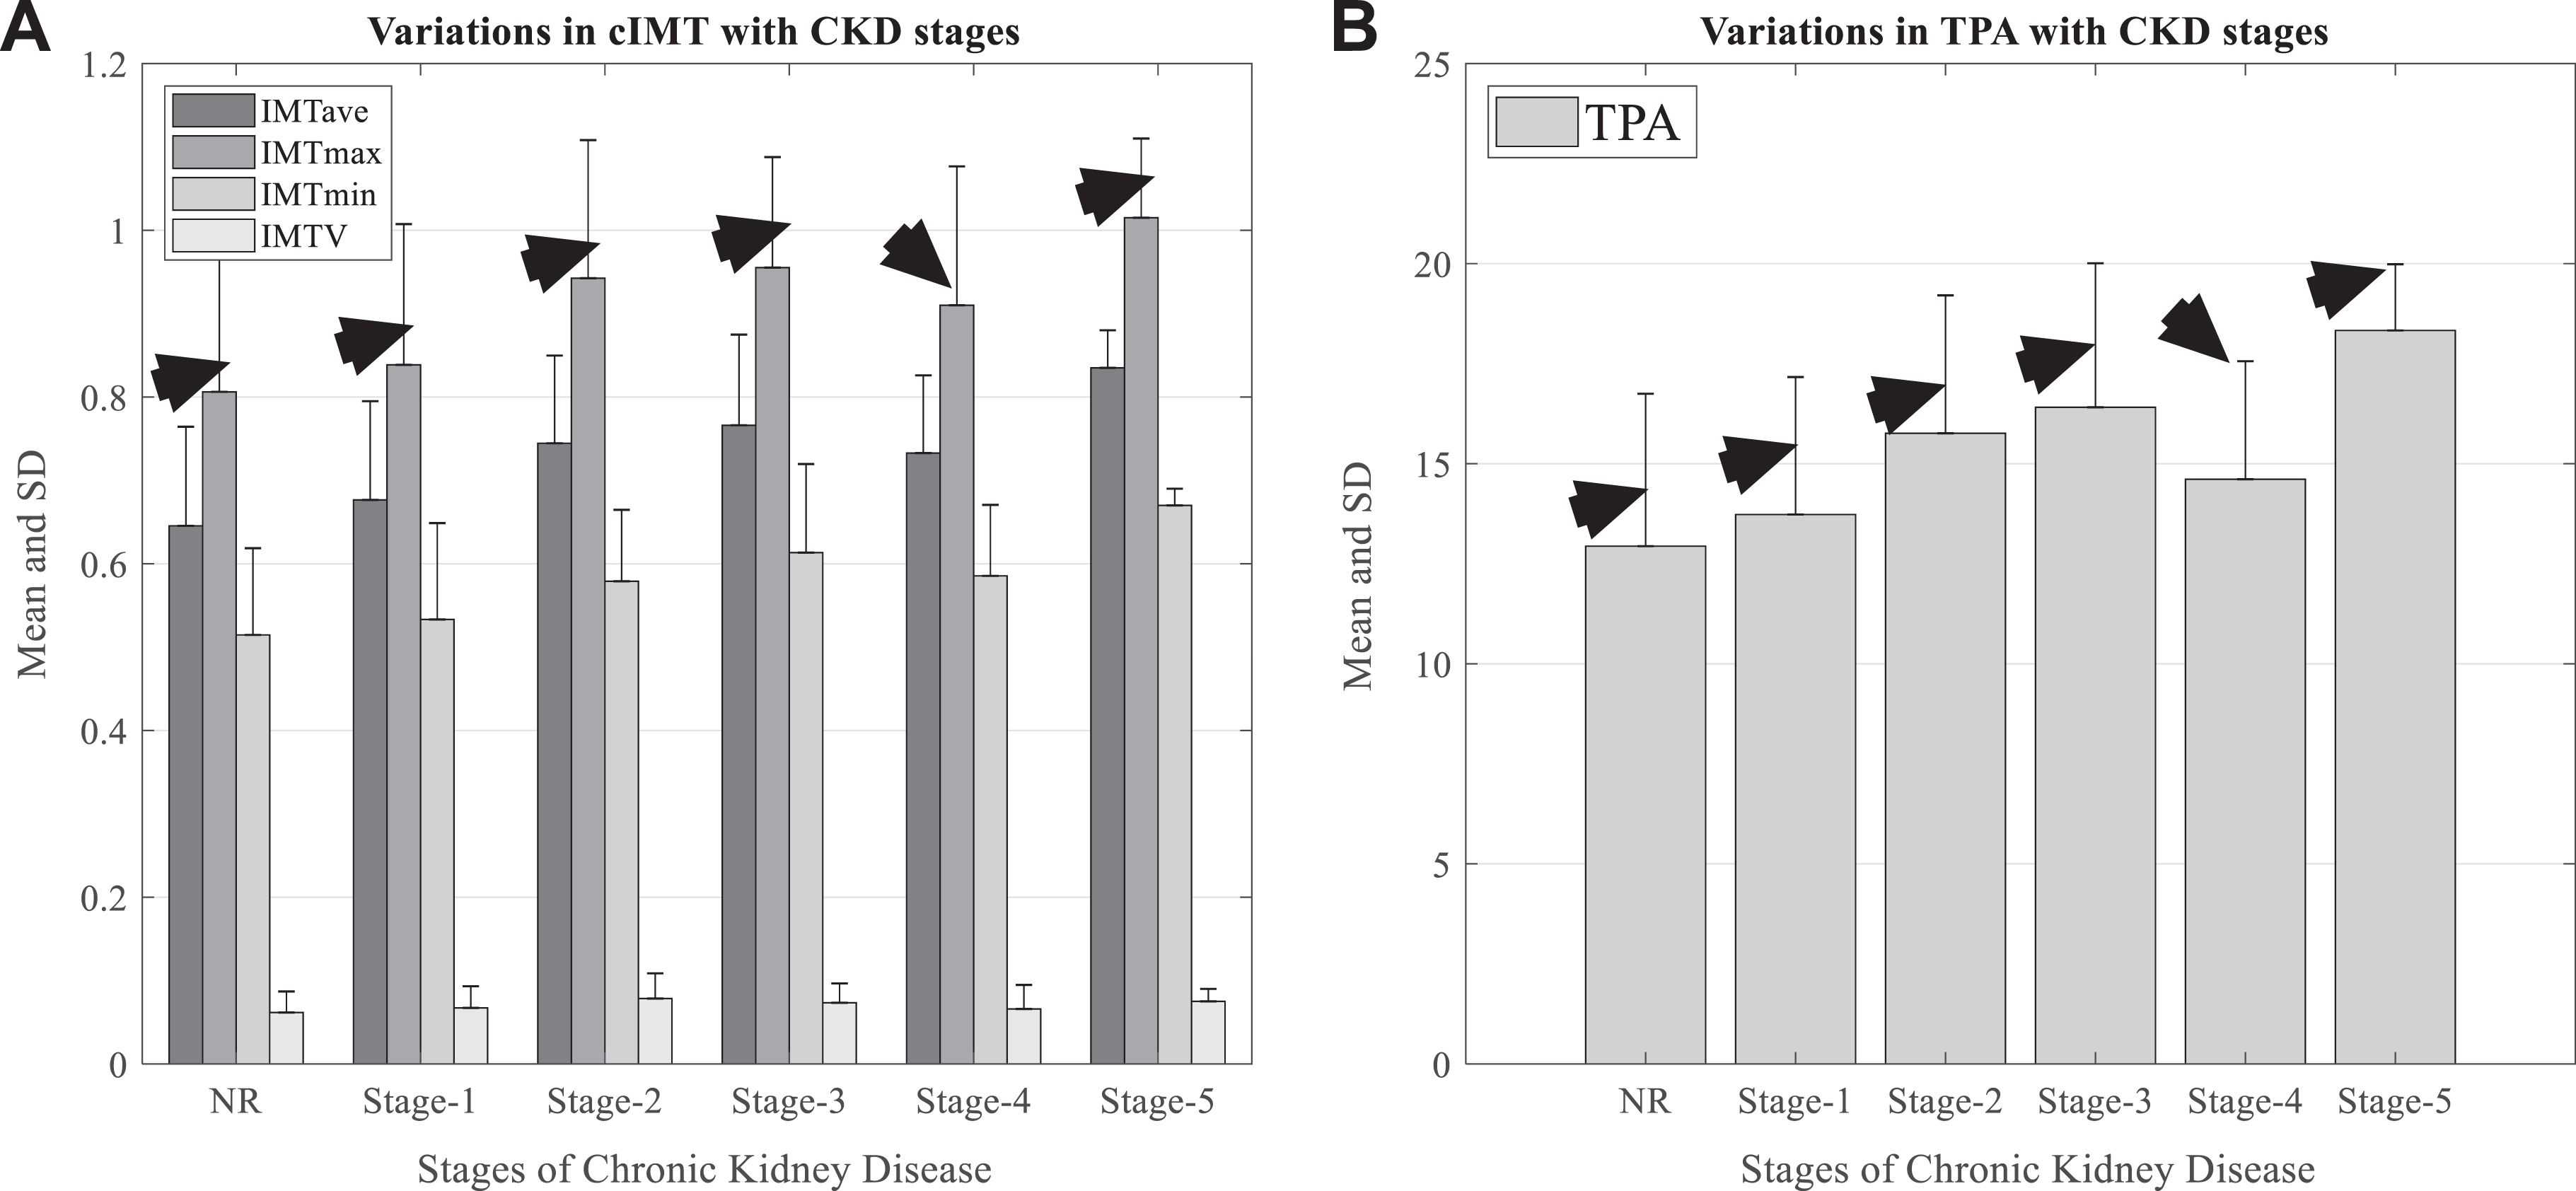
Distribution of automated cIMTave and TPA with stages of CKD. A, Variation of 4 types of IMTave, IMTmax, IMTmin, and IMTV with the stages of CKD. B, Variation of automated TPA with the stages of CKD. The black arrows indicate the variations in mean values of the automated phenotypes. cIMTave indicates average carotid intima–media thickness; cIMTmax, maximum carotid intima–media thickness; cIMTmin, minimum carotid intima–media thickness; cIMTv, variability in carotid intima–media thickness; CKD, chronic kidney disease; eGFR, estimated glomerular filtration rate; IMTV, intima–media thickness variability; NR, no risk with eGFR >90 mL/min/1.73 m2; TPA, total plaque area.
Correlation of cIMTave and TPACCA With eGFR in Full Cohort
Both types of CUSIP in CCA such as cIMTave and TPA were negatively correlated with eGFR in all the 4 types of measurements (left, right, mean, and maximum). The corresponding CC values between cIMTave and eGFR were (1) −0.31 (P < .001) in LCCA, (2) −0.34 (P < .001) in RCCA, (3) −0.36 (P < .001) in MCCA, and (4) −0.33(P < .001) in maximum of LCCA and RCCA. Similarly, the CC values between carotid PA and eGFR were (1) −0.25 (P < .001) for LCCA, (2) −0.23 (P < .001) for RCCA, (3) −0.28 (P < .001) for MCCA, and (4) −0.26 (P < .001) in maximum between LCCA and RCCA. Figure A1 in the Online Appendix shows the regression plots between CUSIP and eGFR for all 4 types of measurements of CCA. The black arrow indicates the overall trend between both types of CUSIP and the eGFR which is represented by the least square line. One key observation is that TPA correctly follows the inverse relationship between cIMTave and eGFR, as hypothesized. Thus, TPA can be considered as an important risk factor while assessing CKD.
Correlation of cIMTave and TPA With eGFR in Male and Female Patients
In a sex-based analysis, both males and females reported a low-to-moderate CC between cIMTave and the eGFR. A similar type of inverse relationship was seen between TPA and eGFR. The sex-specific CC values between cIMTave and eGFR for all 4 types of measurements were: (1) LCCA (males: CC = −0.31, P < .001 and females: CC = −0.30, P < .001), (2) RCCA (males: CC = −0.35, P = .003 and females: CC = −0.31, P < .001), (3) MCCA (males: CC = −0.34, P = .001 and females: CC = −0.37, P < .001), and (4) maximum of LCCA and RCCA (males: CC = −0.34, P < .001 and females: CC = −0.30, P = .004). Similarly, the sex-specific CC values between TPA and eGFR for all 4 types of measurements were: (1) LCCA (males: CC = −0.24, P < .001 and females: −0.29, P = .006), (2) RCCA (males: CC = −0.20, P = .002 and females: CC = −0.31, P = .003), (3) MCCA (males: CC = −0.25, P < .001 and females: CC = −0.35, P < .001), and (4) maximum of LCCA and RCCA (males: CC = −0.25, P < .001 and females: CC = −0.29, P = .007). Figure A2 and Figure A3 in the Online Appendix shows the regression plots between CUSIP and eGFR based on sex.
Correlation of cIMTave and TPA With eGFR in T2DM and Non-T2DM Patients
The CC values between cIMTave and eGFR for all 4 types of measurements were: (1) LCCA (T2DM: CC = −0.30, P < .001 and non-T2DM: −0.39, P = .075), (2) RCCA (T2DM: CC = −0.34, P < .001 and non-T2DM: CC = −0.25, P = .254), and (3) MCCA (T2DM: CC = −0.36, P < .001 and non-T2DM: CC = −0.36, P = .103) and maximum of LCCA and RCCA (T2DM: CC = −0.32, P < .001 and non-T2DM: CC = −0.36, P = .104). Similarly, CC values between TPA and eGFR for all 4 types of measurements were: (1) LCCA (T2DM: CC = −0.24, P < .001 and non-T2DM: CC = −0.60, P = .003), (2) RCCA (T2DM: CC = −0.22, P < .001 and non-T2DM: CC = −0.36, P = .099), and (3) MCCA (T2DM: CC = −0.26, P < .001 and non-T2DM: CC = −0.49, P = .029) and maximum of LCCA and RCCA (T2DM: CC = −0.24, P < .001 and non-T2DM: CC = −0.55, P = .008). Figure A4 and Figure A5 in the Online Appendix shows the regression plots between CUSIP and eGFR for diabetic and nondiabetic patients.
Risk Assessment of Patients With CKD and T2DM
Figure 3 shows the risk assessment of patients based on the association between CUSIP and eGFR. It should be noted that both cIMTave and TPA progress with a reduction in eGFR values. Two rows of Figure 3 correspond to the sample patients in low-risk and high-risk categories based on the association between cIMTave/TPA and eGFR. All the patients with eGFR <60 mL/min/1.73 m2 were stratified into the high-risk category. For low-risk patient (row 1, Figure 3A and B), the cIMTave, TPA, and eGFR values were 0.53 mm, 9.9 mm2, and 146 mL/min/1.73 m2, respectively. Similarly, for high-risk patient (row 1, Figure 3C and D), the cIMTave, TPA, and eGFR values were 0.84 mm, 18.33 mm2, and 11 mL/min/1.73 m2, respectively. This clearly confirms the inverse relationship between TPA and cIMTave with eGFR.
Performance Evaluation of Automated TPA Against cIMTave
Figure 5 indicates the ROC plot for TPACCA against cIMTave as a response variable. The cIMTave is a well-established biomarker of CVD/stroke events and has been used by multiple studies to perform risk stratification. 78,82,83 Thus, cIMTave was used as a response variable to evaluate the performance of TPACCA. Three different types of risk stratification thresholds (0.8, 0.85, and 0.9 mm) were selected based on the previously published studies. The cIMTave threshold of 0.9 mm and a TPACCA threshold point of 20.45 mm2 reported the highest significant AUC (0.80, P < .0001).
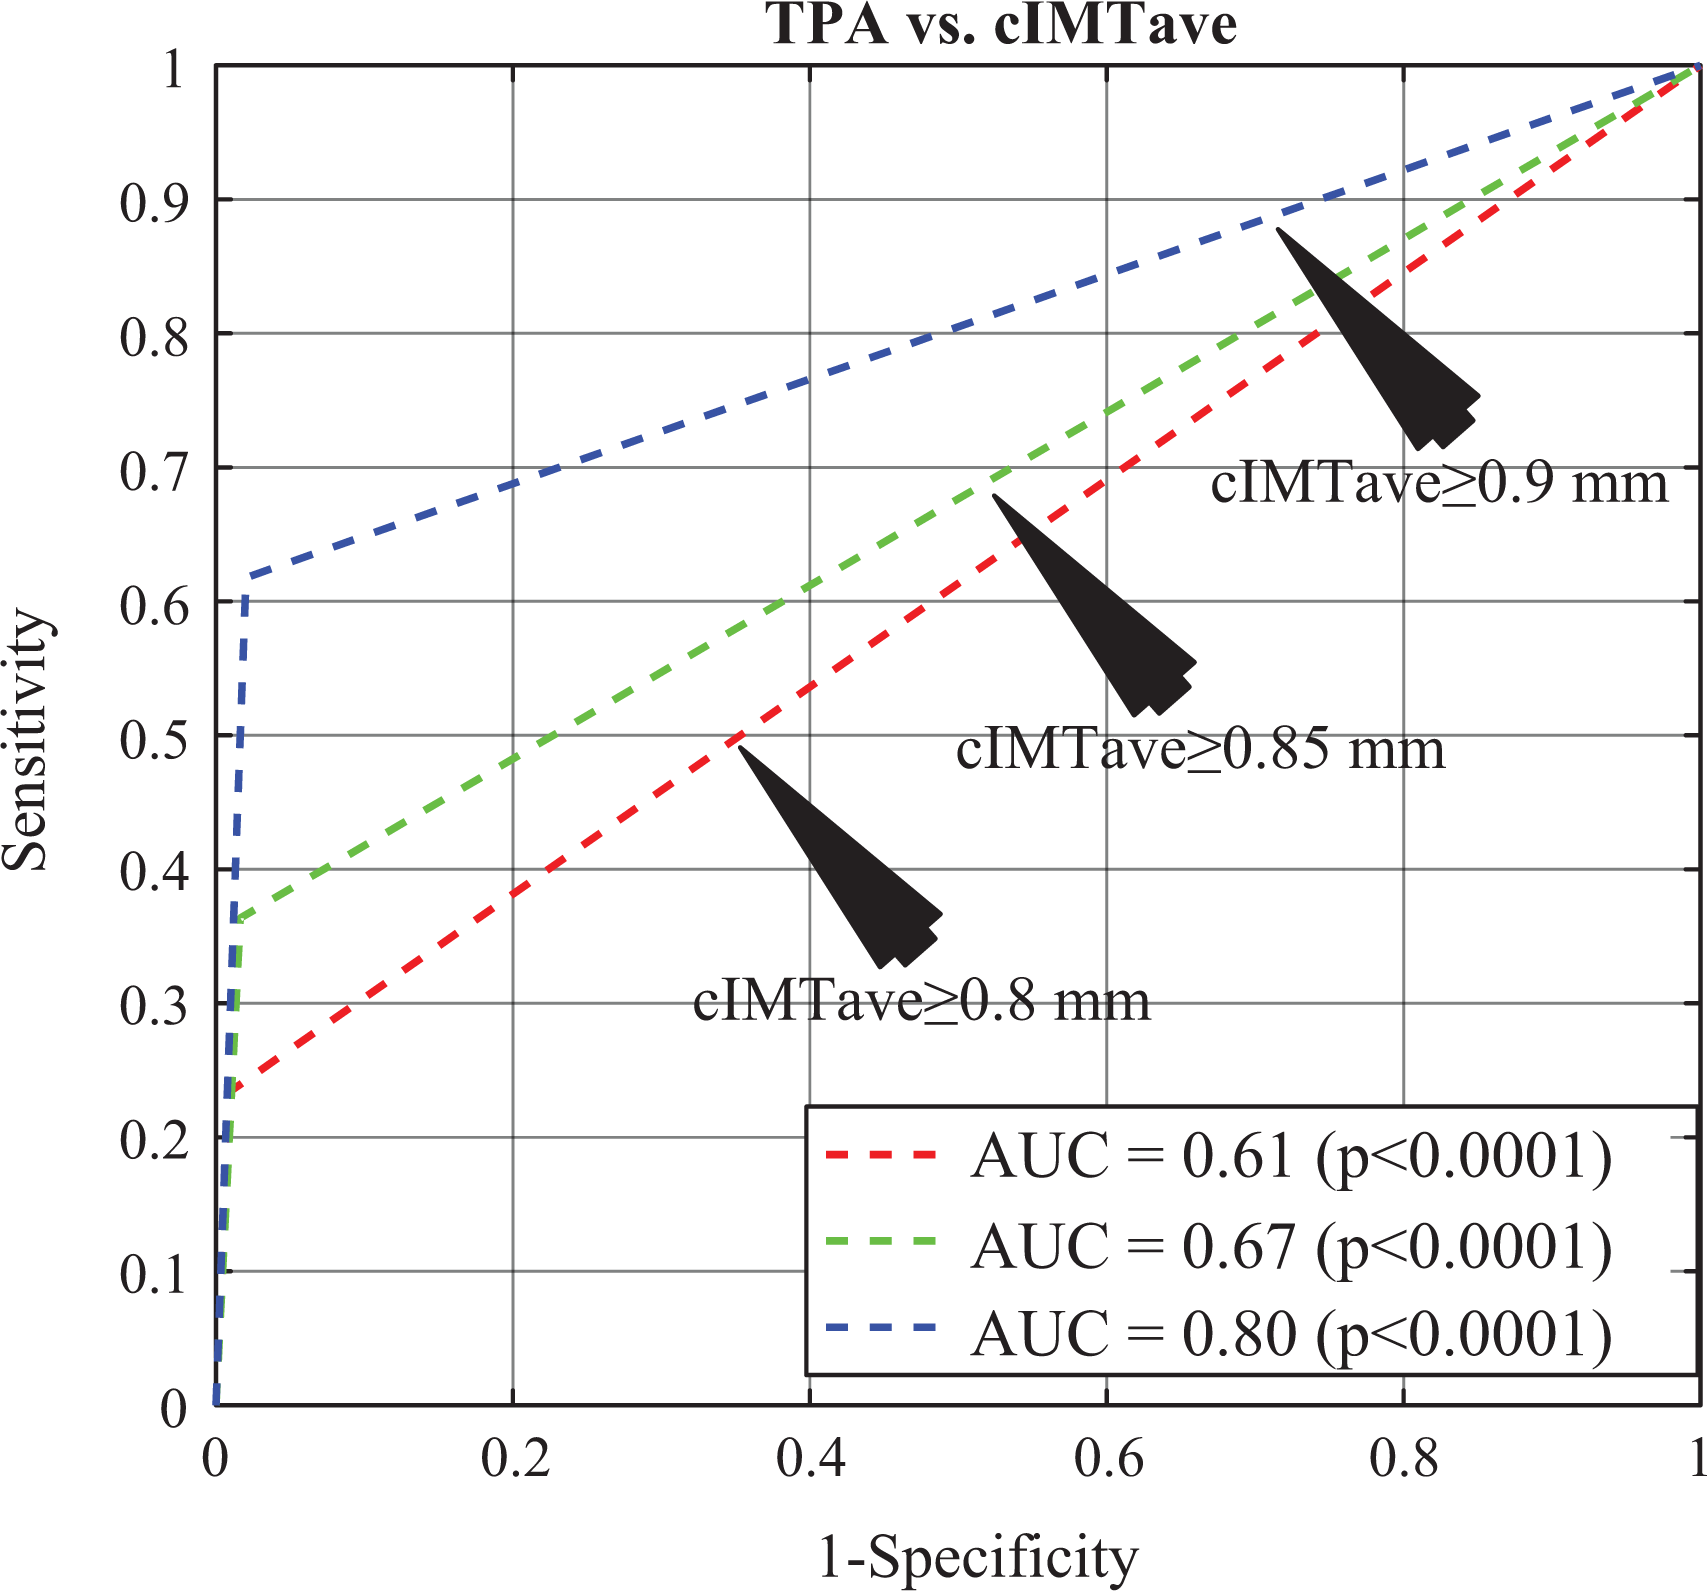
Performance evaluation of automated TPA against the automated cIMTave. Black arrows indicate the ROC plots at different threshold points of cIMTave. AUC indicates area under the curve; cIMTave, average carotid intima–media thickness; ROC, receiver operating characteristics; TPA, total plaque area.
Discussion
Summary
This cross-sectional study investigated the associations between the automated CUSIP measurements and eGFR in a South Asian Indian 339 CKD patient (678 CUS scans) cohort. We hypothesized that automated measurement of TPACCA can also be considered as an equivalently powerful biomarker of carotid artery disease in patients suffering from CKD with or without T2DM. A negative correlation between TPACCA and eGFR (CC: −0.28, P < .001) was observed which was comparable to the correlation between cIMTave and eGFR (CC: −0.36, P < .001). The automated TPA was further used to investigate the association with eGFR in male versus female, diabetic versus nondiabetic patients, and left versus right CCA. In a sex-based analysis, we observed a significant negative correlation between TPA and eGFR in females (CC: −0.35, P < .001) and in males (CC: −0.25, P < .001). The nondiabetic patients reported a higher negative correlation (CC: −0.49, P = .020) between TPA and eGFR compared with patients with T2DM (CC: −0.26, P < .001).
Considering all the patients, our statistical analysis showed the CC between TPA and eGFR is stronger for LCCA compared with RCCA by ∼9%. If we consider male patients alone, this relationship is still stronger for LCCA versus RCCA by 20%, while for the females, RCCA is higher than LCCA by ∼7%. For patients with T2DM, LCCA is higher than RCCA by ∼9%, and for nondiabetic patients, LCCA is higher than RCCA by ∼66%. In summary, LCCA has been consistently higher compared with RCCA. This provides evidence that the plaque buildup in the 2 carotid arteries corresponding to the 2 sides of the neck is not consistent. 78 This could probably be due to the origination of LCCA directly from the aortic while RCCA branches from the innominate artery which in turn comes from the aortic arch. 78
Benchmarking
Table 2 compares our proposed study against the 10 previously published studies. 7,12,79,80,112 –117 These studies indicate an association between carotid atherosclerosis and renal disease. The studies are presented in chronological order with 10 attributes. Out of 10 studies, only 2 studies (row R4 and row R10) presented an association between carotid plaque and renal disease. Among these 2 studies, Pelisek et al 84 measured the carotid plaque using histological analysis. There is only 1 study (by Seo et al 85 ) that links the carotid PA with renal disease; however, a semiautomated method was adopted for the measurement of carotid plaque in a 20-mm segment contained by the focal thickening region. Inclusion of carotid plaque in the analysis reported a rapid decline in the renal function (AUC = 0.772, P < .001). The present study adopts the fully automated full-length measurement of carotid plaque, which includes focal thickening.
Comparison of the Proposed Study With Studies That Showed the Association Between Carotid Atherosclerosis and Renal Disease.
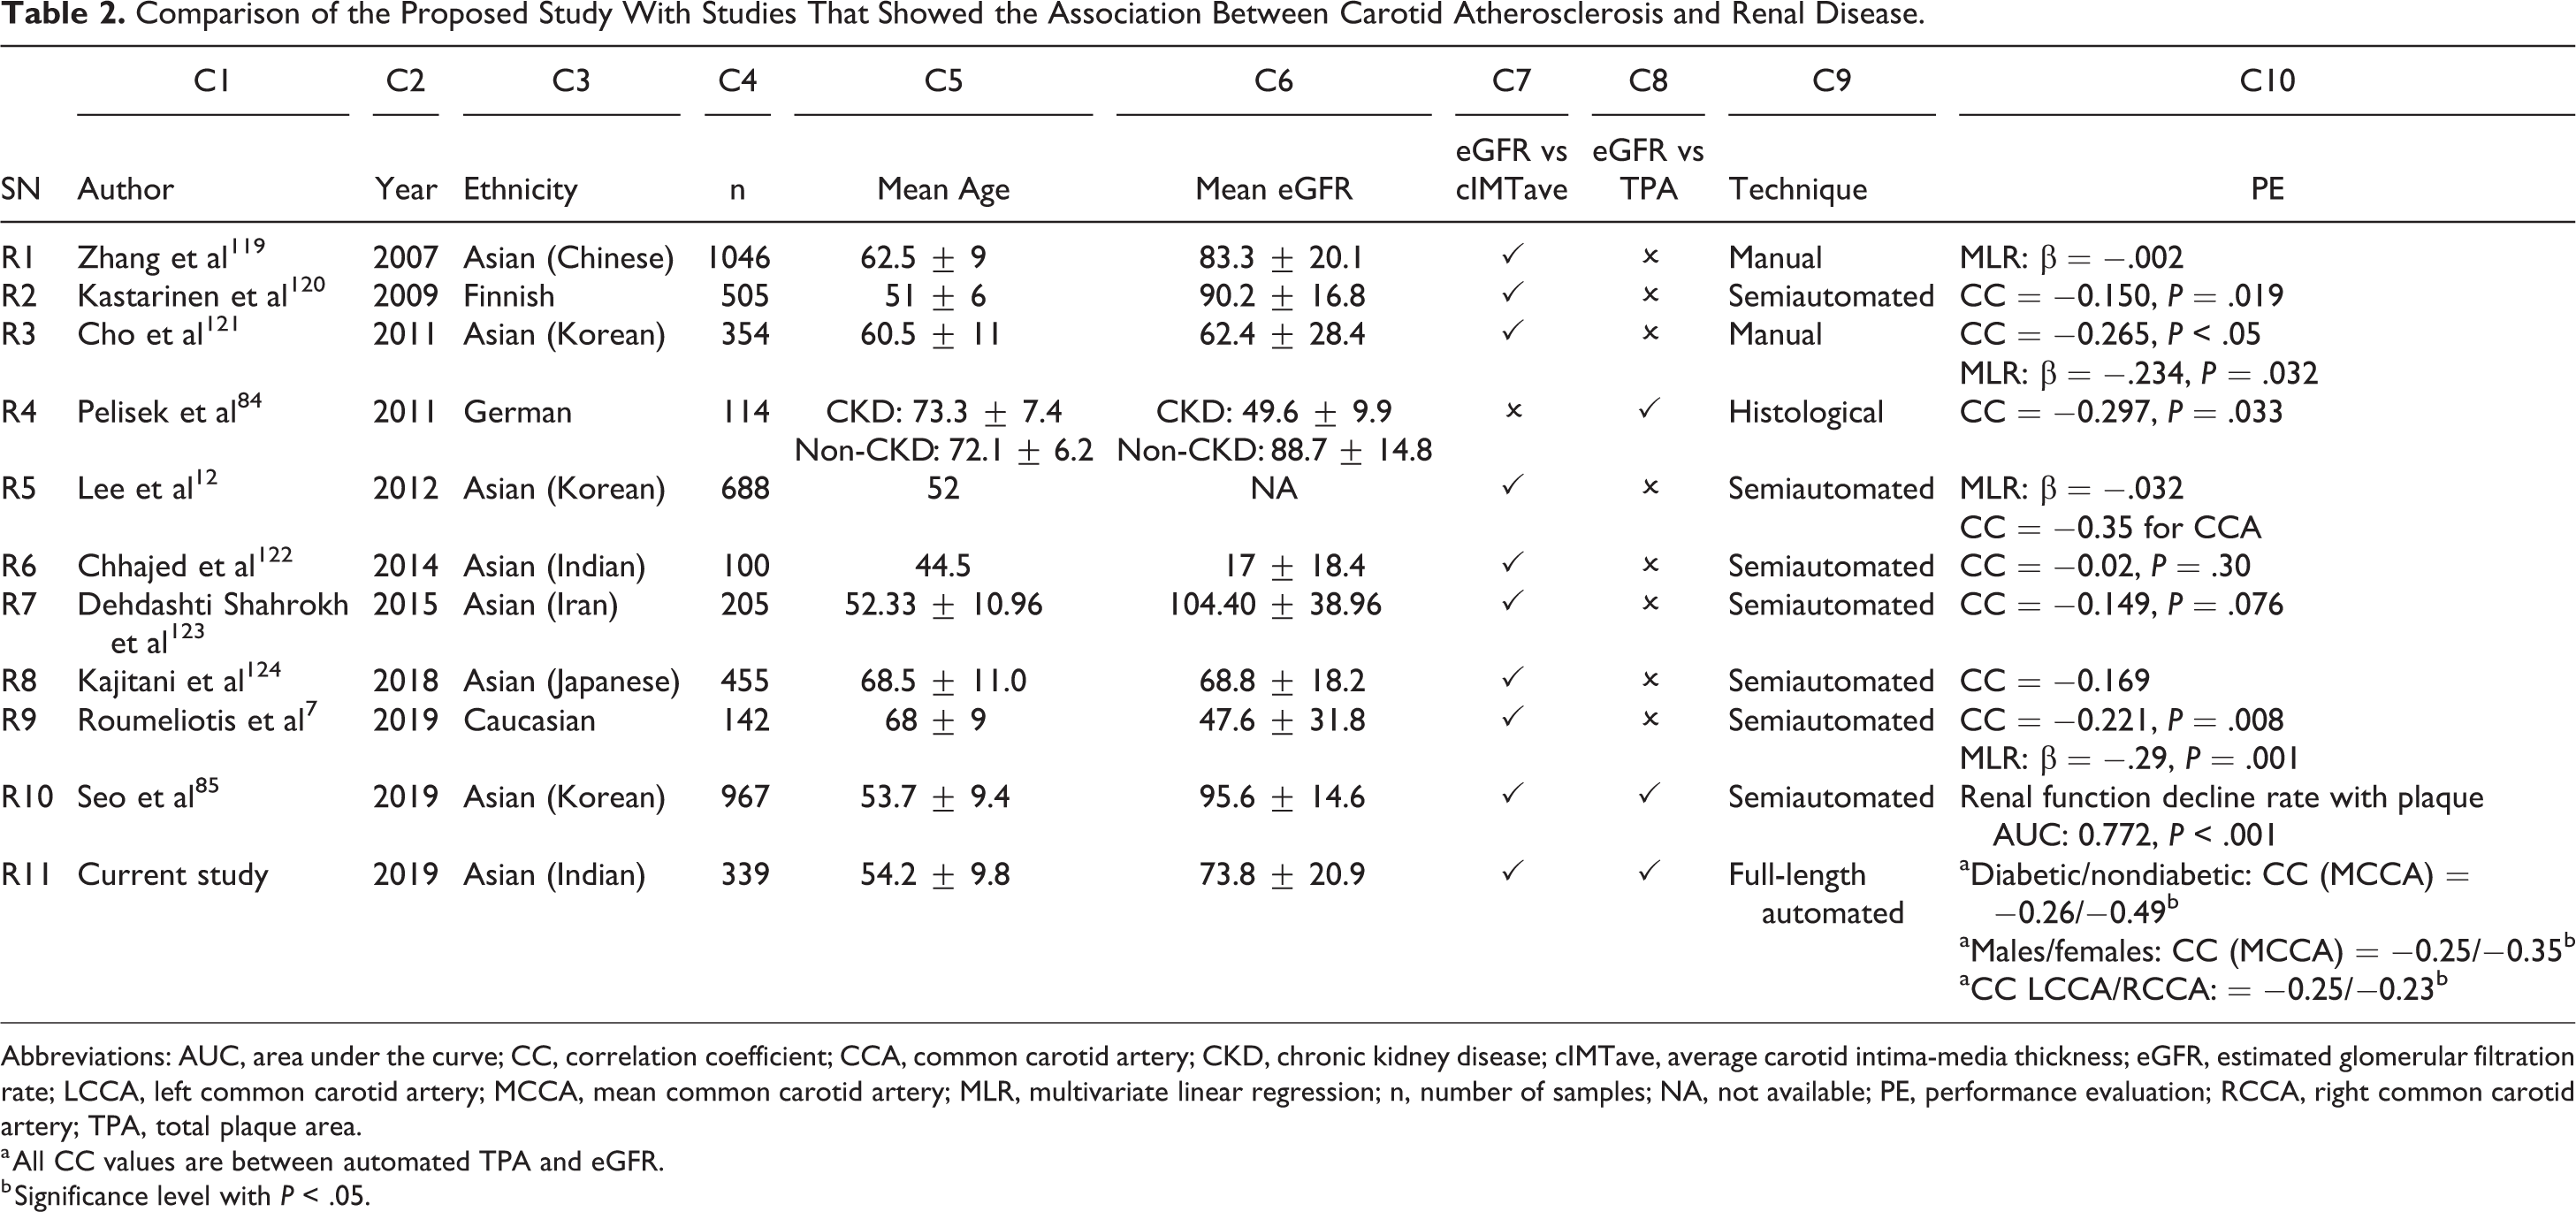
Abbreviations: AUC, area under the curve; CC, correlation coefficient; CCA, common carotid artery; CKD, chronic kidney disease; cIMTave, average carotid intima-media thickness; eGFR, estimated glomerular filtration rate; LCCA, left common carotid artery; MCCA, mean common carotid artery; MLR, multivariate linear regression; n, number of samples; NA, not available; PE, performance evaluation; RCCA, right common carotid artery; TPA, total plaque area.
a All CC values are between automated TPA and eGFR.
b Significance level with P < .05.
A Short Note on Carotid Plaque Measurement
Atherosclerotic plaque is an integral part of carotid artery walls. Libby et al 32 described the biological process of atherosclerotic plaque formation. The authors showed that plaque formation is multifocal. Such plaque if left undiagnosed may protrude into the lumen and rupture leading to CVD/stroke events. Thus, it is important to correctly identify and quantify the presence of carotid plaque. Using CUS, several studies have tried to measure the presence of plaque within the walls of the carotid artery. 9,23,86 Mathiesen Ellisiv et al 9 and Rundek et al 86 defined the presence of carotid plaque as a protrusion in the lumen above lumen and intima interfaces (focal thickening) with thickness >50% of the adjacent wall thickness. Spence et al 23 measured the carotid PA within both intimal and medial layers of the carotid artery, including the region of focal thickening. The atherosclerotic plaque spreads all across the walls of the carotid artery in both directions (ie, toward the lumen and adventitia—the so-called Glagov phenomenon 87 ). Thus, measurement of TPA throughout the length of the CUS scan is an appropriate approach which was also followed in our study. The automated measurements of both cIMTave and TPA were measured throughout the length of the CUS scan (the so-called full-length measurement).
Comparative Analysis Between TPA and cIMT
Prior to discussing the benefits of using TPA over cIMT, it is important to understand the need for a 2-dimensional metric for capturing the morphological changes in atherosclerotic plaque. It should be noted that atherosclerosis is a multifocal disease, and thus, its imaging should be multipositional. 77 Due to the complex disease formation, the growth of the plaque is bidirectional, that is, toward the lumen and away from the lumen (so-called Glagov phenomenon 87,88 ). Similarly, the growth of the plaque can be aggressive sideways along the longitudinal direction (along with the blood flow). Thus, unidirectional metric tools or bidirectional metric tools are not enough to characterize the disease. One must look beyond the conventional approach of unidirectional and bidirectional distance measurement metrics and search for spread functions like PA to quantify the atherosclerotic disease.
Plaque area can be better computed for carotid plaque regions, unlike cIMT. Further to this, it has been shown that carotid PA is associated with CV events. 89 Several studies have compared carotid PA against the cIMT to evaluate a better predictive ability for CVD or stroke events. 25,90 –93 These studies have reported that the carotid PA provides a greater contribution to predicting CVD/stroke events compared with cIMT. Thus, area representation is more strongly associated with stroke or CV events; hence TPA must be a part of routine screening.
One of the advantages of TPA is in the application of plaque component classification and its quantification. The region or area which corresponds to similar properties of the components of plaque can be identified. These are called homogenous regions. For example, if the plaque has calcium, fibrosis, fibrin, and smooth muscle cells, then using the texture properties, one can identify these components of plaque. Further, the area of these texture regions (corresponding to plaque components) helps in the quantification of the disease. Plaque component identification and their corresponding quantification are vital. 94 –96 Over time, we will see this technology that can compute the areas of different components. In summary, area metrics will be very powerful for the progression of the disease.
Another important benefit of using the TPA computation is a better representation to count the total number of bumps representing plaque growth in the carotid arterial walls. Since the area representation of a region can give the shape of the region easily, this shape analysis can be used for the identification of the stenotic bumps in the carotid artery. Typically, stenosis is determined by the growth of the plaque when compared with the location (along the carotid artery) where there is no growth (normal condition). 96 –98 These stenotic points are the bumps which represent more strongly the measure of area. Therefore, image-based stenosis can be validated using the area method where bumps are present or identified. The number of bumps accounts for disease complexity, 99 typically called a plaque score.
It must be noted that the PA in the bulb is more meaningful compared with cIMT. 100 In general, the shape of the bulb is curved due to the geometry of the flow divider. Thus, in the cup-shaped region, the distance computation method requires the centerline approach for cIMT estimation. Unlike the polyline distance method, the centerline method is more computationally expensive. This is because one needs to compute the orthogonal chords (the chord is a segment that joins the corresponding points between LI and MA) perpendicular to the centerline. 59 So, the regional analysis like TPA is advantageous compared with cIMT while undergoing plaque in bulb analysis.
Finally, the carotid PA when fused with the grayscale feature can be used in machine learning paradigm for online risk stratification. Classification of patient risk is very important both in routine mode and in 10-year risk mode. 83,101 Fusion technology has been shown to have an advantage while performing a CVD risk assessment. 78,102 Grayscale morphological plaque features or tissue characterization has shown powerful results for risk stratification. 103 –107 Machine learning and extreme learning machines has recently shown that CVD risk stratification by the amalgamation of this morphological grayscale feature with phenotype measurements leads to higher accuracy for risk stratification. 65,108 Total plaque area is one of the key features which can be amalgamated with grayscale plaque features for the online risk stratification using the machine learning paradigm. 109 –111 Big data framework can be adapted with all CUSIP features inclusive of TPA and cIMT (ie, cIMTave, cIMTmax, cIMTmin, IMTV, and TPA) along with grayscale features (with different characteristics having different order statistics) 112,113 in machine/deep learning framework. 114 Lastly, multimodality registrations can be carried out, which combines ultrasound with MRI for superior plaque component analysis and feature extraction, 113,115 leading to stronger risk assessment.
Effect of Outlier Removal
Outliers in the data were observed by visual inspection using regression analysis. The retrospective analysis of 339 South Asian Indian patients resulted in outliers of ∼2% (8 patients). The removal of outliers reported an overall improvement in correlation between (1) mean TPA and eGFR by ∼7% (with outliers CC = −0.28, P < .001 and without outliers CC = −0.30, P < .001) and (2) cIMTave and eGFR by ∼8% (with outliers CC = −0.36, P < .001 and without outliers CC = −0.39, P < .001).
Strengths, Limitations, and Future Extensions of our TPA-eGFR Association System
Our study had the following strengths. (1) Automated full-length measurements of both cIMTave and the TPA. This showed the potential of TPA to be used as a replaceable biomarker of cIMTave in longitudinal risk assessment studies. (2) This is the first study to report a strong association between TPA and eGFR in patients with CKD and T2DM. (3) The association of automated TPA with eGFR in (a) males versus females, (b) diabetic versus nondiabetic patients, and (c) left versus right CCA was also presented for the first time in this study.
The proposed study measured the CUSIPs using the 2-D imaging technique. The 2-D ultrasound has a limitation in that it does not compute 3-D plaque volume, and hence, the complete plaque burden. In the future, we intend to investigate the association between complete plaque burden measured using the 3D ultrasound imaging and the eGFR. However, the 3D volume computation method is expensive. The main purpose of our methodology was to carry out the analysis fast and at a low cost. Both these objectives are defeated by 3-D imaging and volume computation. The price is high and it is time computational, unlike the 2-D area method which is computed in a few seconds. Further, there are challenges such as (1) 3-D acquisition and reconstruction, 116 –118 (2) 3-D postprocessing of the ultrasound volume due to manual adjustments in individual slices and its propagation, 116,117 (3) 3-D plaque volume computation in curved arteries, 116,117 and (4) promoting economies of scale model for 3D technology. Thus, in this sense, the 2D ultrasound imaging can be used in routine assessment compared with 3D ultrasound imaging.
Secondly, the power analysis showed that the recruited sample size of 339 was enough to satisfy the hypothesis. Still, we intend to analyze the association between automated TPA and eGFR using a longitudinal study with a large sample size of a diversified cohort.
In our proposed study, 93.5% of the patients were diabetic (ie, HbA1c ≥6.5%) and only 6.5% of patients were nondiabetic. Similarly, out of 339, ∼77% patients had CKD (ie, stage 1 to stage 5 with eGFR <90 mL/min/1.73 m2) and 23% were without CKD (eGFR ≥90 mL/min/1.73 m2). From the distribution of the database, there is an unbalance population between diabetic and nondiabetic patients. This is primarily due to the nature of the in-patient section of the M. V. Diabetes Hospital, Chennai, India (as discussed in the section “Study Population”). Therefore, in the future, we intend to collect more data over time to have a balanced nature of the cohort. Furthermore, we intend to investigate the association between TPA and the biomarkers of (eg, uric acid and albumin to creatinine ratio). Currently, few efforts have been made to assess the 10-year risk of CVD/stroke by considering the CKD status of patients. 119 We intend to provide a composite risk score by combining both the CUSIP and the biomarkers of CKD.
Conclusions
We presented a novel and automated TPA (using AtheroEdge system from AtheroPoint) that was associated with a renal disease biomarker (ie, eGFR). In our cross-sectional study (339 South Asian Indian patients with CKD), we found the negative correlations between TPA and eGFR in both sexes. Furthermore, such an association was greater in non-T2DM patients compared with T2DM patients, indicating that non-T2DM patients with CKD are at higher risk of developing carotid atherosclerosis. Finally, LCCA had a higher CC between TPA and eGFR compared with the RCCA.
Supplemental Material
Supplemental Material, Appendix - Morphological Carotid Plaque Area Is Associated With Glomerular Filtration Rate: A Study of South Asian Indian Patients With Diabetes and Chronic Kidney Disease
Supplemental Material, Appendix for Morphological Carotid Plaque Area Is Associated With Glomerular Filtration Rate: A Study of South Asian Indian Patients With Diabetes and Chronic Kidney Disease by Anudeep Puvvula, Ankush D. Jamthikar, Deep Gupta, Narendra N. Khanna, Michele Porcu, Luca Saba, Klaudija Viskovic, Janet N. A. Ajuluchukwu, Ajay Gupta, Sophie Mavrogeni, Monika Turk, John R. Laird, Gyan Pareek, Martin Miner, Petros P. Sfikakis, Athanasios Protogerou, George D. Kitas, Andrew Nicolaides, Vijay Viswanathan and Jasjit S. Suri in Angiology
Footnotes
Authors’ Note
All authors’ contribution attributes are as follows: (1) substantial contributions to conception and design, or acquisition of data, or analysis and interpretation of data, (2) drafting the article or revising it critically for important intellectual content, and (3) final approval of the version to be published.
Acknowledgments
The authors acknowledge the following: AtheroEdge system is from AtheroPoint, California, and is 510(K) FDA cleared product; ImgTracer system is from Global Biomedical Technologies, Inc, California, a research tool developed for users around the world for general manual tracings on vascular images such as longitudinal images or cross-sectional slices of arteries such as carotid or coronary. Authors of this manuscript would like to thank Dr Michele Porcu, MD, Department of Radiology, University of Cagliari, Italy, for retrospectively analyzing the CUS scans and performing the manual measurements using ImgTracer. The authors of this manuscript want to acknowledge the M. V. Hospital, Royapuram, Chennai, India, for providing the clinical database to conduct this study. A.D.J. would like to thank the Ministry of Human Resource and Development, Government of India for providing financial support to conduct part of his PhD dissertation at Visvesvaraya National Institute of Technology, Nagpur, India.
Declaration of Conflicting Interests
The author(s) declared the following potential conflicts of interest with respect to the research, authorship, and/or publication of this article: Suri is affiliated to AtheroPoint, focused in the area of stroke and cardiovascular imaging.
Funding
The author(s) received no financial support for the research, authorship, and/or publication of this article.
Supplemental Material
Supplemental material for this article is available online.
References
Supplementary Material
Please find the following supplemental material available below.
For Open Access articles published under a Creative Commons License, all supplemental material carries the same license as the article it is associated with.
For non-Open Access articles published, all supplemental material carries a non-exclusive license, and permission requests for re-use of supplemental material or any part of supplemental material shall be sent directly to the copyright owner as specified in the copyright notice associated with the article.