
Abstract
Simple renal cysts (SRC) are associated with the development of abdominal aortic aneurysms (AAA). We hypothesized that patients with AAA and SRC have increased arterial stiffness (AS) compared with patients without SRC. Patients (n=223) with an infrarenal AAA undergoing pulse wave analysis were recruited. Brachial-ankle pulse wave velocity (PWV) was measured (automated oscillometric method) as an index of AS. Participants were categorized into those with increased AS and those with normal/borderline AS (threshold: 1800 cm/s); 134 patients (60.1%) had increased AS and 89 (39.9%) patients had normal/borderline AS. Multivariable analyses showed that age ≥75 years (odds ratio [OR], 2.83; 95% confidence interval [CI], 1.51–5.72; P=.002), systolic blood pressure ≥140 mmHg (OR, 5.05; 95% CI, 2.35–10.83; P<.001), hypertension (OR, 2.28; 95% CI, 1.08–4.79; P=.030), and presence of SRC (OR, 1.89; 95% CI, 1.03–3.46; P=.040) were independent risk factors for increased AS. The presence of SRC is an independent risk factor for increased AS in patients with an AAA. This association suggests that patients with SRC may have severe aortic wall degeneration and thus the presence of SRC may be pathologically linked to the development of AAA.
Introduction
The pathophysiology of abdominal aortic aneurysm (AAA) includes decreased numbers of elastic fibers as well as increased collagen in the arterial wall. 1 These alterations in the composition of the extracellular matrix within the arterial wall result in a change of arterial stiffness (AS). In other words, arterial elasticity plays an important role in the development and/or progression of AAA. 2 Previous studies have shown that development of AAA is related to increased AS.3-5
Recently, it has been reported that several clinical conditions, including intracranial aneurysm, aortic arch anomalies, bicuspid aortic valve, temporal arteritis, a positive history of aneurysmal disease, a positive thumb-palm sign, and presence of simple renal cysts (SRC), are linked to aneurysm development; these diseases are possible manifestations of common connective tissue degeneration. 6 SRC are a fluid collection in the kidney that is usually benign in nature and a common finding on imaging tests. Recently, several authors have shown an association between SRC and the development of AAA.7-9 Therefore, we hypothesized that patients with AAA and SRC have increased AS compared with patients without SRC.
The present study evaluated AS by using pulse wave velocity (PWV) and investigated whether the presence of SRC was associated with increased AS in patients with AAA. PWV is calculated as the distance traveled by the pulse wave divided by the time taken to travel that distance, and is widely used as a measure of AS.10-13
Materials and Methods
Patients
Data on patients with AAA treated by endovascular aortic repair (EVAR) between March 2013 and March 2020 were obtained from a prospectively maintained database at the Department of Cardiovascular Surgery, Tokyo Medical University Hospital, and were retrospectively analyzed. During the study period, pulse wave analysis was performed on 238 patients with infrarenal AAA. Of these patients, 223 patients were included in this study after selection based on the exclusion criteria; patients treated for infectious aneurysms or anastomotic pseudoaneurysms or ruptured aneurysms were excluded, as were those with a history or family history of genetic cystic diseases such as tuberous sclerosis, von Hippel-Lindau disease, or autosomal dominant polycystic kidney disease; patients with an ankle-brachial pressure index (ABI) <.9 in both legs were also excluded to avoid potential measurement artifact via reduced distal arterial circulation in the lower extremities. 10
At the initial consultation, all the patients were asked whether they were willing to provide written informed consent for their clinical data to be used for scientific presentations or publications. The procedures followed were in accordance with the ethical standards of the responsible committees on human experimentation (institutional and national) and the Helsinki Declaration of 1975, as revised in 2008. This study was approved by the clinical research committee of Tokyo Medical University, where it was performed (TS2020-0388, January 15, 2021).
Clinical risk factors for increased AS, including age, female gender, smoking history, obesity (body mass index [BMI] ≥25 kg/m2), hypertension, dyslipidemia, diabetes mellitus, chronic obstructive pulmonary disease (COPD, defined as forced expiratory volume in 1 s <70%), chronic kidney disease (CKD, defined as estimated glomerular filtration rate [eGFR] <30 mL/min/1.73 m2), cerebrovascular disease, ischemic heart disease, inflammatory status defined as C-reactive protein (CRP) >.3 μg/mL, and use of antiplatelet drugs (aspirin and/or clopidogrel), statins, and ß-blockers, were included in the analyses. Hypertension was defined as a systolic or diastolic blood pressure of ≥140 or ≥90 mmHg or if a patient was taking antihypertensive medication. Diabetes mellitus was diagnosed if a patient had a hemoglobinA1C level >6.2%, a fasting plasma glucose concentration of >126 mg/dL, or a history of taking any anti-hyperglycemic medication. 14
Evaluation of Arterial Stiffness
Brachial-ankle PWV was measured using an automated oscillometric method (model BP-203RPEIII; Omron Colin Corp, Tokyo, Japan) at our vascular laboratory. The subject was laid in the supine position, with electrocardiogram electrodes placed on both wrists, a microphone on the left edge of the sternum, and cuffs wrapped on both the upper arms and ankles. Pulse volume waveform at the upper arm and ankle was recorded using a semiconductor pressure sensor (the sample acquisition frequency for PWV was set at 1200 Hz). PWV was measured after 5 min rest. The higher value of PWV was used in the analysis. The validation of this method has been reported; the interobserver coefficient of variation was 8.4% and the intraobserver coefficient of variation was 10.0%. 10 Blood pressure was simultaneously measured at both arms and legs. The higher values of arm systolic and diastolic blood pressure were used.
According to the Physiological Diagnosis Criteria for Vascular Failure Committee, these patients were categorized into two groups: patients with increased arterial stiffness (PWV ≥1800 cm/s) and those with normal or borderline arterial stiffness (PWV <1800 cm/s); this cutoff value is applicable for assessment of the cardiovascular risk.11-13
Imaging Analysis
Computed tomography (CT) with contrast medium was performed with 1.25 mm collimation. Plain CT was substituted in patients with contrast medium allergy or renal dysfunction (eGFR <30 mL/min/1.73 m 2 ). Aneurysm sac diameter was defined as the minor axis on the largest axial cut of the aneurysm on an axial CT scan. 15 The minor axis was chosen to avoid overestimation of the aneurysm sac diameter because of the tortuosity of the aorta. A small aneurysm was defined as an aneurysm sac diameter <55 mm. 16
SRC were diagnosed based on the Evidence-Based Polycystic Kidney Disease Clinical Practice Guideline 2014, 17 and it was differentiated from genetic polycystic kidney diseases. On contrast-enhanced CT, SRC were defined as a thin-walled lesion (>5 mm) in the kidney with no evidence of enhancement or septation and low attenuation. 18 Duplex scan was performed when contrast-enhanced CT was not available; on a duplex scan, SRC were defined as a sharply defined cyst with well-transmitted sound waves and an absence of any echo. 18
Statistical Analysis
The data are presented as the mean ± standard deviation for continuous variables. The statistical software package PRISM 5 for MAC OS X (GraphPad Software, Inc, La Jolla, CA, USA) and Mac Tahenryoukaiseki Ver.3.0 (Esumi, Tokyo, Japan) were used for statistical analysis. For continuous data, the normality of the distribution was determined using the D'Agostino and Pearson omnibus normality test. Intergroup comparisons were made using the Student’s t-test for normally distributed data and the Mann–Whitney U test for other data. Categorical data were analyzed with Fisher’s exact test or the Pearson χ2 test. Possible risk factors were identified as significant according to univariable analysis (P<.05). Those risk factors for increased AS were estimated using multivariable logistic regression analysis with backward stepwise selection.
Results
Patient Characteristics
Patient characteristics.
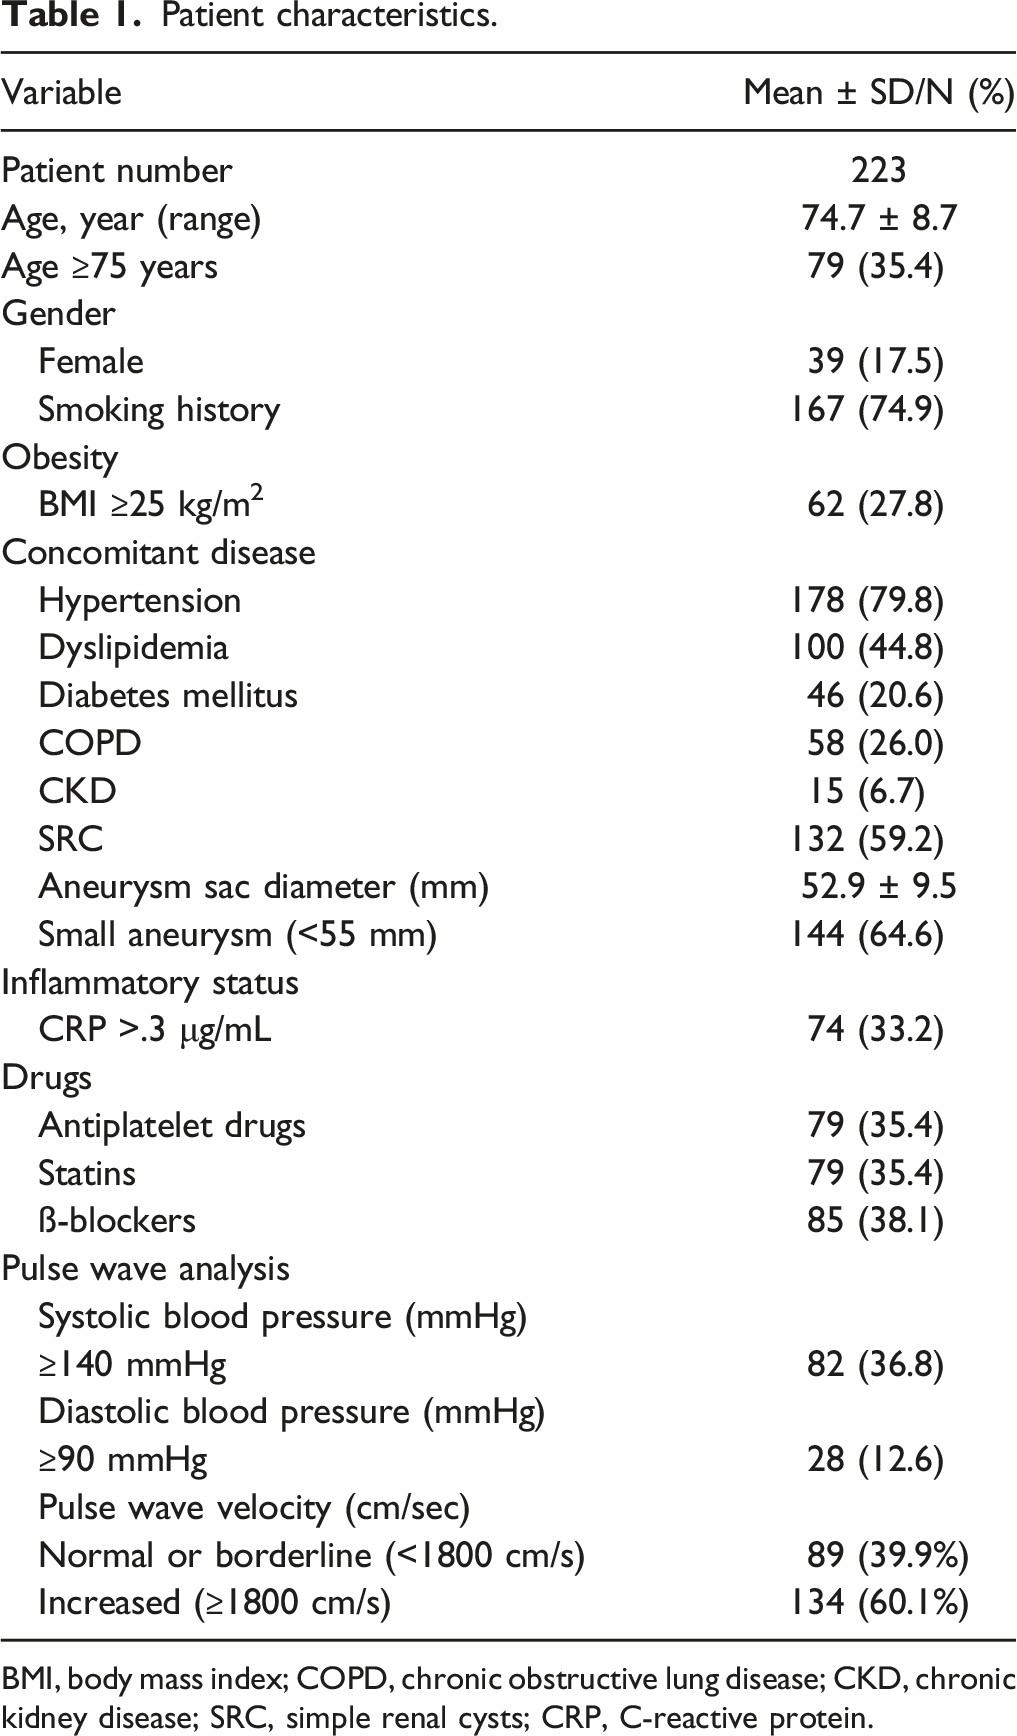
BMI, body mass index; COPD, chronic obstructive lung disease; CKD, chronic kidney disease; SRC, simple renal cysts; CRP, C-reactive protein.
Univariable Analysis for Increased Arterial Stiffness
Univariable and multivariable analyses of risk factors for increased pulse wave velocity (PWV).
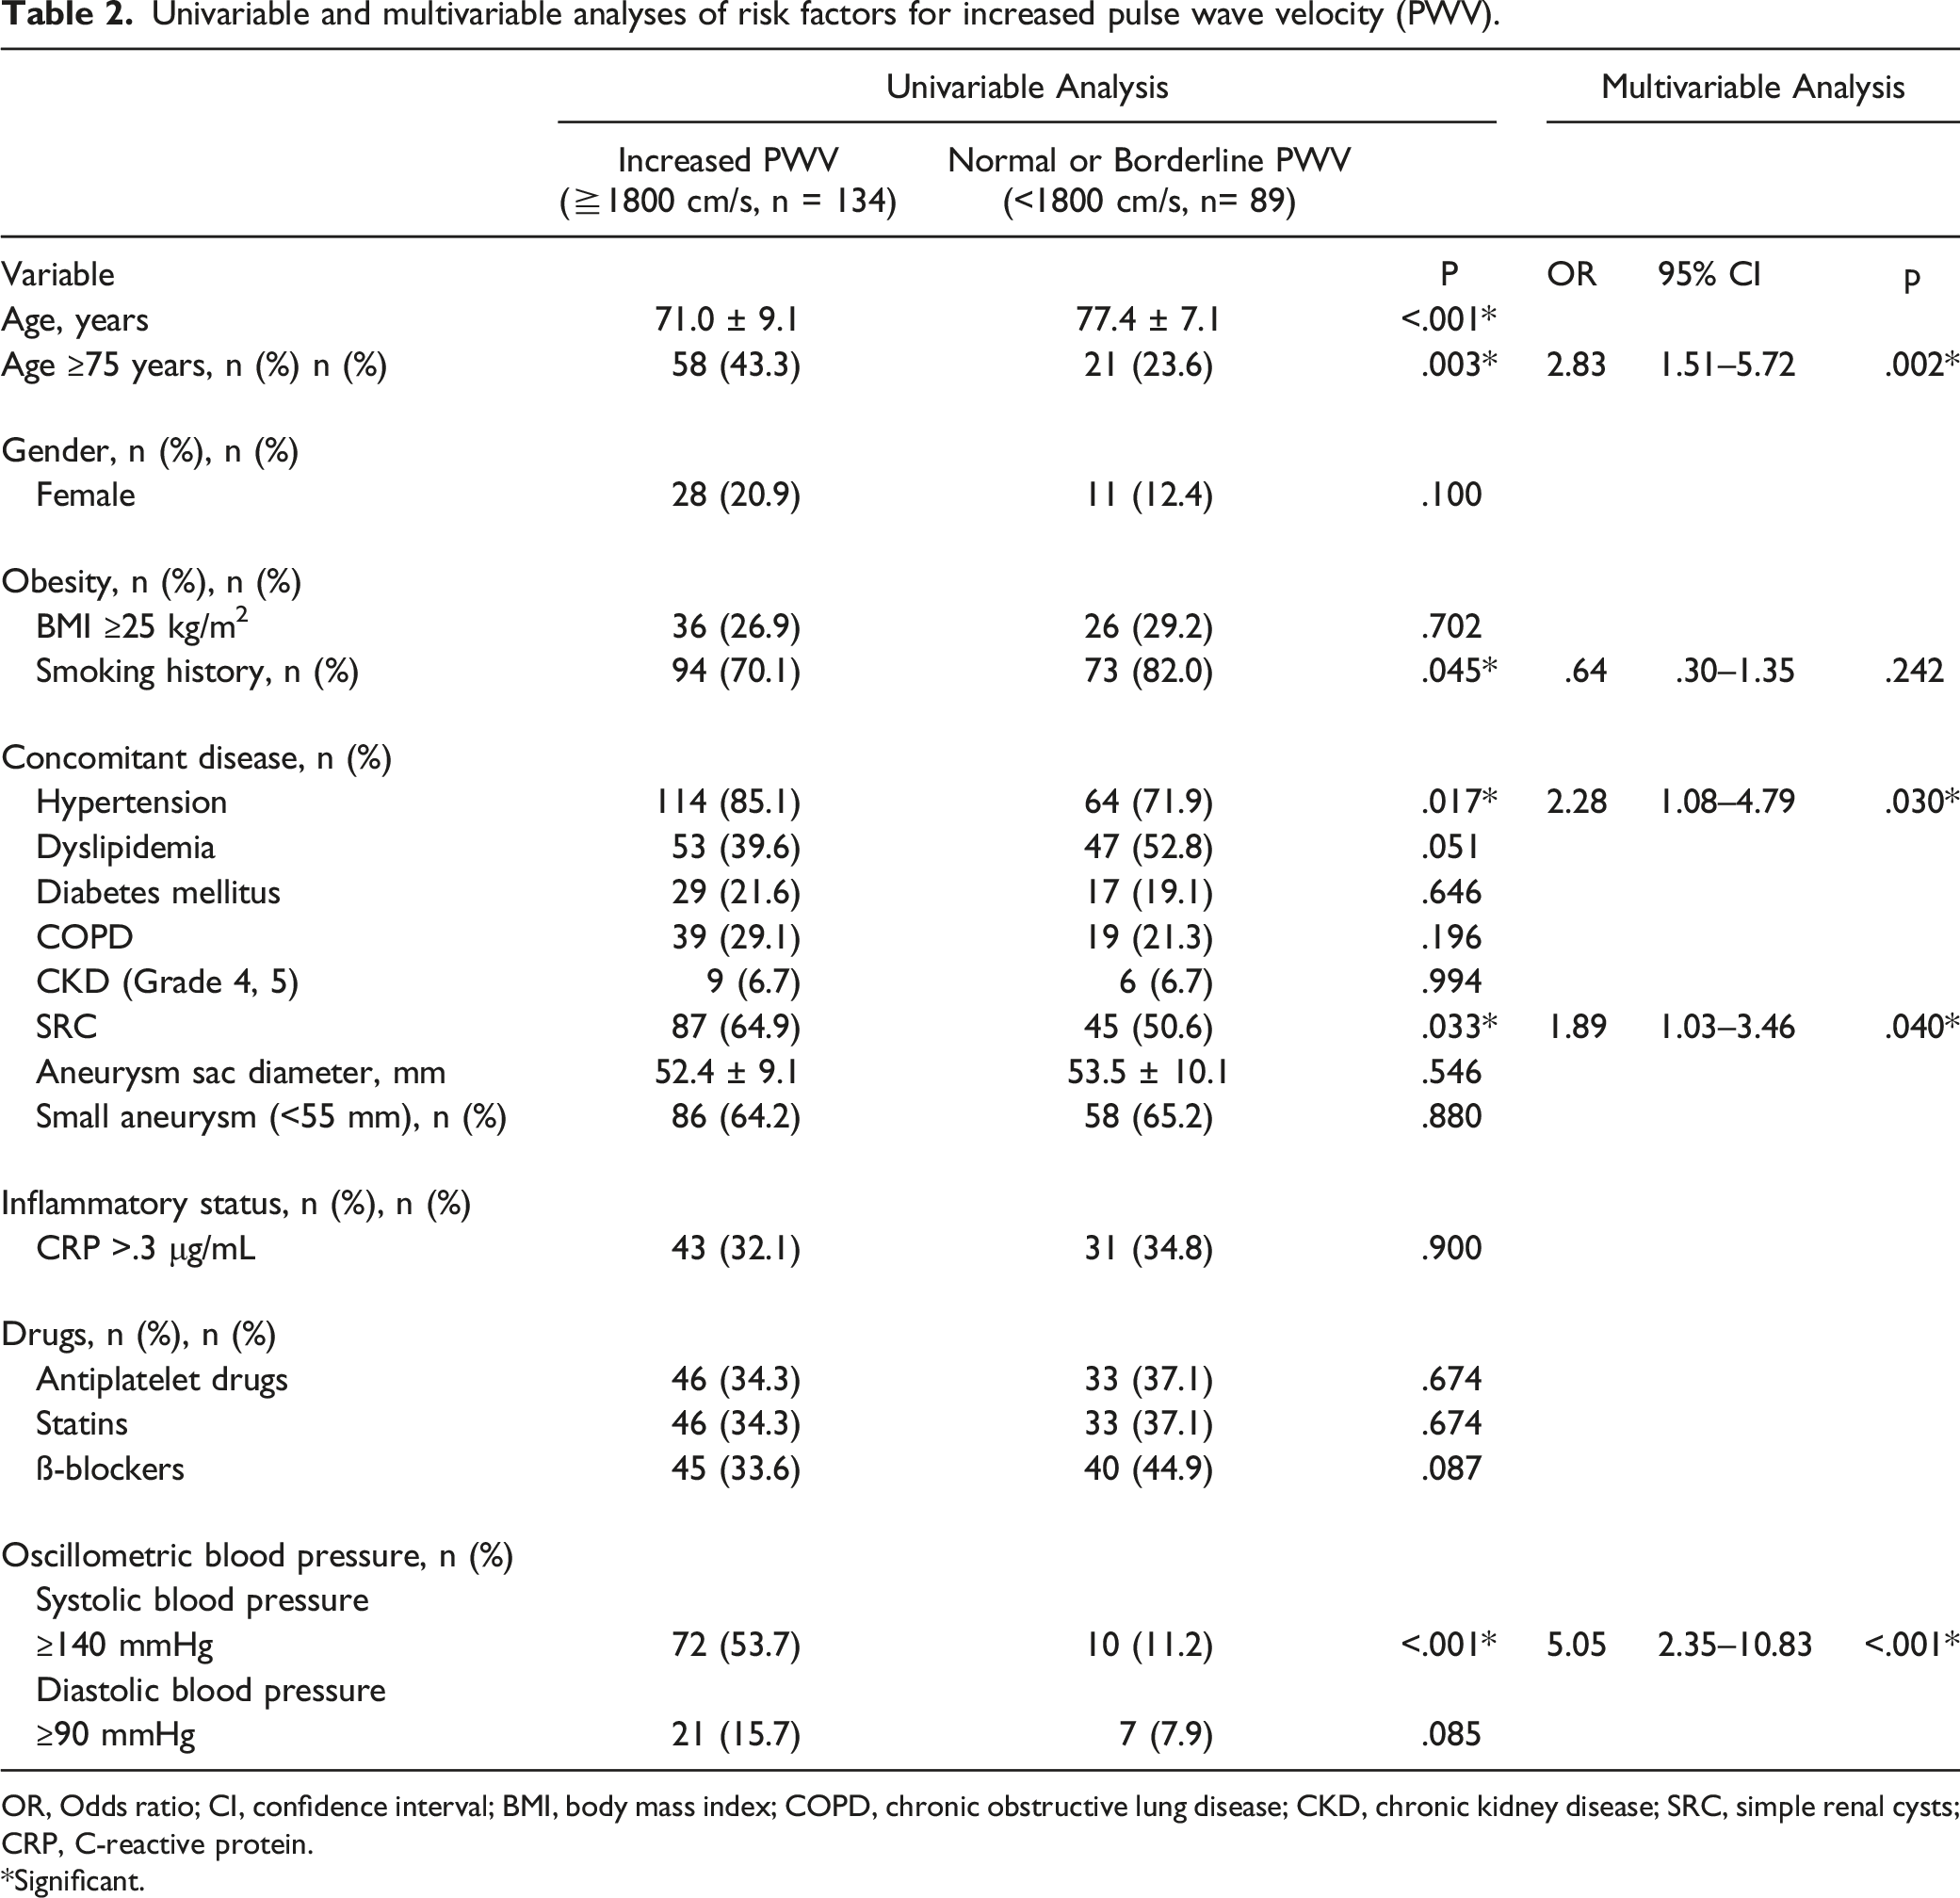
OR, Odds ratio; CI, confidence interval; BMI, body mass index; COPD, chronic obstructive lung disease; CKD, chronic kidney disease; SRC, simple renal cysts; CRP, C-reactive protein.
*Significant.
Multivariable Analysis for Increased Arterial Stiffness
Multivariable logistic regression analysis was performed using age ≥75 years, smoking history, systolic blood pressure ≥140 mmHg, hypertension, and presence of SRC as potential independent risk factors for increased AS. Age ≥75 years (odds ratio [OR], 2.83; 95% confidence interval [CI], 1.51–5.72; P=.002), systolic blood pressure ≥140 mmHg (OR, 5.05; 95% CI, 2.35–10.83; P<.001), hypertension (OR, 2.28; 95% CI, 1.08–4.79; P=.030), and presence of SRC (OR, 1.89; 95% CI, 1.03–3.46; P=.040) were independently associated with increased AS (Table 2).
Discussion
This study shows a positive association between SRC and increased AS (defined as PWV ≥1800 cm/s) in patients with AAA. This association suggests that patients with SRC may have severe aortic wall degeneration compared with patients without SRC and thus the presence of SRC may be pathologically linked to the development of AAA.
Increased AS is defined by a reduction in arterial elasticity, and can be assessed by pulse wave analysis. Stiffness parallels structural changes in the medial layer of the elastic arteries, mainly the aorta and major arterial branches, and is largely the result of progressive elastic fiber degeneration. 19 Several parameters to assess AS have been proposed, including PWV, augmentation index, and central arterial pressure.13,20 Of these parameters, PWV is an estimation of the velocity of the propagation of the forward and backward pressure waves between two points of the arterial tree, and is most commonly used in Japan.11,12 High PWV corresponds to fast propagation of the pulse wave, and is associated with increased AS. Factors that increase PWV include age, hypertension, diabetes mellitus, dyslipidemia, smoking, obesity, and chronic kidney disease. 10 In the present study, the presence of SRC as well as older age (≥75 years), systolic blood pressure (≥140 mmHg), and hypertension were risk factors for increased AS on multivariate analysis (Table 2).
Pulse wave velocity is higher in patients with AAA than healthy control patients, indicating that AAA may be associated with increased AS, in other words, reduced arterial elasticity;3-5 aortic PWV was significantly higher in patients with AAA than control patients, after adjustment for age, sex, and mean arterial pressure. 4 Alterations in arterial wall composition, such as elastin and collagen, and inflammation were proposed as contributors to increased AS in AAA. In this study, the value of PWV was as high as 1919 ± 399 cm/s in all patients with AAA.
It is reasonable to hypothesize a positive correlation: the higher the PWV, the larger may be the diameter of the AAA. However, a positive correlation between PWV and AAA diameter has not been established so far; furthermore, carotid-femoral PWV was not correlated or negatively correlated with AAA diameter.21,22 In the present study, there was no significant difference in the aneurysm sac diameter or in the incidence of small aneurysms between patients with increased AS and those without. PWV may be associated with the presence of AAA, but there is no evidence at this time to suggest that magnitudes of PWV (cm/s) and AAA (diameter, cm) are linked.
An increased prevalence of AAA has been reported in patients with the presence of SRC. SRC had a significantly higher prevalence in patients with AAA than in those without AAA or those with aortoiliac occlusive disease. One meta-analysis included 5 eligible case–control studies enrolling a total of 2897 participants, and demonstrated a 2.5-fold prevalence of SRC in patients with AAA compared with subjects without AAA, suggesting that SRC may be associated with AAA. 4 Another meta-analysis, including 11 retrospective studies, demonstrated that the cumulative incidence of SRC among patients with AAA and no-AAA was 55% and 32%, respectively, with statistically higher odds of 3.02 of SRC among patients with AAA. 5
A common genetic or pathophysiologic link between aortic aneurysms and SRC has been proposed. 2 Some genetic variations of matrix metalloproteinase (MMP)-related genes may be causative factors for the development of SRC and AAA; MMPs are proteolytic enzymes that degrade main structural proteins (eg, elastin, collagen, and fibrillin) and may play an important role in the pathogenesis of AAA and SRC. 2 Therefore, patients with SRC may be more likely to have more severe aortic wall degeneration than those patients without SRC, ultimately leading to the development and/or progression of AAA. Our study shows a 1.89-fold incidence of increased AS (≥1800 cm/s) in patients with AAA as well as with SRC compared to those patients without SRC, supporting this assumption.
Significant aneurysm sac shrinkage is the best expected outcome of EVAR for AAA. 23 Our previous study reported that patients with SRC showed significantly less aneurysm sac shrinkage than those without SRC; since SRC are a manifestation of connective tissue degeneration, they are likely to be a risk factor for failure of aneurysm sac shrinkage after EVAR. 18 From this result, Jordan commented that “we may have an additional marker to help us identify the patient who needs more thorough surveillance. That secondary CT finding that we previously considered unimportant may now be an indicator for more close observation.” 24 Furthermore, the results of this study may explain part of the biomechanical mechanism of aneurysm sac shrinkage after EVAR, and help develop a method to predict aneurysm sac behavior.
Study Limitations
This study has several limitations. First, this was a retrospective study with a small sample size based on a database in a single institution. Second, we evaluated AS by brachial-ankle PWV; it is measured by wrapping pressure cuffs around the four extremities, and is much simpler than carotid-femoral PWV. Although brachial-ankle PWV is influenced by AS of the large (elastic)- to medium (peripheral muscular)-sized arteries, it is well correlated with aortic PWV. 10 Third, the maximum diameter may have been overestimated on an axial CT in a retrospective manner; thin-slice (1.25 mm) CT data were not stored or available in the hospital database for 3D-image reconstruction. Finally, the value of PWV has been binarized to normal or borderline and increased PWV with the threshold of 1800 m/s, but the incidence of SRC may increase continuously along with the elevation of PWV. A larger, prospective study will be required to increase the power of PWV to detect a more convincing relationship between the presence of SRC and AS in patients with AAA.
Conclusions
The presence of SRC is an independent risk factor for increased AS in patients with an AAA. This association suggests that patients with SRC may have severe aortic wall degeneration and thus the presence of SRC may be pathologically linked to the development of AAA.
Footnotes
Declaration of Conflicting Interests
The author(s) declared no potential conflicts of interest with respect to the research, authorship, and/or publication of this article.
Funding
The author(s) received no financial support for the research, authorship, and/or publication of this article.
Data Availability
The de-identified participant data will not be shared