
Abstract
The association of diabetes with increased large artery stiffness is not definitively established. We aimed to describe the carotid-femoral pulse wave velocity (cf-PWV) in participants with and without diabetes and whether the cf-PWV could vary among the different laboratory-based criteria used. A cross-sectional analysis using baseline data from 13,912 adults was used. cf-PWV as well as anthropometric, biochemical, and clinical data were measured. Diabetes was defined by previous medical diagnosis, medication use, fasting glucose, an oral glucose tolerance test (GTT), or glycated hemoglobin (HbA1c). The prevalence of diabetes was 18.7%, higher in men than in women. After adjustment, participants with diabetes showed higher cf-PWV (men: 9.7 ± 1.7 vs 9.4 ± 1.7 m/s, P < .05; women: 9.4 ± 1.6 vs 9.1 ± 1.7 m/s, P < .05). We observed a progressive increase in cf-PWV as >1 laboratory-based criterion for diabetes diagnosis was reached. Also, participants with diabetes with alterations in any laboratory-based criteria had higher cf-PWV than participants without diabetes, regardless of sex. In summary, diabetes is associated with higher cf-PWV as is each laboratory-based parameter used for its diagnosis. These results support the strong consequences of glucose dysregulation on the vascular system and provide evidence to screen all parameters involved in glycemic metabolism to improve vascular health.
Introduction
The vascular system is one of the prime targets of aging in the human body. Large elastic vessels undergo vascular remodeling that is characterized by a slow but continuous increase in the vessel lumen, wall thickening, and extracellular matrix changes with an increase in collagen deposition and elastin breakdown. 1 These alterations induce an increased arterial stiffness, which is mainly influenced by hemodynamic forces (e.g., blood pressure) 2 and extrinsic factors (e.g., hormones and inflammatory mediators), 3 through changes in cellular elements and the extracellular matrix of the vascular wall. 4 All these processes affect the middle layer of arteries and play a crucial role in the acceleration of arterial stiffness, leading to cardiovascular diseases.1,5
At every systole, stiffened arteries are less compliant to the incident pulse wave, increasing the velocity by which it travels through large arteries. As a consequence, the reflected waves also return faster toward the heart, reaching during systole instead of diastole, thus amplifying systolic blood pressure (SBP) and reducing diastolic blood pressure (DBP) with a consequent reduced coronary perfusion, increased left ventricle (LV) afterload, eliciting LV hypertrophy. 4 These consequences are associated with coronary ischemia, facilitation of atheroma plaque formation and disruption, and increased end-organ damage,4,6 thus linking arterial stiffness with increased morbidity and mortality.
Cardiovascular risk factors are known to alter the structural and functional properties of large arteries, thus increasing arterial stiffness with aging. Classical risk factors such as overweight and obesity, high blood pressure, dyslipidemia, hyperuricemia, impaired kidney function, high sodium consumption, and smoking, among others are associated with increased arterial stiffness, which contributes to cardiovascular morbidity and mortality.7-9 Diabetes, another important condition with multiple known effects on the vascular system, is directly linked to the risk of developing cardiovascular diseases. 10 Endothelial dysfunction is a feature usually found in patients with diabetes, with impaired endothelium vasodilator responses, which contribute to increased blood pressure. 11 Moreover, the vascular wall is also an important target of diabetes, accelerating arteriosclerosis, and the increased arterial stiffness in patients with diabetes is strongly associated with major adverse cardiovascular events and mortality. 12
Arterial stiffness can be assessed by non-invasive reliable methods, such as central systolic blood pressure, AIx, and pulse wave velocity (PWV); the PWV between carotid and femoral arteries (cf-PWV) is widely used in clinical and epidemiological studies. 4 cf-PWV is a powerful predictor of all-cause mortality and major cardiovascular events. 13 A recent longitudinal study showed that participants with diabetes have increased PWV, and the determinants of increased PWV over time were blood pressure, glycated hemoglobin (HbA1c), and triglycerides (TG). 14 In fact, studies have reported controversial data on the impact of fasting blood glucose or HbA1c on arterial stiffness,15,16 which might be explained, at least in part, by different study designs, inclusion and exclusion criteria, and different cutoffs used for HbA1c and fasting blood glucose. These controversies may also rely on the characteristics of each laboratory-based criterion as they reflect different metabolic scenarios. For example, Li et al. 17 showed that HbA1c with impaired glucose tolerance, but not with increased fasting glucose, is associated with arterial stiffness in prediabetic individuals. Another study showed that older individuals with impaired glucose tolerance had higher PWV than those with increased fasting glucose. 18 On the other hand, Shin et al. 19 showed that arterial stiffness is associated with fasting glucose even in individuals without diabetes.
Controversy still exists over the possible changes in arterial stiffness caused by diabetes, and whether the cf-PWV could vary among the different criteria used for diagnosing diabetes. Thus, we aimed to fill those knowledge gaps by evaluating cf-PWV in a large sample of adults with and without diabetes participating in the Brazilian Longitudinal Study of Adult Health (ELSA-Brasil study).
Methods
The ELSA-Brasil Study and Participants
The ELSA-Brasil study is a large cohort that included 15,105 adults, aged 35–74 years old at baseline (2008–2010). All participants were civil servants of public universities or research institutions in six Brazilian cities. A detailed description of the study design and the main characteristics of the ELSA-Brasil cohort at baseline was published elsewhere.20,21 The ethics committees of the six study-holding institutions approved the research protocol, and all participants signed written consent before data collection. For the present study, we excluded 977 participants with self-reported previous cardiovascular disease (myocardial infarction, stroke, congestive heart failure, coronary revascularization, including use of vascular stents) and 372 participants in whose cf-PWV measurements were not validated. Based on 156 participants with overlapping excluding criteria (both self-reported cardiovascular disease and a non-validated cf-PWV measurement), the final sample evaluated in the present study was 13,912.
Clinical and Anthropometric Measurements
All participants enrolled in the ELSA-Brasil cohort were invited to visit one of the six investigation centers responsible for data acquisition. Clinical and anthropometric data and laboratory tests were carried out in the morning. Self-reported medical history, medications under regular use, and sociodemographic information were recorded during an interview.
Laboratory exams were performed on a venous blood sample collected after a 10 to 14 h fasting (water was allowed). Participants were asked to fast, avoid consuming alcohol and caffeinated beverages, and abstain from exercising 12 h before the exams. A standardized 75 g oral glucose tolerance test (GTT) was performed on all participants without known diabetes utilizing an anhydrous glucose solution. Samples were processed by a central laboratory to measure total cholesterol, high-density lipoprotein cholesterol (HDL-C), TG, and low-density lipoprotein cholesterol (LDL-C) (assessed via Friedewald equation for TG <400 mg/dL or measured by a direct method when TG ≥400 mg/dL), fasting and post-GTT blood glucose, HbA1c, and uric acid levels. In the ELSA-Brasil cohort, 22 diabetes was defined as having at least one of the following: (i) fasting blood glucose ≥126 mg/dL (7.0 mmol/L); (ii) 2-h post-GTT blood glucose ≥200 mg/dL (11.1 mmol/L), (iii) HbA1c ≥ 6.5%, (iv) the regular use of glucose-lowering medications, or, (v) a previous medical diagnosis of diabetes.
Bodyweight (Toledo Scale; São Bernardo do Campo, Brazil) and height (Seca Stadiometer; Hamburg, Germany) were obtained by trained technicians, and body mass index (BMI) was calculated as the ratio between weight and squared height (kg/m2). SBP, DBP, and heart rate were measured in the seated position after a 5 min rest. Three consecutive readings were obtained with an oscillometric device (OMRON HEM 705CPINT, São Paulo, Brazil) with nearly 2 min intervals between readings in a quiet and temperature-controlled (20–24°C) room. The mean of the two last measures of blood pressure and heart rate were calculated. Hypertension was defined as SBP >140 mmHg and/or DBP >90 mmHg, or the use of any blood pressure-lowering medication. The estimated glomerular filtration rate (eGFR) was calculated according to the Chronic Kidney Disease Epidemiology Collaboration. 23
Cf-PWV Assessment
Participants were positioned in the supine position and cf-PWV was measured using a validated automatic device (Complior; Alam Medical, Paris, France) following standard protocols. 8 Briefly, with participants in the supine position, blood pressure was recorded in the right arm using a validated oscillometric device (OMRON HEM 705CPINT, São Paulo, Brazil). Pulse waveforms were captured by sensors placed at the right carotid and femoral arteries. The direct distance from the suprasternal notch to the right femoral site where the pulse was recorded was measured with a metric tape. The cf-PWV was calculated by dividing the distance from the suprasternal notch to the femoral site by the time delay between the carotid and the femoral pulse waves, and it was expressed in m/s. The individual value was automatically recorded as the average of the measurements that were obtained in 10 consecutive cardiac cycles recorded under regular cardiac rhythm.
Statistical Analyses
Data are described as the mean ± standard deviation. The adequacy of a normal distribution was evaluated with the Kolmogorov–Smirnov test. The chi-squared test was used to compare frequencies. Comparisons between participants with and without diabetes regarding their clinical and anthropometric characteristics were performed with the unpaired Student t-test. Analyses of covariance (ANCOVA) were applied to assess the association between cf-PWV over different criteria for diabetes classification, in the presence of age, SBP, BMI, uric acid levels, eGFR, TG, and use of glucose-lowering medication as covariates. We also tested the difference in cf-PWV between participants with and without diabetes using an unadjusted model, and progressive adjusted models, considering age, BMI, uric acid levels, eGFR, SBP, TG, and glucose-lowering medication as confounders.
Statistical analysis was performed using SPSS (version 22.0; SPSS, Inc, Chicago, IL, USA). For all analyses, the statistical significance was set at a two-sided p < .05.
Results
Clinical and anthropometric characteristics of participants with or without diabetes in the ELSA-Brasil study.
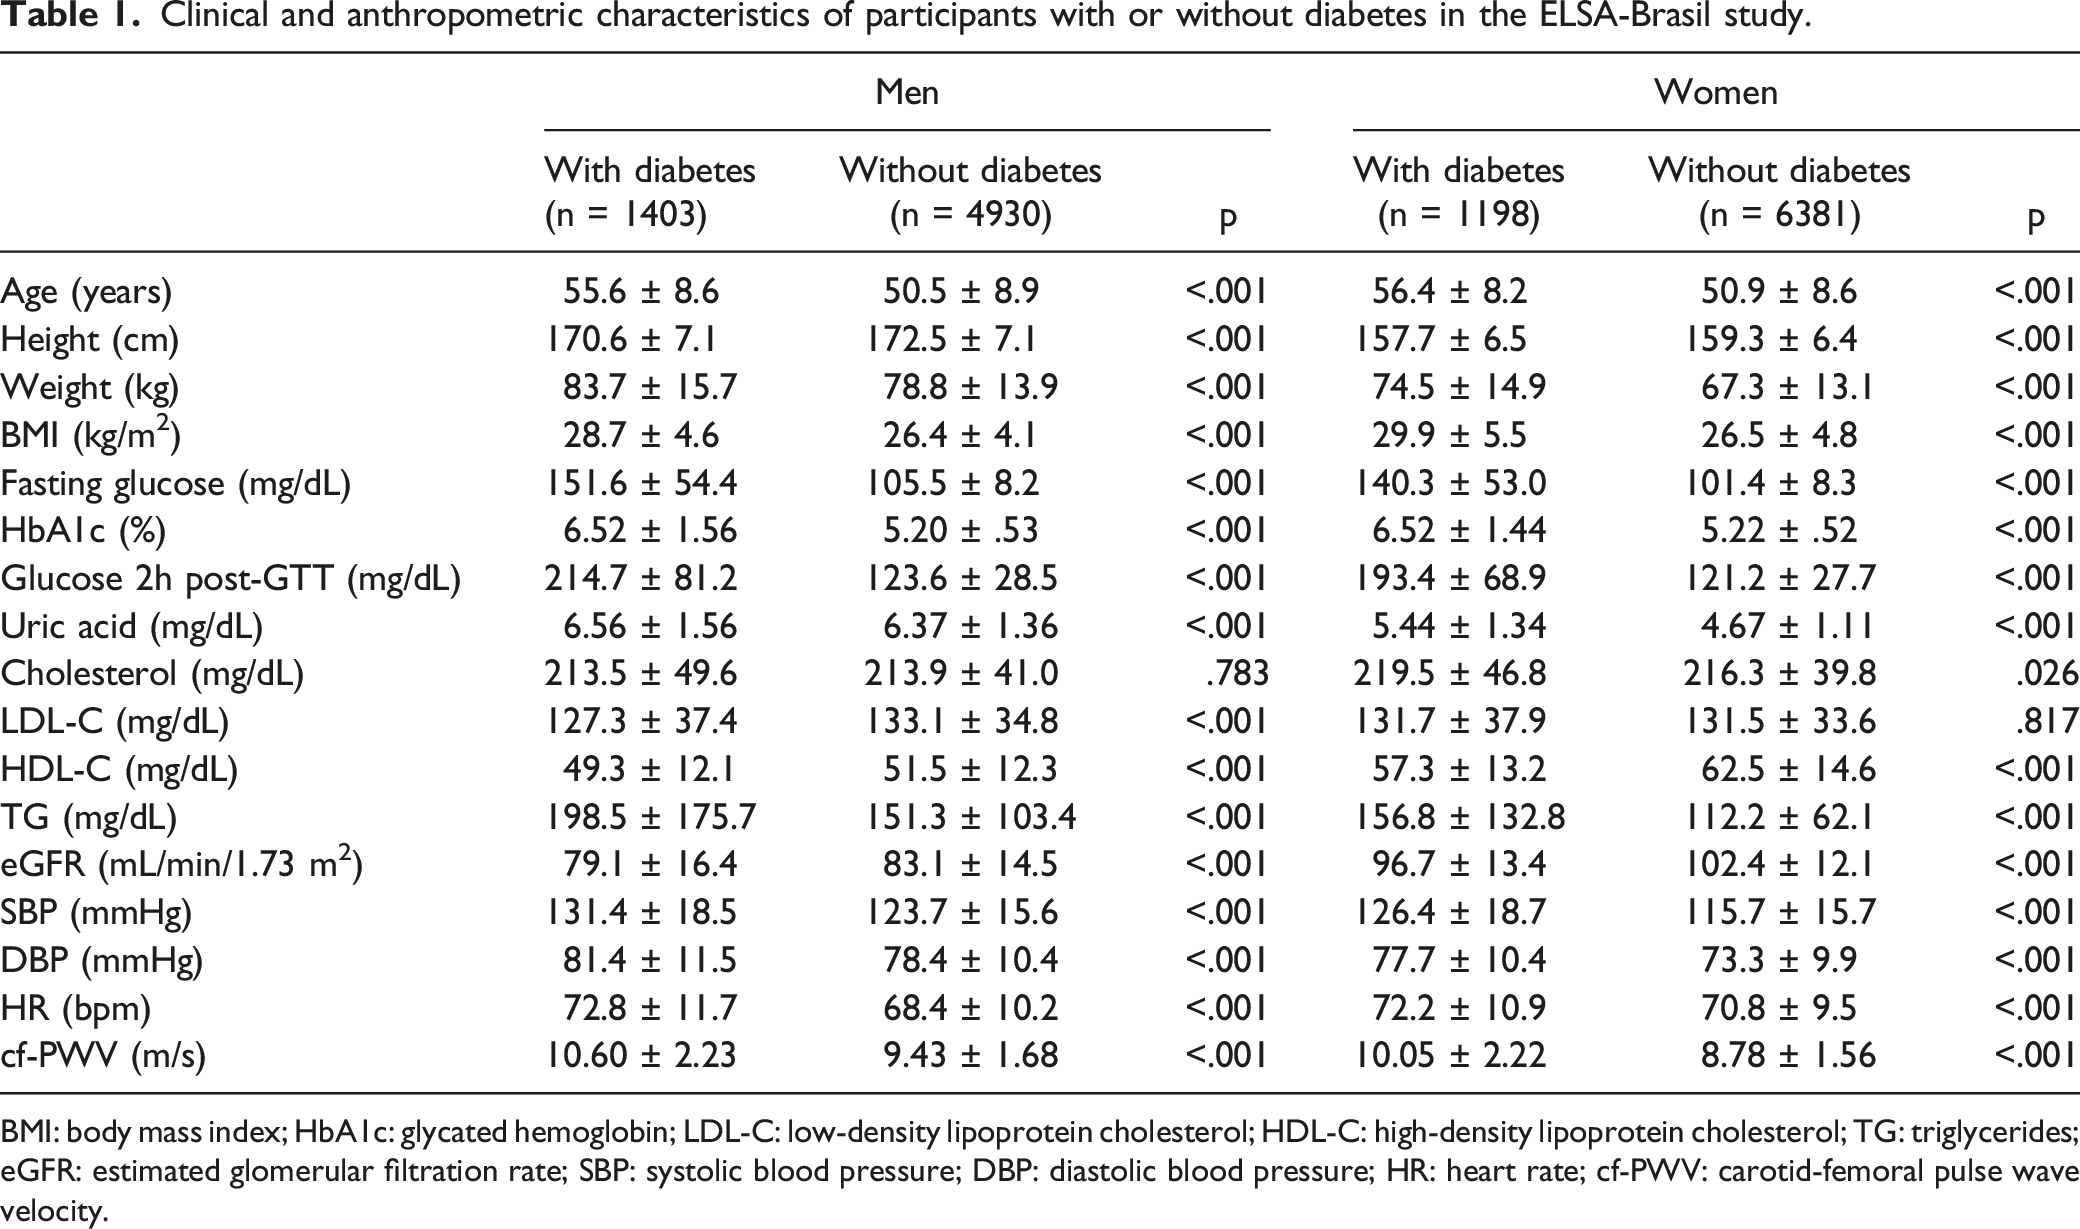
BMI: body mass index; HbA1c: glycated hemoglobin; LDL-C: low-density lipoprotein cholesterol; HDL-C: high-density lipoprotein cholesterol; TG: triglycerides; eGFR: estimated glomerular filtration rate; SBP: systolic blood pressure; DBP: diastolic blood pressure; HR: heart rate; cf-PWV: carotid-femoral pulse wave velocity.
We next investigated the SBP (Figures 1(A) and 1(B)) and the cf-PWV (Figures 1(C) and 1(D)) across age categories in men and women after adjusting for confounders (BMI, eGFR, uric acid levels, TG, use of any glucose-lowering drug). Although SBP increases with age in all groups, participants with diabetes have higher SBP values compared with participants without diabetes, regardless of sex. Likewise, cf-PWV increased progressively with age, being higher in those with diabetes even after adjusting for SBP, BMI, eGFR, TG, uric acid levels, and use of hypoglycemic medication (Figure 1(C) and 1(D)). Panels A and B show the values of the SBP with age (by decades) in participants with or without diabetes, after adjustment for BMI, eGFR, uric acid levels, TG, and the use of hypoglycemic medication. Panels C and D show the changes in cf-PWV with age in participants with or without diabetes after adjustment for SBP, BMI, eGFR, uric acid levels, TG, and the use of any glucose-lowering drug. * indicates P < .05 vs participants without diabetes in the same age category. SBP: systolic blood pressure; BMI: body mass index; eGFR: estimated glomerular filtration rate; TG: triglycerides; cf-PWV: carotid-femoral pulse wave velocity.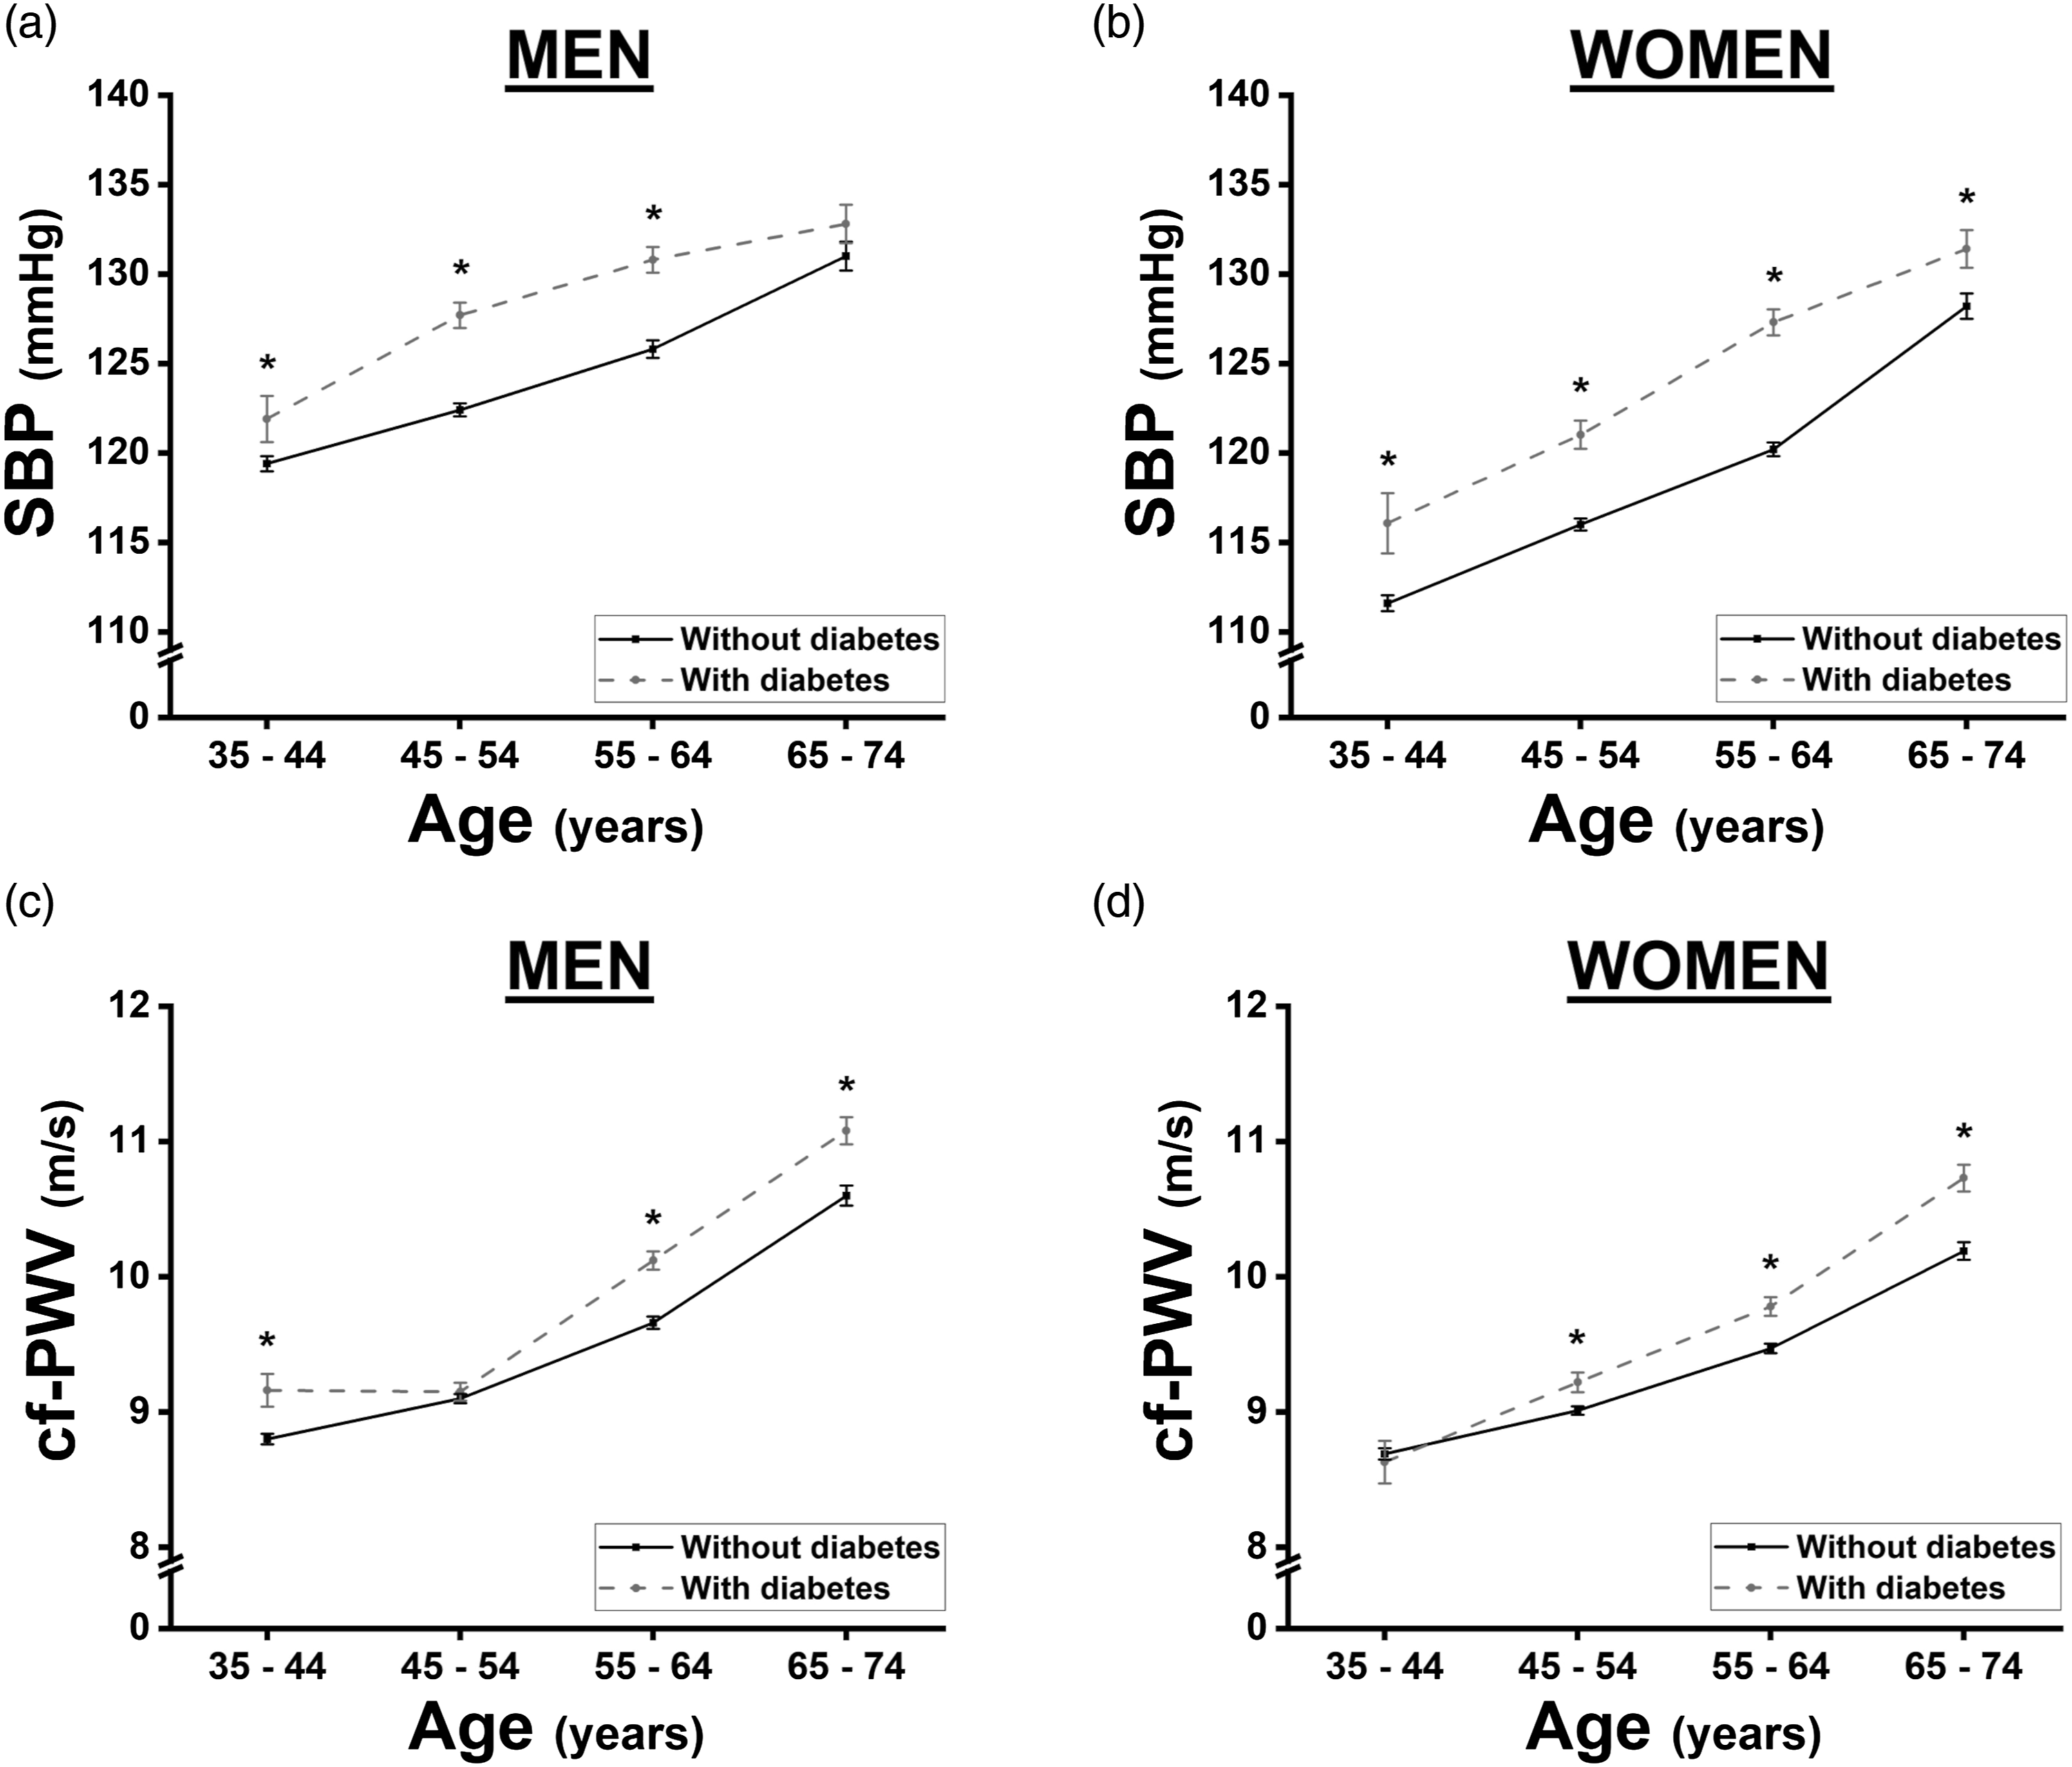
Crude and adjusted carotid-femoral pulse wave velocity (m/s) stratified by sex and diabetes status.
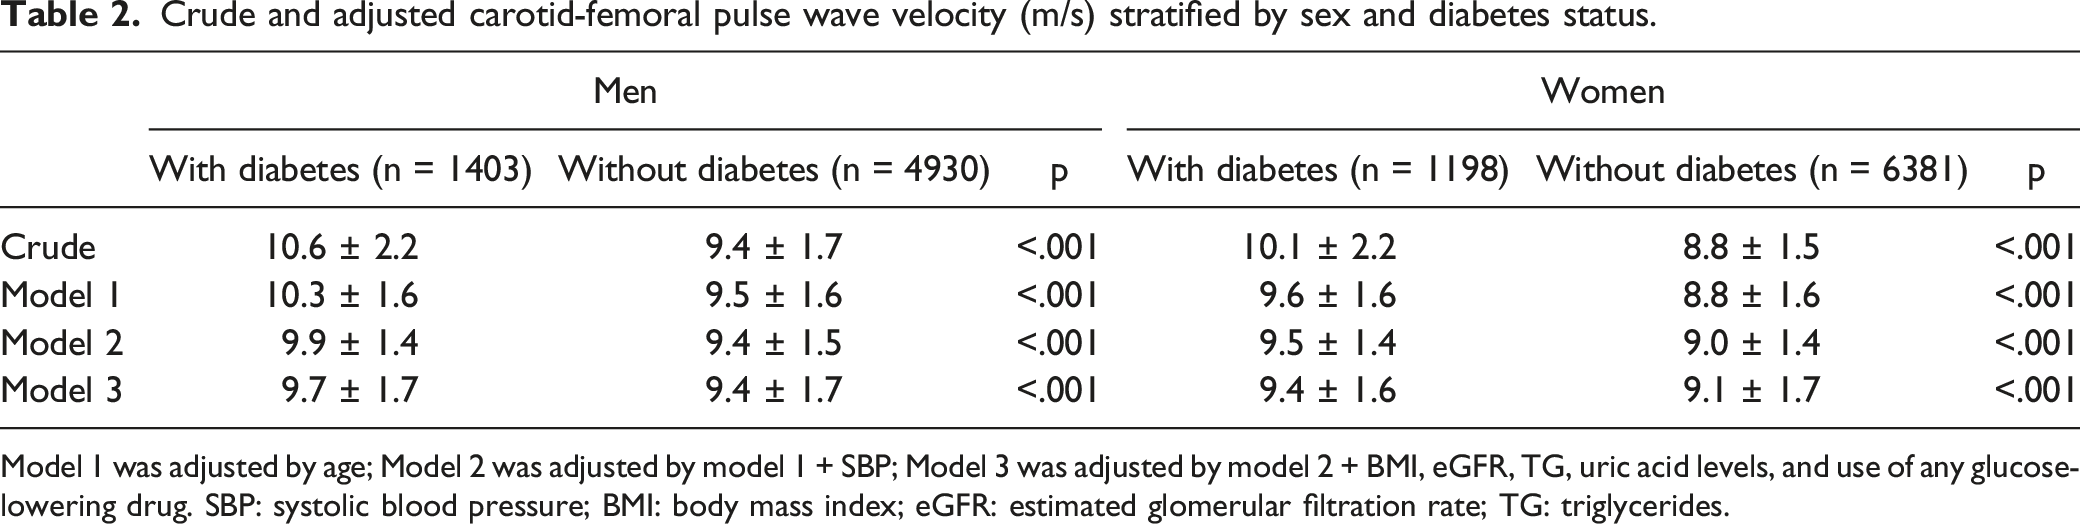
Model 1 was adjusted by age; Model 2 was adjusted by model 1 + SBP; Model 3 was adjusted by model 2 + BMI, eGFR, TG, uric acid levels, and use of any glucose-lowering drug. SBP: systolic blood pressure; BMI: body mass index; eGFR: estimated glomerular filtration rate; TG: triglycerides.
The diabetes classification in the present study was considered as the fulfillment of any of the predetermined criteria: fasting glucose ≥126 mg/dL, HbA1c ≥ 6.5%, blood glucose 2h post-GTT ≥200 mg/dL, the use of glucose-lowering drugs, or a previous medical diagnosis of diabetes. Thus, we next evaluated whether the presence of one or more concomitant criteria could be related to higher cf-PWV values in participants with diabetes. For this analysis, participants using glucose-lowering drugs were excluded, leaving only those diagnosed by the three laboratory-based evaluations. As shown in Figure 2, cf-PWV increases progressively with the addition of a diagnostic criterion, even after adjustment for classical risk factors (age, SBP, BMI, eGFR, TG, and uric acid levels). Participants with diabetes classified by two or more laboratory-based diagnostic criteria showed higher cf-PWV when compared with participants with diabetes based on only one diagnostic criterion, regardless of sex (men: 9.85 ± 1.62 vs 9.58 ± 1.52 m/s, P < .05; women: 9.73 ± 1.58 vs 9.44 ± 1.46 m/s, P < .05). These, in turn, had significantly higher cf-PWV than participants without diabetes (men: 9.58 ± 1.52 vs 9.35 ± 1.75 m/s, P < .05; women: 9.43 ± 1.46 vs 9.15 ± 1.75 m/s, P < .05). Sex-specific cf-PWV values are based on the number of laboratory-based diagnostic criteria for diabetes. For this analysis, we considered only fasting glucose ≥126 mg/dL (7.0 mmol/L), HbA1c ≥ 6.5%, or blood glucose 2h post-GTT ≥200 mg/dL (11.1 mmol/L) as diagnostic criteria, excluding participants with diabetes in the use of glucose-lowering drugs. Results are adjusted by age, SBP, BMI, eGFR, uric acid levels, and TG. * indicates P < .05 vs participants without diabetes; # indicates P < .05 vs participants with diabetes (by only 1 criterion). SBP: systolic blood pressure; BMI: body mass index; eGFR: estimated glomerular filtration rate; TG: triglycerides; cf-PWV: carotid-femoral pulse wave velocity; GTT: glucose tolerance test.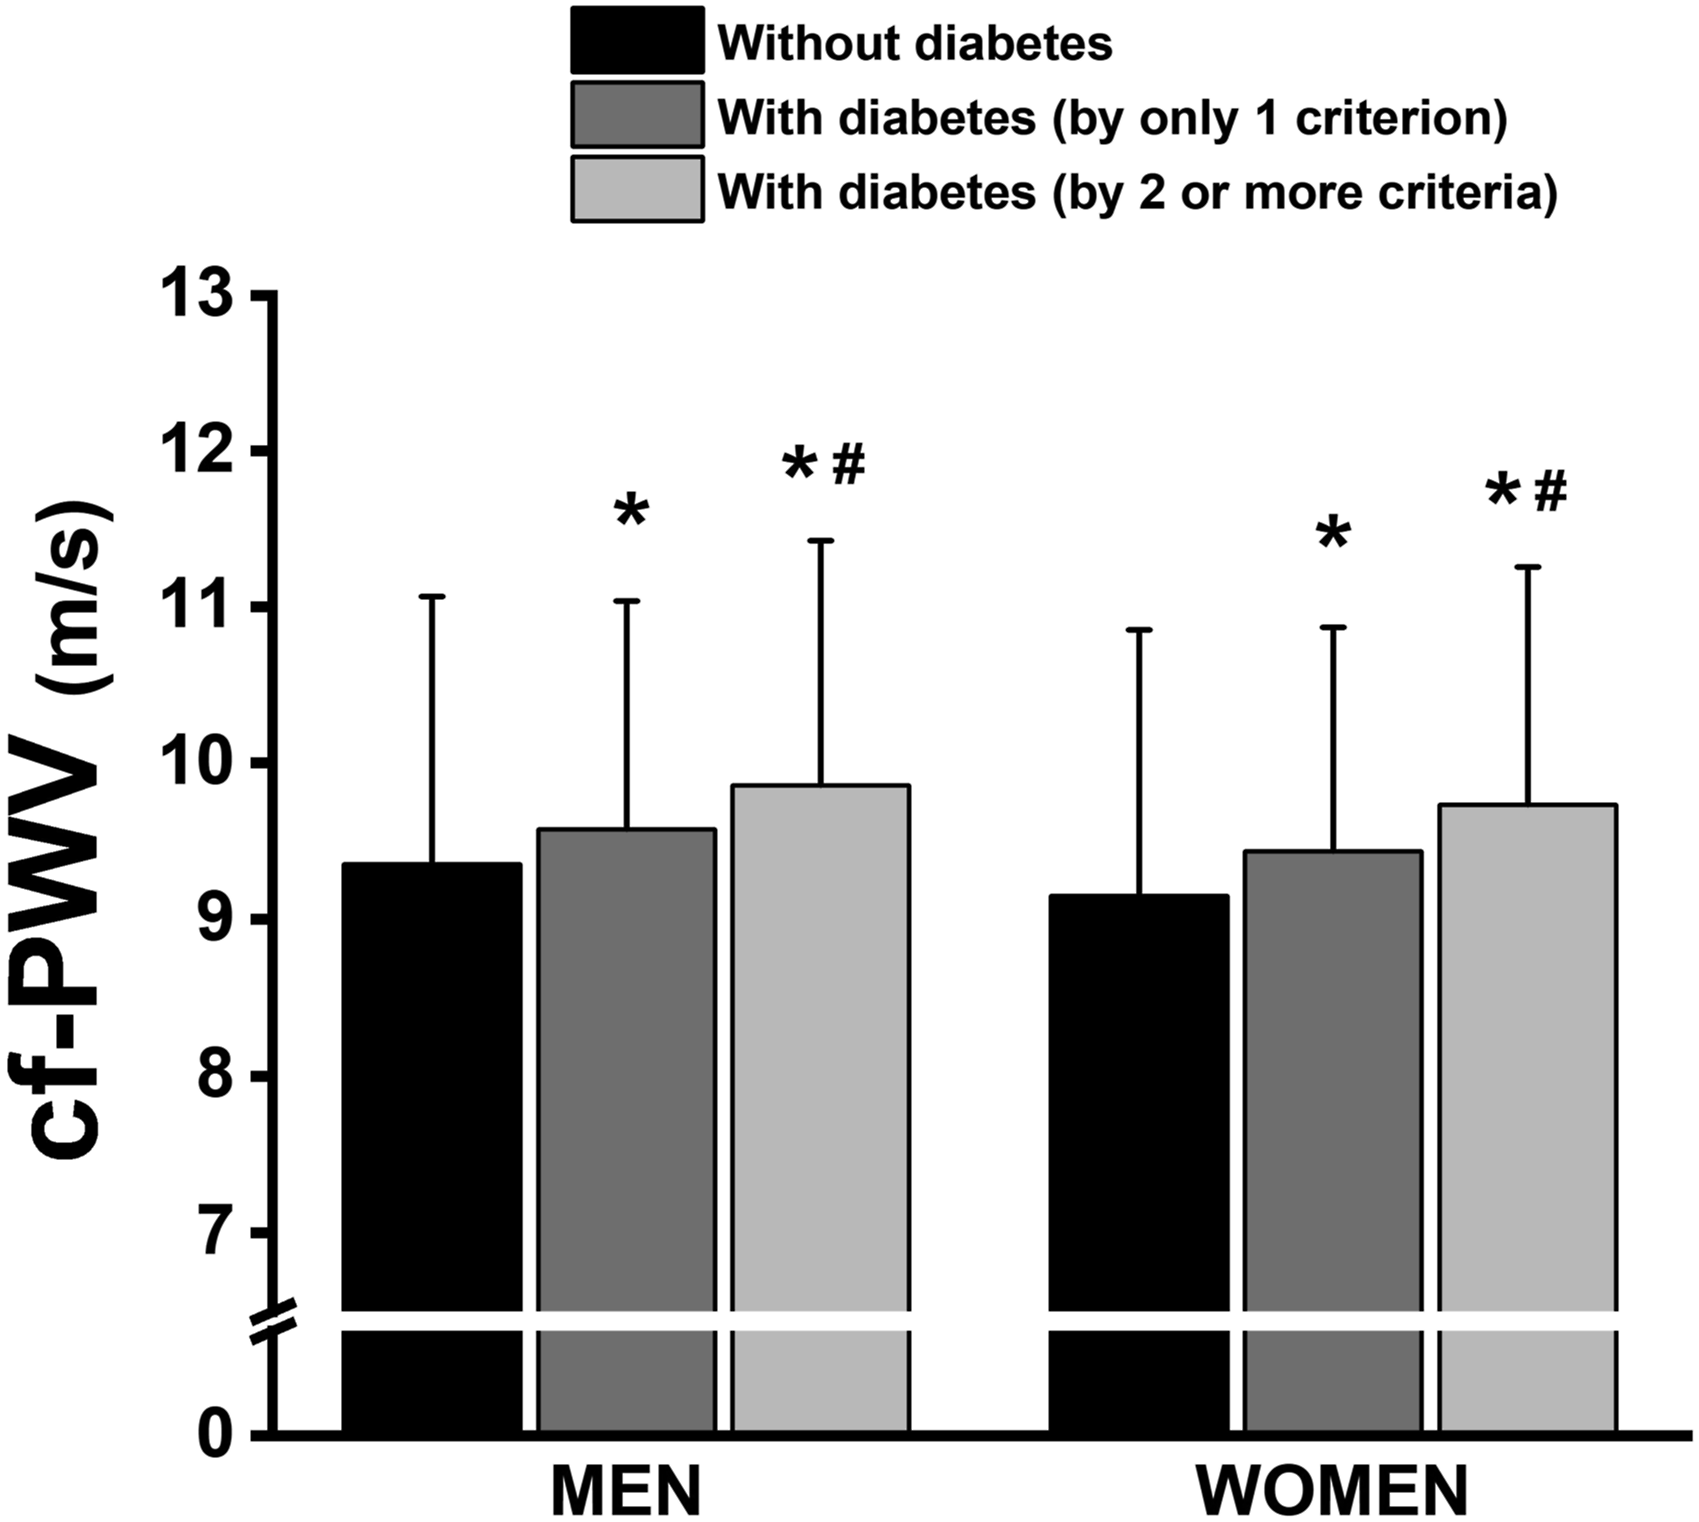
To define if all those three laboratory-based criteria for diabetes classification would be independently related to increases in cf-PWV, we stratified those participants that had only one criterion for diabetes (only fasting glucose ≥126 mg/dL, or only HbA1c ≥ 6.5%, or only blood glucose 2h post-GTT ≥200 mg/dL). Figure 3(A) shows that participants with diabetes with altered fasting glucose (but not by HbA1c and blood glucose 2h post-GTT) had higher cf-PWV than participants without diabetes, regardless of sex. Also, participants with diabetes with altered HbA1c (but not by fasting glucose and blood glucose 2h post-GTT) had higher cf-PWV than participants without diabetes, without a difference between men and women. Finally, those men and women with diabetes with altered blood glucose 2h post-GTT (but not by fasting glucose and HbA1c) also had higher cf-PWV than participants without diabetes. All these analyses were performed by adjusting cf-PWV values for age, SBP, uric acid levels, BMI, TG, and eGFR. These results confirmed that all single laboratory-based criteria used for diabetes classification have an independent effect on increasing cf-PWV. Sex-specific cf-PWV values in participants stratified by only one laboratory criterion for diabetes (fasting glucose ≥126 mg/dL, or HbA1c ≥ 6.5, or blood glucose 2h post-GTT ≥200 mg/dL). Panel A represents participants ascertained as having diabetes by fasting glucose (but not by HbA1c and plasma glucose 2h post-GTT); Panel B represents participants ascertained as having diabetes by HbA1c (but not by fasting glucose and plasma glucose 2h post-GTT); Panel C represents participants ascertained as having diabetes by 2h post-GTT plasma glucose levels (but not by fasting plasma glucose and HbA1c). We excluded participants with diabetes in the use of glucose-lowering drugs and those with a previous diagnosis of diabetes. Results are adjusted by age, SBP, BMI, eGFR, uric acid levels, and TG. * indicates P < .05 vs the first group; # indicates P < .05 vs the second group. SBP: systolic blood pressure; BMI: body mass index; eGFR: estimated glomerular filtration rate; TG: triglycerides; cf-PWV: carotid-femoral pulse wave velocity; GTT: glucose tolerance test.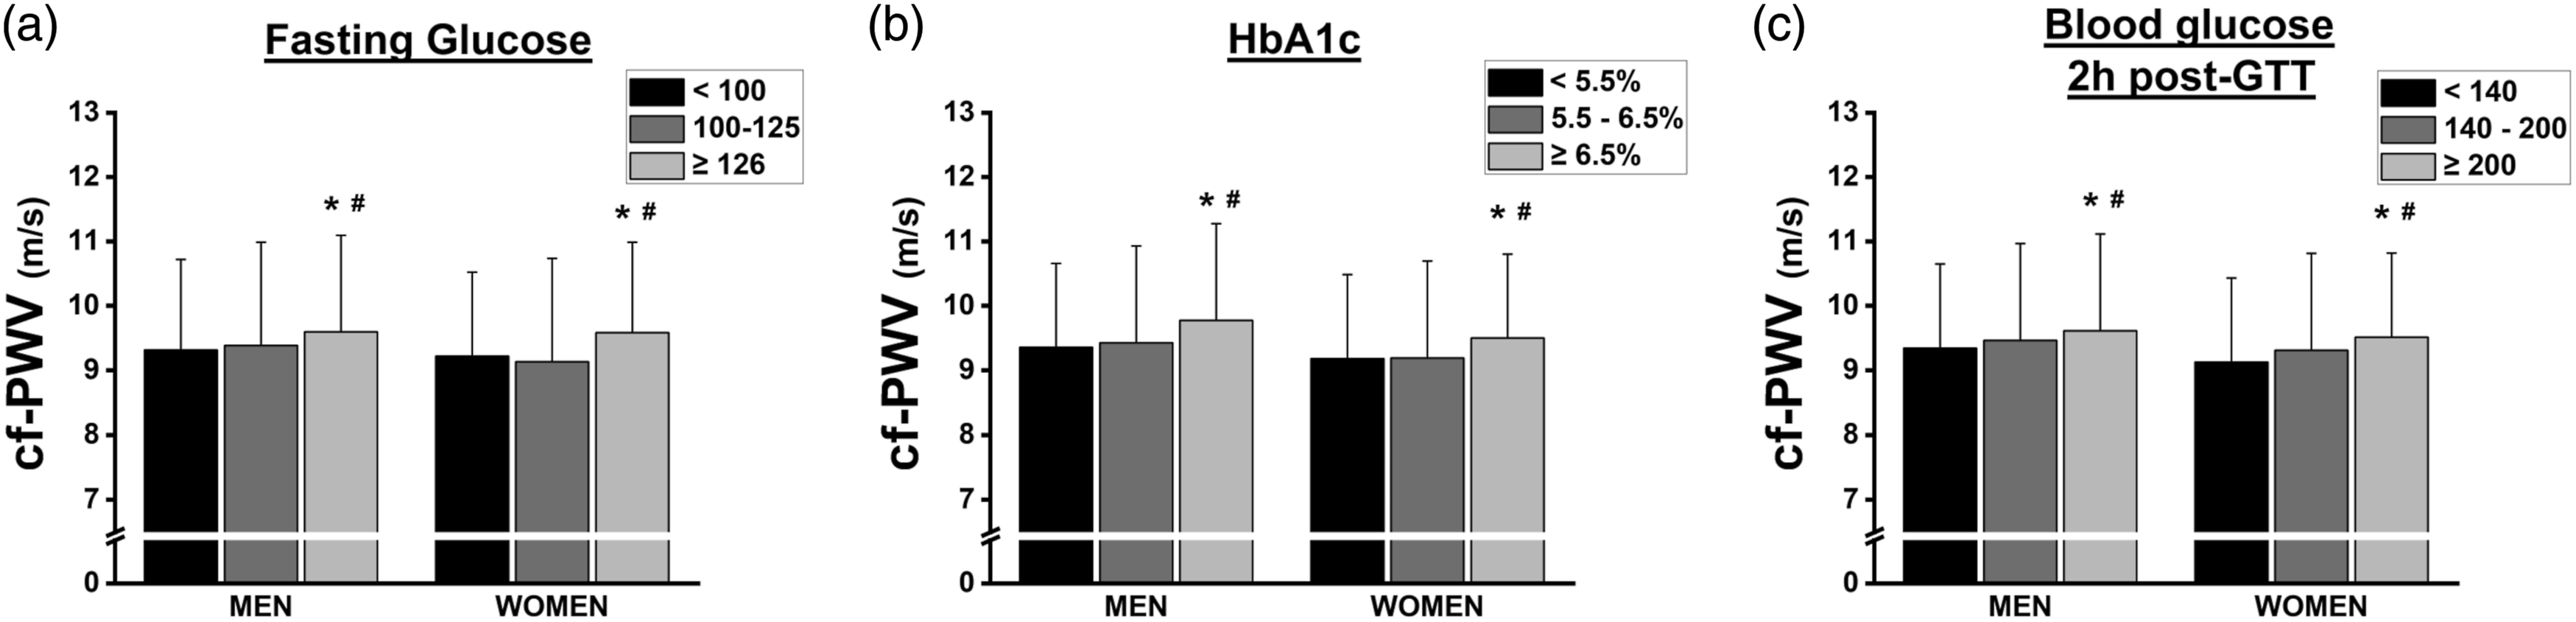
Discussion
The present study was carried out using data from a large sample of Brazilian adults who participated in the ELSA-Brasil study. We observed a high prevalence of diabetes, with a significant impact on arterial stiffness. The cf-PWV, an important marker of arterial stiffness, was higher in participants with diabetes than in those without diabetes, even after adjusting for confounders. Another important point observed was that each of the laboratory-based criteria used for diabetes classification (fasting blood glucose, HbA1c, and blood glucose 2h post-GTT) is independently related to changes in cf-PWV and that the presence of more than one of these altered parameters is associated with even more cf-PWV increments.
Diabetes includes a complex combination of genetic, metabolic, and environmental factors that interact to establish a serious condition. Despite a strong influence of non-modifiable risk factors (ethnicity and family history/genetic background), the participation of classic modifiable risk factors such as obesity, physical inactivity, and low-quality diet has contributed to the increase in diabetes worldwide. 24 Our results corroborate these statements, showing that the clinical and anthropometric profiles in participants with diabetes are worse than in participants without diabetes for almost all parameters evaluated. Some of these parameters could be considered a cause of diabetes and others, the consequence of it. Thus, these alterations have greatly contributed to the increased prevalence of diabetes and its epidemiology. Data from the Global Burden of Disease regarding diabetes epidemiology in 2017 reported a worldwide prevalence of diabetes of 6.8%, ranging from 4.4 to 22% in different age groups. 25 In 2021, a report from the International Diabetes Federation reported an average worldwide prevalence of diabetes of 10.5%, ranging from 3 to 24%, approximately, according to the age group. 26 Brazil ranked sixth among countries with the highest number of individuals with diabetes, scoring 15.7 million people with diabetes in 2021. 26 Our study observed a prevalence of 18.7% of diabetes. Comparatively, this prevalence was higher than that observed in some other studies and can be explained, at least partially, by the robust method used to characterize diabetes. In general, studies use only the fasting blood glucose cutoff point of ≥126 mg/dL to define diabetes. However, the ELSA-Brasil study used a wider standardization, following the recommendation of the American Diabetes Association, 27 including a change in at least one of the following criteria: fasting glucose ≥126 mg/dL (7.0 mmol/L), HbA1c ≥ 6.5%, blood glucose 2h post-GTT ≥200 mg/dL (11.1 mmol/L). Thus, the use of more robust criteria increases the chance of a patient reaching at least one of the described criteria, and not only fasting blood glucose, making the prevalence of diabetes increase. However, the NHANES study and the Jackson Heart study observed fasting blood glucose ranging from 102 to 110 mg/dL, with approximately 50% of the participants being characterized as prediabetic or diabetic,28,29 showing that the prevalence of diabetes is also increasing due to increased fasting blood glucose.
We observed that SBP progressively increased with age in all groups. However, participants with diabetes showed higher SBP compared with participants without diabetes, regardless of sex and age category. Hypertension is commonly associated with diabetes, being approximately twice as frequent in individuals with diabetes compared with those without diabetes. 30 In addition, the concomitant presence of diabetes and hypertension increases the risk of major cardiovascular events. 31 On the other hand, evidence indicates that strict blood pressure control reduces cardiovascular morbidity and mortality in patients with diabetes. 32 Likewise, we also showed that arterial stiffness assessed by cf-PWV increases progressively with age, but with higher values in individuals with diabetes, regardless of sex and independent of some classical confounding factors. The presence of high levels of blood glucose and/or insulin promotes arterial stiffness of large arteries directly by acting on the extracellular matrix in the blood vessel wall. 33 Hyperglycemia and hyperinsulinemia increase artery stiffness by causing oxidative imbalance, endothelial dysfunction, and dysregulation of vasoactive substances, especially by impairing nitric oxide synthase activation, contributing to microvascular changes. 33 Moreover, it is also known that impaired glucose metabolism is commonly associated with the generation of advanced glycation end-products (AGEs), which may interact with the arterial wall forming cross-links in collagen fibers, thus promoting endothelial dysfunction and reducing arterial distensibility. 34 In addition, arterial stiffness is linked to the known diabetes-associated prothrombotic state. 35 However, only a few studies investigated the effects of antiplatelet drugs on arterial stiffness in patients with diabetes showing no significant differences. 36 Finally, another way to change arterial wall properties and arterial stiffness is the impaired kidney function observed in patients with diabetes. It was reported that patients with type 2 diabetes but without renal outcomes develop more central (cf-PWV) than peripheral arteries (brachial-ankle PWV; ba-PWV) stiffness. 37 In fact, arterial stiffness increases as a function of decreased GFR. 38 Although the average kidney function of ELSA-Brasil participants is approximately 80 mL/min/1.73 m2 for men and 100 mL/min/1.73 m2 for women, all of our analyses were adjusted by eGFR.
Glucose dysregulation, insulin resistance, and obesity, occurring independently of blood pressure, increase arterial stiffness. 39 In fact, our study shows high cf-PWV in participants with diabetes, even after adjusting for other risk factors. Alvim et al. corroborate this finding by showing that individuals with diabetes consisting of an admixture population of Brazilians and Amerindians had higher cf-PWV as compared with individuals without diabetes. 40 Schram et al. 34 showed that the progression of glucose intolerance was associated with changes in the vascular structure, which implies increased peripheral and central arterial stiffness. Moreover, diabetes accelerates the process of vascular remodeling by several mechanisms, especially when associated with obesity and/or other risk factors. 41 It is important to emphasize that the increase in cf-PWV in participants with diabetes evidenced in our study occurred independently of other risk factors, including blood pressure and age, the strongest ones. 8
A strong association between metabolic disorders and increased arterial stiffness is independent of other known risk factors for cardiovascular disease. 42 In fact, microvascular and macrovascular changes begin before the diagnosis of diabetes. 43 We observed that a single criterion used for the laboratory-based diagnosis of diabetes (fasting glucose ≥126 mg/dL, HbA1c ≥ 6.5%, or blood glucose 2h post-GTT ≥200 mg/dL) is able of increasing cf-PWV. However, there is an intense debate concerning the independent ability of the different parameters of glucose metabolism in predicting arterial stiffness. For example, in a study evaluating 5098 adults from China, Liang et al. 44 showed that HbA1c, but not fasting glucose or the blood glucose 2h post-GTT, was independently associated with cf-PWV. Similar results were found for the association between HbA1c and cf-PWV in adolescents with diabetes. 45 HbA1c, as a marker of long-term exposure to hyperglycemia, is possibly linked to arterial stiffness through the effects of AGEs, which induce inflammation and oxidative stress in the vascular environment, increasing arterial stiffness. 46 Using another method to assess arterial stiffness, Gomez-Sanchez et al. 47 showed that fasting glucose, HbA1c, and 2h postprandial blood glucose were all independently associated with ba-PWV in patients with diabetes. In contrast, showing the controversy over the key role of HbA1c in increasing arterial stiffness, HbA1c was not associated with ba-PWV in individuals with diabetes. 48
In the present study, fasting blood glucose was also independently associated with cf-PWV. Studies also corroborate the association between arterial stiffness and fasting glucose levels. For example, Lukich et al. 49 reported a significant increase in aortic PWV as fasting glucose levels increase, by comparing individuals with normal fasting glucose, impaired fasting glucose, and those with diabetes, suggesting early vascular damage associated with slightly increased fasting glucose levels. On the other hand, Liang et al. 44 reported that fasting glucose and blood glucose 2h post-GTT were not associated with cf-PWV in multivariate analyses.
The blood glucose 2h post-GTT is associated with cardiovascular risk, as reported by the Australian Diabetes, Obesity, and Lifestyle (AusDiab) study, showing that baseline 2h post-GTT blood glucose was associated with incident hypertension over a 5-years follow-up. 50 Our present data showed that 2h post-GTT blood glucose is independently associated with cf-PWV. Webb et al. 51 showed that 2h post-GTT blood glucose is the strongest independent predictor of cf-PWV as compared with fasting blood glucose and HbA1c. Also, 2h post-GTT blood glucose was associated with arterial stiffness in Japanese men. 52
Finally, we observed that although all the criteria were found independently associated with cf-PWV, participants with >1 criterion showed an additional increase in cf-PWV. Li et al. 17 observed increased arterial stiffness in prediabetic subjects with changes in both HbA1c and impaired glucose tolerance, but not with impaired fasting glucose. Also, Liang et al. 44 showed additive increases in cf-PWV by the presence of altered HbA1c with another concomitant altered parameter.
The association between the laboratory-based criteria of diabetes diagnosis and increased arterial stiffness reported in the present study emphasizes the link between glucose metabolism and vascular health. In this context, a few studies have been pointing to PWV as a promising stratification risk marker for cardiovascular prognosis among individuals with diabetes. Nakamura et al., 53 based on findings from a longitudinal study performed on individuals with diabetes and coronary artery disease, reported that individuals with low ba-PWV have better survival compared with those with a high ba-PWV, emphasizing the assessment of arterial stiffness as a risk stratification index. Moreover, evidence supports the hypothesis that arterial stiffness may predict the onset of diabetes, as micro/macrovascular complications may negatively affect glucose metabolism. 54 Although this cause-effect relationship is still under investigation, a few mechanisms by which arterial stiffness increases the risk of developing diabetes include the vascular release of elastin-derived peptide, renin-angiotensin-aldosterone system activation, pancreatic islet cell and skeletal muscle microvascular dysfunction, sympathetic activation, and liver dysfunction. 55 In this context, given that cf-PWV can be rapidly assessed by non-invasive methods, its use as a risk stratification marker seems promising in clinical practice to prevent diabetes complications.
Our study has strengths and limitations. The ELSA-Brasil cohort is a large sample size study (n = 13 912) which allowed us to carry out more robust analyzes and create several subgroups without losing statistical power. Also, we used more robust diagnosis criteria, which allowed us to identify participants with diabetes by different laboratory-based parameters. A limitation of our study is the cross-sectional design which demands cautious consideration and is limited for inferring causality.
In summary, we showed that participants with diabetes have higher cf-PWV than those without diabetes. In addition, all laboratory-based parameters used for the diagnosis of diabetes (fasting glucose, HbA1c, and blood glucose 2h post-GTT) were independently associated with an increased cf-PWV. Finally, although each criterion was independently associated with an increase in cf-PWV, the increase was greater when >1 criterion was reached. These results support the strong consequences of glucose dysregulation and diabetes on the vascular system and provide evidence to improve the management of patients with diabetes in protecting the vascular system.
Footnotes
Acknowledgments
The authors thank all volunteers for their important contributions.
Author Contributions
All authors contributed to: (1) substantial contributions to the conception and design, or acquisition of data, or analysis and interpretation of data, (2) drafting the article or revising it critically for important intellectual content, and, (3) final approval of the version to be published. All authors approved the manuscript to be submitted to Angiology.
Declaration of Conflicting Interests
The author(s) declared no potential conflicts of interest with respect to the research, authorship, and/or publication of this article.
Funding
The author(s) disclosed receipt of the following financial support for the research, authorship, and/or publication of this article: Brazilian Ministry of Health (Department of Science and Technology) and Ministry of Science, Technology, and Innovation (FINEP, Financiadora de Estudos e Projetos), Grants No. 01 06 0010.00, 01 06 0212.00, 01 06 0300.00, 01 06 0278.00, 01 06 0115.00 and 01 06 0071.00 and CNPq (the National Council for Scientific and Technological Development).