
Abstract
Peripheral artery disease (PAD) is a major public health concern worldwide, associated with high risk of mortality and morbidity related to cardiovascular and adverse limb events. Despite significant advances in both medical and interventional therapies, PAD often remains under-diagnosed, and the prognosis of patients can be difficult to predict. Artificial intelligence (AI) has brought a wide range of opportunities to improve the management of cardiovascular diseases, from advanced imaging analysis to machine-learning (ML)-based predictive models, and medical data management using natural language processing (NLP). The aim of this review is to summarize and discuss current techniques based on AI that have been proposed for the diagnosis and the evaluation of the prognosis in patients with PAD. The review focused on clinical studies that proposed AI-methods for the detection and the classification of PAD as well as studies that used AI-models to predict outcomes of patients. Through evaluation of study design, we discuss model choices including variability in dataset inputs, model complexity, interpretability, and challenges linked to performance metrics used. In the light of the results, we discuss potential interest for clinical decision support and highlight future directions for research and clinical practice.
Keywords
Introduction
Cardiovascular diseases persist as a leading cause of global mortality worldwide, contributing to a significant global burden of disease and associated risks. 1 Among them, Peripheral Artery Disease (PAD) affects over 236 million individuals worldwide. 2 PAD is characterized by the narrowing or obstruction of arteries, predominantly in the lower limbs. Atherosclerosis serves as the primary cause, leading to a chronic inflammatory process that adversely affects the condition of vessels. 3 Main risk factors contributing to the development of the disease include cardiovascular risk factors such as age, smoking status, hypertension, hyperlipidemia, and diabetes status. 4 In addition, genetic predispositions as well as lifestyle factors have also been identified as contributing risk factors. 5 Although main risk factors have been identified, PAD often remains underdiagnosed and patients may not always benefit from the best medical treatment.6,7
Artificial Intelligence (AI) has brought new insights in cardiovascular diseases, offering new techniques for data management and analysis that may help to support decision making.8,9 The former is related to the ability to use AI techniques to manage, integrate, and reveal valuable evidence from medical records, clinical, biological or imaging information labeled as “big data.” 10 The latter relates to the use of AI to develop new methods to detect, diagnose or classify vascular lesions, or to predict an event or an outcome. While AI has brought perspectives of applications in patients with PAD,8,9 it is necessary to analyze current strengths and limitations regarding study design, datasets and methods used to test the performances of the models. Understanding the main principles of developed methods and techniques is essential to establish trust and transparency between computer scientists and physicians and to enable the development of robust models capable of significantly impacting patients’ care. In this scoping review, we summarize current knowledge on AI-based methods that have been used for the diagnosis and the prognosis in patients with PAD. We discuss technical aspects of the developed models along with their impact on the interpretability of the results and highlight future directions in the field.
Methods
Search Strategy
A literature search was conducted using PubMed and Google Scholar in January 2024 to identify studies reporting the use of AI for the diagnosis or the prognosis in patients with PAD. The Prisma flow chart details the article selection process (Figure 1). We searched for articles published between the 1st of January 1990 and the 31st of December 2023. The following queries were used in PubMed for literature search: ((((((“machine learning” OR “artificial intelligence” OR “deep learning” OR machine algorithm*) AND (“peripheral vascular disease” OR “peripheral artery disease” OR PAD OR PVD OR “peripheral arterial disease”)) NOT (coronary)) NOT (murine)) NOT (rat)) NOT (mouse)) NOT (pig). We also queried Google Scholar all support with similar queries (allintitle: peripheral artery disease Model OR prediction—coronary—murine—rat—mouse—pig). The literature search was completed by analyzing three related medical reviews.8,9,11
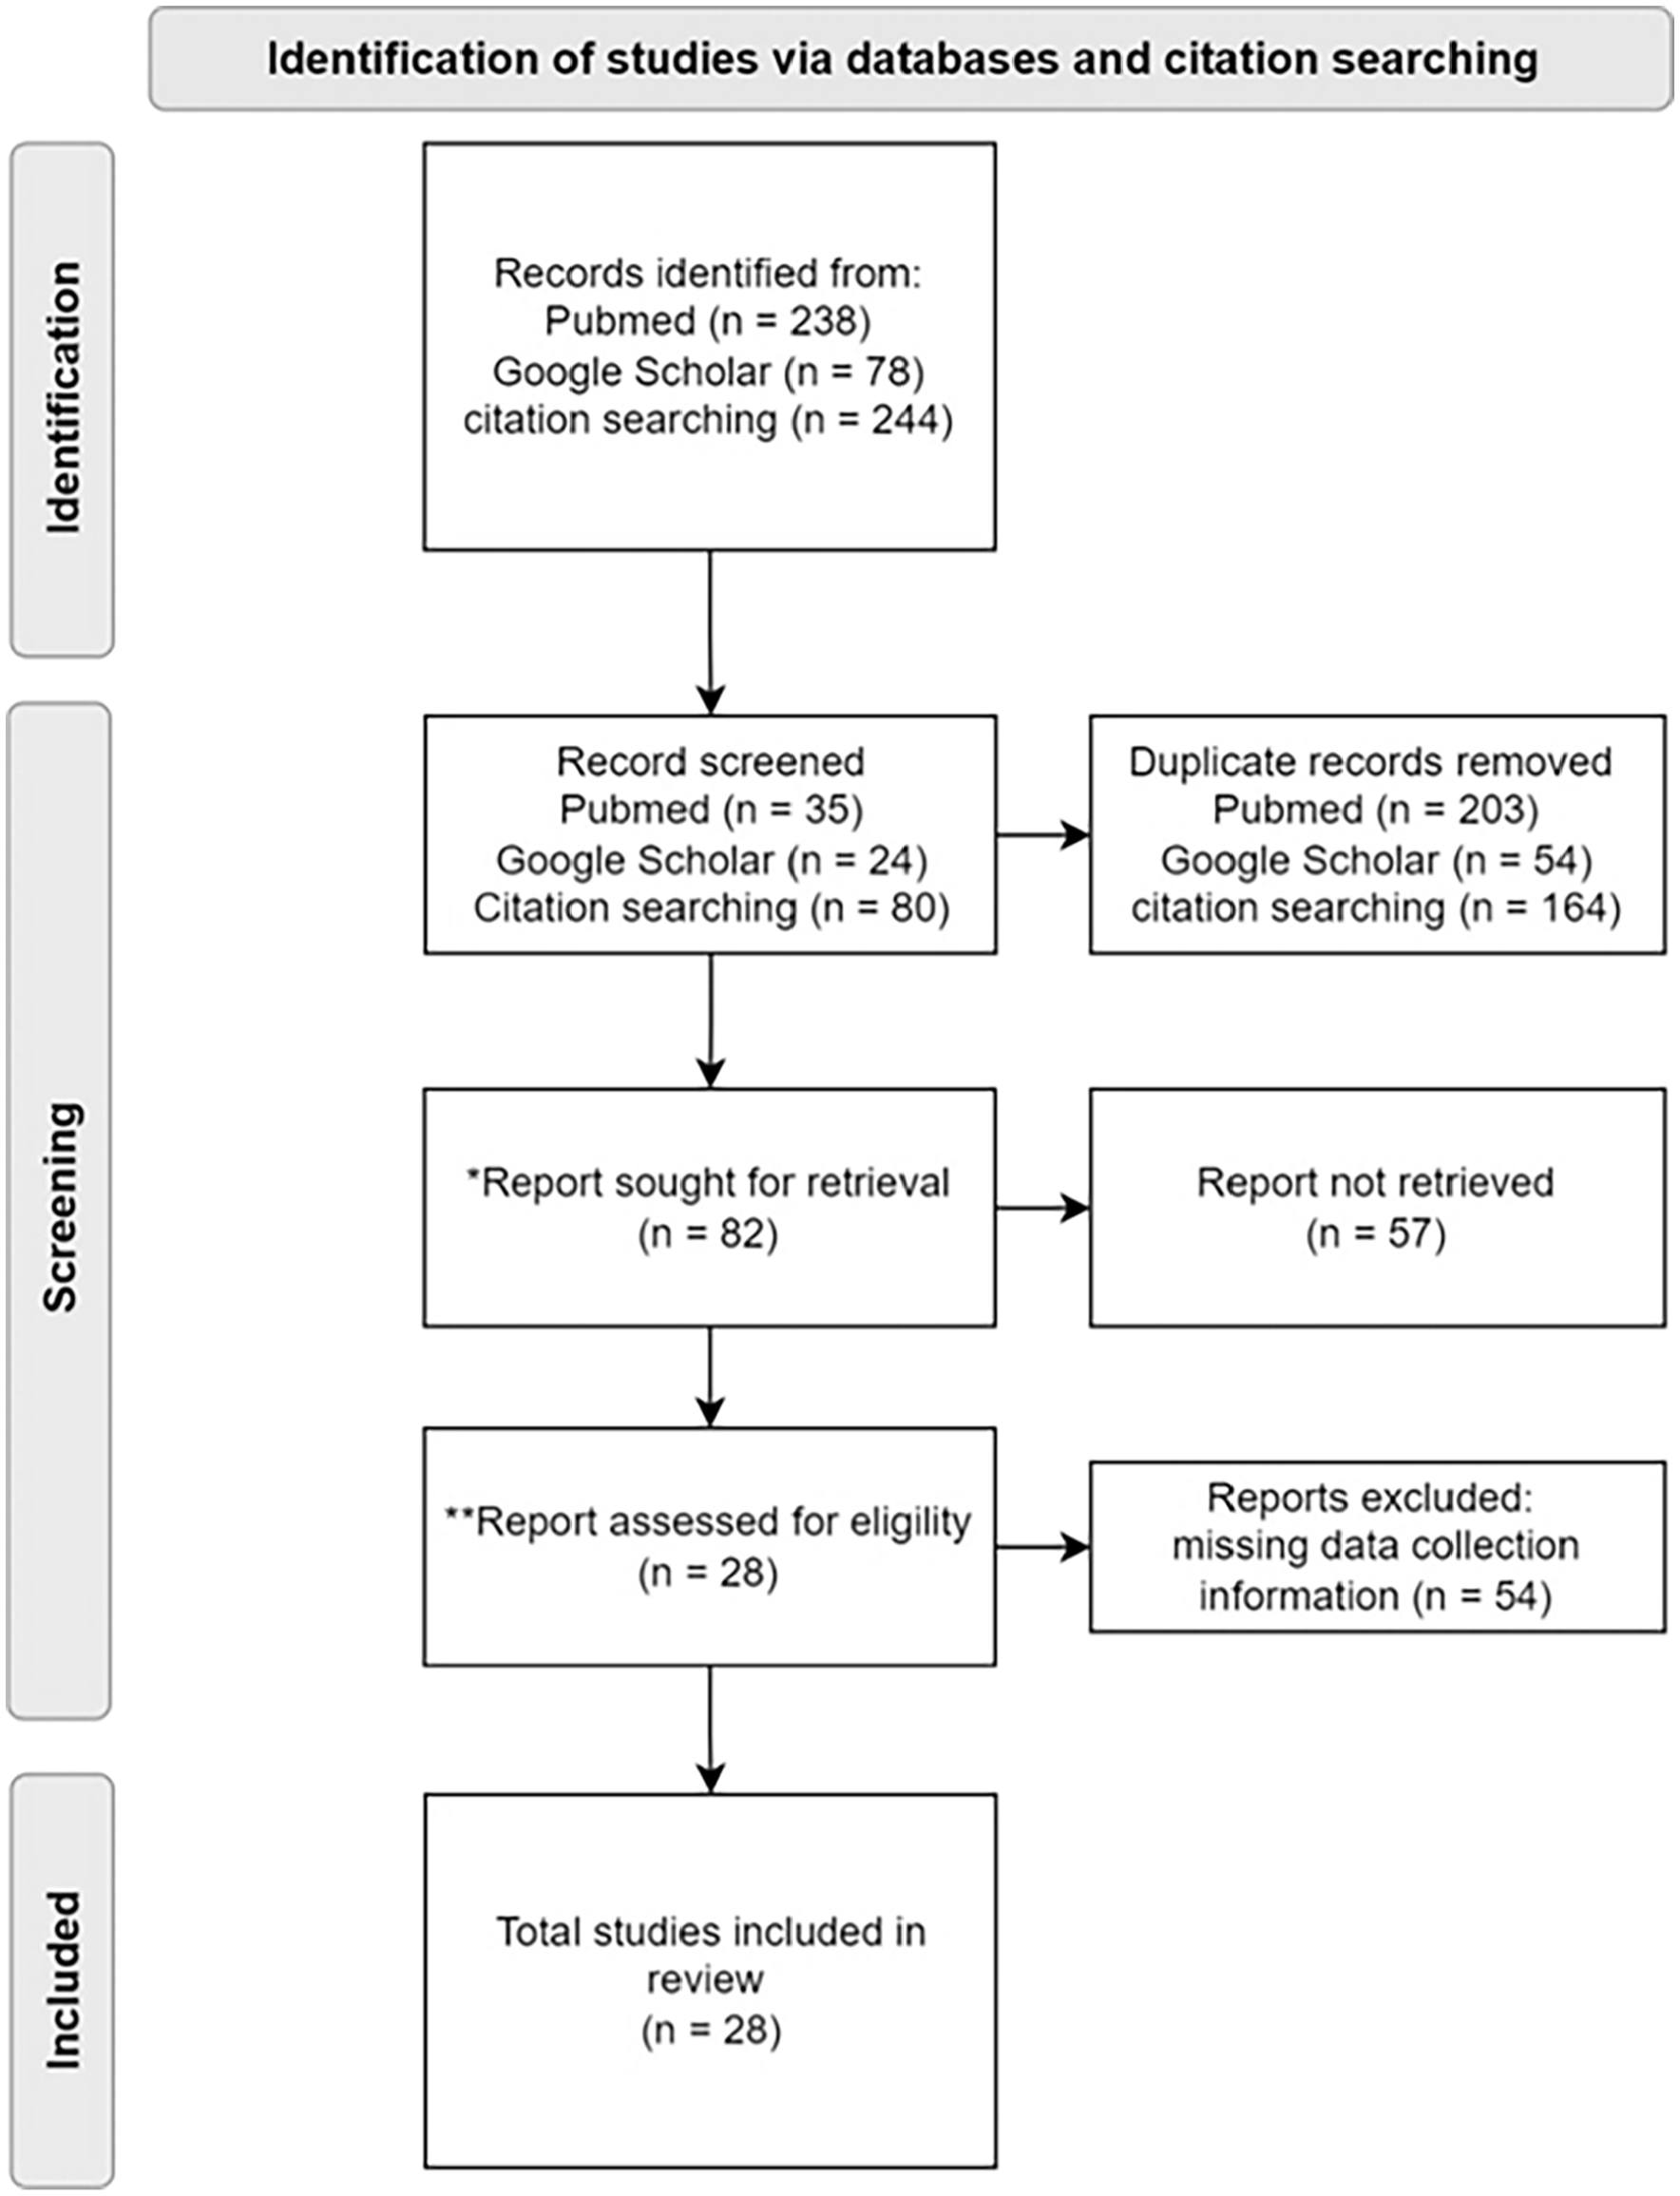
PRISMA flow chart diagram for selection of articles.
Eligibility Criteria
Inclusion criteria were studies that reported applications of AI for the diagnosis and/or the prognosis supported by patient data only, therefore excluding animal-based studies. Only original articles written in English language were included. Literature reviews related to the topic were checked to identify and add relevant original articles fitting with the eligibility criteria. Case reports, editorials, letters, and original articles investigating other vascular diseases (i.e., coronary, aortic, carotid, and neurovascular diseases) were excluded. After titles and abstracts were identified and retrieved, full texts were checked. Content-related additional criteria were applied and incomplete articles regarding the model training and AI methods without any technical details were also excluded.
Data Extraction and Analysis
Data were extracted from the selected articles and stored in an Excel spreadsheet. Data extracted included general information (title, journal, year of publication, authors, country) and study characteristics (aim, study design and dataset, AI model, results). The aim of the study is classified into two main categories: diagnosis and/or prognosis. Diagnosis refers to the process of detecting, confirming, characterizing, or classifying PAD. Prognosis refers to the prediction of outcomes related to PAD. The study design and dataset are composed of the characteristics describing the type of data but also the methodology used for collection. The type of data was classified into five classes: demographics (e.g., age, sex), clinical (e.g., smoking status, cardiovascular comorbidities, ankle-brachial index (ABI), Critical Limb Threatening Ischemia (CLTI) status, claudication status), imaging (e.g., Computed Tomography Angiography, ultrasound), genetics/biomarker/laboratory measurements (e.g., inflammatory proteomic markers), and other (e.g., motion data such as walking speed, decreased step length, etc.). The methodology used for data collection included the sample size with the number of subjects, the data collection period, the centers involved (monocentric or multicentric), and the design (retrospective or prospective). The AI model refers to the algorithm used, training specification, methods for validation, number of predictors in the model, rationale for selecting the predictors and performance metrics. Due to heterogeneity of aim and study design among the studies, a scoping review was performed and we conducted a descriptive analysis.
Results
Literature Search and Study Characteristics
Among the 560 citations identified, 28 original articles met the inclusion criteria and were finally included in the analysis. It included 15 AI models focusing on diagnosis, 13 on prognosis, and 1 on both topics. Among them, 12 studies were performed using monocentric databases and 16 using multicentric databases.
AI Models for the Diagnosis of PAD
Detection of PAD
One of the challenges of PAD is undiagnosed cases whereas an early diagnosis would allow early treatment and intervention to limit complications and adverse cardiovascular events. The vast majority of the studies focused on the identification of PAD patients. Table 1 summarizes the main aim of the studies, methodology, and datasets used. From a methodological point a view, the diagnosis of PAD can be considered as a binary classification (i.e., patient with PAD or not) and several AI-models have been proposed to enable this task.
Summary of Main Studies Reporting the Use of AI-Techniques for the Diagnosis of Patients with PAD.
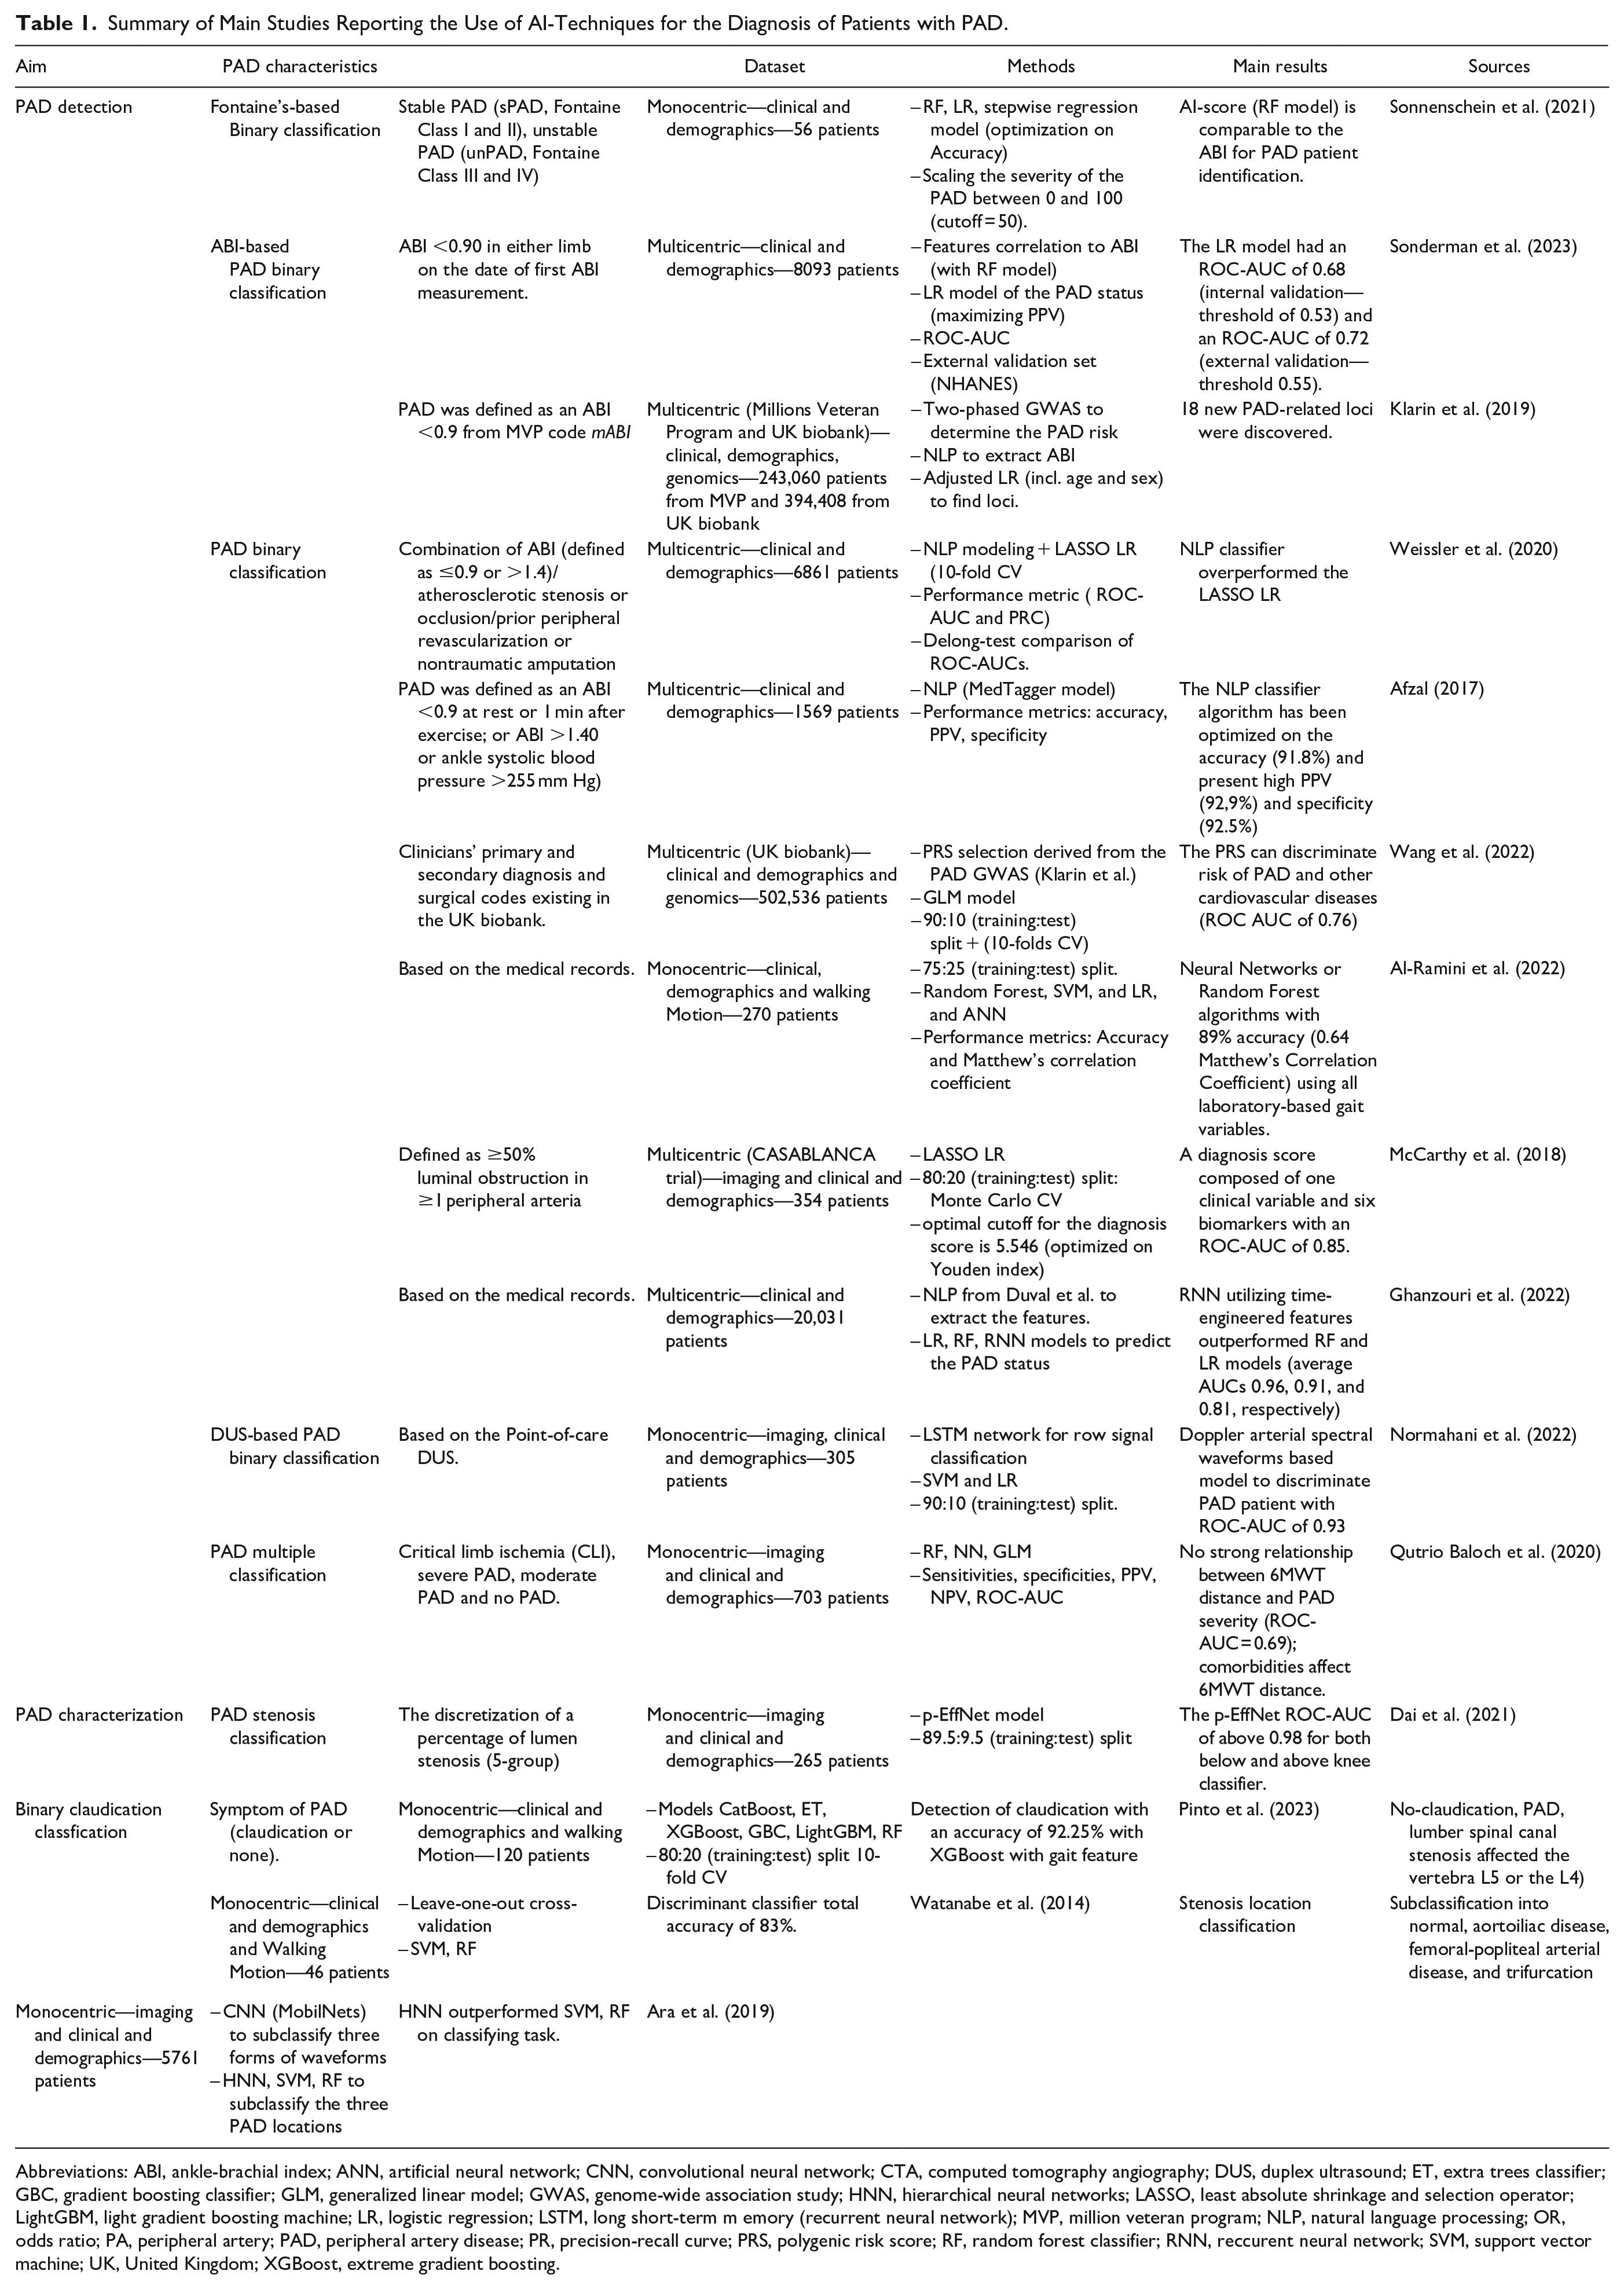
Abbreviations: ABI, ankle-brachial index; ANN, artificial neural network; CNN, convolutional neural network; CTA, computed tomography angiography; DUS, duplex ultrasound; ET, extra trees classifier; GBC, gradient boosting classifier; GLM, generalized linear model; GWAS, genome-wide association study; HNN, hierarchical neural networks; LASSO, least absolute shrinkage and selection operator; LightGBM, light gradient boosting machine; LR, logistic regression; LSTM, long short-term m emory (recurrent neural network); MVP, million veteran program; NLP, natural language processing; OR, odds ratio; PA, peripheral artery; PAD, peripheral artery disease; PR, precision-recall curve; PRS, polygenic risk score; RF, random forest classifier; RNN, reccurent neural network; SVM, support vector machine; UK, United Kingdom; XGBoost, extreme gradient boosting.
Using a Natural Language Processing (NLP) algorithm for the feature extraction out of the Electronic Health Records (EHR), Weissler et al. 12 managed to reach an Area Under the Curve of the Receiver Operating Characteristic (ROC-AUC) of 0.88 with a Least Absolute Shrinkage and Selection Operator (LASSO) regression for the prediction. Other investigators also optimized an open-source NLP algorithm called MedTagger with text processing components and a PAD classifier and the model reached an accuracy of 91.8% with a high positive predictive value (PPV) of 92.9% and a specificity of 92.5%. 13 Sonderman et al. 14 achieved a more modest ROC-AUC of 0.72 by using a logistic regression model. On the other hand, another study reported a ROC-AUC of 0.85 with logistic regression on the training set. 15 While all three studies are based on a multicentric dataset, only one study provided results on an external testing dataset while optimizing the PPV value instead of the ROC-AUC. 14 The generalization capabilities of the other models thus remain to be investigated. Finally, despite the lack of external validation, Ghanzouri et al. 16 applied a Residual Neural Network (RNN) and obtained a ROC-AUC of 0.96 outperforming both linear regression (0.81) and the random forest (0.91).
While all the above studies aimed to develop AI-models for PAD detection, a variability in the criteria used to define or diagnose PAD is observed. PAD diagnosis mainly refers to a binary classification problem to assess, meaning whether the patient has PAD or not. However, most of the datasets used were retrospective and the criteria used to discriminate PAD patients were heterogeneous. Some relied on the reported ABI alone,5,14 whereas others used a combination of the ABI, presence of significant atherosclerotic stenosis or occlusion, prior peripheral revascularization, or non-traumatic amputation. 12 Some retrospective studies directly relied on PAD diagnosis confirmation from medical records or patient’s history, 17 or used corresponding standardized coding systems identifying PAD patients. 18 Finally, some investigators relied on imaging data and used Computed-Tomography Angiography (CTA) to classify patients into two groups, with and without obstructive PAD. 15 In this study, the binary classification was based on the measurement of the lumen arterial stenosis (≥50% luminal obstruction in ≥1 peripheral artery).
In addition to develop AI-models to identify PAD patients, a last approach aimed at investigating molecular and biological patterns from patients with PAD.5,15 Such an approach may help to better understand factors contributing to PAD development and could potentially lead to the identification of relevant diagnostic biomarkers. As an example, Klarin et al. 5 identified 19 genomic loci implied in the raising of the PAD risk and atherosclerosis in general. Using LASSO regression, McCarthy et al. 15 developed a diagnosis score composed of one clinical variable and six proteomic biomarkers including molecules linked to inflammation (interleukin-23, eotaxin-1), vessel structure stability (angiopoietin-1) and fibrinolysis (midkine).
The most frequent Machine learning (ML) algorithms used were Linear Regression (LR) and Random Forest (RF) which are explainable and favor transparency. 19 RF models are also more suitable for categorical variables since they handle it better than LR. Another approach relies on deep learning methods, which reached comparable or even better results than the LR and RF but poses challenges regarding the interpretability of models.13,16
Classification of PAD
While the detection of PAD is a first step in the diagnosis, PAD characterization is necessary to assess the severity and stage of the disease. Clinical stages, calcium scoring index and the degree of stenosis are most often used to characterize and classify PAD lesions. Some investigators developed an AI-algorithm to detect claudication with an accuracy of 92.25%. 20 Claudication, typically associated with PAD, is also a symptom of lumbar spinal canal stenosis. A recent study categorized claudication symptoms into five groups based on the underlying condition: absence of claudication, PAD, and lumbar spinal canal stenosis affecting either vertebra L5 or L4. 21 Finally, Dai et al. 22 designed five stages of PAD stenosis by discretizing the lumen obstruction stenosis ratio and built a combined Convolutional Neural Network (CNN) and Recurrent Neural Network (RNN) called p-EffNet that exhibited a good performance of 91.5% accuracy and a ROC-AUC of 0.987 in classifying above-knee artery and 90.9% accuracy and a ROC-AUC of 0.981 in classifying below-knee artery. The location of vascular lesions has also been analyzed and subclassified into four states (i.e., no-PAD, aortoiliac disease, femoral-popliteal arterial disease, and below-knee lesions). 23 In this study, the CNN model reached an F1-score for each class between 0.85 and 0.98. 23 Despite providing innovative and new characterization, those papers present class-balancing sensitive performance metrics (i.e., accuracy).
AI-Methods for the Prognosis of PAD
Several studies investigated the use of AI-models to predict the likely course and outcomes of patients with PAD. Table 2 summarizes the predicted outcomes, study population, modeling methods, and main results of the PAD prognosis publications.
Summary of Main Studies Reporting the Use of AI-Techniques for the Prognosis of Patients with PAD.
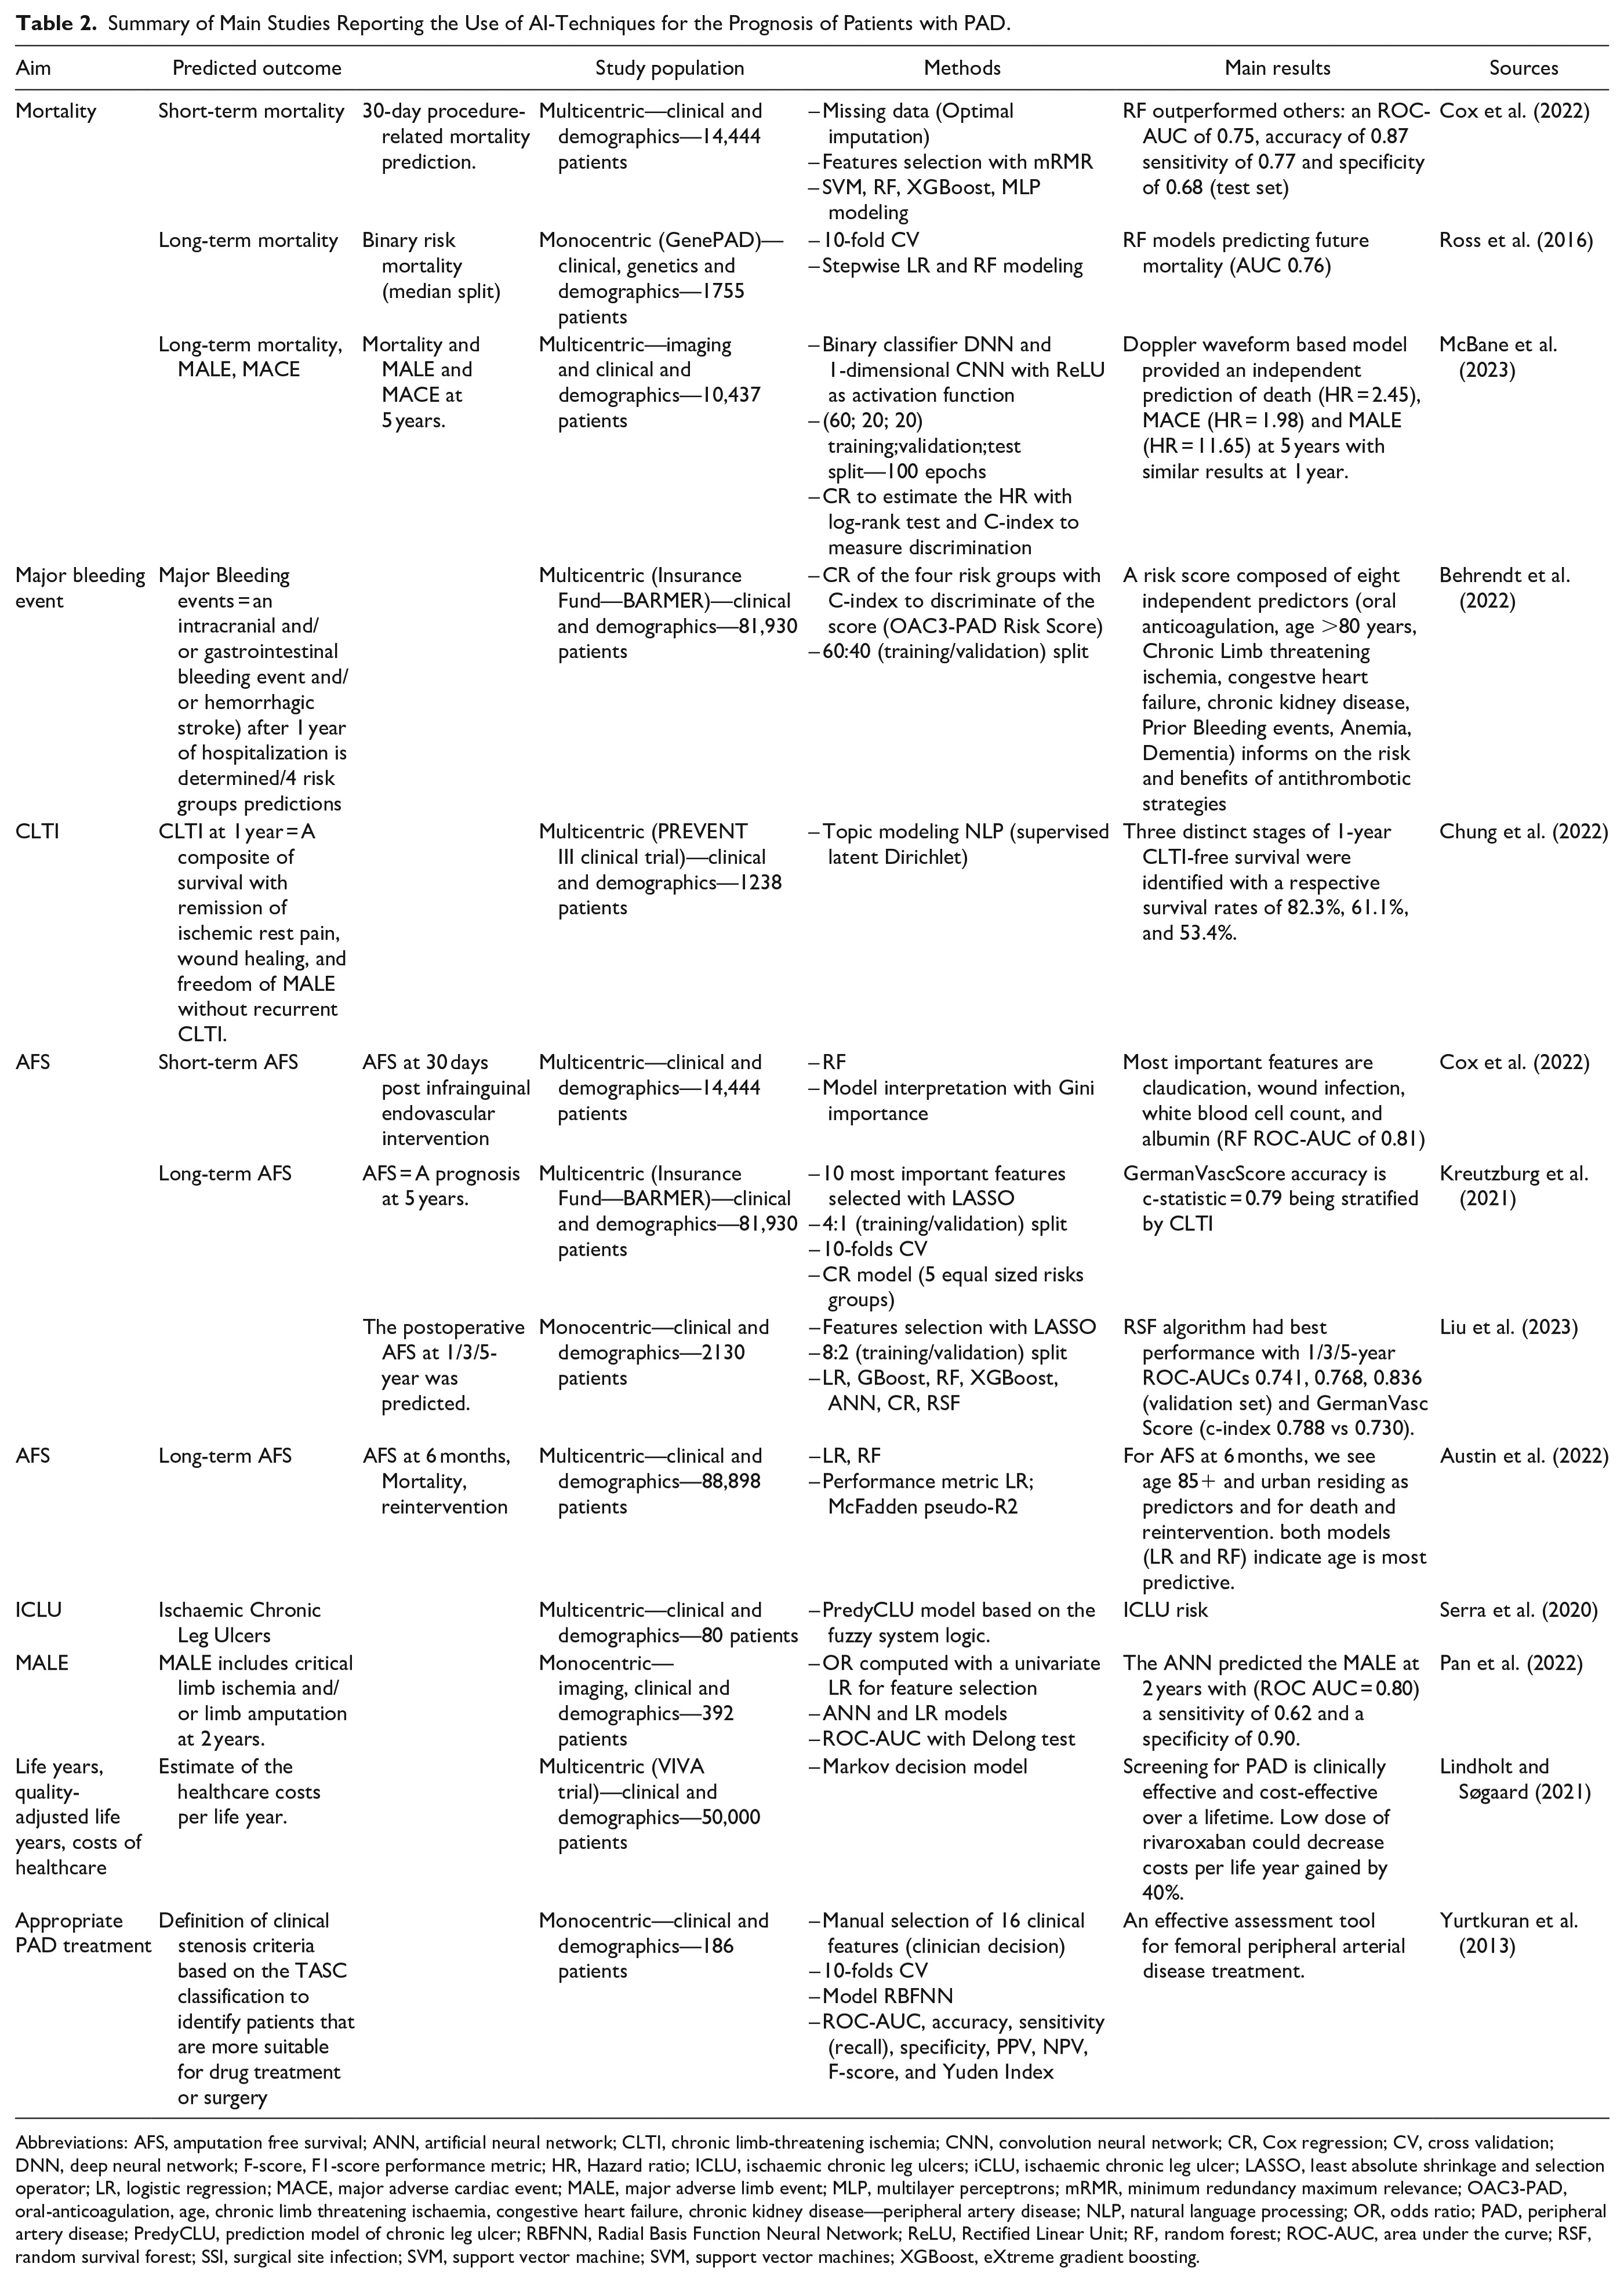
Abbreviations: AFS, amputation free survival; ANN, artificial neural network; CLTI, chronic limb-threatening ischemia; CNN, convolution neural network; CR, Cox regression; CV, cross validation; DNN, deep neural network; F-score, F1-score performance metric; HR, Hazard ratio; ICLU, ischaemic chronic leg ulcers; iCLU, ischaemic chronic leg ulcer; LASSO, least absolute shrinkage and selection operator; LR, logistic regression; MACE, major adverse cardiac event; MALE, major adverse limb event; MLP, multilayer perceptrons; mRMR, minimum redundancy maximum relevance; OAC3-PAD, oral-anticoagulation, age, chronic limb threatening ischaemia, congestive heart failure, chronic kidney disease—peripheral artery disease; NLP, natural language processing; OR, odds ratio; PAD, peripheral artery disease; PredyCLU, prediction model of chronic leg ulcer; RBFNN, Radial Basis Function Neural Network; ReLU, Rectified Linear Unit; RF, random forest; ROC-AUC, area under the curve; RSF, random survival forest; SSI, surgical site infection; SVM, support vector machine; SVM, support vector machines; XGBoost, eXtreme gradient boosting.
Mortality Risk Prediction
Cox et al. 24 elaborated models based on clinical and demographic data to determine mortality risk 30 days after lower extremity endovascular revascularization procedure. The resulting random forest model achieves a ROC-AUC of 0.75, accuracy of 0.87 sensitivity of 0.77, and specificity of 0.68 on the test set.
Other studies aimed to predict mortality after longer follow-up. Ross et al. 25 designed a model to predict the risk of mortality based on the GenePAD study that lasted 8 years. A binarization of a time-to-event outcome implies a definition of a decision threshold to generate the two groups. This threshold must be defined before the modeling to ensure a rigorous method and also needs to be justified to avoid a bias due to the balancing of the outcome. In this case, the dataset was divided into two groups using the median survival time as the split point which is the common practice. The median follow-up time for included patients was 5.3 years with a total of 129 patients with a death event and 918 controls. Patient tracking was facilitated through regular reviews of EHR and check-up phone calls. The random forest model demonstrated superior performance with an ROC-AUC of 0.76 compared with stepwise regression. Analysis of feature importance identified age, serum glucose level, serum creatinine, systolic blood pressure, and ABI as the five most crucial variables for predicting mortality.
Limb Adverse Events
PAD is associated with risks of amputation with a major impact on patients’ quality of life. Some authors aimed to predict amputation free survival (AFS) at 30 days after lower extremity infra-inguinal endovascular intervention. 24 The random forest model achieved a ROC-AUC of 0.81 on the test set to distinguish high and low AFS. The risk of amputation was associated with elective vascular surgery designation meaning scheduled in advance without emergency constraint, claudication, open wound/wound infection, white blood cell count, and albumin level. On longer follow-up, another study aimed to predict the AFS at 5 years and used the database obtained from the second largest insurance fund in Germany. 26 The AI-model, called the GermanVascScore, developed on a dataset randomly stratified by the intermittent claudication variable to homogenize the training set, reached an accuracy score c-statistics of 0.70. 26 Some investigators focused on the prediction of major adverse limb events (MALE) using clinical, and demographic predictors and imaging data. 27 The Artificial neural network achieved a ROC-AUC of 0.80 on the validation set to predict MALE at 2 years. MALE can also include reintervention events (i.e., limb revascularization) and acute and chronic limb ischemia. 28
Beside the risk of amputation, PAD is associated with the risk of ischemic chronic limb ulcer (ICLU). Stratification of the risk of ICLU might help to improve early detection and care. Some investigators developed a model based on fuzzy logic concept, called “PredyCLU,” to determine risk groups (low, medium and high) of ICLU in patients with PAD. 29
Major Bleeding Events
The recent publication of the Oral-anticoagulation, Age, Chronic limb threatening ischaemia, Congestive heart failure, Chronic kidney disease (OAC 3 )-PAD bleeding risk score has brought new insights to evaluate this outcome in patients with PAD. 30 The score was developed using data from Germany’s second largest health insurance fund and included 81,930 patients. 30 Using LASSO, the authors selected eight predictor features and classified the risk of 1-year major bleeding into four risk groups. The OAC 3 -PAD risk score exhibited adequate calibration and discrimination between four risk groups (Harrell’s c-index = 0.69, 95% CI 0.67–0.71). 30 Interestingly, the score was then externally validated in another prospective German cohort and the model discrimination was adequate (Harrell’s c-index = 0.61, 95% CI 0.43–0.80). 31 Additional external validation using the French National Health data corroborated these findings. Using a 10-year retrospective cohort including 161,205 patients who underwent PAD repair in French public and private health institutions, the OAC 3 -PAD model achieved an AUC of 0.650 to predict 1-year major bleeding (95% CI 0.645–0.655), with a sensitivity of 0.67 and a specificity of 0.57. 32 These results suggest the robustness of the model and its potential for further generalization of its use to guide the management of patients with PAD.
Critical Limb Threatening Ischemia (CLTI)
CLTI is a composite endpoint associated with mortality, risk of amputation, and impaired quality of life. 6 The Society for Vascular Surgery elaborated the Wound, Ischemia, and Foot Infection (WIfI) score with a classification system. 33 Chung et al. 34 aimed to elaborate a ML-based risk stratification scheme using the WIfI score. The methodology followed the Strengthening the Reporting of Observational Studies in Epidemiology (STROBE) guidelines allowing a standardization of the reporting process. Furthermore, this study also introduced the use of Topic models (NLP methods) to cluster the patients into K groups defined by extracted features from the clinical documents. The data were analyzed from K = 2 to K = 9. The authors state K = 3 based on the possibility by a clinician to use features to assess a patient’s group and they observed that the a-posteriori probability obtained by a Bayesian model selection was the highest.
Clinical Decision Support
In addition to predict patient’s outcomes related to the disease or to post-operative complications, ML has also been proposed to support clinical decisions and therapeutic decision making. Some investigators designed a model to identify patients who are more suitable for medical treatment or surgery. 35 The model Radial Basis Function Neural Network (RBFNN) combined pre-selected features by human experts (cardiologists, surgeons, and anesthetists) and reported performance metrics, as well as the confusion matrix, 36 examined the economic and life quality effectiveness of PAD screening and associated interventions in men during the early stages. They demonstrate the importance of an early screening of the PAD for both patient outcomes (success rate of revascularization, major bleeding risk reduction) and also the impact on the cost of life year gain. To compare the medical protocols and treatment benefits, they applied a decision model such as the Markov Decision model widely used to estimate the clinical and economic effect of a treatment or to compare treatment procedures. It requires the outcome target to be split into exclusive states; in the article, they split it into no/detected/undetected PAD which are the Markov states. However the modeling comes with limits regarding the states; it assumes that a series of sequential phases (e.g., the patient can go from no PAD, to undetected PAD and to Detected) and a nonrestricted transition between all the states with a known probability, an individual without PAD may receive a diagnosis (transitioning to a detected PAD state). If the condition is successfully treated (with a certain probability or rate of success), there is a possibility of reverting to the “no PAD” state.
Discussion
This section delves into comprehending and analyzing publication outcomes, spotlighting implicit assumptions and methodological constraints. It covers the key points of the AI application process by following the stages: (i) data and outcome preparation (ii) modeling, and, (iii) reporting.
Data and Outcome Preparation
Input Data
Dataset Availability
Data availability directly affects the choice of AI-model development and validation. The datasets including routinely acquired clinical and demographic data related to patient care are the most commonly available. Since the features are collected as a standard of care, large datasets such as UK-Biobank and Million Veteran Program (MVP) with more than 240,000 patients could be used. While imaging data (mainly Doppler ultrasound, Computed Tomography Arteriography) are commonly performed in practice, they require more constraints to be collected and extracted from the storage service (e.g., Picture Archiving and Communication System—PACS). There are two main drawbacks around the imaging data, the first one is the need of large storage capacities to store all the images and the second one is linked to the need of annotation in order to be used in the modeling (i.e., tissues and vascular lesions have to be segmented on the image). Annotating data involves outlining the regions of interest within an image, a process that demands a considerable amount of time and consequently restricts the size of the final annotated dataset. The challenge is tackled by employing and developing automatic segmentation methods relying on CNN for example, to aid in the time-consuming task. Further variables, such as gait motion and genomic data, can be available, but they are mainly performed in research settings and not collected in routine clinical settings. Including new data sources allows the detection of new predictors (e.g., such as genomic loci) or offers new trackers of the disease evolution (e.g., phone application tracking the gait motion). To enhance their broader utilization, affordable costs and standardization are necessary, as it currently results in relatively small final datasets in the literature.5,20 The more the data are heterogeneous and aggregated, the more the dataset size is small. In addition, complex eligibility criteria in the cohort selection can restrict the model’s clinical usefulness due to the challenges in real-world data acquisition.
Structured Versus Unstructured Data
EHR is a digital version of the paper-based medical chart. It concentrates all the patient-centered records in real-time in a text format. With digitalization, the number of (unstructured) data increased tremendously and are not arranged according to a model or target. On the opposite, the structured dataset (fewer compared with the unstructured ones) requires hand-crafting to be organized which is time-consuming and costly.
Big Data Versus Good Data
The training dataset size affects the model’s robustness, necessitating the training sample size calculation to estimate the number of data points to include. The calculation relies on statistical methodologies and takes into account the prediction modeling method, the number of features, the target balancing in cases of categorical variables, and the desired predictive performance often attached to clinical minimal requirements. 37 However, a big dataset size does not automatically mean good performance as the data quality is also essential. Especially in structured data with a lot of handcrafting, the different manipulation, the incomplete reporting and wrong data inputs may lead to bias induced by the dataset.
Variability in the Ground Truth
Partial Definition
Various PAD classifications have been reported. 3 Among them, Rutherford and Fontaine classifications consist of respectively six and four grades. While Fontaine’s classification relies only on clinical symptoms, Rutherford also incorporates non-invasive clinical symptom measures like ankle blood pressure after treadmill tests. 3 Since the observed PAD classification papers rely mainly on retrospective studies, heterogeneity is found regarding the definitions used for PAD diagnosis and classification. Some studies relied on unique criteria such as the ABI measurement only;14,38 this sub-optimal definition of the disease may include as ground truth false negative patients since its value is affected by artery stiffness due to calcification that will be associated with a higher ABI score. 39 Other papers proposed to use a CTA imaging based definition of the PAD by using the ratio of the lumen in the arteries but this requires image acquisition. 15 The variability of definitions illustrates the difficulty of identifying PAD patients in research and for care purposes.
Clinical Relevance
The binarization of a clinical outcome in the prognosis makes a lot of sense from a computational scientist’s point of view (e.g., the risk of amputation 30 days after an endovascular intervention 24 since patients are categorized into low and high-risk subcohorts). However, the clinical use and the actual usefulness for decision support are more unclear and difficult to evaluate. The models do not currently provide clear meaningful information on the therapeutic decision to choose and patient management such as recommendations on the frequency of visits for follow-up. This highlights one of the main current limitations of AI in healthcare which is linked to the practical use of the model.
Composite Endpoints
Finally, the composite survival risk scores derived from time-to-event datasets are frequently contingent on the specific dataset used. These composite endpints often incorporate multiple parameters and demand careful consideration when comparing conclusions across articles, as they may vary from one study to another. It adds a new obstacle to the generalization capabilities of a model.
Modelling Choice
Predictors Discovery with NLP in Unstructured Data
The use of deep learning especially NLP allows the highlighting of predictors.12,13,23,34 The NLP offers the possibility to deal with a really large dataset and perform a feature selection by definition. 11 Among the NLP algorithms, the topic models are one example. It can be used to cluster patients into a predefined number of K-patient risk groups by identifying topics that co-occur together. The topic models can be supervised by criteria according to the latent Dirichlet allocation model, allowing supervising the formation of the clusters. 40 Chung et al. 34 used the 1-year CLTI-free survival outcome to supervise the model and managed to distinguish three clusters of patients corresponding to three stages of CLTI risk groups.
Feature Selection
This can be performed by using data-driven ML techniques where the most relevant features will be considered as covariates for the outcomes. It can also be performed before the model training during the univariate analysis where the relationship between the outcome and potential covariates is analyzed (e.g., Spearman correlation) or during the model training itself with penalization process (e.g., LASSO) or directly with the model itself (e.g., RF, RNN). Using these techniques revealed covariates but lacked expert knowledge, such as understanding the dependencies between the covariates, which constitutes knowledge-driven analysis. In addition, some studies also added human expertise for feature selection. This is for example the case of the studies published by Sonderman et al. 14 that included vascular specialists in the features selection to model the PAD diagnosis model and by Afzal 13 who requested medical expertise to guide the NLP algorithm. Collaborating with experts enables a meticulous review of the data, revealing subtle connections between features, and/or fostering trust in the modeling process.
Fuzzy System Approach
The fuzzy inference system is a form of artificial intelligence and is suitable for modeling complex systems by integrating expert knowledge as logic-based rules in the model decision process.
Explainability and Interpretability Over Complexity
Interpretability focuses on giving insights of the inner mechanism of models while explainability focuses on detailing the decision scheme. Despite more performant but complex models, the choice of interpretable models such as random forest, logistic regression, and Rule-based learner 13 for PAD diagnosis encourages community trust. Among the prognosis papers, the OAC 3 -PAD risk score from Behrendt et al. 30 is also built on a Cox regression model and then reformulated into a counting risk with only eight covariates to build the score for Major bleeding event risk.
Performance Evaluation
Performance Metrics Choice
Misleading Measurements
Heterogeneity was observed between studies regarding metrics used to report the performances of the AI-models, making very challenging to perform any comparison between the studies. Table 3 summarizes the metrics reported and presents their advantages and limitations, respectively. When diagnosing with categorical endpoints, the variability of performance metrics can be significant due to factors like randomness, data size, perturbations, and class imbalances. Too many publications rely on unique metrics reporting without considering the potential pitfalls. The best example is the reporting of the accuracy only which can be misleading in the case of unbalanced datasets. A general approach would be to report the confusion matrix providing complementary information about the overall performance of the models and allowing the computation of informative but class balance dependent metrics such as the sensitivity, the specificity, the Positive Predictive Value (PPV) and the Negative Predictive Value (NPV). Only very few studies reported all these metrics together. 35 Some metrics are less sensitive such as the area under the receiver operating characteristic curve (ROC-AUC), and the area under the precision-recall curve (PR-AUC), F1 measure, balanced accuracy, and the C-index score for the time-to-event prognosis are more suitable for the performance assessments.
Summary of Most Frequent Performance Metrics of AI-Techniques for Diagnosis and Prognosis of Patients with PAD.
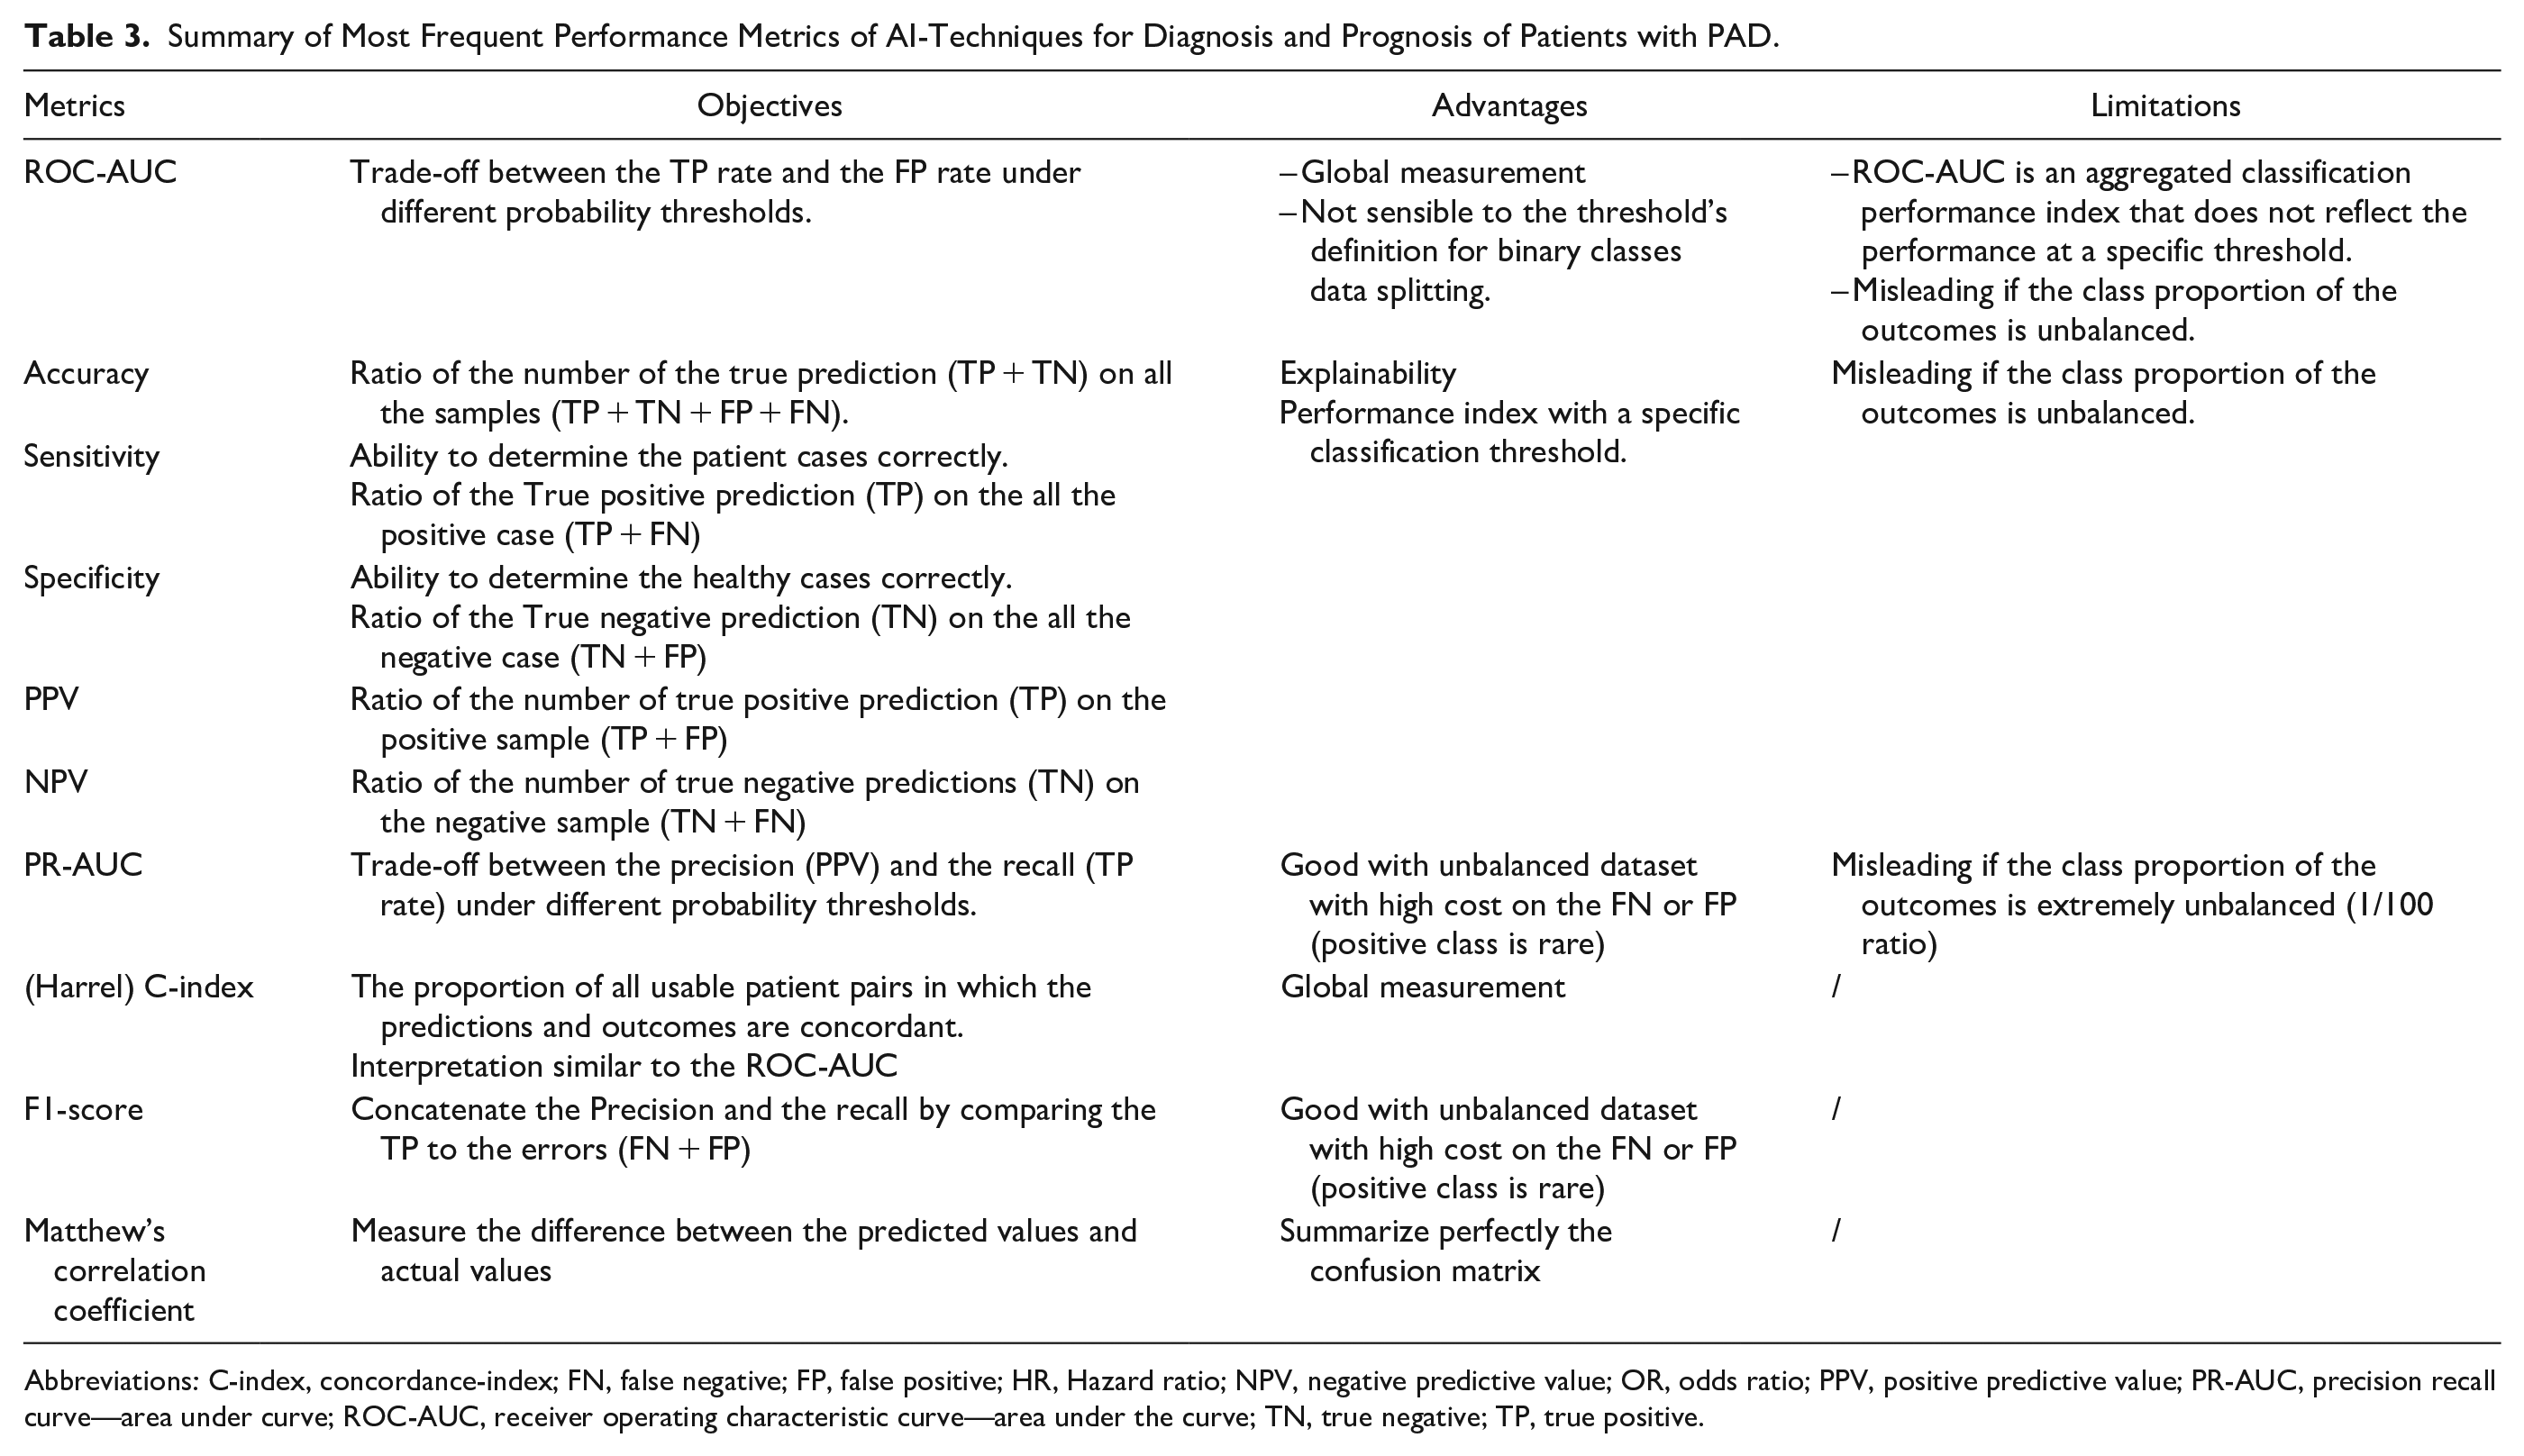
Abbreviations: C-index, concordance-index; FN, false negative; FP, false positive; HR, Hazard ratio; NPV, negative predictive value; OR, odds ratio; PPV, positive predictive value; PR-AUC, precision recall curve—area under curve; ROC-AUC, receiver operating characteristic curve—area under the curve; TN, true negative; TP, true positive.
Compare and Select a Model
The Cross-Validation
The Cross-Validation (CV) approach is a prevalent method in ML, featured in many publications reviewed especially the ML model based.15,18,26,41 It involves dividing data into training and validation sets. CV is employed to assess a model’s performance, allowing for the evaluation and comparison of algorithm accuracy on a portion of the data not used during training but originating from the same dataset referred to as the validation set. 42 The k-fold CV is used in most of the publications however the initial data splitting and the number of folds in the training is various. Nevertheless, it’s essential not to distinguish the objectives of CV with robustness, which is characterized by a model’s proficiency in performing well on external and unseen data, typically referred to as the test set. Robustness is more commonly linked to a model’s generalization capabilities, and its effectiveness in dealing with noise, variations, and uncertainties within the data. Despite the utilization of K-fold CV, certain studies42,43 address the overestimation introduced when employing K-fold CV, also known as “record-wise CV,” in comparison to leave-subject-out CV, or “subject-wise CV.” The concept revolves around the notion that “record-wise CV” establishes a dependency between the training and validation sets, leading to an overestimation of predictions on the validation set and an underestimation of prediction errors. It also suggests that elevated performance metrics do not necessarily indicate the model’s robustness.
Model Comparability
Based on the principle that performance on a dedicated dataset doesn’t mean the same results on another one, the use of an external validation dataset (i.e., a testing set) is crucial to assess the model’s reproducibility and comparability. Among the selected articles, only four articles reported external validation results. In practice, external validation remains challenging due to constraints linked to data protection, regulation, governance and availability (e.g., genomic or gait data).
Perspectives
Limitations
A limitation of the study is linked to research boundaries related to searchable keywords used that may impact on article selections. Only articles written in English language were checked, potentially selecting publications from western countries and reducing studies from other countries if not written in English. Nevertheless, we used a combination of relevant keywords related to AI and PAD to provide an updated literature overview of technical aspects and AI-methods used for the diagnosis and prognosis of patients with PAD. Based on these results, the growing volume of AI-related publications in healthcare underscores crucial aspects of ML and AI: (i) the need of data enrichment for constructing robust models and earning trust within the scientific community and, (ii) the importance of establishing frameworks and guidelines in reporting to delineate boundaries in the reporting domain.
Database Enrichment
The quantity of data points, referring to the number of patients in a study, serves as the lifeblood of AI. In addition, the type of data, their quality and accuracy in reporting is a critical point. In the field of vascular surgery, national claim databases have been built in many European and Western countries and offer the advantage to allow access to large cohorts of patients. However, the access to specific information can sometimes be limited depending on the availability of coding system used and therefore do not always contain all the relevant clinical features. National and regional vascular registries are also very useful and can provide meaningful information on outcomes following vascular interventions. Efforts to generate real world evidence have pointed to the need to build collaboration between centers and countries to collect and analyze relevant, reliable and representative health data. In this context, international registry collaborations have been created and will undoubtedly play a major role to help developing AI-tools in patients with PAD.10,44,45 Among others, the VASCUNET committee endorsed by the European Society of Vascular Surgery (ESVS), the European Vascular Research Collaborative (EVRC) and the European Research Hub (ERH) aim to facilitate high quality research in vascular disease throughout Europe and internationally. The Society for Vascular Surgery (SVS) Vascular Quality Initiative (VQI) is very active mainly in the United States and Canada, and is also involved to develop collaboration with ESVS-VASCUNET and the Medical Device Epidemiology Network (MDEpiNet) through the International Consortium of Vascular Registries (ICVR). The development of international multicenter studies and databases is a cornerstone for the development of efficient AI-applications that also bring major challenges regarding data protection, security and governance. Federated learning (FL) has been proposed as an alternative to ensure respect of patient privacy and confidentiality and solve issues related to data sharing, governance and ownership. 46 FL allows training algorithms collaboratively without exchanging the data themselves. 46 Each participating center trains ML using their own data in parallel and the model is then be sent to a central server that will aggregate the results into a consensus model. The consensus model is then sent to other collaborative centers to be further trained and tested to assess. Such approach might be useful in the future to develop AI-models in patients with PAD.
Frameworks and Guidelines
In recent years, several frameworks have been developed to enhance readability and establish boundaries in reporting. One such framework is the updated Consolidated Framework for Implementation Research (CFIR). 47 While serving as a generalist guideline, it offers concepts that facilitate the proper evaluation of results. This framework also offers an extensive vocabulary for describing the data, methods, and results of a research application. Additionally, more specific frameworks tailored to AI or AI extensions to existing guidelines have been proposed and might help to improve and standardize methodology used to develop and evaluate AI-applications. 48 Among studies investigated in this scoping review, only a few reported the use of guidelines and included: the STrengthening the Reporting of OBservational studies in Epidemiology (STROBE), 34 the Prediction model Risk Of Bias ASsessment Tool (PROBAST)30,49 and the MINimum Information for Medical AI Reporting (MINIMAR). 50 This highlights the real need to strengthen the methodology in future studies reporting AI-tools for the diagnosis or the prognosis in patients with PAD.
Conclusion
AI offers perspectives to enhance the diagnosis of patients with PAD through innovative applications enabling the detection and/or the classification of the disease. Various ML-models have also shown encouraging results to evaluate the prognosis of patients with PAD, allowing to predict various complications (mortality, limb adverse events, major bleedings, CLTI) and develop support for decision making. However, many technical and methodological challenges remain before implementation in clinical practice from data preparation, to modelling choice and methods used to evaluate the performances of the models. Current efforts to develop large multicenter international databases and the development of AI-frameworks and guidelines would help in the future to build safe, robust, efficient and clinically relevant applications to improve the management and care for patients with PAD.
Footnotes
Abbreviations
ABI, Ankle Brachial Index; AFS, amputation free survival; AI, artificial intelligence; AUC, area under the curve; CFIR, consolidated framework for implementation research; CLTI, critical limb threatening ischemia; CNN, convolutional neural network; COMPASS, cardiovascular outcomes for people using anticoagulation strategies; CR, cox regression; CTA, computed-tomography angiography; CV, cross validation; EHR, electronic health record; ERH, European Research Hub; ESVS, European Society of Vascular Surgery; EVRC, European Vascular Research Collaborative; FDA, Food and Drug Administration; FL, federated learning; HR, Hazard ratio; ICLU, ischemic chronic limb ulcer; ICVR, International Consortium of Vascular Registries; LASSO, least absolute shrinkage and selection operator; LR, linear regression; MDEpiNet, Medical Device Epidemiology Network; ML, machine learning; MVP, Million Veteran Program; NLP, natural language processing; NPV, negative predictive value; OAC 3 -PAD, oral-anticoagulation, age, chronic limb threatening ischaemia, congestive heart failure, chronic kidney disease—peripheral artery disease; OR, odds ratio; PACS, picture archiving and communication system; PAD, peripheral artery disease; PLAN, Patient risk, Limb severity, and ANatomic complexity; PPV, positive predictive value; PREVENT, Project of Ex Vivo Vein Graft Engineering via Transfection; RBFNN, Radial Basis Function Neural Network; RF, random forest; RNN, residual neural network; ROC, receiver operating characteristic; SSI, surgical site infection; STROBE, strengthening the reporting of observational studies in epidemiology; SVS, Society of Vascular Surgery; VQI, vascular quality initiative; WIFI, Society for Vascular Surgery Wound, Ischemia, and Foot Infection.
Author Contributions
Sébastien Goffart, Juliette Raffort, Hervé Delingette and Fabien Lareyre designed and drafted the manuscript. The rest of the authors participated in analysis and interpretation of data and revising it critically for important intellectual content. All authors approved the final version of the manuscript and agreement to be accountable for all aspects of the work in ensuring that questions related to the accuracy or integrity of any part of the work are appropriately investigated and resolved.
Declaration of Conflicting Interests
The author(s) declared no potential conflicts of interest with respect to the research, authorship, and/or publication of this article.
Funding
The author(s) disclosed receipt of the following financial support for the research, authorship, and/or publication of this article: This work was supported by the French government through the National Research Agency (ANR) with the reference number ANR-22-CE45-0023-01 and through 3IA Côte d’Azur Investments in the Future project, managed with reference number ANR-19-P3IA-0002. It was also supported through the HORIZON-HLTH2022-101080947-VASCUL-AID.