
Abstract
Outcomes after intervention for chronic venous insufficiency (CVI) is difficult to predict. This study aimed to develop machine learning (ML) models to predict 90-day clinical improvement after varicose vein surgery and identify key factors. This retrospective multicenter study included patients with CVI undergoing first-time varicose vein surgery between 2014 and 2024. CVI was classified according to the Clinical-Etiologic-Anatomic-Pathophysiologic (CEAP) classification and Venous Clinical Severity Score (VCSS). Clinical improvement at 90 days was defined as any decrease in CEAP stage. Three ML classifiers (Logistic Regression, Random Forest, and XGBoost) were trained to predict improvement, with nested stratified cross-validation and undersampling to address class imbalance. In total, 4015 patients were included and 87.6% showed clinical improvement at 90 days. Non-improved patients were older, had higher body mass index (BMI), and higher baseline VCSS and CEAP scores. Random Forest achieved the best overall performance, with an accuracy of 80%, recall of 75%, and F1-score of 0.49 to predict the lack of improvement, indicating effective identification of at-risk individuals. Key predictors included baseline CEAP and VCSS scores, BMI, age, and surgical variables. The overall predictive performance of ML was modest, but the models highlighted patients at risk of poor outcomes.
Introduction
Chronic venous insufficiency (CVI) is a common vascular disorder affecting millions of people worldwide. Its prevalence varies widely from <1% to 17% in men and <1% to 40% in women, increasing with age and body mass index (BMI).1,2 Far from being a cosmetic concern, CVI is associated with pain, heaviness, edema, skin changes, and venous ulcers, all of which contribute to significant impairment in quality of life and substantial healthcare costs.
Management of superficial venous incompetence (SVI) can involve various approaches, from compression therapy to surgical interventions aiming at eliminating or closing incompetent superficial veins, including surgical stripping, endovenous thermal ablation, or sclerotherapy.1,3
The severity and progression of CVI can be assessed using 2 standardized tools: the Clinical, Etiological, Anatomical, and Pathophysiological (CEAP) classification4,5 and the Venous Clinical Severity Score (VCSS). 6 CEAP provides a framework for staging disease, while VCSS is more sensitive to changes over time and widely used to evaluate treatment response. 6 Within the CEAP system, C2 refers to uncomplicated varicose veins, C3 to edema without skin changes, and C4 to C6 indicate a more advanced stage of the disease, with skin changes and ulcers. 5 Traditionally, interventional treatments were reserved for such advanced stages. However, patients with symptomatic C2 disease can also benefit from surgical or endovenous procedures, with improvements in both venous symptoms and quality of life. 7 In practice, indications for interventions are evaluated in consideration of the benefit-risk balance and in accordance with current clinical guidelines. 1
However, clinical outcomes after intervention remain heterogeneous and difficult to predict. While some patients experience substantial improvement, others only derive limited benefit. So far, only few studies have investigated whether simple, routinely collected clinical data could be used to predict postoperative outcomes.8,9 Machine learning (ML) models have so far been scarcely investigated in patients with CVI. We recently evaluated the use of ML to predict 30-day outcomes including pain and physical ability after intervention for superficial venous incompetence of the lower limbs using QualiVein, a French vascular database.10,11
In the present study, we specifically aimed to develop a predictive model to classify CVI patients according to the evolution of their post-operative clinical stage at 90 days and to identify the main clinical factors associated with lack of clinical improvement after surgery.
Methods
Study Population and Data Collection
In this retrospective multicenter study, data were extracted from the QualiVein database. 10 QualiVein is a French vascular database that collects perioperative and postoperative outcomes in patients treated for CVI. Patients with superficial venous insufficiency (SVI) who underwent varicose vein surgery intervention between January 2014 and November 2024 were included in 5 clinical sites. Inclusion criteria were: age >18 years at the time of surgery, CEAP initial classification ≥C2, first-time intervention for varicose veins (no prior procedures for recurrence). Indications for intervention were evaluated by vascular surgeons assessing the benefit-risk balance and considering current clinical guidelines. Follow-up and post-operative outcomes were evaluated at 90 days to assess clinical stage. The 30-day post-operative outcomes of patients included in the QualiVein database has been previously reported. 11 More specifically, this previous study aimed to evaluate and predict 3 main outcomes at 30-day including occurrence of complications, pain, and physical ability. Clinical improvement after surgery at 30 days was not collected in the database. The present study aims to address this research gap and evaluate clinical improvement at 90 days.
Data collected included patients’ pre-operative characteristics: age at surgery, sex, and BMI. BMI categories were defined as: underweight (<18.5 kg/m2), normal weight (18.5-24.9 kg/m2), overweight (25-29.9 kg/m2), obesity class I (30-34.9 kg/m2), and obesity class II or higher (≥35 kg/m2). The severity of CVI was evaluated according to VCSS, 6 and CEAP classification.4,5 The VCSS is a scoring system ranging from 0 to 30 that assesses the severity of CVI across multiple domains, including pain, varicose veins, edema, skin changes, inflammation, induration, active ulcers, ulcer duration, ulcer size, and number of ulcer recurrences. 6 The total aggregated VCSS score was provided by clinicians, while the individual scores per item were not available. The CEAP classification is a standardized system describing CVI according to clinical signs (C0-C6), etiology (congenital, primary, secondary), anatomy (superficial, deep, perforator veins), and pathophysiology (reflux, obstruction, or both).4,5 Only the clinical component (C) was considered, as the EAP components were not available in the database. Peri-operative data included the type of anesthesia, type of surgery, duration of the procedure, anatomical localization, and occurrence of intraoperative complications. Surgical procedures included thermal ablation techniques (radiofrequency, laser, steam ablation), non-thermal ablation techniques (foam sclerotherapy, cyanoacrylate, embolization, and mechanochemical ablation), surgical techniques (stripping, ligation, and crossectomy), and phlebectomies. Other procedures regrouped Selective Ablation of Varicose Veins under Local Anesthesia (ASVAL) and Reconstructive Procedure of the Saphenous Vein (REPAIR).
Outcomes
The primary outcome was the clinical improvement at 90 days following surgery, assessed by the change in CEAP classification between baseline (T0) and follow-up (T90). Patients whose CEAP score remained unchanged or worsened were labeled as non-responders (class 0), whereas those showing any improvement in CEAP stage were labeled as responders (class 1). Pain was evaluated based on patients’ self-assessment on a scale from 0 to 10.
Model Development
The prediction task was formulated as a binary classification problem, aiming to identify patients who would clinically improve 90 days after varicose vein surgery. Given the structure of the dataset, which contained a majority of categorical variables, most features were 1-hot encoded, to represent each category as a separate binary variable suitable for ML models. For ordinal variables such as baseline severity scores, ordinal encoding was used to preserve the natural ordering of values. Continuous variables were normalized. Due to the pronounced class imbalance in the dataset, with 87.6% of patients showing improvement (class 1) and only 12.4% showing no improvement (class 0), random undersampling was employed to balance the class distribution. This procedure was applied exclusively to the training folds during cross-validation, while the validation folds were kept intact, in order to preserve a realistic evaluation setting and prevent data leakage.
Three classification algorithms were evaluated: Logistic Regression (a parametric model), Random Forest Classifier, and XGBoost Classifier (non-parametric). Model evaluation was performed using nested stratified cross-validation, with stratification performed on the outcome variable (y). The outer loop consisted of 5 folds, ensuring an unbiased estimate of model performance on unseen data. Within each outer training set, a 3-fold inner cross-validation was conducted to tune hyperparameters. Hyperparameter tuning relied on grid search (GridSearchCV), and the final model in each outer fold was selected by optimizing the F1-score. Model performance was evaluated using the F1-score, classification report (precision, recall, F1-score per class), and confusion matrix for each fold. Final performance was aggregated across outer folds to compute a global classification report and confusion matrix for each model. Feature importance was computed based on the mean decrease in Gini impurity (Scikit-learn). 12
Statistics
Features were summarized as means (standard deviation) for continuous variables and numbers (%) for categorical variables. Missing values in continuous variables were imputed using the median. Outliers in continuous variables were identified using the interquartile range (IQR) method. VCSS values were restricted to the valid range of 0 to 30. Differences between patients with and without a 90-day improvement were assessed using independent t tests (continuous variables) and chi-square tests (categorical variables), after verifying the assumptions of each test.
Results
A total of 4015 patients met the inclusion criteria. Baseline characteristics and postoperative outcomes are summarized in Table 1; 3517 (87.6%) patients had a clinical improvement according to CEAP classification, whereas 498 (12.4%) were classified as non-improved. Non-improved patients were older (mean age 59.8 vs 53.7 years), had higher BMI (28.0 vs 25.1 kg/m2), and exhibited higher preoperative VCSS scores (8.2 vs 5.8) compared with improved patients (P < .001). Regarding CEAP classification, patients who improved were predominantly classified as C2 (63%), whereas non-improved patients showed a higher proportion of C4 (58%) at baseline (P < .001). Differences were also observed between the groups regarding type of anesthesia and primary surgical technique. Other categorical variables, including sex and pain scores, also showed statistically significant differences (Table 1). The proportion of female patients was higher in the improved group (65% vs 51%). Conversely, several variables did not differ significantly between groups. Side of surgery (right vs left), localization of varicose veins, and the overall rate of postoperative complications were comparable between improved and non-improved patients. Most patients did not experience complications (97% in both groups), and when present, complications such as hematoma, infection, or thrombosis were rare and evenly distributed. Average hospital stay was 2.77 hours ± 1.66 in patients who improved (vs 2.83 ± 0.71 in the non-improved group, P < .05).
Comparison of Baseline Characteristics Between Patients Who Improved and Those Who Did Not.
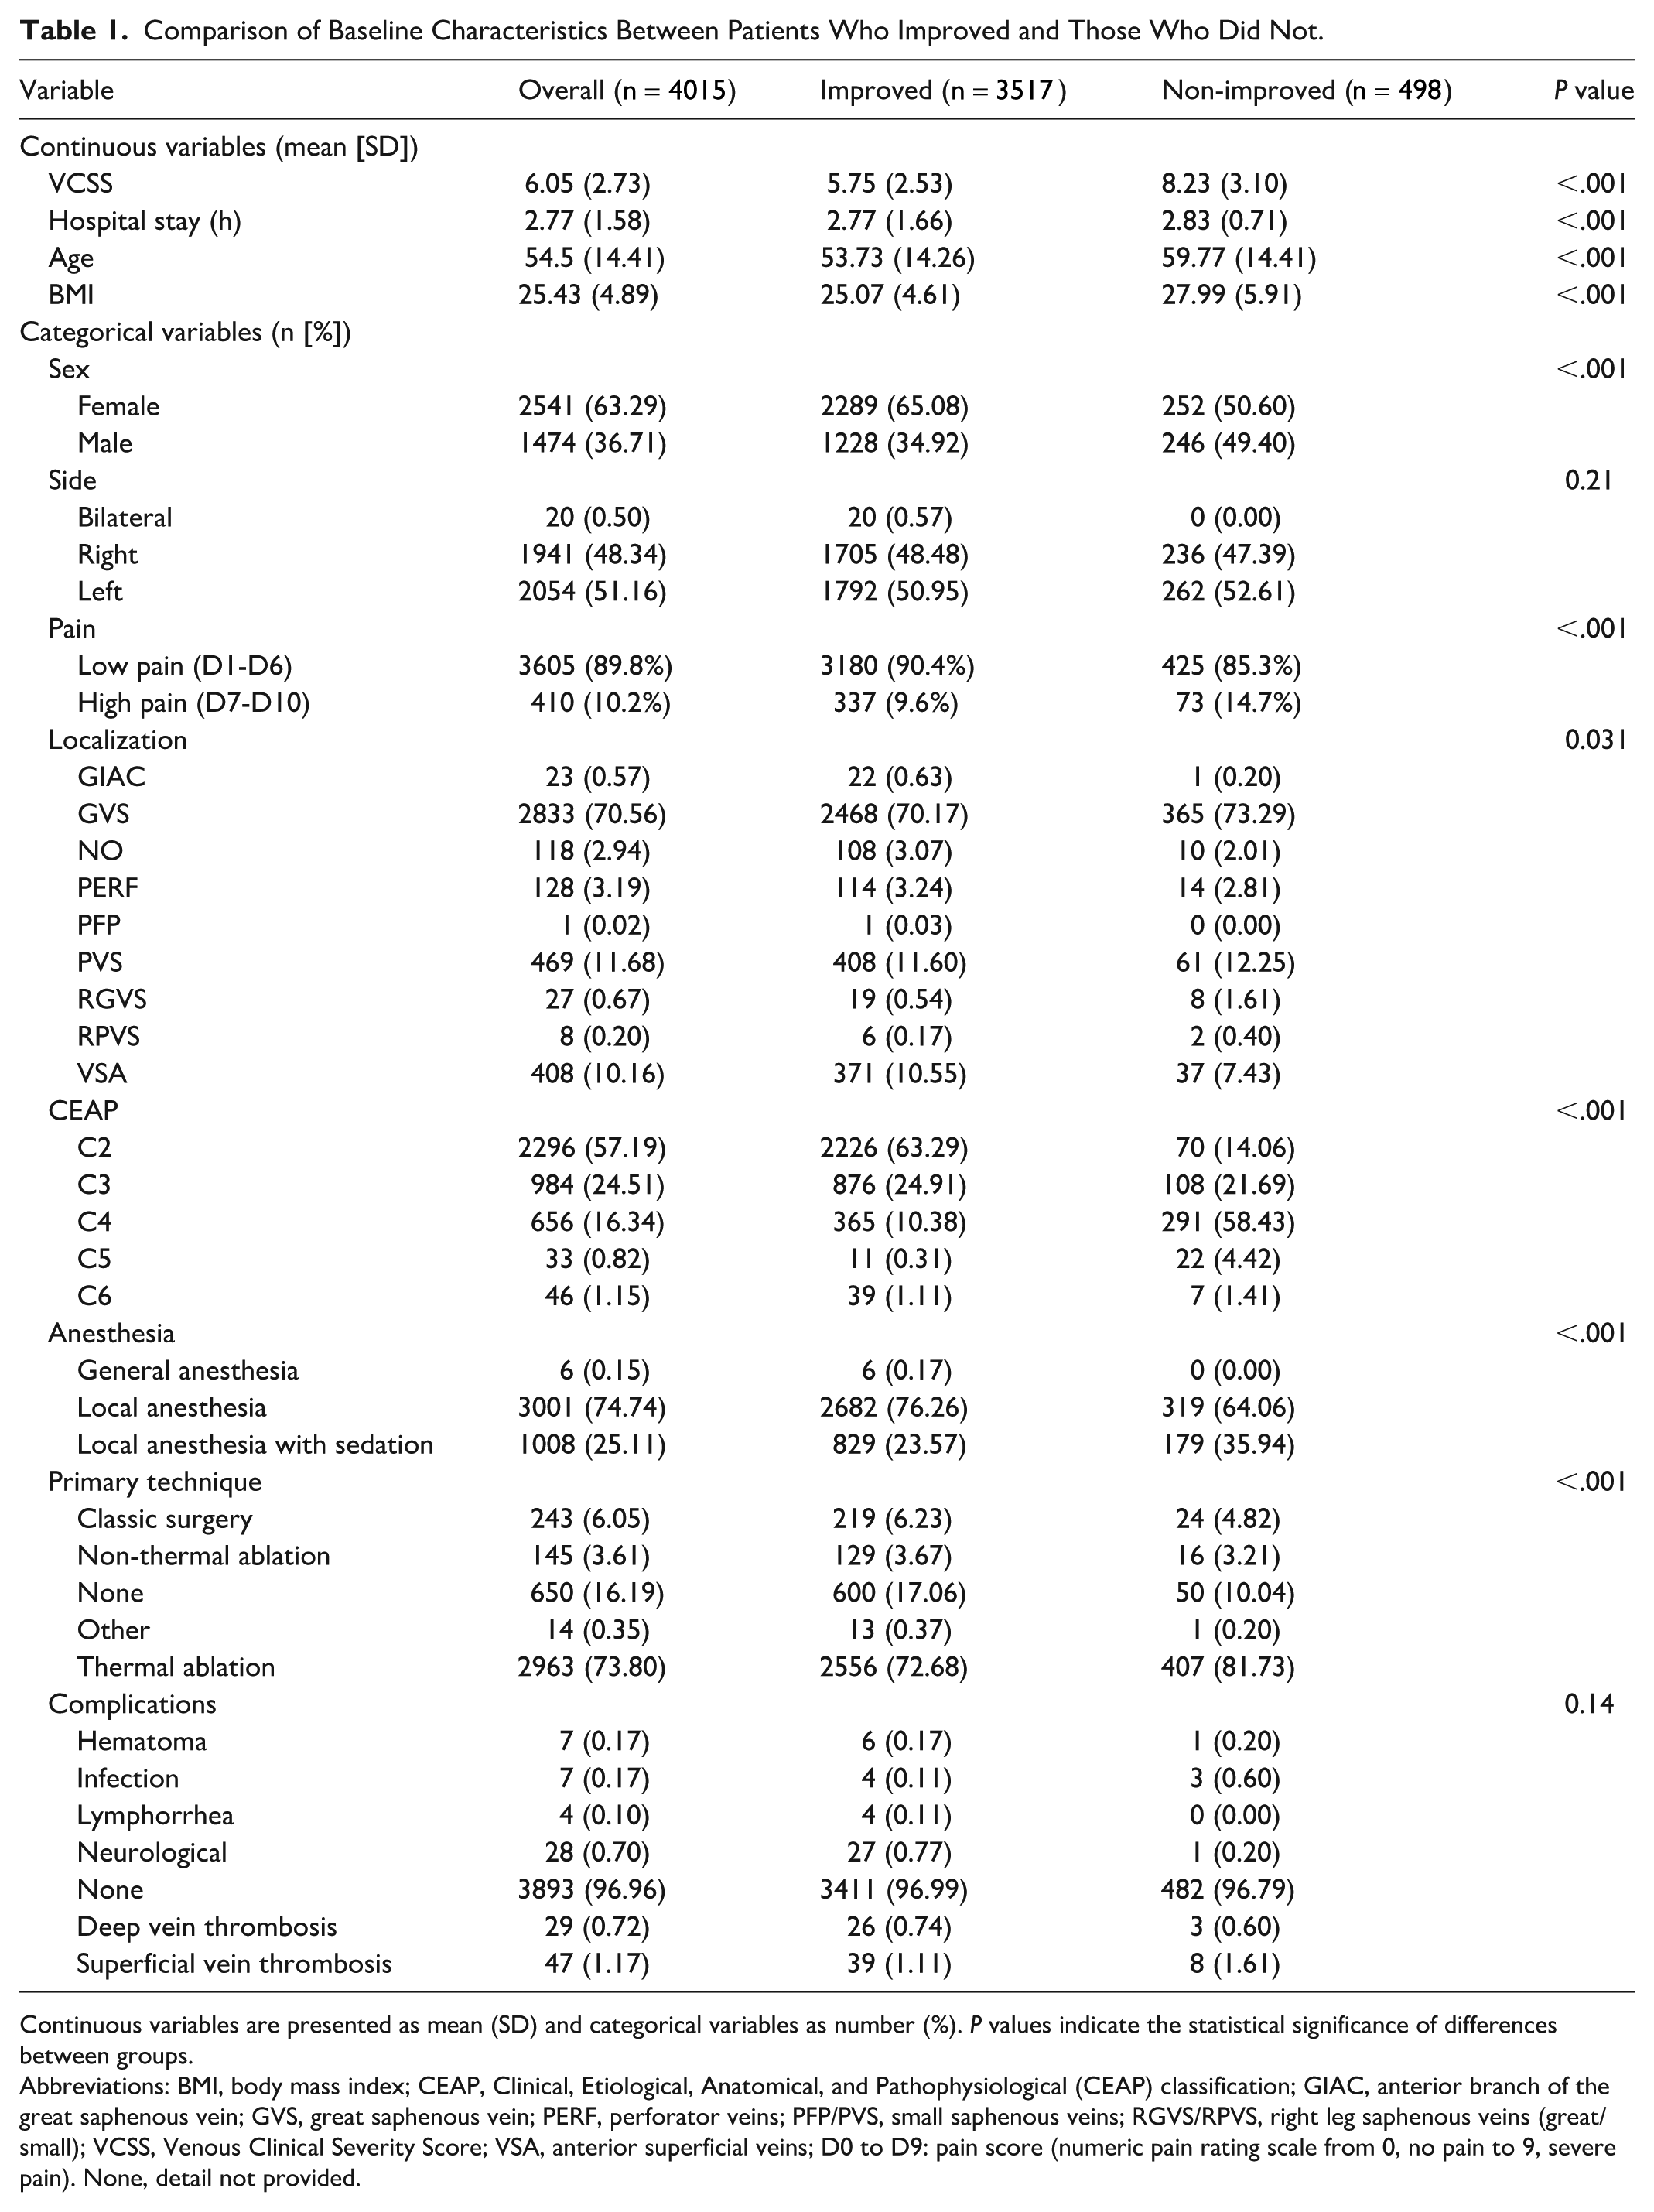
Continuous variables are presented as mean (SD) and categorical variables as number (%). P values indicate the statistical significance of differences between groups.
Abbreviations: BMI, body mass index; CEAP, Clinical, Etiological, Anatomical, and Pathophysiological (CEAP) classification; GIAC, anterior branch of the great saphenous vein; GVS, great saphenous vein; PERF, perforator veins; PFP/PVS, small saphenous veins; RGVS/RPVS, right leg saphenous veins (great/small); VCSS, Venous Clinical Severity Score; VSA, anterior superficial veins; D0 to D9: pain score (numeric pain rating scale from 0, no pain to 9, severe pain). None, detail not provided.
Taken together, these findings suggest that baseline severity (VCSS, CEAP), age, BMI, sex, anesthesia, and surgical technique are associated with changes of clinical stage at 90-day, whereas side of surgery, localization, and complication rates were not different among the groups.
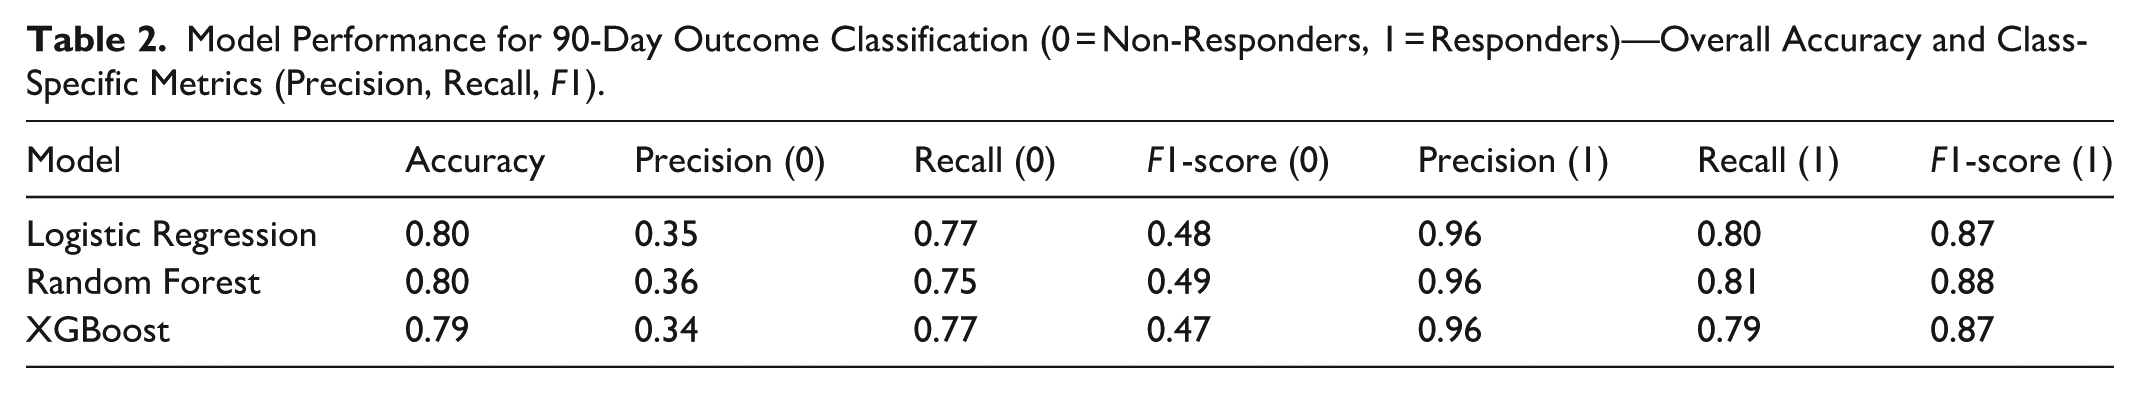
The performance of the models in classifying postoperative improvement at 90 days is summarized in Table 2 and Figure 1. Among the models tested, the Random Forest classifier achieved the highest overall accuracy (80%) and demonstrated the best balance between precision and recall for both classes. For the majority class, precision was very high (~96%), and recall reached 81% to identify improved patients. In contrast, for the minority class (patients who did not improve), precision remained relatively low (~36%), while recall was substantially higher (~75%). In a clinical setting, high recall is valuable because correctly identifying as many non-responders as possible is critical to avoid leaving patients without the necessary follow-up or alternative treatment, even if this also resulted in a higher number of false positives (low precision). Overall, the performances of the 3 models were quite similar (Table 2).
Model Performance for 90-Day Outcome Classification (0 = Non-Responders, 1 = Responders)—Overall Accuracy and Class-Specific Metrics (Precision, Recall, F1).
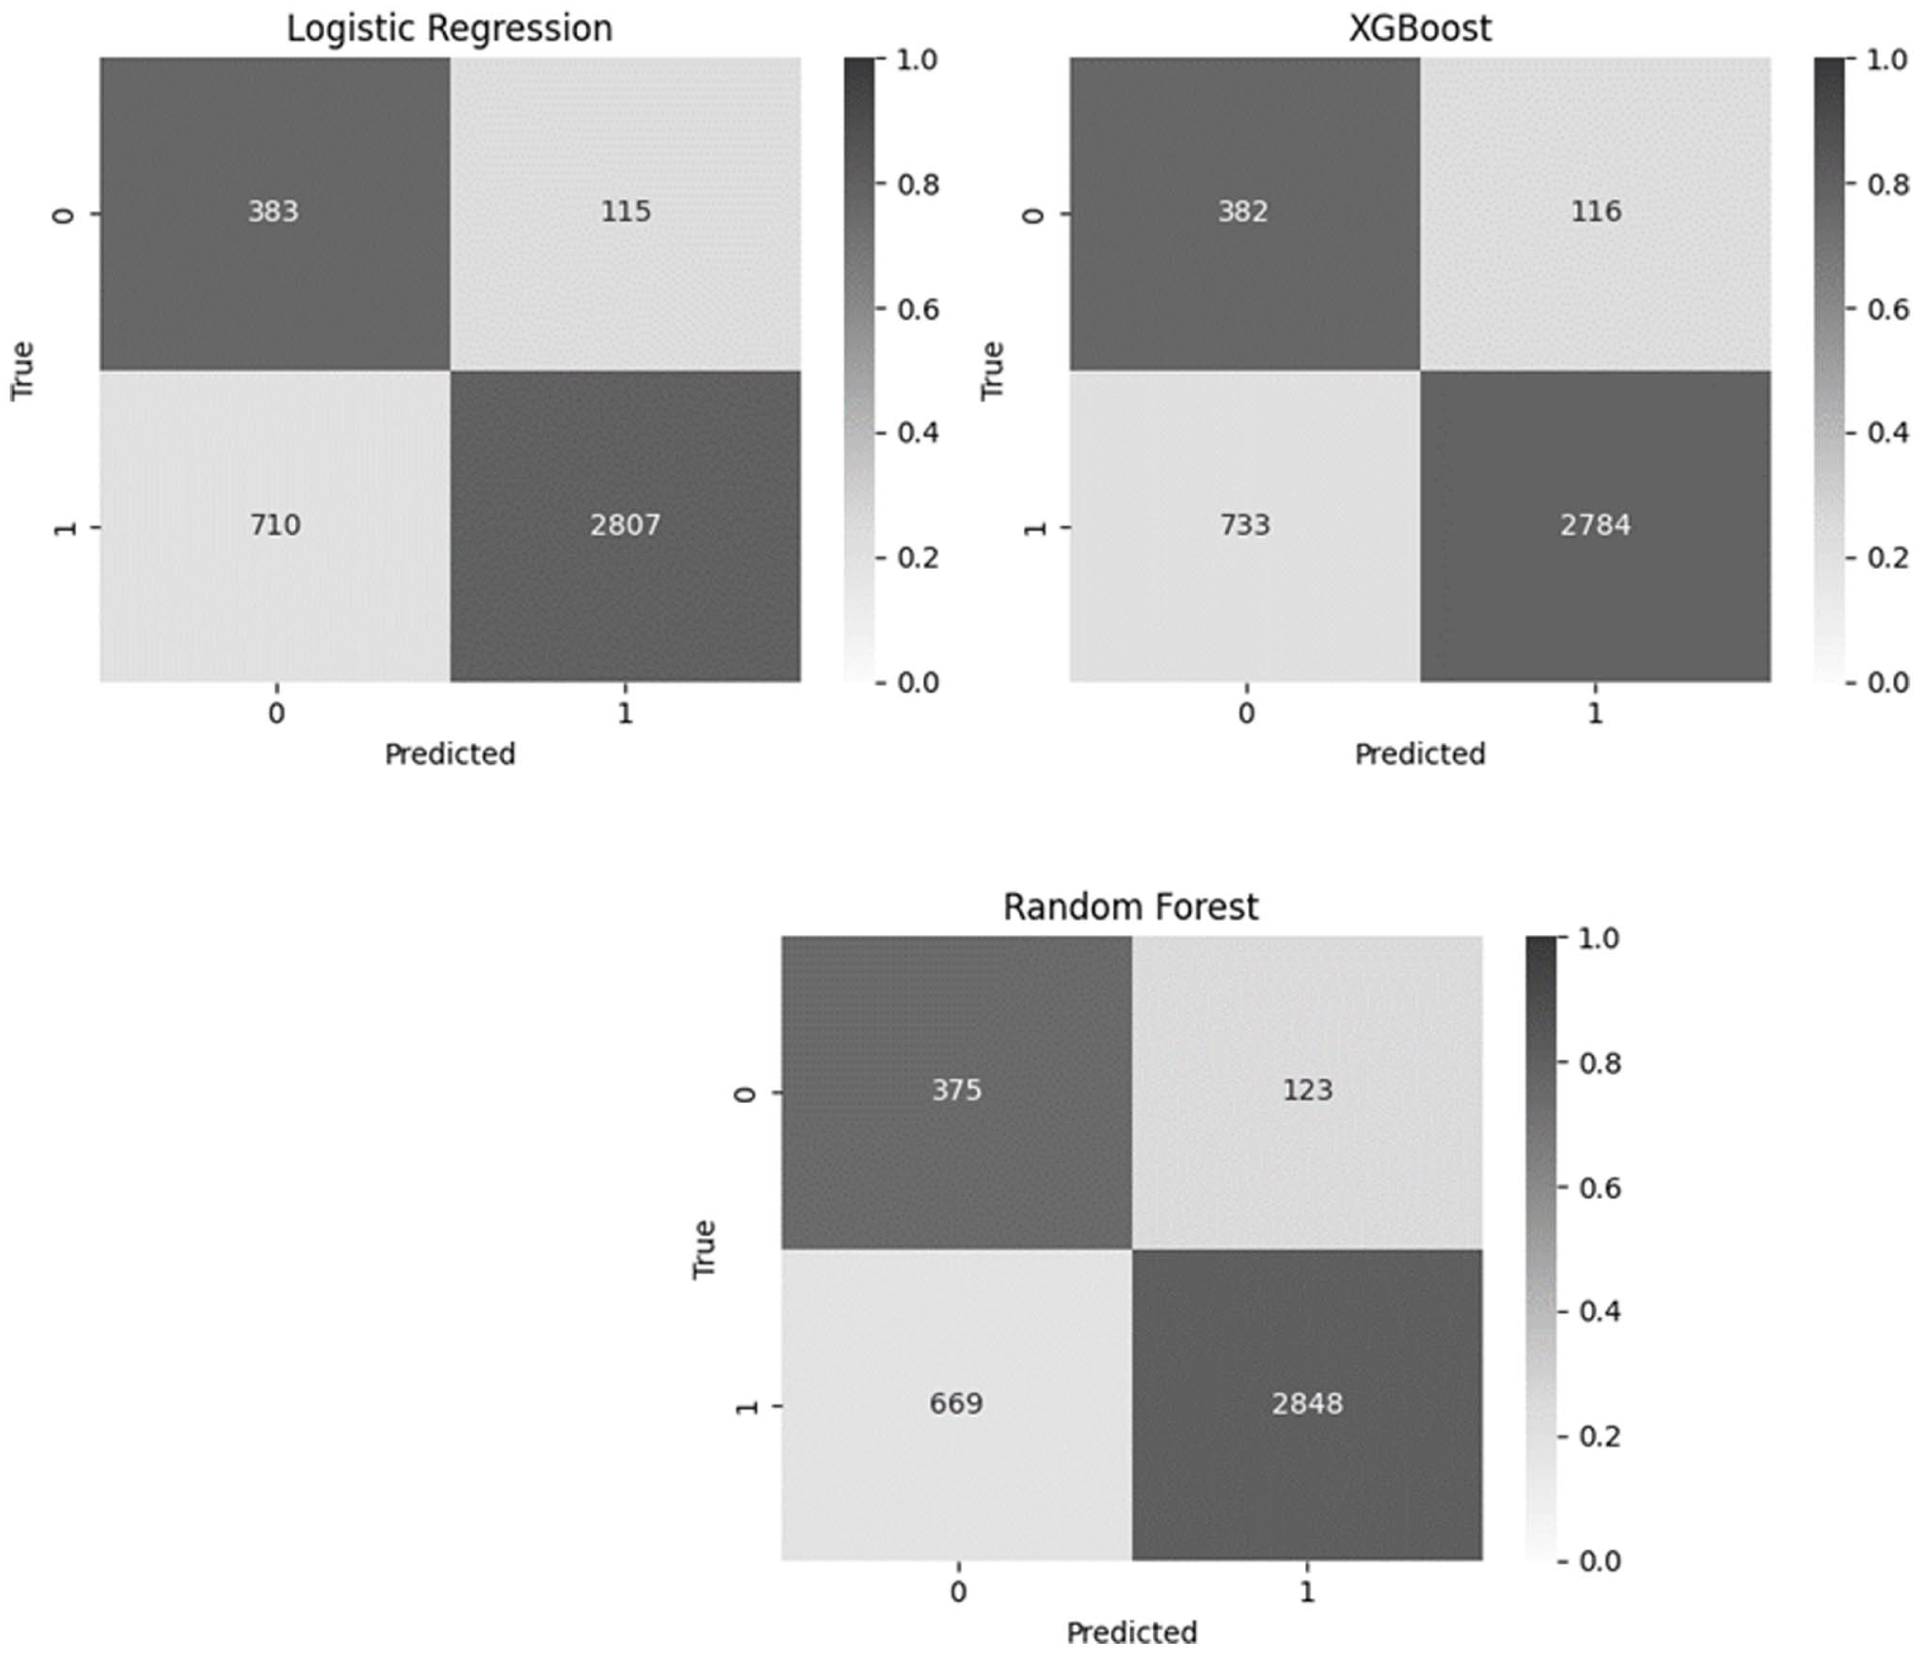
Overall confusion matrices for the Random Forest, Logistic Regression, and XGBoost models.
To further interpret the Random Forest model, feature importance was computed based on the mean decrease in Gini impurity (Figure 2). This analysis highlighted several key predictors influencing the classification of postoperative improvement, including baseline severity scores (CEAP and VCSS), surgical variables with number of phlebectomies, and patient demographics (age, BMI).
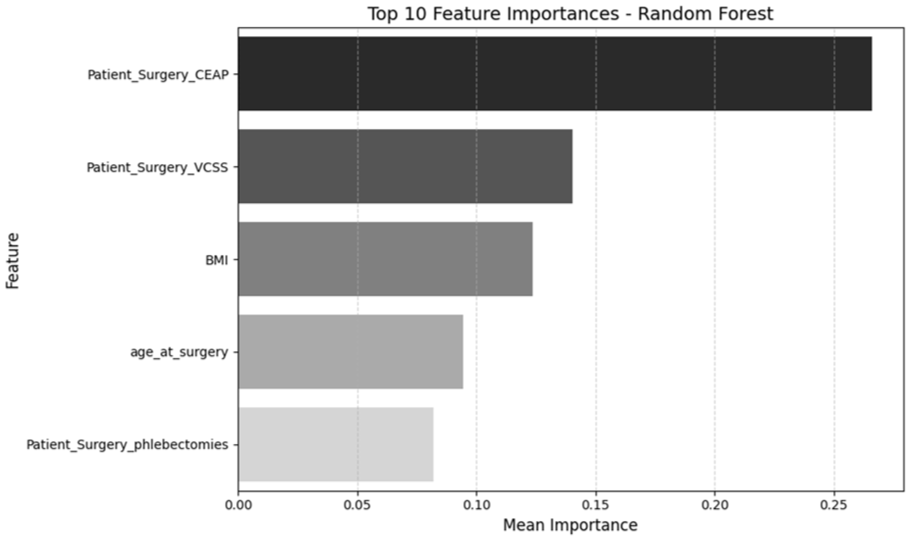
Feature importance plot showing the most influential variables for the Random Forest model.
Given that BMI consistently emerged among the most influential predictors according to the ML models, we performed an additional logistic regression analysis to quantify its independent association with clinical improvement. Figure 3 shows the proportion of improved versus non-improved patients within each BMI category. The proportion of patients who did not improve increases with the severity and stage of obesity (34% and 23% of non-improved patients in the group obesity class II+ and class 1, respectively, versus 8% of non-improved in the group with normal weight, P < .001). Individuals with higher BMI—particularly those classified as Obesity class I and class II+—have significantly lower odds of improvement compared with individuals with normal weight (odds ratio [OR] = 0.30 and 0.18, respectively, P < .001) (Table 3). The association is both statistically significant and progressively stronger with increasing BMI.
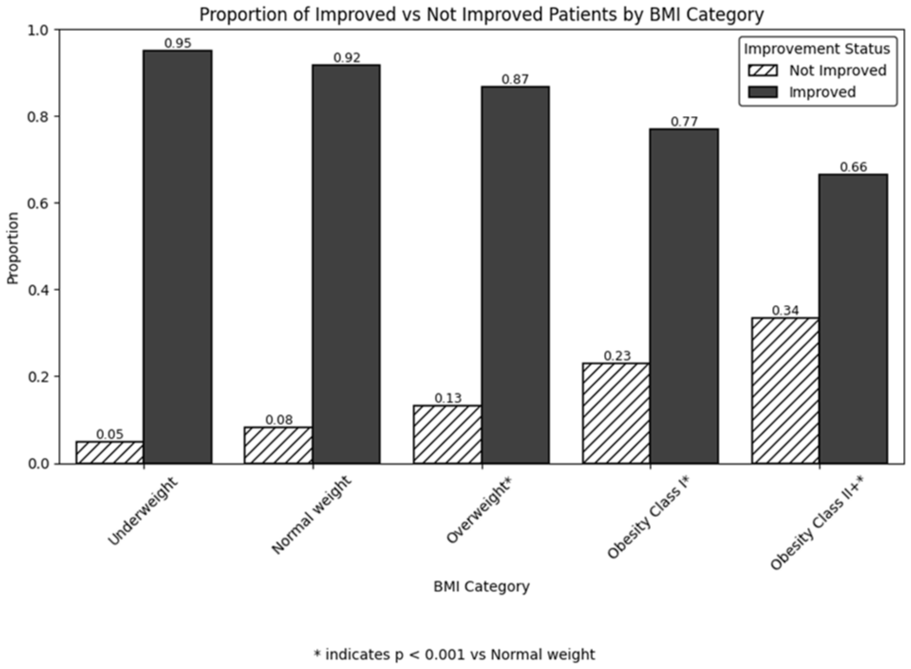
Proportion of patients improved versus not improved by BMI category.
Effect of BMI on the Improvement of CEAP Classification.
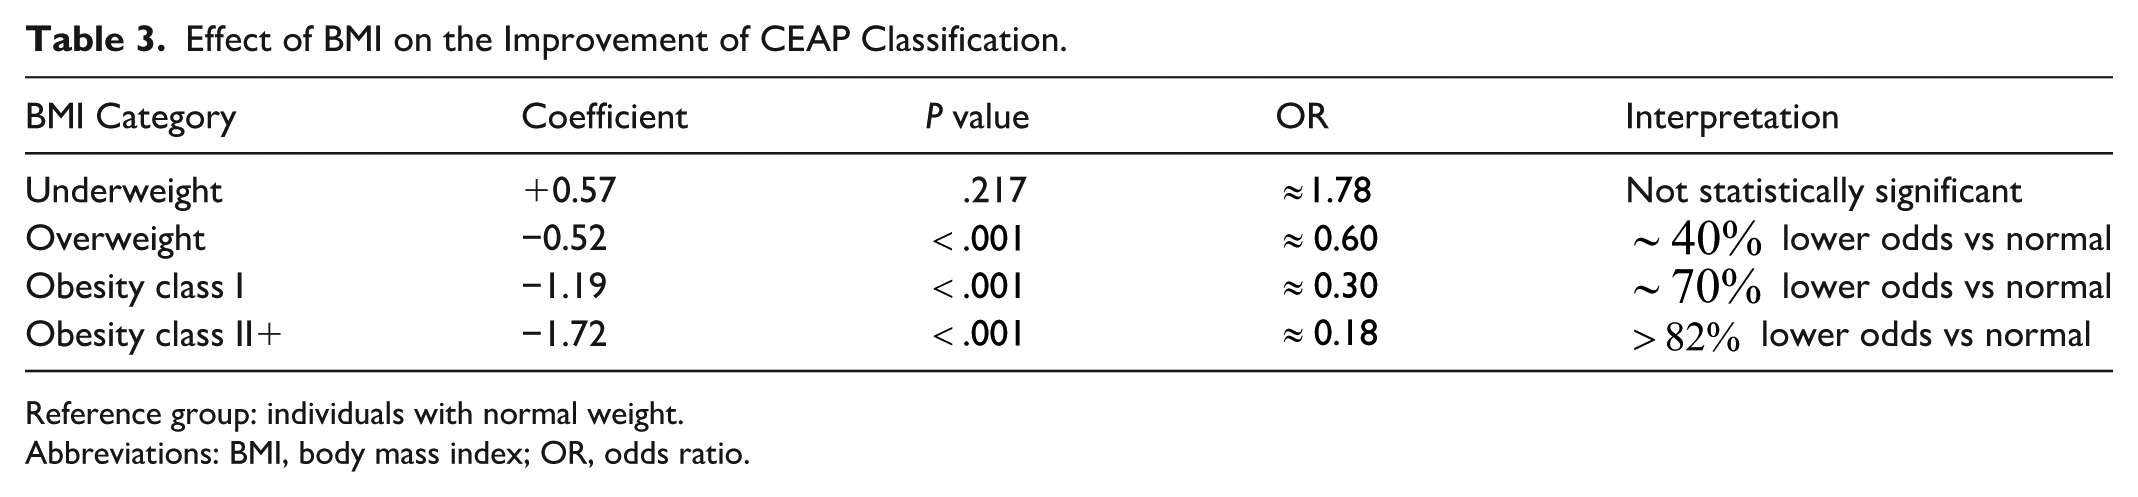
Reference group: individuals with normal weight.
Abbreviations: BMI, body mass index; OR, odds ratio.
Discussion
The present study developed and evaluated ML models to predict clinical improvement at 90 days after varicose vein surgery. Overall model performance was modest, but several observations provide clinically relevant insights. Baseline CEAP and VCSS scores consistently emerged as the strongest predictors of postoperative improvement. CEAP provides a stable, categorical measure of disease severity, while VCSS is highly sensitive to minor changes, making interpretation of small variations challenging when item-level data are unavailable. As disease severity was associated with poorer outcomes, it is not surprising that differences regarding the proportion of type of anesthesia and type of surgical techniques were observed between patients who improved and those who did not improve. BMI also consistently ranked among the top predictors. Logistic regression analysis focusing on BMI alone demonstrated that higher BMI was associated with a lower likelihood of postoperative improvement.
Model performance in the minority class was limited, with relatively low precision and a high false-negative rate, indicating that some patients who improved were misclassified. Nevertheless, recall for identifying patients who did not improve was good, suggesting that the models prioritized detecting non-responders. This may be clinically relevant, as identifying patients at risk of poor outcomes is essential for guiding post-operative care and monitoring.
Additionally, undersampling strategies generally yielded more reliable performance than oversampling approaches. This likely reflects the narrow decision boundary between improved and non-improved patients, as generating synthetic cases may introduce artificial patterns that do not correspond to meaningful clinical differences, adding noise rather than improving discrimination. Undersampling reduces the dominance of the majority class while preserving the integrity of the underlying clinical data distribution.
Finally, all patients in our cohort underwent surgery for varicose veins, including those with C2 disease—a stage sometimes debated as a surgical indication. By evaluating outcomes at 90 days, our study helps clarify which patient groups derive tangible benefit from surgery and where alternative management strategies may be more appropriate. Overall, these findings highlight that baseline CEAP and VCSS scores, BMI, age, number of phlebectomies, and surgical modality are relevant factors influencing post-operative outcomes. However, the high rate of false negatives indicates that additional predictive variables may be needed to fully capture post-operative trajectories.
A few studies investigated the use of ML to predict outcomes after varicose vein surgery.13,14 Li et al assessed 1-year outcomes using the VCSS and analyzed a large cohort of 33 924 patients from the Vascular Quality Initiative (VQI), with 111 perioperative variables. 8 We focused on CEAP-based outcomes at 90 days, using a more limited but routinely collected set of predictors: aggregated VCSS, CEAP, age, sex, BMI, anesthesia type, number of phlebectomies, and intraoperative complications. Differences in patient distribution also stand out: our cohort spanned C2 to C6, with a majority of C2 class, while Li et al 8 studied a more uniform C2 to C4 population and excluded advanced stages (C5-C6). This may partly explain differences in complication rates and outcome profiles. However, both our study and that of Li et al consistently identified baseline disease severity, measured by CEAP and VCSS, as strong predictors of outcomes. Although these scores are both designed to reflect disease severity, they do not exactly capture the same information and provide complementary predictive insights. Importantly, our study contributes to the state of the art by reporting class-specific performance metrics (recall, precision, F1-score), whereas the other study relied on area under the receiver operating characteristic curve (AUROC) and Brier scores, which may overestimate performance in minority classes.
Pinto Rodriguez et al assessed factors associated with lack of clinical improvement after vein ablation through multivariable logistic regression and they demonstrated that baseline disease severity was a key predictor. 9 These results are in line with our findings, with ML models identifying VCSS and CEAP classification among the top predictors of lack of clinical improvement. While Pinto Rodriguez et al focused on association analysis using traditional regression, our study leveraged ML techniques to build predictive models, extending these insights toward individualized risk prediction.
Beyond disease severity, our models also highlighted age and BMI as important predictors. BMI is a well-established risk factor for postoperative complications, and our findings confirm its strong influence.15,16 Current clinical guidelines highlight the importance of obesity in CVI as it contributes to the severity of the disease, influences treatment strategies and outcomes. 1 In this study, we observed a significant difference in age between improved and non-improved patients, and age was identified among the main features in the predictive models. This is corroborated by another study that reported that younger groups (age <65 years) had greater improvements in patient-reported outcomes, although they experienced similar improvements in CEAP and VCSS compared with older patients. 17 While analysis of feature importance identified disease severity, BMI, and age as the most influential variables in the Random Forest model, it is important to note that the model captures non-linear patterns. The model therefore reflects and helps to evaluate how risk changes within patient profiles. Such approach may improve the identification of patients at risk of non-clinical improvement, allowing to develop individualized follow-up strategies.
This study has some limitations, and future perspectives for improvement can be suggested. Our study used aggregated VCSS scores rather than item-level data. Individual VCSS components, such as edema, pigmentation, ulceration, or pain, could provide additional predictive power. Future work could enrich the dataset with item-level scores and explore optimal ways to combine CEAP and VCSS to better quantify clinically meaningful improvement. A key direction for potential improvement would be the integration of multimodal data. In addition to clinical and demographic variables, incorporating imaging data could provide richer information for predictive models and help capture subtle aspects of disease severity to improve performance, particularly for the minority class of non-improved patients. Finally, while outcomes were assessed at 90 days, longer-term follow-up may reveal recurrences and/or delayed complications.
Conclusion
The present study demonstrated that routinely collected clinical data can be used to predict 90-day outcomes after varicose vein surgery using ML. Baseline CEAP and VCSS scores consistently emerged as the most informative predictors. BMI also ranked among the top predictors, further supporting its clinical relevance in venous disease prognosis. Beyond individual predictors, this study emphasizes the value of assessing 90-day clinical improvement as a meaningful medium-term outcome. Such a time horizon provides a practical benchmark to evaluate the effectiveness of surgery and detect early signs of recurrence. Although overall model performance was modest, the ability to identify key prognostic factors from clinical data is encouraging. Importantly, our modeling deliberately mirrored the perspective of the clinician, relying only on the type of information typically easily available in everyday practice. In this context, the observed misclassifications appear to stem from overlapping patient profiles rather than algorithmic shortcomings, pointing to the need for richer datasets rather than more complex methods. These findings provide a strong foundation for future research that combines clinical data with complementary sources such as imaging to further enhance predictive accuracy. Taken together, this work shows that even basic clinical information can yield meaningful prognostic insights.
Footnotes
Acknowledgements
Dr Denis Garnier, Dr Arnaud Dubouis, Dr Dorothée Trombert, Dr Alberic De Lambert, Dr Héloïse Auque, Dr Emilie Dauphin, Dr Laurence Destrieux, Dr Emilie Charmoille, Dr Stéphane Mayeux, Dr Jessica Morel, Dr Matthieu Pecher, Dr Laurent Voirin, Dr Jean-Christophe Delva, Dr Jana Konecna, Dr Meryl Favier de Lachomette, Dr Sébastien Penillon, Dr Bertrand Chavent, Dr Denis Creton for their contribution to the QualiVein database.
Ethical Considerations
The platform has been recognized by the French National Agency “Haute Autorité de Santé” and the study registered under the number 1715907v1.
Funding
The authors disclosed receipt of the following financial support for the research, authorship, and/or publication of this article: This work was supported by the French government through the National Research Agency (ANR) with the reference number ANR-22-CE45-0023-01 and through 3IA Côte d’Azur Investments in the Future project, managed with reference number ANR-23-IACL-0001.