
Abstract
This single-center prospective observational follow-up study aimed to evaluate 2-year changes in carotid plaque volume and echogenicity and to explore whether clinical and biochemical baseline factors are associated with plaque progression. It was an exploratory observational follow-up of patients with echolucent plaques previously enrolled in a 12-month randomized controlled trial. Plaque volume and grayscale median were measured at baseline and at 3, 6, 12, and 24 months using three-dimensional ultrasound (3D-US). Associations between baseline characteristics and plaque progression were evaluated using mixed-effects models with time-predictor interactions, adjusted for baseline plaque volume. Medication adherence from 12 to 24 months was examined. Plaque echogenicity remained stable over 24 months, whereas mean plaque volume increased with heterogeneous patterns. Approximately 20% of plaques were classified as progressors, 70% as stable, and 10% as regressors. Higher mean arterial pressure, low density lipoprotein cholesterol (LDL-C), and larger baseline volume were significantly associated with plaque progression. Poor statin adherence showed a non-significant trend toward greater progression. In conclusion, echolucent carotid plaques demonstrated stable echogenicity but volumetric progression over 24 months. Blood pressure, LDL-C, and baseline plaque size were associated with progression, although limited by sample size, supporting a role for longitudinal 3D-US plaque volume assessment in individualized cardiovascular prevention.
Keywords
Introduction
Carotid atherosclerosis is an important cause of ischemic stroke and a significant contributor to cerebrovascular morbidity and mortality. 1 Plaque composition, including lipid-rich necrotic core, intraplaque hemorrhage, ulceration, and neovascularization, is increasingly recognized as a critical determinant of plaque instability and risk of stroke.2 -4 Vulnerable plaques, which appear echolucent on ultrasound, often contain lipid-rich cores, inflammation, and hemorrhage, predisposing them to rupture and cause thromboembolic events.4 -6 Despite this, traditional risk assessment has largely focused on degree of luminal stenosis, even though echolucent plaques have been shown to increase stroke risk independently of stenosis degree. 3 This shift in understanding highlights the importance of assessing plaque characteristics beyond stenosis to better identify high-risk individuals.
In addition to plaque composition, overall plaque burden is increasingly recognized as a key marker of atherosclerotic disease activity and future event risk. Plaque volume has been identified as a strong predictor of cerebrovascular events,7,8 and large plaque burden has been incorporated as a major criterion for high-risk plaques in the recent Journal of the American College of Cardiology (JACC) position statement. 9 Importantly, larger plaque volume and faster plaque progression have been associated with increased risk of cerebrovascular and cardiovascular events, independently of stenosis degree.10 -12
Non-invasive imaging techniques, particularly three-dimensional ultrasound (3D-US), enable reproducible and accurate quantification of plaque volume. 3D-US provide the opportunity to monitor plaque progression longitudinally.8,13 -16 Beyond size, 3D-US also allows for evaluation of plaque composition through measurement of echogenicity assessed with grayscale median (GSM). Lower GSM values reflect echolucent, lipid-rich, and potentially unstable plaques, whereas higher GSM values indicate more fibrotic and calcified plaques.17,18
Our prior randomized controlled trial (RCT; CTIS trial no. 2024-518539-13-00) 19 found no significant morphological changes in echolucent carotid plaques after 12 months of optimized medical therapy with or without rivaroxaban 2.5 mg twice daily. The trial was based on the hypothesis that rivaroxaban, through its proposed anti-inflammatory properties,20 -23 might lead to plaque stabilization as reflected by an increase in GSM value. The absence of detectable changes suggests either that rivaroxaban does not alter plaque morphology or that the 12-month observation period was insufficient to capture such effects, underlining the importance of a longer follow-up.
Thus, this two-year study extended the RCTs follow-up using 3D-US to examine longer-term changes in plaque volume and GSM and to identify potential baseline characteristics associated with plaque progression. Given the potential role of adherence in modifying disease progression and evidence suggesting that >50% of patients eventually discontinue prescribed statin treatment, 24 statin compliance was also evaluated during follow-up. The aim of the study was to characterize the natural history of echolucent carotid plaques over 24 months and to explore baseline clinical and biochemical factors associated with plaque progression.
Materials and Methods
Study Design
An observational, single-center cohort study as a continuation after a 12-month RCT. This study is a 24-month follow-up of patients enrolled in a previously published RCT 19 investigating rivaroxaban’s effect on echolucent carotid plaques in patients with stable, non-critical peripheral artery disease (PAD). Given the sample size, the study was considered exploratory and hypothesis-generating. It is reported according to Strengthening the Reporting of Observational Studies in Epidemiology (STROBE) guidelines. 25
Patients
As part of the first study 19 reporting 12-month results of rivaroxaban’s effect on plaque morphology in 62 patients with stable PAD, all patients were screened at baseline for asymptomatic carotid disease by ultrasound duplex scanning. Stable PAD was defined as intermittent claudication or prior revascularization. Eligible patients had echolucent plaques in the common or internal carotid artery with a thickness ≥2.5 mm and no history of ischemic stroke. Patients with exclusively echogenic plaques were excluded. The 62 patients were all invited to an additional 24-month follow-up study, including medical history, carotid ultrasound, and blood samples. Throughout both the first 12 months and the 12 to 24 months, patients underwent medical optimization, including statin therapy with a target low density low-density lipoprotein cholesterol (LDL-C) level <1.4 mmol/L as recommended in latest guideline. 26 When indicated, antihypertensive and antidiabetic treatments were advised to be adjusted by patients’ private practitioners, towards guideline recommendations of a blood pressure <140/90 mmHg and HbA1c < 48 mmol/mol.
Plaque Selection and Ultrasound Procedure
Patient selection and carotid ultrasound methods were previously detailed in the first publication 19 and are summarized here. All scans were performed using the same ultrasound system and transducer (EPIQ 7, Philips Healthcare, Bothell, WA, USA, Software version 6.0 and XL14-3 xMATRIX transducer).
The most echolucent plaque ≥2.5 mm in thickness was defined as the index plaque in the first study and was also used as the index plaque in this second study. Plaque volumes were measured in mm3 and were defined to start as the thickness exceeded 1.0 mm. GSM values were standardized for differences in ultrasound gain settings using a backscatter reference phantom image obtained immediately after each scan. This calibration followed established phantom-based methods for ultrasound backscatter standardization. 27 The reference phantom consisted of Zerdine hydrogel (CIRS, Norfolk, VA, USA), 10 cm deep with a 2 cm acoustic absorbing layer. Image analysis was carried out with prototype software from Philips HealthTech (CM2022, Philips HealthTech Innovation, Paris, France). All 24-months follow-up examinations and image analyses were carried out by first author MLJ. Given the use of a single observer, identical equipment, and a standardized imaging protocol, reproducibility was addressed by applying a progression threshold that exceeded known measurement variability of 3D-US.
Outcomes and Baseline Characteristics
Baseline characteristics collected at study entry included age, sex, lipid profile (including high-density lipoprotein cholesterol [HDL-C], LDL-C, very-low-density lipoprotein cholesterol [VLDL-C], total cholesterol, and triglycerides), C-reactive protein (CRP), body mass index (BMI), and comorbidities. Lipid concentrations were measured in mmol/L. CRP was categorized according to the American Heart Association guidelines into low risk (<1 mg/L), intermediate risk (1–3 mg/L), and high risk (>3 mg/L). 28 Total cholesterol, LDL-C, and HDL-C were measured directly. VLDL-C was calculated according to the local laboratory standard as total cholesterol minus HDL-C and LDL-C. 29
Outcomes were assessed at baseline and 3, 6, 12, and 24 months of follow-up. The primary outcomes were plaque echogenicity, quantified as GSM, and plaque volume in mm3, both measures by 3D-US. We assessed LDL-C and medication adherence at all visits. As adherence to statins appeared to decline over time, an exploratory analysis was conducted to examine whether non-compliance was associated with plaque progression. Cardiovascular events are in this study defined as either a major adverse cardiovascular event (MACE) including myocardial infarction, stroke, or cardiovascular mortality 30 or a major adverse limb event including acute or chronic limb ischemia leading to intervention or major amputation. 31
To define thresholds for plaque progression and regression from baseline to 24 months, a 40% threshold was chosen. A prior 6-year longitudinal study 32 used a 100% increase/decrease to classify progressors/regressors, whereas reproducibility studies of 3D-US report minimal detectable changes of 10% to 20% for larger plaques and up to 35% for smaller plaques. 33 Given these ranges and the shorter follow-up interval in our study, a 40% threshold was selected to reflect change beyond expected measurement variability, as 40% exceeds the expected measurement variability.
Statistical Analyses
Continuous variables are presented as median with interquartile range, and categorical variables as counts and percentages. Longitudinal changes in plaque volume and echogenicity were analyzed using linear mixed-effects models with a random intercept for each patient to account for repeated measurements. Time (months) was included as a fixed effect. To explore potential baseline characteristics associated with plaque progression, separate models were fitted for each baseline variable, with plaque volume as the dependent variable and time, the characteristic, and their interaction (time × variable) as fixed effects. This interaction term evaluated whether plaque progression over time varied by levels of the baseline variable. All models were adjusted for baseline plaque volume. Separate models for each baseline characteristic were chosen to avoid multivariable overfitting given the sample size. The association between medication compliance and plaque progression from 12 to 24 months was examined with a linear regression model adjusting for 12 months plaque volume.
All analyses were considered exploratory and hypothesis-generating. No correction for multiple testing was applied, and P-values should therefore be interpreted as indicative rather than confirmatory. To assess the robustness of the findings, sensitivity analyses were conducted including only participants who completed the 24-month follow-up. Longitudinal models were re-estimated within this subgroup to verify whether associations observed in the full cohort were consistent when restricted to patients with complete data across all timepoints.
Statistical significance was set at P < .05, 2-sided. Analyses were performed using R version 4.3.2 (R Foundation for Statistical Computing, Vienna, Austria) with the LMMstar package for mixed-effects modelling and ggplot2 for data visualization.
Results
A total of 62 plaques in 62 patients were analyzed at baseline, with 87% (n = 54) of patients completing the 24-month follow-up, the full flowchart of patients are in Figure 1. Hereof, 52 plaques were examined with ultrasound (2 patients attended 24 months visit with no ultrasound—1 had carotid endarterectomy of the index plaque after inclusion in the first study, and 1 patient’s scans were lost). The patients median age at baseline was 69 years (IQR 63-76 years), 38.7% (n = 24) were female and they had a median duration of their PAD of 4.0 years (IQR: 2-8 years). With a median follow-up of 3.8 years (IQR: 3.5-4.3 years) from baseline (all patients followed), 24% (n = 15) experienced a cardiovascular event, hereof 2 myocardial infarctions, 5 strokes, 13 PAD progressions leading to revascularization or major amputation.
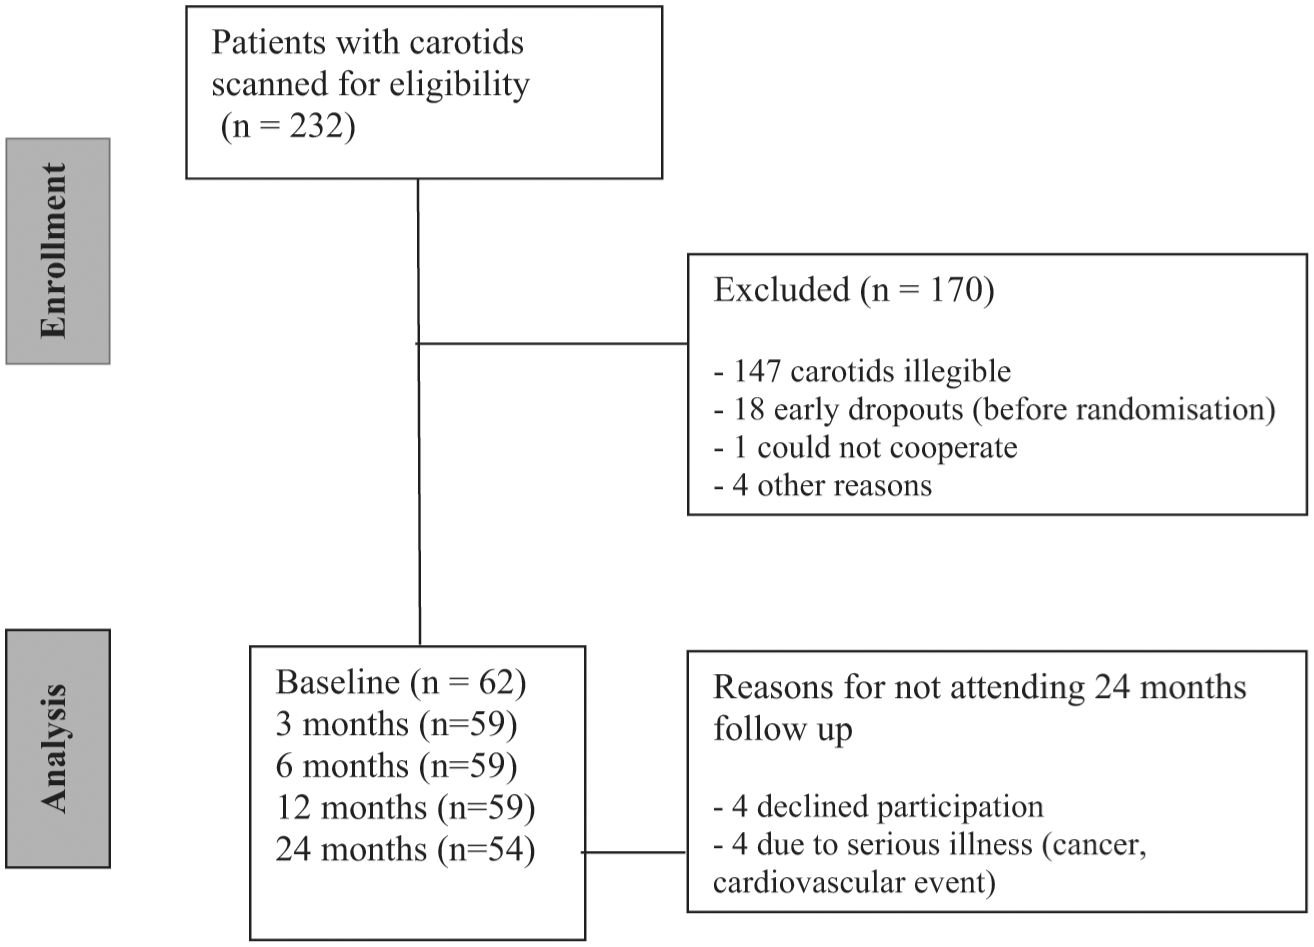
Flowchart of patients.
Longitudinal Changes in Plaque Volume and Echogenicity
Median plaque volume remained stable over the follow-up period (Figure 2). However, mean plaque volume increased, and a mixed-effect model showed a significant positive slope of ≈8.6% per year (P = .006) for relative plaque volume change, shown in Figure 3. We investigated the relationship between baseline and 24-month plaque volumes in Figure 4, 21.2% (n = 11) of plaques were progressors, 69.2% (n = 36) were stable, and 9.6% (n = 5) were regressors. Cardiovascular events were distributed as follows: 1 event in the progression group (9%), 9 events in the stable group (25%), and no events in the regressor group; however, these differences were not statistically significant (P = .39).
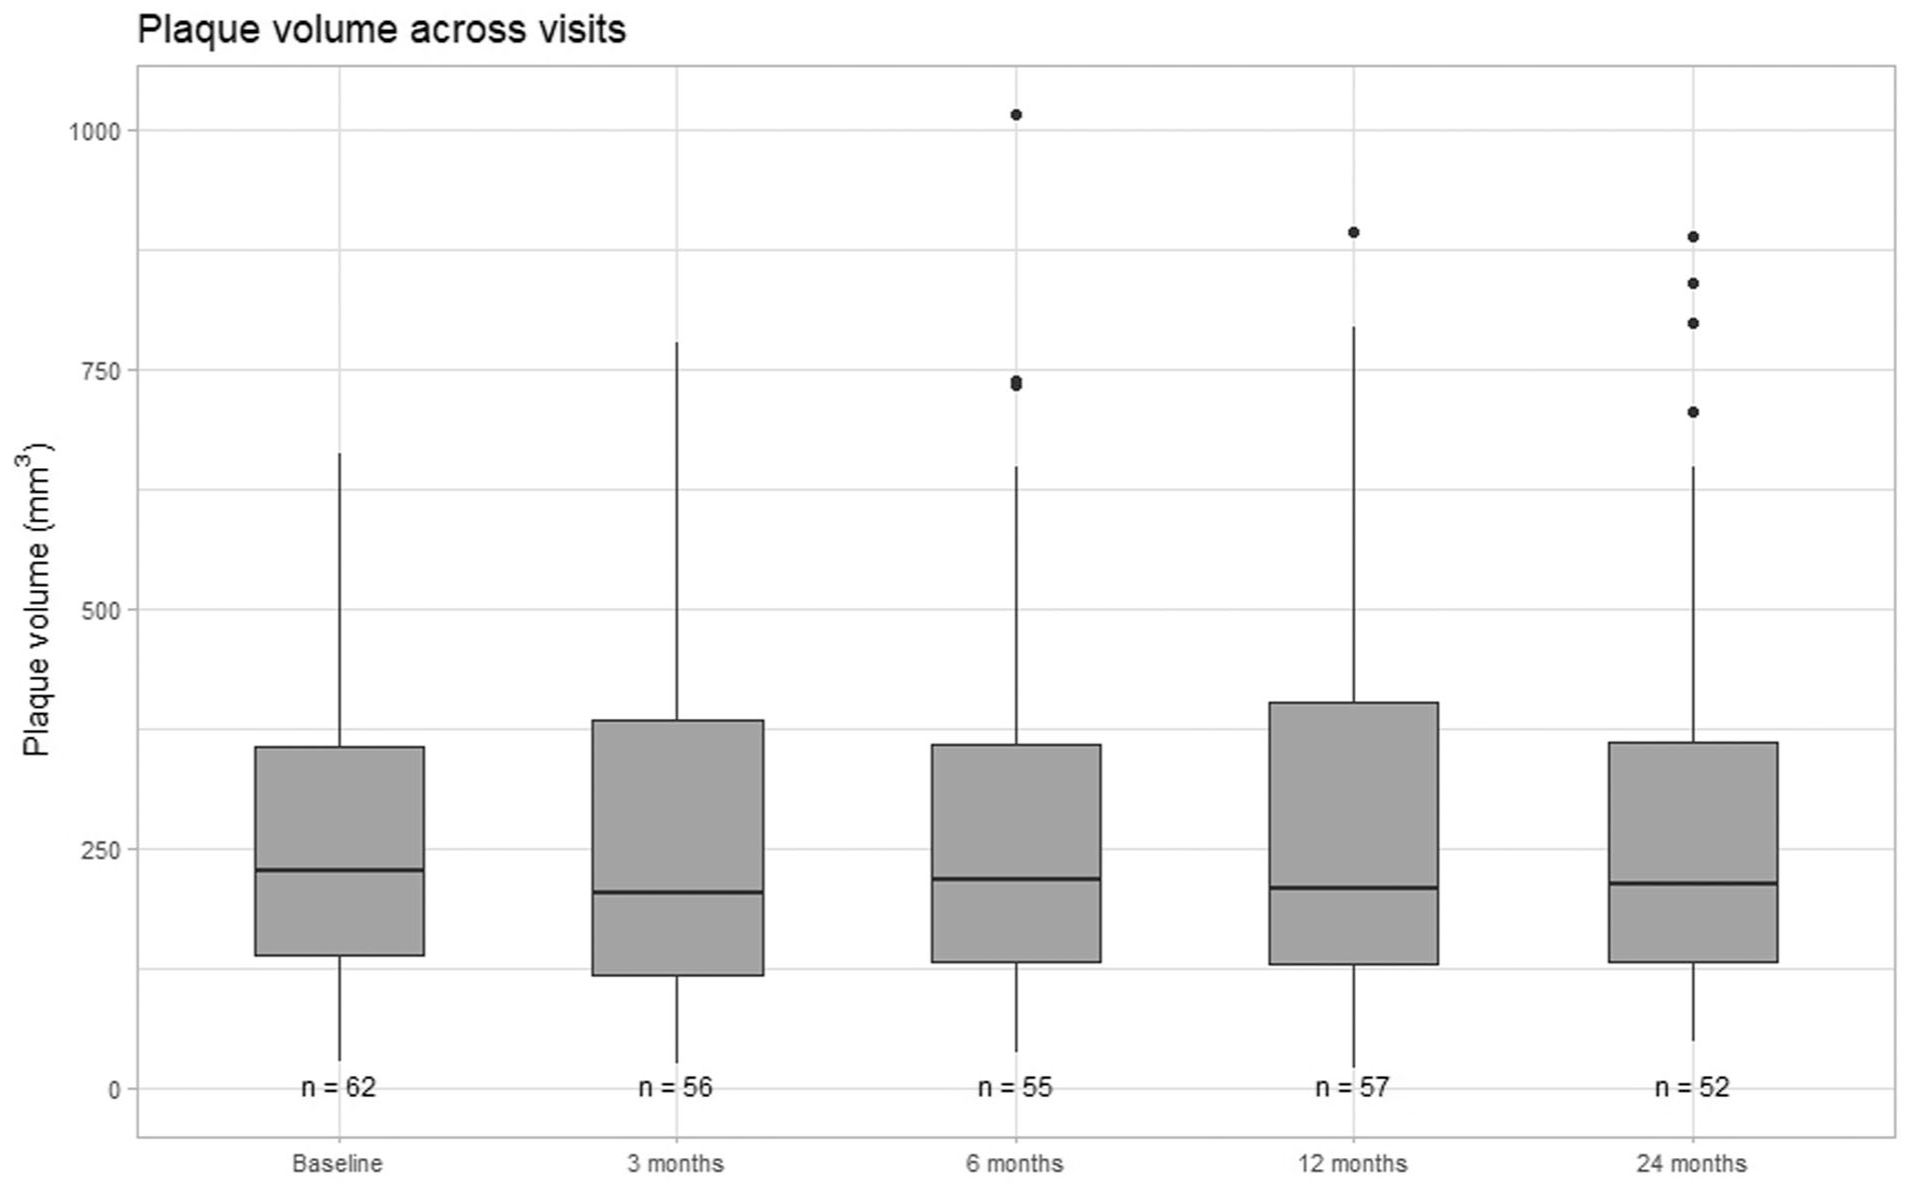
Longitudinal plaque volume (mm3) over the 24 months. Data are presented as boxplots showing the median, interquartile range, and outliers at each visit. Sample sizes are indicated below the boxes.
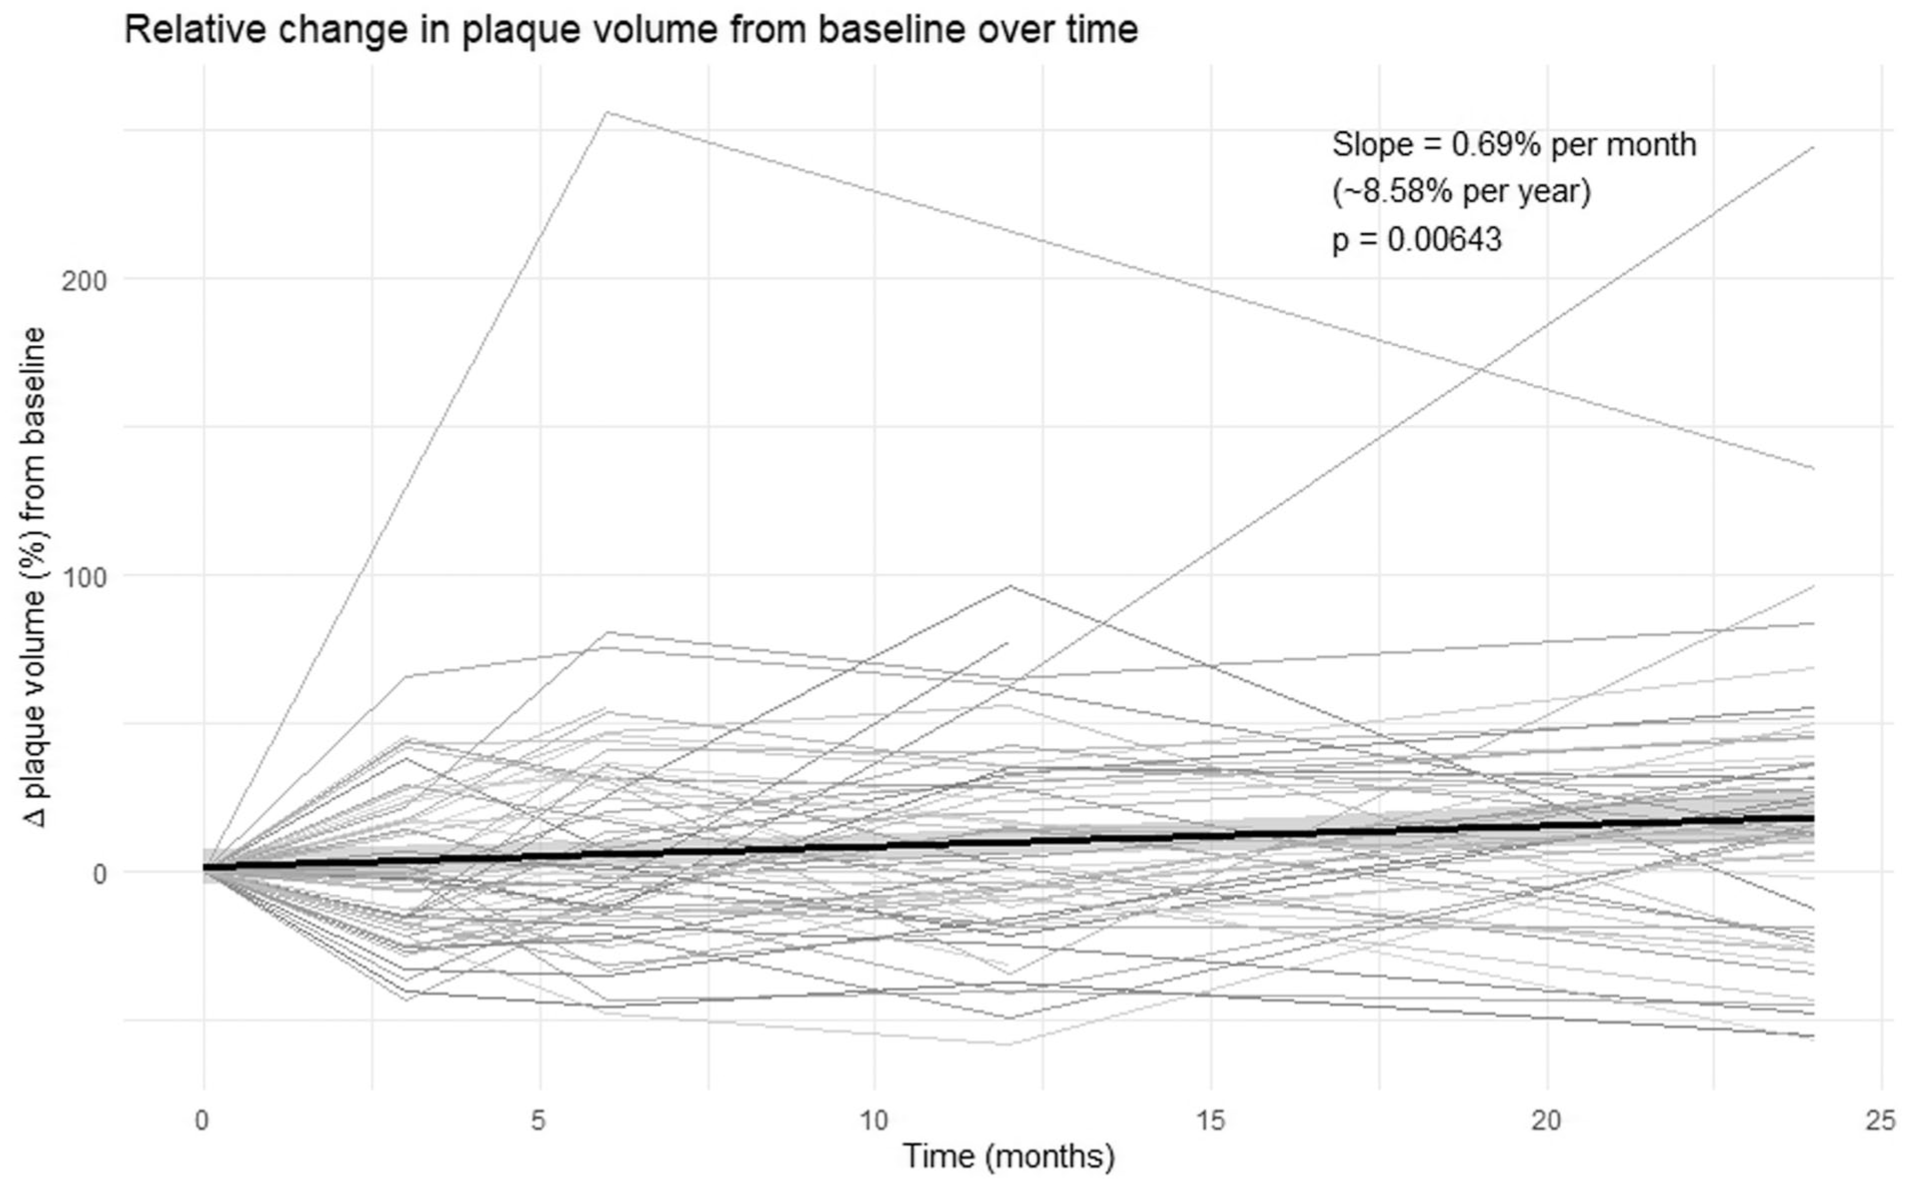
Relative change in carotid plaque volume over time. Each line represents an individual patient’s relative change in plaque volume (%) from baseline, through follow-up visits up to 24 months. The black line shows the overall linear trend with 95% confidence interval.

Baseline versus 24-month plaque volume (log-log scale). Each point represents one plaque. The solid diagonal line (y = x) indicates no change in volume, while dashed lines (y = 1.4x and y = 0.6x) correspond to ±40% thresholds used to classify plaques, as plaques increasing ≥40% were labeled progressors (circles), plaques decreasing ≥40% as regressors (squares), plaques within ±40% as stable (triangles).
Plaque echogenicity assessed with GSM remained stable over time (Figure 5). Median GSM did not change significantly across visits. Longitudinal modelling of relative GSM change confirmed the absence of a significant trend with a slope of ≈3.0% per year (P = .17), shown in Figure 6.
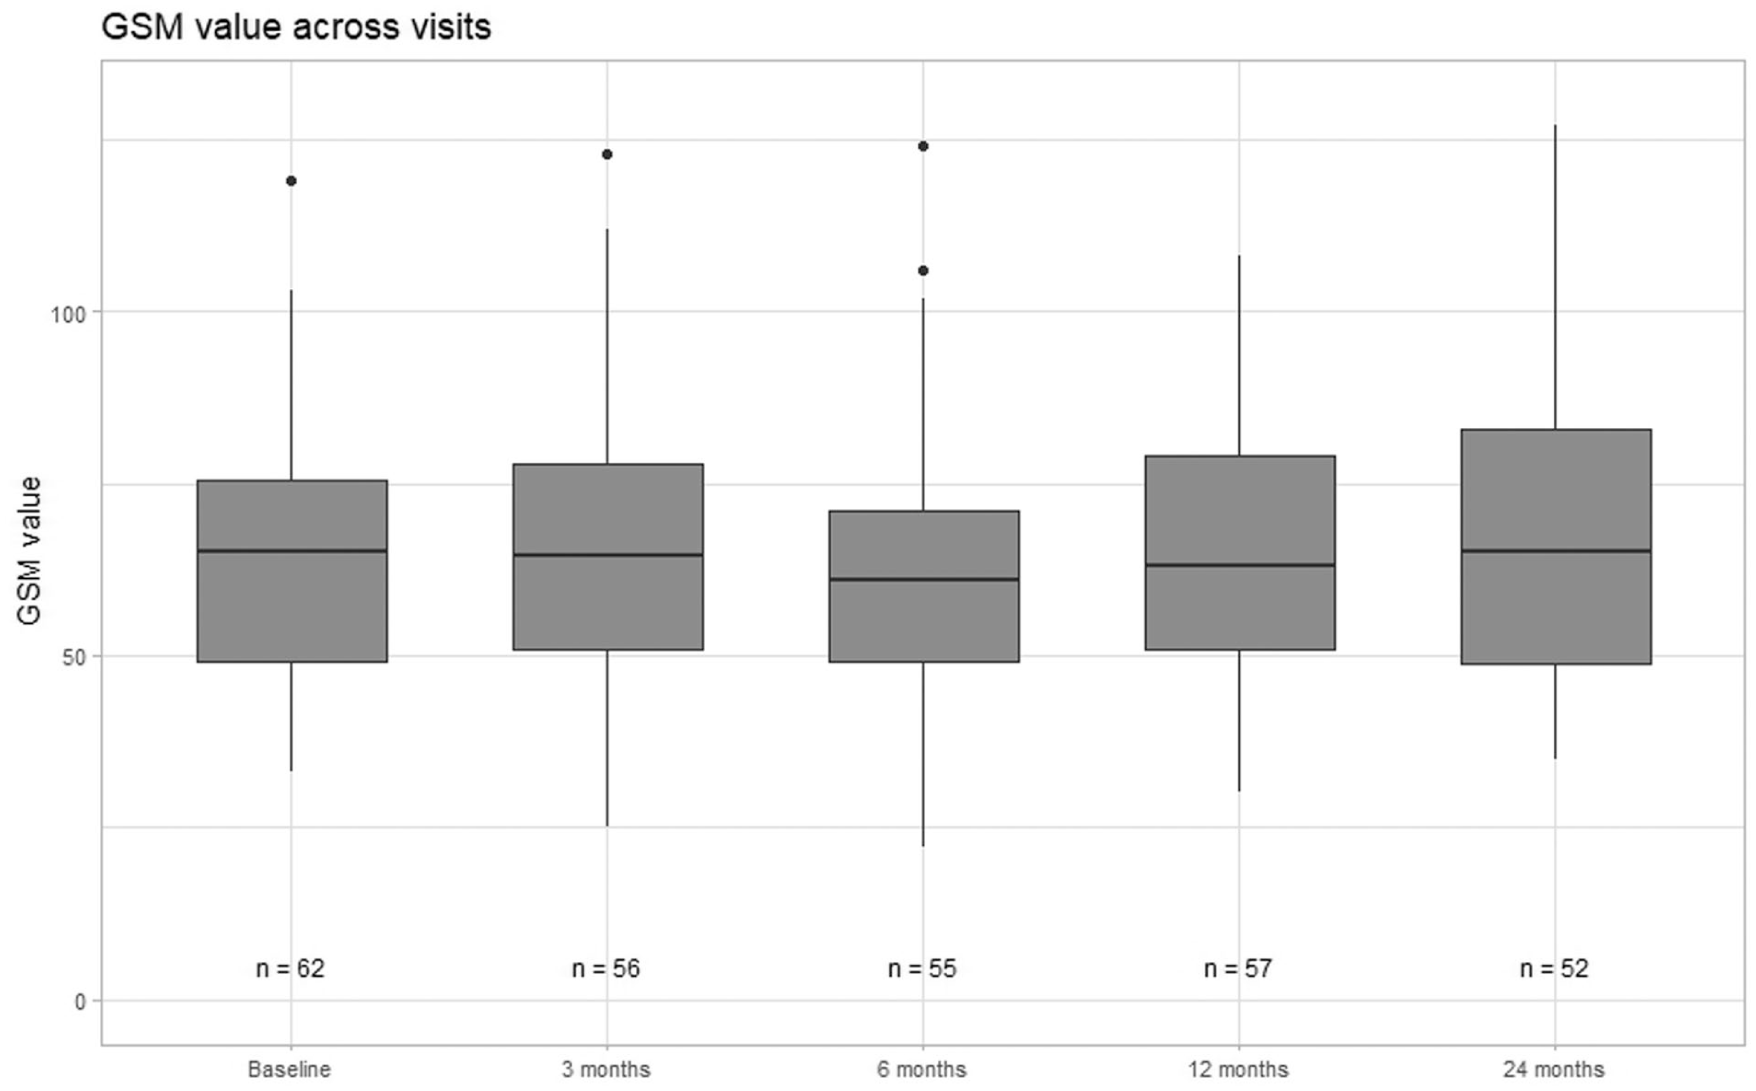
Longitudinal GSM values over the 24 months. Data are presented as boxplots showing the median, interquartile range, and outliers at each visit. Sample sizes are indicated below the boxes.
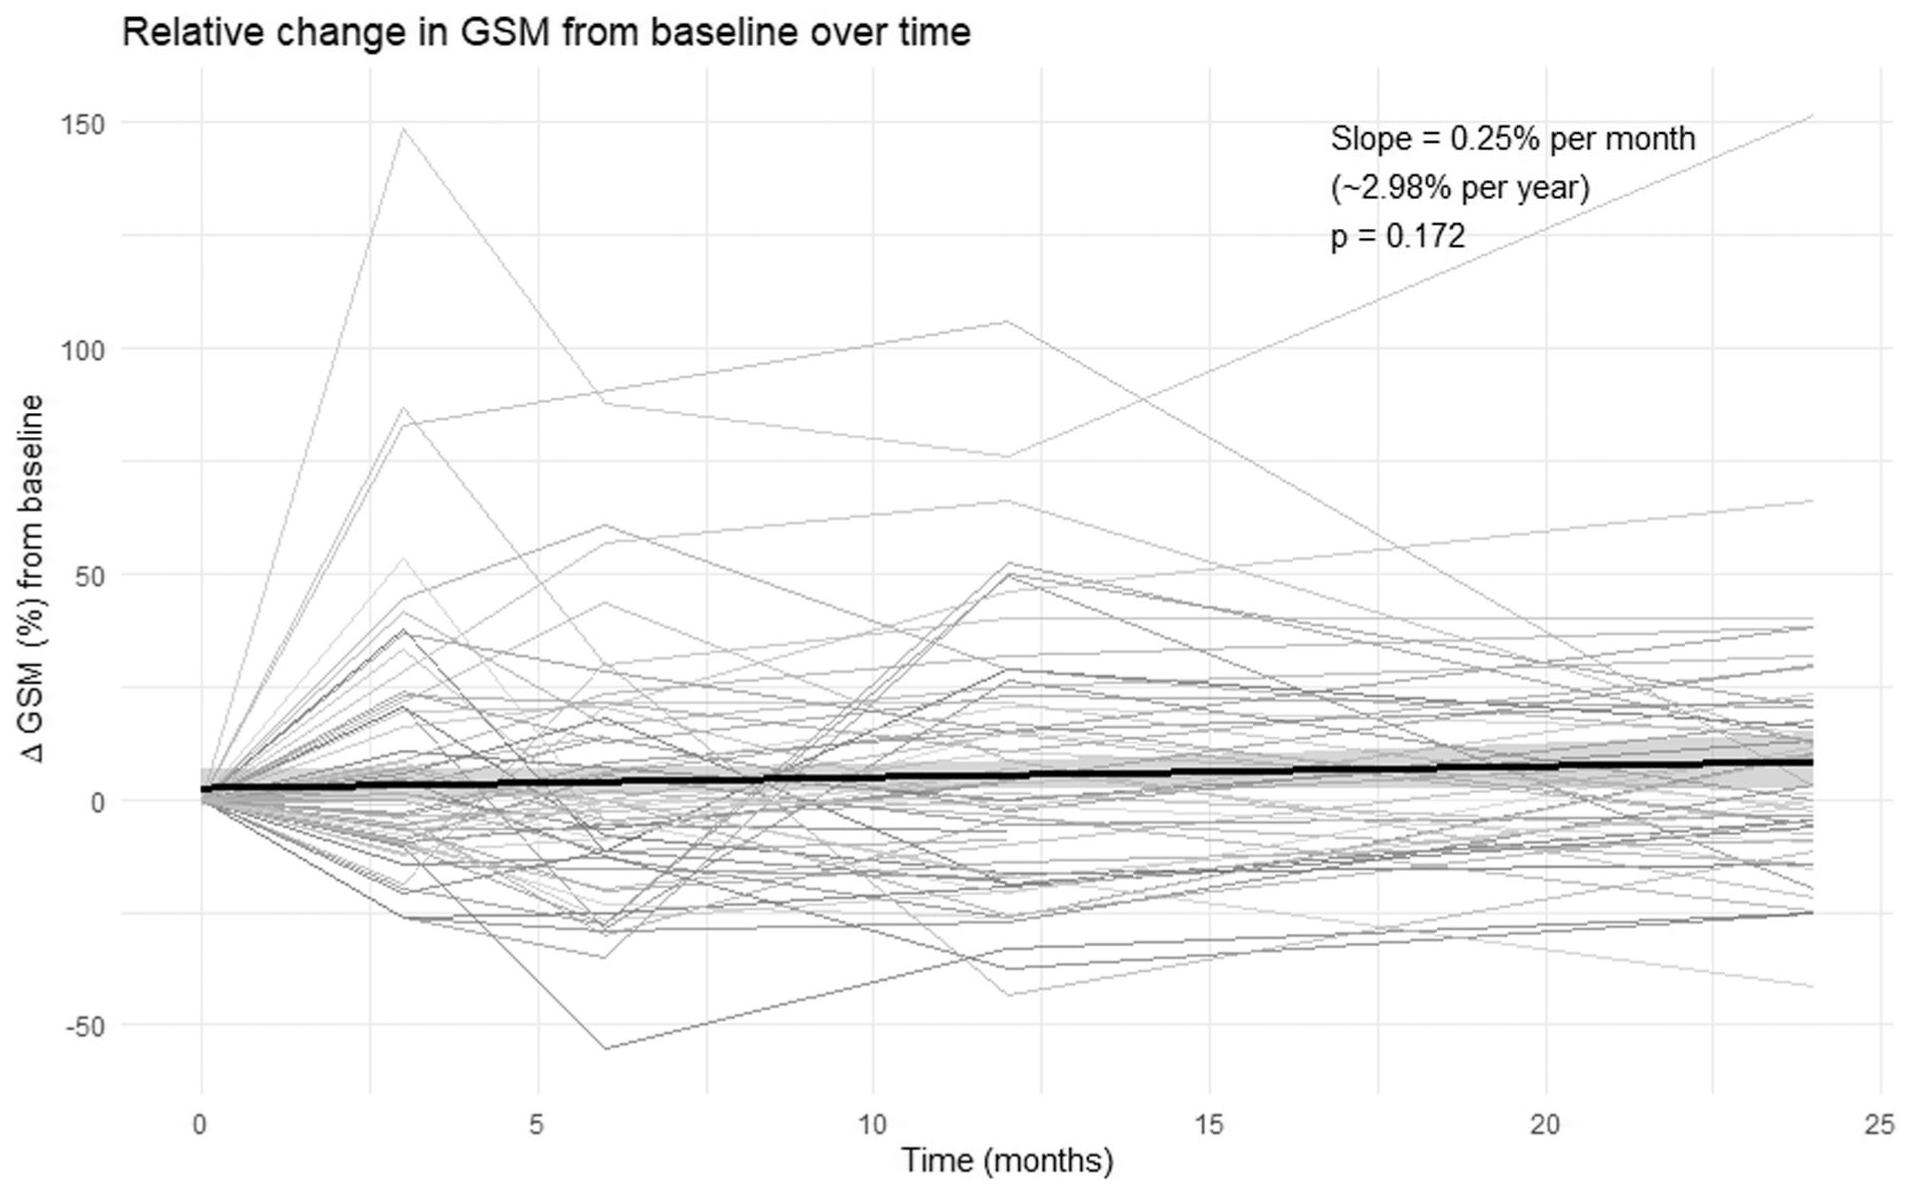
Relative change in GSM over time. Each line represents relative change in GSM (%) for an individual patient from baseline, through follow-up visits up to 24 months. The black line shows the overall linear trend with 95% confidence interval.
Baseline Characteristics’ Association With Plaque Progression
Baseline plaque volume, MAP, and LDL-C were significantly associated with plaque progression. Baseline plaque volume with β = .006 (95% CI: .001-.01, P = .023) indicating that for every 1 mm3 higher baseline plaque volume, plaque volume increased by an additional .006 mm3 per month, corresponding to approximately .07 mm3 per year. MAP with β = .07 (95% CI: .002-.13, P = .045) indicating that for every 1 mmHg higher MAP at baseline, plaque volume increased by an additional .07 mm3 per month, corresponding to approximately 0.8 mm3 per year. LDL-C with β = 1.03 (95% CI: .01-2.04, P = .048) indicating that for every 1 mmol/L higher LDL-C at baseline, the plaque volume increased by an additional 1.03 mm3 per month, corresponding to approximately 12.4 mm3 per year. No significant association was found for other variables, all tested variables are shown in Table 1.
Association of Baseline Variables with Plaque Progression. Mixed-Effects Linear Models Were Used to Assess the Association Between Each Variable and Plaque Volume Over Time, Including All Available Follow-Up Visits. All Models Included Baseline Plaque Volume as a Covariate and a Random Intercept for Each Patient to Account for Repeated Measurements. Effect Estimates (β) Represent the Interaction Between Time and the Baseline Variable (Time × Variable), Reflecting the Estimated Difference in the Rate of Plaque Volume Change (mm3 Per Month) Per Unit Increase in the Predictor for Continuous Variables, and Between Categories for Categorical Variables. Estimates are Reported with 95% Confidence Intervals.
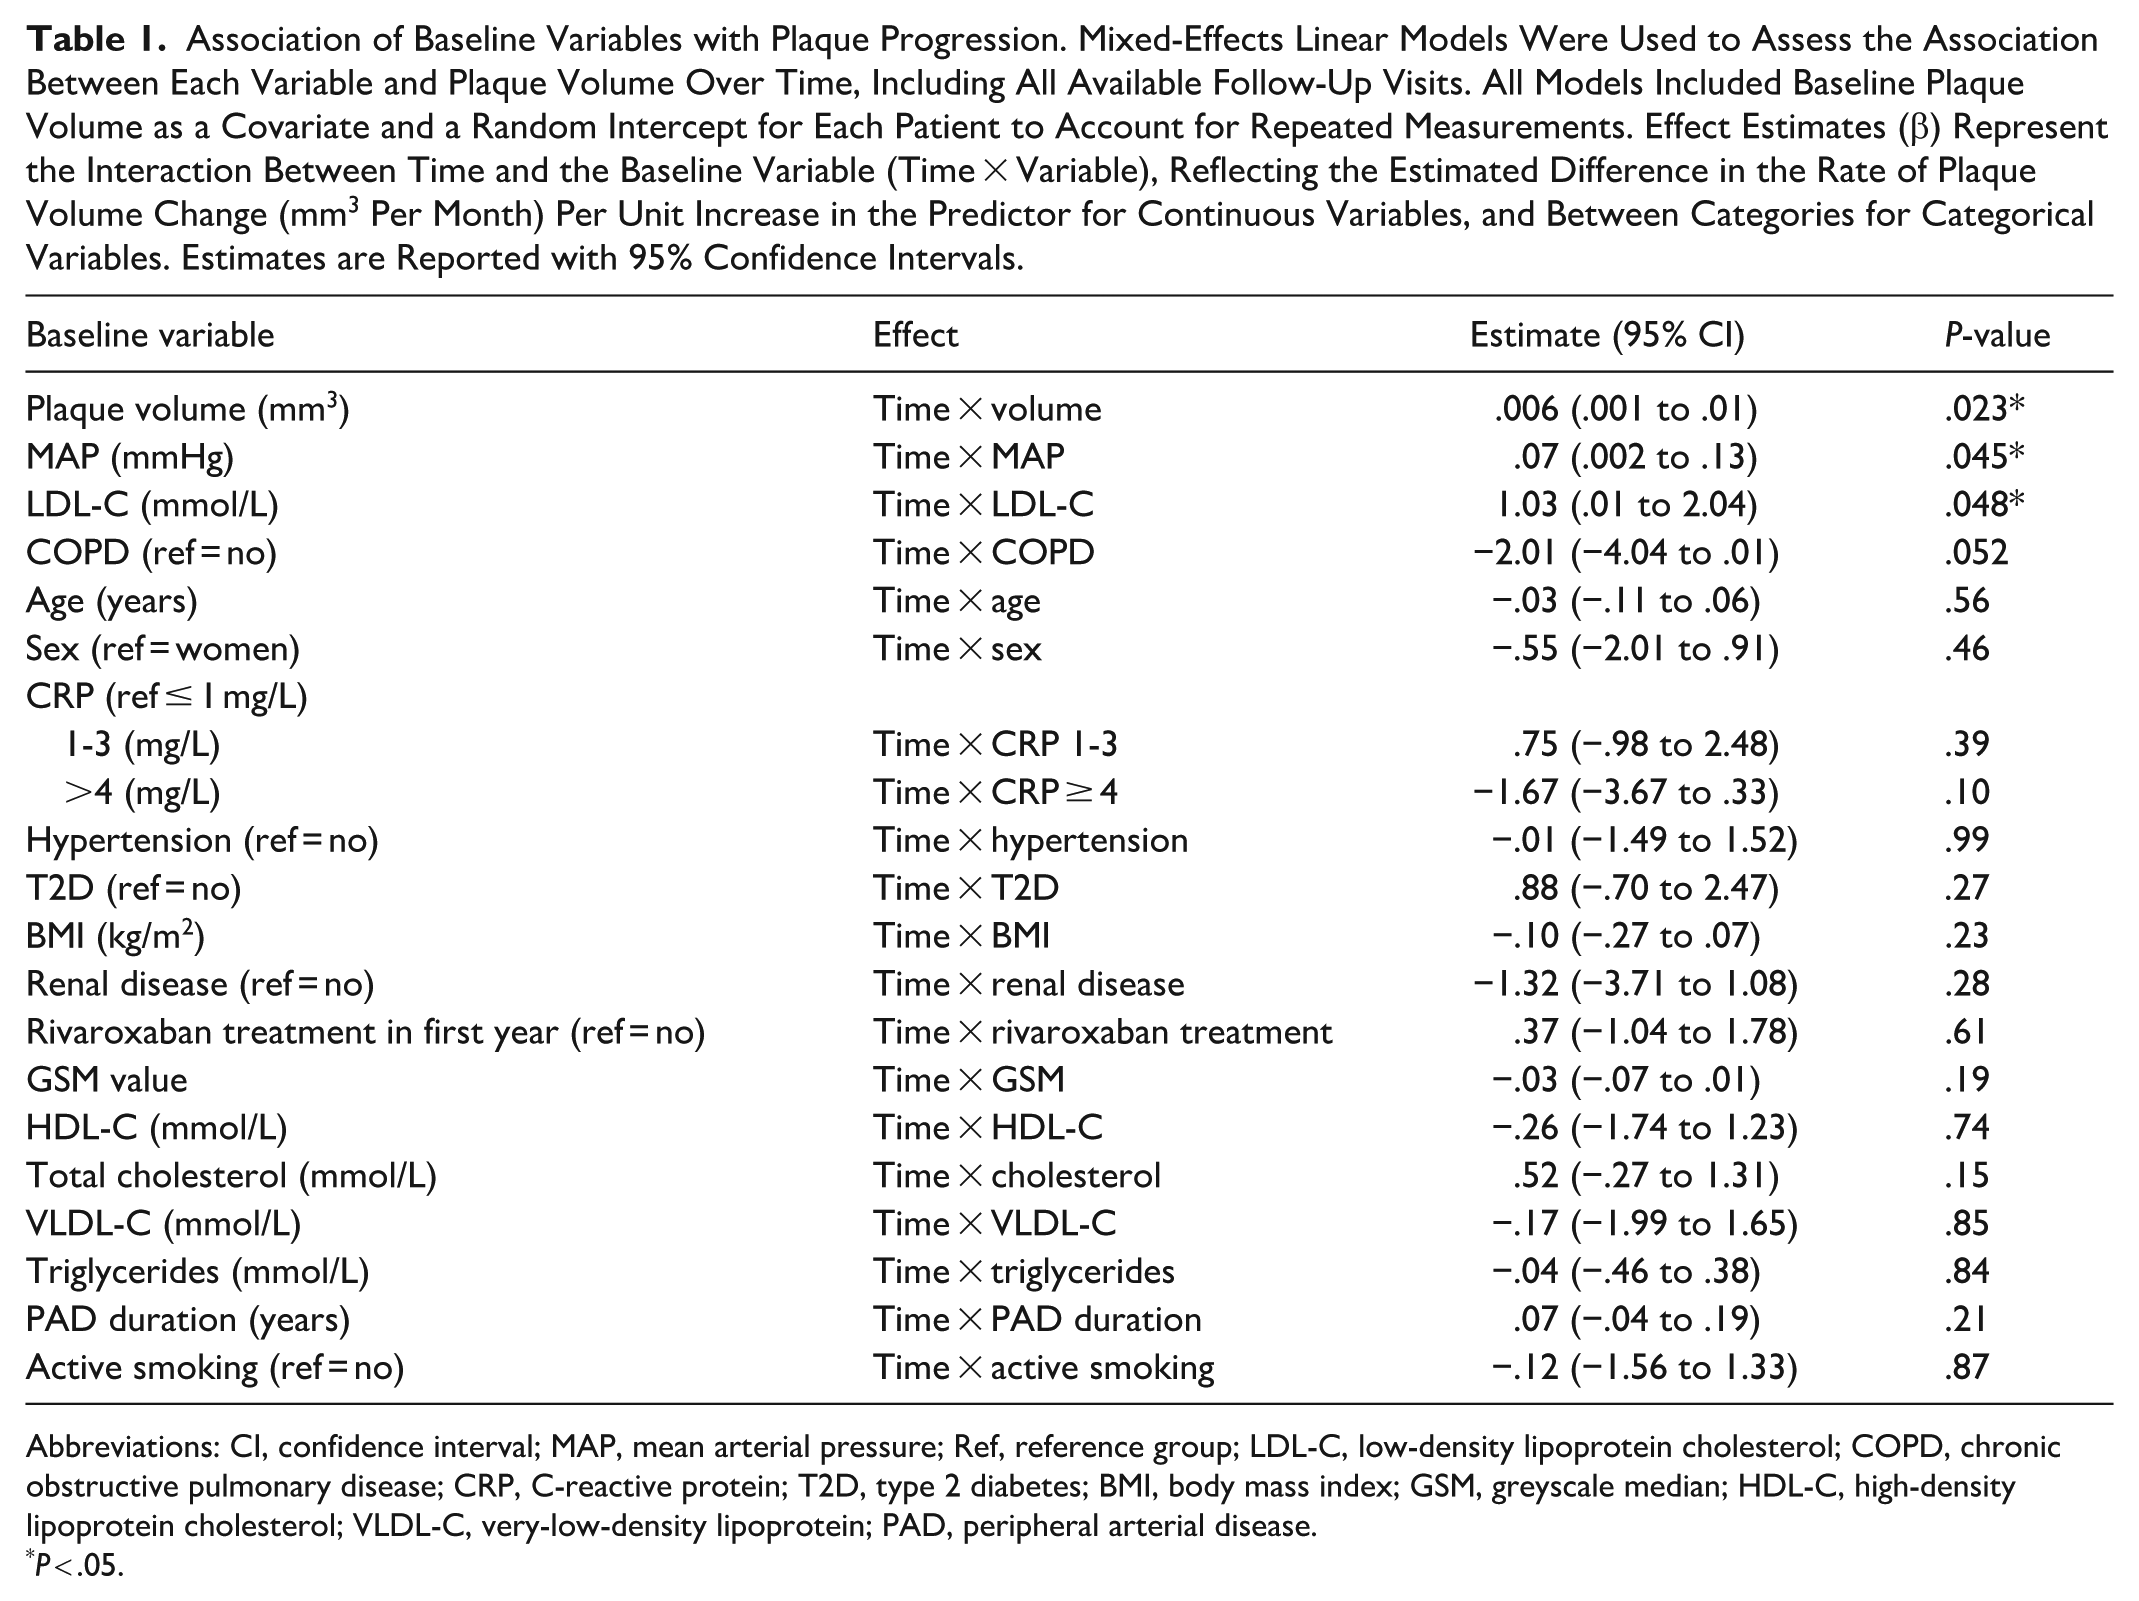
Abbreviations: CI, confidence interval; MAP, mean arterial pressure; Ref, reference group; LDL-C, low-density lipoprotein cholesterol; COPD, chronic obstructive pulmonary disease; CRP, C-reactive protein; T2D, type 2 diabetes; BMI, body mass index; GSM, greyscale median; HDL-C, high-density lipoprotein cholesterol; VLDL-C, very-low-density lipoprotein; PAD, peripheral arterial disease.
P < .05.
LDL-C Levels Across Visits, Statin Compliance and Plaque Progression
LDL-C (mmol/L) across visits is shown in Supplemental Figure 1. LDL decreased over the first 12 months, with levels at 12 months being significantly lower than baseline (P = .017). By 24 months, LDL had returned toward baseline levels, and the difference was no longer significant (P = .29). In a sensitivity analysis including only the 52 patients with 24-month blood test results, the 12-month decrease remained significant (P = .011), and the 24-month change remained non-significant (P = .29), supporting the robustness of the finding that LDL-C decreased initially but returned toward baseline by 24 months.
Seven of the 54 patients at 24-month follow-up were non-compliant with statin treatment and had a median LDL-C of 3.3 mmol/L, contributing substantially to the overall increase in LDL-C. In the compliant group (n = 47) and the non-compliant group (n = 7), the median plaque progression from 12 to 24 months was −1.4% and 15.7%, respectively. This difference was statistically insignificant (P = .47). In the non-compliant group, 14% (n = 1) experienced a cardiovascular event whereas 20% (n = 9) in the compliant group experienced a cardiovascular event. The difference was non-significant (P = 1.00).
Discussion
Plaque progression tended to be proportional to baseline size, with larger plaques growing more in absolute terms despite medical therapy. Over 2 years of observation, approximately three-fourths of the plaques were classified as stable, and one-fourth as progressors. Plaque echogenicity (GSM) remained stable, suggesting minimal compositional changes. Higher mean arterial pressure (MAP), LDL-C, and baseline plaque volume were associated with plaque progression. Non-adherence to statin treatment might cause faster progression, however, this finding was not significant.
Interpretation and Implications
In exploratory analyses, higher MAP, elevated LDL-C, and larger baseline plaque volume were associated with more plaque progression, however, these findings do not imply causality. Nevertheless, these observations align with the established role of hemodynamic stress and lipid burden in driving atherosclerotic progression.34,35 That baseline plaque volume was found to be associated with future progression supports that early identification of patients with higher plaque burden may benefit from targeted preventive strategies. Given the exploratory nature of these analyses, the findings should be interpreted with caution, and residual confounding cannot be excluded.
The use of 3D-US was central to detecting modest but measurable plaque progression over time. Unlike conventional 2D imaging, 3D-US provides volumetric measures with high reproducibility, enabling longitudinal assessment.8,14 -16 This is clinically relevant, as plaque progression is heterogeneous, as shown in this study and in a previous large longitudinal cohort with 6-year follow-up. 32 The observed individual variability in progression pattern underlines the value of 3D-US for personalized disease monitoring, and the association between baseline volume and progression supports its role in risk stratification. Routine serial 3D-US may help identify patients with increased risk and accelerated plaque progression who could benefit from intensified risk-factor management. In this study, GSM values remained stable throughout follow-up despite measurable plaque progression, suggesting that echogenicity assessed with GSM value is a less sensitive marker of biologically active plaques than plaque volume. GSM may nonetheless offer complimentary information in selected settings, particularly for characterizing plaque vulnerability.
Regarding LDL-C control, patient adherence appears important. Although we aimed for LDL-C < 1.4 mmol/L, only about one-third of patients reached this target consistently. Some patients discontinued therapy between visits, highlighting real-world adherence challenges. Poor medication adherence has consistently been associated with adverse cardiovascular outcomes, including increased risk of myocardial infarction, stroke, and all-cause mortality.36,37 In our cohort, lower adherence may have contributed to continued plaque progression among some patients, although this association did not reach statistical significance. In exploratory analyses, patients who became non-adherent between 12 and 24 months showed numerically greater plaque progression. This subgroup analysis was limited by statistical power. Although the small number of non-adherent participants (n = 7) limits firm conclusions, this pattern is consistent with the known biological effects of statin withdrawal, which include rebound increases in LDL-C and inflammatory activity. Adherence to statin therapy often declines over time and is influenced by multiple factors, including patient perception of benefit, side effects, treatment complexity, and cost. Higher-intensity or higher-dose statin regimens have been associated with reduced adherence, 38 which may also be relevant in our study where statin doses were frequently increased. Knowledge and understanding of the treatment play a key role in adherence, and patient counselling, education, and clear communication about the purpose and benefits of therapy can improve engagement and medication literacy.39,40 These findings underscore the importance of continuous follow-up, individualized treatment strategies, and educational interventions to support long-term adherence and optimize atherosclerotic risk reduction.
Finally, 24% of our cohort experienced a cardiovascular event despite being well medicated and classified as stable PAD patients. Although the cohort is small and firm conclusions cannot be drawn on this matter, this finding suggests that patients with echolucent or partly echolucent carotid plaques may carry a particularly high cardiovascular risk.
Strengths and Limitations
The study has several strengths. It is prospective, and it provides longitudinal assessment of plaque volume and echogenicity over a 24-month period using 3D-US allowing for evaluation of both structural and compositional plaque changes. The repeated measurements and relatively high follow-up attendance strengthen the reliability of the observed trends. Standardized image acquisition and analysis protocols minimized measurement variability and enhanced comparability between visits. In addition, the mixed-effects models used ensured the use of all data point even though some patients did not attend all follow-up visits.
However, some limitations should be considered. The sample size was calculated to detect a 20% change in plaque GSM over 12 months and was not specifically powered for the secondary analyses of plaque volume, plaque progression, or cardiovascular events. Therefore, the modest sample size limits statistical power and may result in unstable estimates in these models. Multiple baseline characteristics were examined without adjustment for multiple testing, so the findings are exploratory and hypothesis-generating. In addition, the inclusion of only echolucent plaques at baseline may limit the external validity of the results to other plaque phenotypes.
Conclusion
In this exploratory study, plaque echogenicity remained stable over 24 months, while plaque showed heterogeneous but overall progression. Higher MAP, LDL-C, and larger baseline plaque volume were associated with faster progression, although limited by sample size, suggesting that traditional risk factors continue to drive plaque progression despite optimized therapy. These findings also indicate that plaque volume seems superior to echogenicity to identify biologically active echolucent plaques. The tendency for larger plaques to grow more supports the potential value of volumetric 3D-US as a tool to identify biologically active plaques. Statin non-adherence may add to plaque progression, although this association was not statistically significant in our small cohort. These findings highlight the need for larger studies to clarify how longitudinal plaque monitoring may guide individualized prevention strategies.
Supplemental Material
sj-docx-1-ang-10.1177_00033197261460096 – Supplemental material for Plaque Volume Rather than Echogenicity for Identification of Active Carotid Plaques
Supplemental material, sj-docx-1-ang-10.1177_00033197261460096 for Plaque Volume Rather than Echogenicity for Identification of Active Carotid Plaques by Majken Lyhne Jessen, Karin Yeung, Antoine Collet-Billon, Jonas Peter Eiberg, Henrik H. Sillesen and Nikolaj Eldrup in Angiology
Footnotes
Ethical Considerations
The study was approved by the European Medicines Agency (EMA) via the Clinical Trials Information System (CTIS; trial number 2024-518539-13-00). All participants provided both oral and written informed consent for the original study and again for the additional 2-year follow-up. Good Clinical Practice (GCP) compliance was confirmed through an audit conducted by the Danish national GCP auditing unit.
Author Contributions
MLJ, KY, JE, HS, and NE made substantial contributions to the conception and design of the study. MLJ, KY, and AC-B made substantial contributions to data acquisition and analysis. MLJ, KY, AC-B, JE, HS, and NE contributed to the interpretation of data. MLJ drafted the manuscript, and all other authors contributed to critical revision for important intellectual content. All authors approved the final version of the manuscript.
Funding
The authors disclosed receipt of the following financial support for the research, authorship, and/or publication of this article: This study was partly funded by Bayer AG (Leverkusen, Germany).
Declaration of Conflicting Interests
The authors declared the following potential conflicts of interest with respect to the research, authorship, and/or publication of this article: The Department of Vascular Surgery, Copenhagen University Hospital Rigshospitalet, has received research grants from Philips Ultrasound and Bayer AG. JE has received speaker honoraria from Philips and serves as a member of the Philips Clinical Advisory Board.
Data Availability Statement
Data sharing is restricted because informed consent did not include permission for public data sharing. Data may be available from the corresponding author upon reasonable request and approval by the relevant ethics committee.*
Supplemental Material
Supplemental material for this article is available online.
References
Supplementary Material
Please find the following supplemental material available below.
For Open Access articles published under a Creative Commons License, all supplemental material carries the same license as the article it is associated with.
For non-Open Access articles published, all supplemental material carries a non-exclusive license, and permission requests for re-use of supplemental material or any part of supplemental material shall be sent directly to the copyright owner as specified in the copyright notice associated with the article.