
Abstract
Objectives:
We investigated the relationship between snoring sounds and severity of obstructive sleep apnea syndrome (OSAS).
Methods:
A total number of 103 snoring patients (60 males and 43 females) were evaluated by means of polysomnographic findings and snoring sound recordings. Snoring sound intensity was assessed using fast Fourier transform (FFT) method by measuring maximal frequency (Fmax) and average snoring sound intensity level (SSIL).
Results:
Maximal frequency and SSIL are correlated with apnea-hypopnea index (AHI), REM AHI, and severity of the OSAS. So, as the severity of the OSAS increased, so did the Fmax and SSIL of the snoring recordings, meaning patients started snoring louder with more frequency. In older patients, in females, in severe OSAS group, and in patients with higher body mass index (BMI), AHI and AHI REM values and SSIL and Fmax values increased. As mean oxygen (O2) saturation and lowest O2 saturation decreased, SSIL and Fmax values increased.
Conclusion:
Maximal frequency and SSIL analysis of the snoring sound increased in severe OSAS patients. People should be aware of the importance of snoring sounds. In particular, patients with snoring sounds increasing in intensity and of higher frequency should discuss with their physicians the possibility of OSAS.
Keywords
Introduction
As obesity becomes epidemic throughout the world, the diagnosis, treatment, and complications of sleep-disordered breathing have attracted the attention of many physicians. Sleep disordered breathing (SDB) is a general term for various chronic conditions manifesting as partial or complete cessation of breathing (hypopneas and apneas) many times throughout the night. The prevalence of SDB substantially increased throughout the past decades, becoming 10% to 17% among men and 3% to 9% among women in United States. 1 As this kind of cohort study with large population groups is not carried out in Turkey, we can only estimate the percentage of SDB is approximately 3% to 12% from various epidemiological studies.2,3 The prevalence of SDB ranges from 4% to 7% around the world depending on the country and risk factors such as age, sex, obesity, family history, craniofacial abnormalities, cigarette smoking, alcohol consumption, and so on. 4
Obstructive sleep apnea syndrome (OSAS) is the most common form of such disorder, characterized by the repetitive complete and/or partial collapse of the airway while sleeping and the arousal of the patient to restore ventilation. Obstructive sleep apnea should be considered as a major public health issue as it’s associated with an increased risk of cancer, 5 atherosclerosis, 6 cardiovascular diseases, 7 autoimmune diseases, 8 cognitive abnormalities, stroke, 9 postoperative complications, 10 hypertension, 11 and mental health problems. 12 Developed in the 1980s, an overnight laboratory-based polysomnography (PSG) is the golden standard for diagnosis of OSAS.
Snoring is the most common symptom of OSAS. It is caused by turbulent airflow through the narrowed airway. 13 It was reported that OSAS patients had a frequency higher than 800 Hz. 14 As a full-night PSG is a costly complicated test and is not available in all communities, different diagnosis modalities are being researched thoroughly to overcome these disadvantages. So, it is reasonable to correlate snoring and OSA to help us to diagnose the classification of this disease.
The aim of this study is to analyze the voice recordings of patients having OSAS to assess if there is a correlation between the stage of OSAS and the snoring intensity and frequency and designate if we can use this analysis as a marker to determine the severity of the disease.
Materials and Methods
This prospective study was conducted in the ENT Clinics of Eskişehir State Hospital, Eskişehir, Turkey. between June 2013 and October 2014. The study was conducted and completed according to the rules outlined in the Declaration of Helsinki. The Ethics Committee approval was taken from Eskişehir Osmangazi University Ethics Committee.
Patients
One hundred and three patients (60 males and 43 females) with OSAS were enrolled in this study. All patients underwent PSG, and the patients with apnea-hypopnea index (AHI) ≥5 were included in the study. Their mean age was 49.8 ± 10.4 years (range, 24-76 years).
According to the AHI values, they were grouped as follows:
Group 1: mild-moderate OSAS or non-severe OSAS (AHI <30 and AHI ≥5)
Group 2: severe OSAS (AHI ≥30).
The patients were informed about the research, and their written consents were obtained. The demographic data, including age, height, gender, and calculated body mass index (BMI), of all patients were recorded. All patients also underwent clinical examination by an otolaryngologist, and the ones with nasal pathology were excluded from the study.
Polysomnography
All patients received overnight PSG (Embla S4500, Natus Medical, Inc, Pleasanton, California, USA). The sleep phases of the patients were recorded and scored in the sleep laboratory by trained sleep lab technicians and approved by the referring physician. The PSG was performed by recording EEG, EOG, ECG, EMG, thoracic and abdominal respiratory excursion, oronasal airflow by a thermistor, and blood oxygen saturation by an oximeter. The PSG recordings were assessed to obtain AHI, sleep efficiency, REM AHI, mean oxygen saturation (MOS), the lowest oxygen saturation, and snoring percentage during sleep. To assess the hypoxemia severity, we also recorded the total number of events with desaturation below 90%.
Apnea was defined as the total cessation of airflow for more than 10 seconds, and hypopnea was designated as the 50% reduction of airflow for more than 10 seconds associated with an arousal and/or reduction in oxygen saturation more than 4%.
The AHI, the number of apneas, and hypopnes per hour were calculated both during the total sleep time (AHI) and REM sleep (AHI REM).
Sleep efficiency was measured as the proportion of total sleep time to the total recording time of the polysomnography.
Recording of Snoring Sounds
For standardizing, snoring recordings were taken 2 times at 3 minutes length at NREM stage 2 phase, the phase that constitutes most of the sleep.
Snoring recordings were achieved by midline microphones placed 30 cm over the head of the patients. The data were saved in .wav form. The mean background noise level of the testing room was below 5 dBs, and reverberation time of the room was below 1.5 second.
Analysis of Snoring Sounds
The analyses of the snore recordings were performed at digital platform by fast Fourier transform (FFT) method. The sound spectra of the successive snoring episodes were constructed. The maximal frequency (Fmax) was defined as the frequency exhibiting 90% of the maximum power of the spectrum. The peak frequency (Fpeak) was defined as the frequency at maximum power, and the mean frequency (Fmean) was defined as the frequency at half of the maximum power. Broad frequency bands exhibiting a fundamental frequency were termed harmonics. Snoring was quantified using average snoring sound intensity level (SSIL) and Fmax (Figure 1).15-20
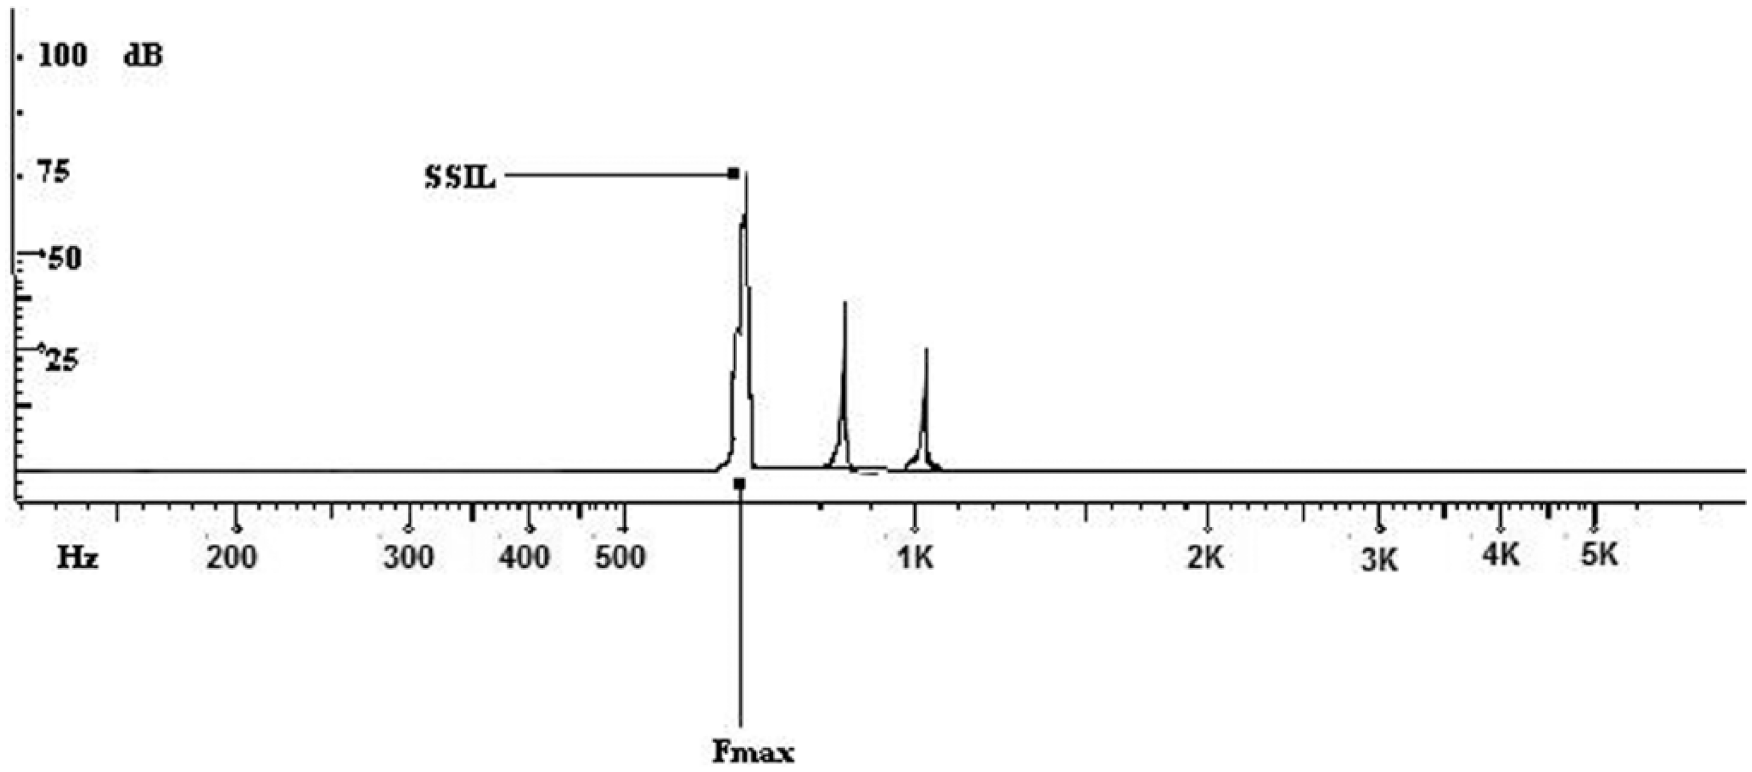
Diagram showing maximal frequency (Fmax) and average snoring sound intensity levels (SSIL).
The correlation between Fmax, SSIL, and polysomnographic findings were analyzed.
Statistical Analysis
All analyses were performed using version 16 of the Statistical Package for the Social Sciences (SPSS) software. Mann-Whitney U test, chi-square test, and Spearman’s correlation rho efficient test were used.
A P value <.05 was considered to reflect statistical significance.
Results
The demographics, PSG results, and snoring sound analysis results of the groups are shown in Table 1. In group 1, there were 24 males and 25 females. In group 2, there were 36 males and 18 females. There were no significant differences between gender distribution of the groups by chi-square test (P > .05). The mean ages of group 1 was 48.8 ± 9.1 years and of group 2, 51.0 ± 11.5 years. There were no significant differences between ages of the groups (P > .05) (see Table 1). The BMI values of group 2 (mean, 34.7 ± 9.2 kg/m2) were significantly higher than those of group 1 (mean, 29.5 ± 5.6 kg/m2) (P = .001).
Demographic Data of the Groups.
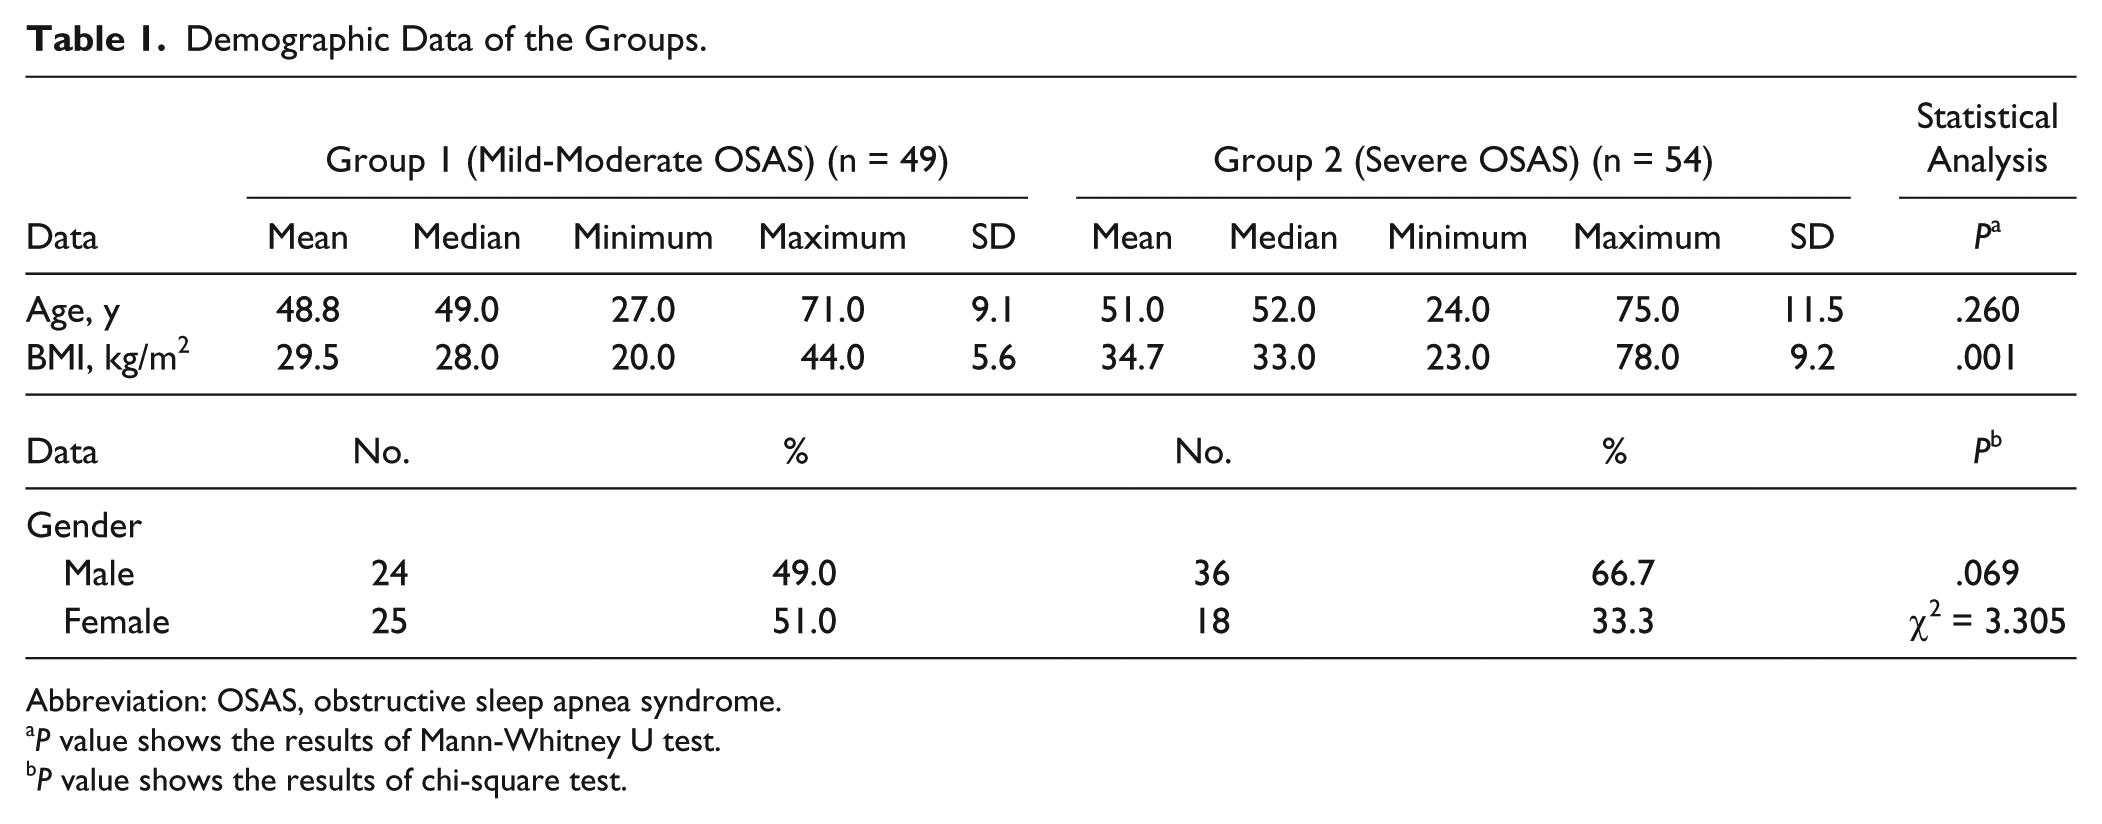
Abbreviation: OSAS, obstructive sleep apnea syndrome.
P value shows the results of Mann-Whitney U test.
P value shows the results of chi-square test.
Polysomnographic Findings
Polysomnographic findings were shown in Table 1. The AHI and REM AHI values of group 2 were significantly higher than group 1 (P < .05). There wasn’t significant difference at sleep efficiency and snoring percentage of the groups (P > .05). Mean O2 saturation and the lowest O2 saturation values of group 1 were significantly higher than those of group 2 (P < .05). In group 2, their total number of events with desaturation below 90% was significantly more than those of group 1 (P < .05) (see Table 2).
Polisomnography Results of the Groups.
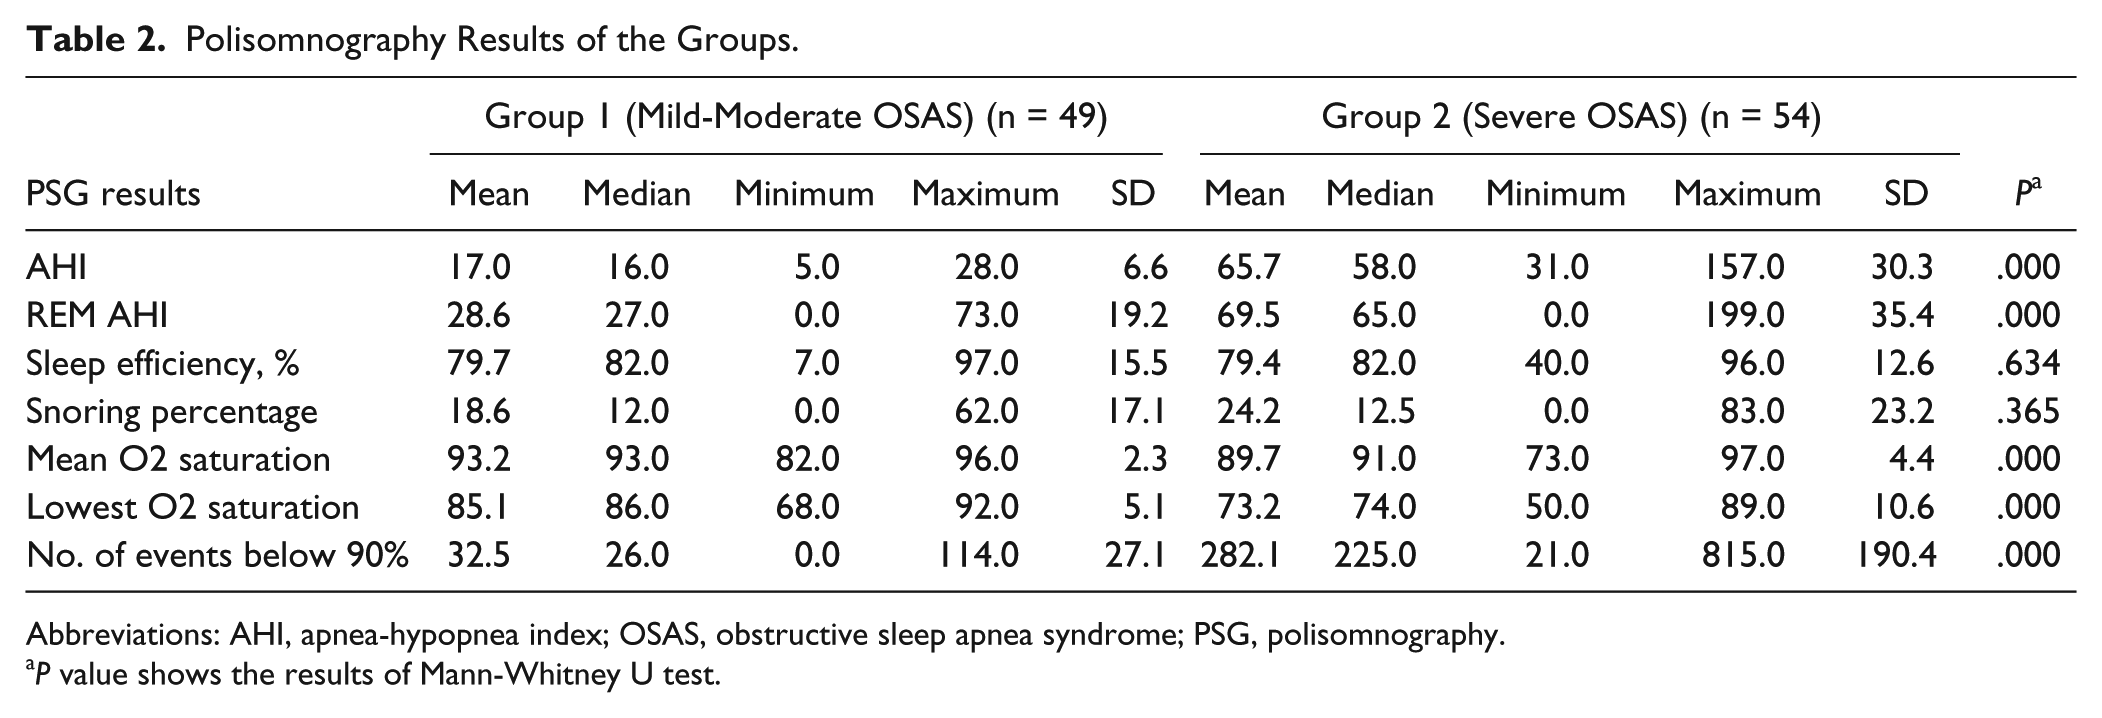
Abbreviations: AHI, apnea-hypopnea index; OSAS, obstructive sleep apnea syndrome; PSG, polisomnography.
P value shows the results of Mann-Whitney U test.
Snoring Sound Analysis in Both Genders
In OSAS patients of our study, including all males and females, SSIL was 29.4 dB in group 1 and 37.9 dB in group 2. The Fmax values were 942.2 Hz in group 1 and 1138.8 Hz in group 2. Both SSIL and Fmax values of group 2 (severe OSAS) were significantly higher than those of group 1 (P < .05) (see Table 3).
Snoring Sound Analysis Results of the Groups.
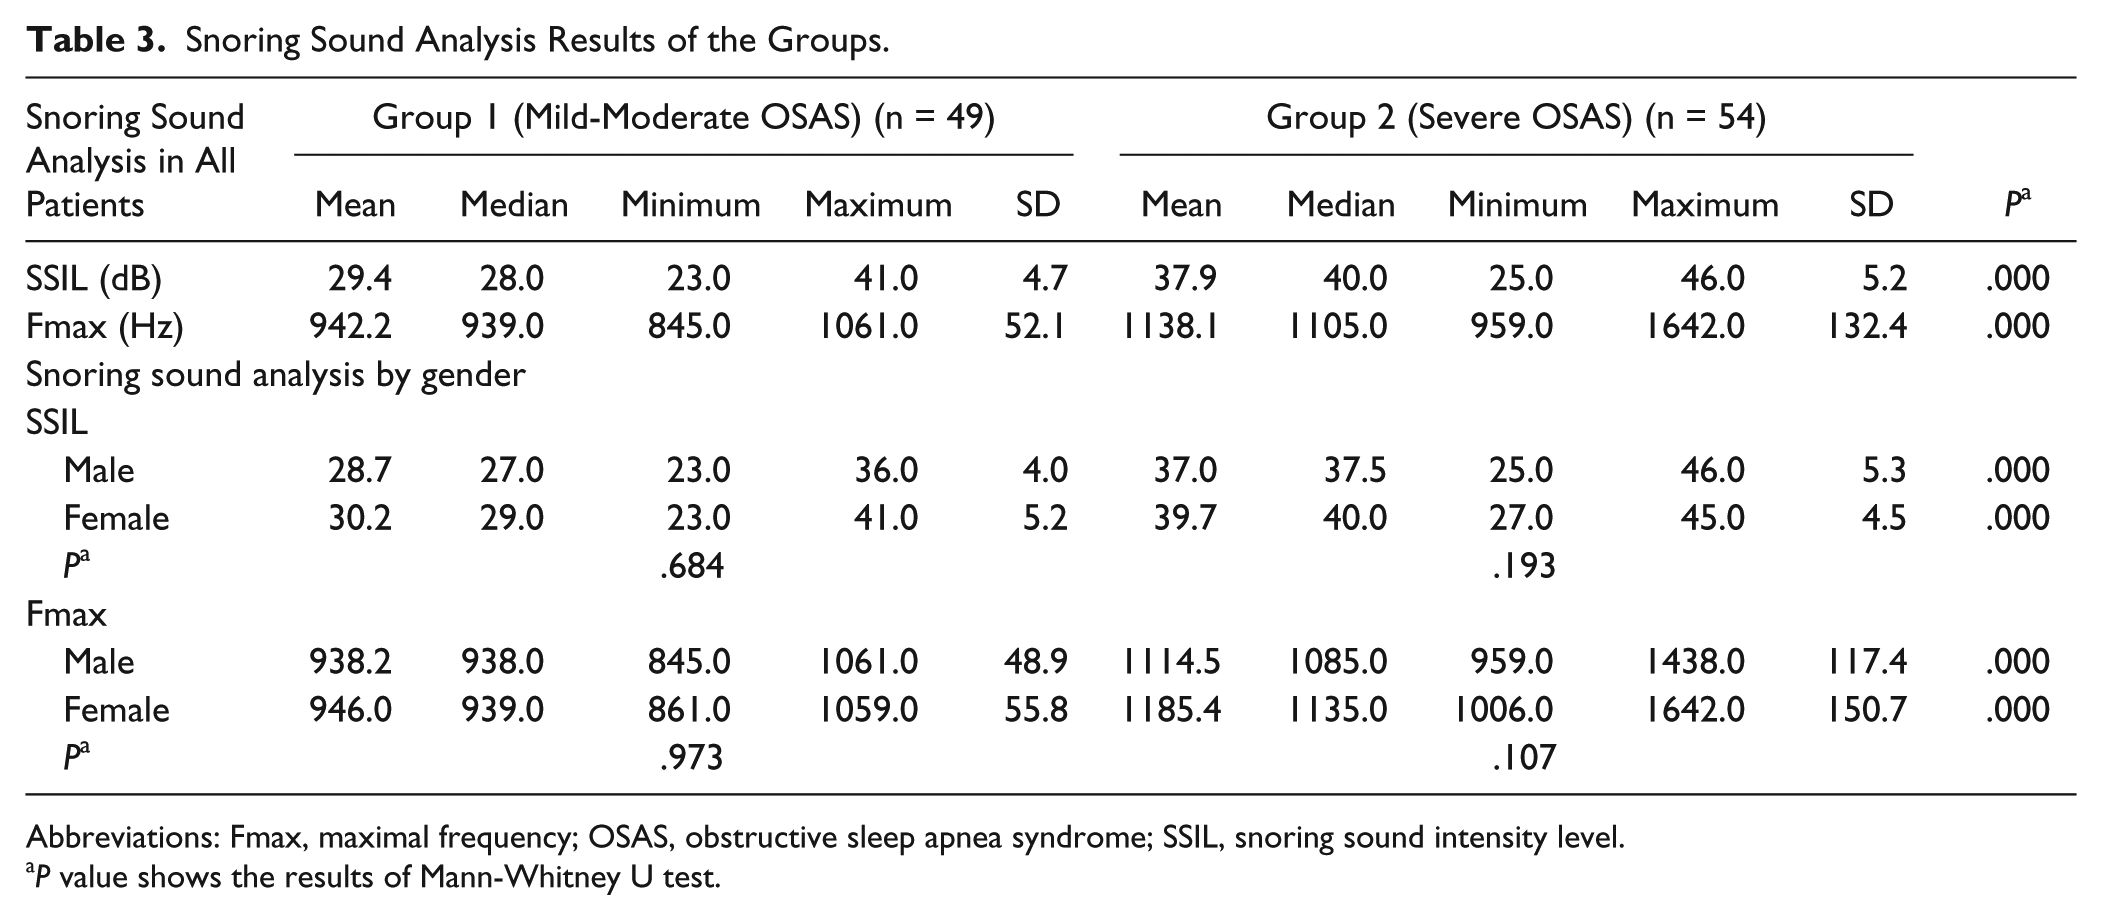
Abbreviations: Fmax, maximal frequency; OSAS, obstructive sleep apnea syndrome; SSIL, snoring sound intensity level.
P value shows the results of Mann-Whitney U test.
Snoring Sound Analysis in Each Gender (Males and Females Separately)
SSIL
In the male group, SSIL values were 28.7 ± 4.0 dB in group 1 and 37.0 ± 5.3 dB in group 2. In the female group, SSIL values were 30.2 ± 5.2 dB in group 1 and 39.7 ± 4.5 dB in group 2. In both males and females separately, SSIL values of group 2 were significantly higher than those of group 1 (P < .05) (see Table 3).
For each group 1 and group 2 separately, there is no significant difference between SSIL values of the males and females (P > .05) (see Table 3).
Fmax values
In the male group, Fmax values were 938.2 ± 48.9 dB in group 1 and 1114.5 ± 117.4 dB in group 2. In the female group, Fmax values were 946.0 ± 55.8 dB in group 1 and 1185.4 ± 150.7 dB in group 2. In both males and females separately, Fmax values of group 2 were significantly higher than those of group 1 (P < .05) (see Table 3).
For each group 1 and group 2 separately, there is no significant difference between Fmax values of the males and females (P > .05) (see Table 3).
Correlation of SSIL or Fmax Values With Polysomnographic Findings
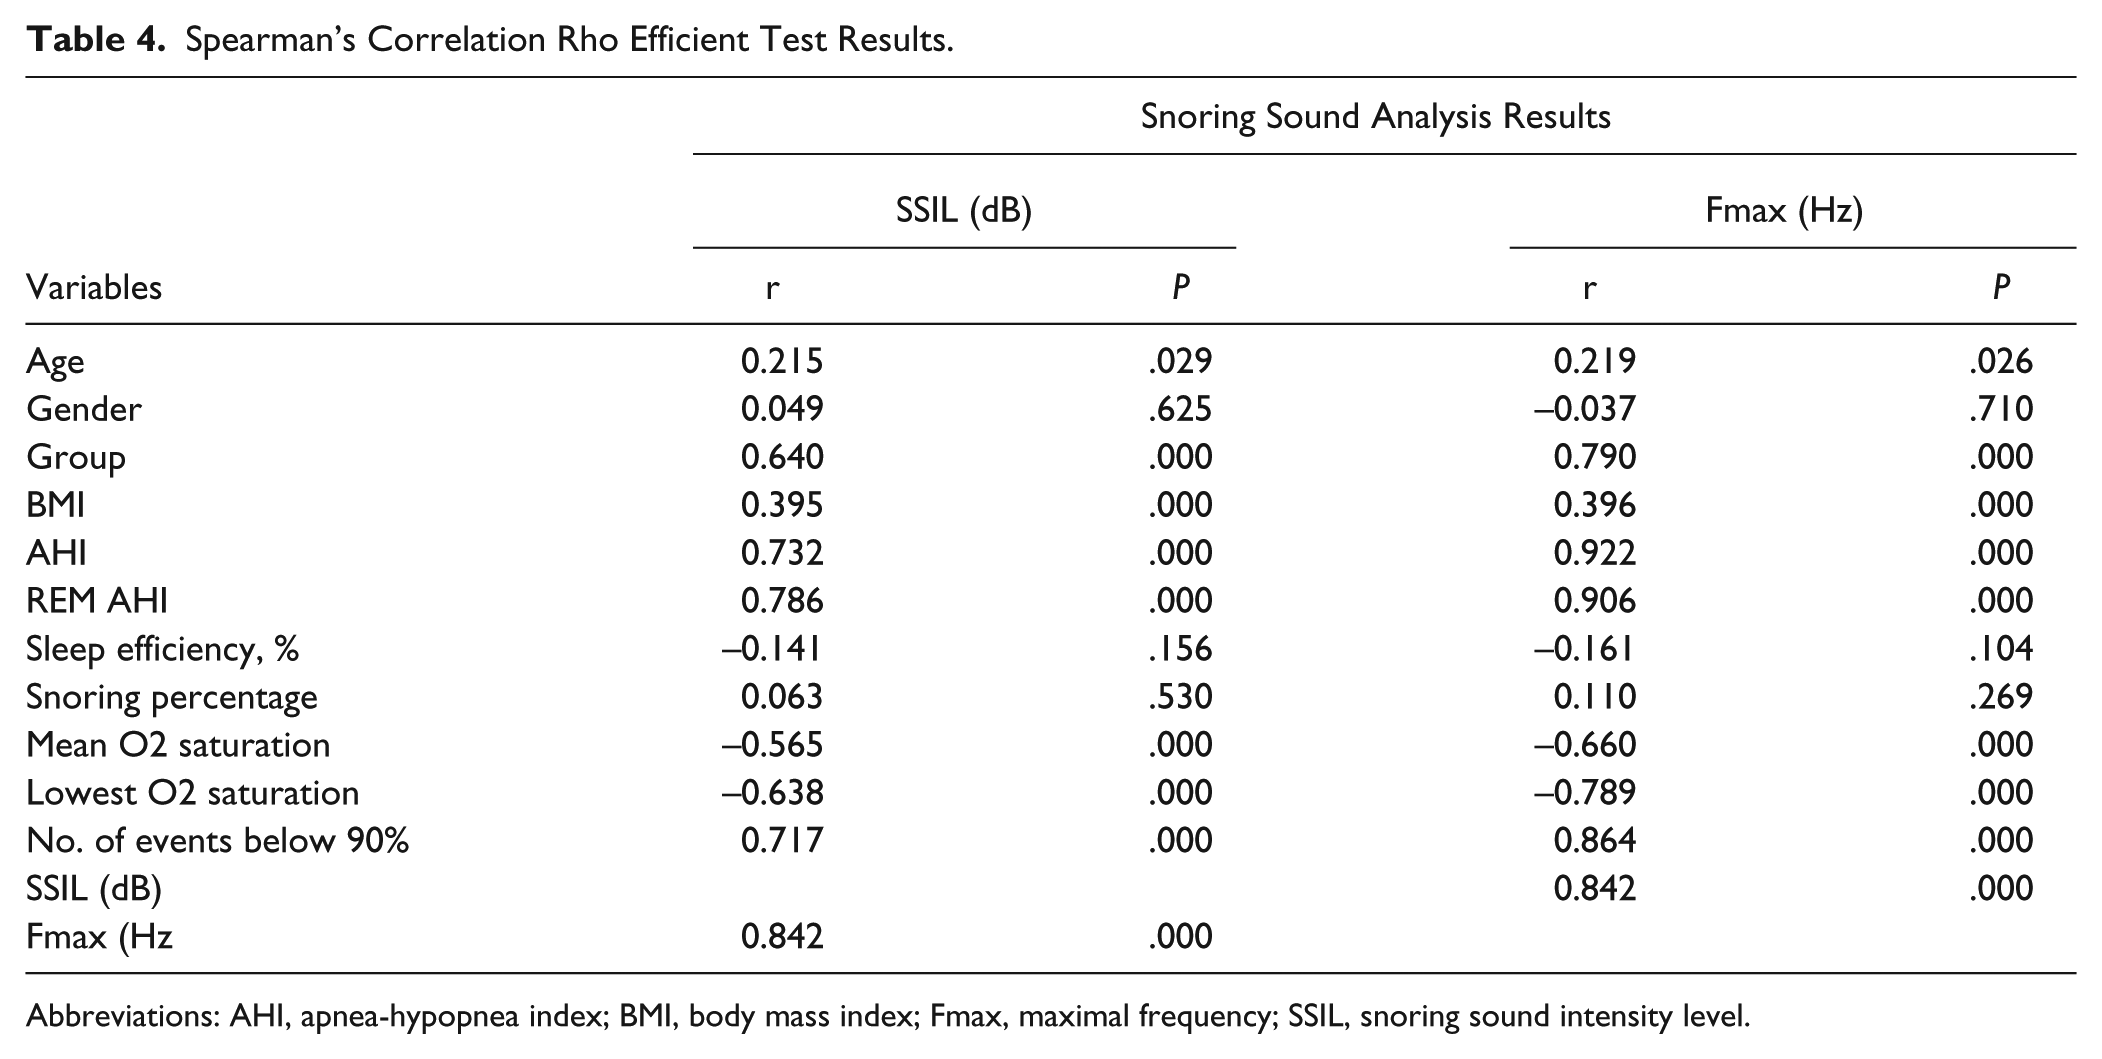
For the analysis of correlation between SSIL or Fmax values with demographics, groups (mild-moderate OSAS and severe OSAS), and PSG findings, Spearman’s correlation rho efficient tests were performed (see Table 4).
Spearman’s Correlation Rho Efficient Test Results.
Abbreviations: AHI, apnea-hypopnea index; BMI, body mass index; Fmax, maximal frequency; SSIL, snoring sound intensity level.
The SSIL and Fmax values increased by age, in females, in severe OSAS patients, and in patients with higher BMI, AHI, and AHI REM values (P < .05). Additionally, in patients with decreased mean O2 saturation and lowest O2 saturation values and increased total number of events with desaturation below 90%, SSIL and Fmax values increased (P < .05). The SSIL and Fmax values increased together.
Discussion
There are miscellaneous clinical studies in the literature trying to associate various characteristics of snoring with the severity of SDB and OSAS. As polysomnography developed in the 1980s, search for different diagnostic parameters for SDB started immediately as an alternative to this expensive, time-consuming test. Snoring, the most frequent symptom of SDB, is one of these parameters that was taken into consideration.
In 1993, Perez-Padilla et al 14 first started the attempts to use snoring sound characteristics to differentiate between non-apneic snorers and OSAS patients. In their study, they found that the peak frequency in simple snorers was lower than the OSAS patients. In 1995, McCombe et al 21 tried to develop an acoustic index, which they named Hawke index, for screening OSAS, depending on the fact that the OSAS group patients displayed a substantially larger high frequency sound component.
In this prospective study, we investigated the relationship between snoring sound frequency and intensity and severity of the OSAS. In severe OSAS group, BMI values were higher than the non-severe OSAS (mild-moderate OSAS). The PSG findings showed that AHI and REM AHI values were higher and mean O2 saturation and lowest O2 saturation values were lower in the severe OSAS group than the non-severe OSAS group.
The SSIL and Fmax values were significantly higher in severe OSAS group than non-severe OSAS group in each gender. There were no significant differences between sexes for these values in the severe OSAS group and mild-moderate OSAS group.
Correlation tests showed that in older patients, in females, in severe OSAS group, and in patients with higher BMI, AHI, and AHI REM values, SSIL and Fmax values increased. As mean O2 saturation and lowest O2 saturation decreased, SSIL and Fmax values increased together.
The main outcome of our study is that Fmax, the maximal frequency of the snoring recordings, and SSIL, average snoring sound intensity level, are strongly correlated with AHI, REM AHI, and severity of the OSAS patients. So, as the severity of the OSAS increased, so did the Fmax and SSIL of the snoring recordings, meaning patients started snoring louder with higher frequency.
In 1996, Fiz et al 22 studied the spectral analysis of snoring sound and discovered 2 different patterns between regular snorers and OSAS patients. Itasaka et al 23 in 1999 also suggested that the intensity of the snoring sound may be significant for the SDB patients. In 2006, Hara et al 24 tried to develop a multidimensional voice program using the markers peak frequency, soft phonation index (SPI), noise to harmonics ratio (NHR), and power ratio to classify SDB patients. In their study in 2008, Herzog et al 25 recorded the peak intensity and the rhythmicity of the snoring sounds and compared their findings with PSG data to distinguish different forms of SDB. They observed that OSAS patients displayed peak intensities above 1000 Hz, and BMI with PSG data in terms of AHI and mean and minimum SpO2 correlated with the peak intensity of the snoring sounds. In 2010, Maimon et al 26 noted that the snoring intensity increased as OSAS became more severe.
Our clinical study was in accordance with the literature. To our knowledge, this is the first research that associates PSG findings with both the frequency and the intensity of the snoring sound. We can assume from our study that Fmax and SSIL can be used as screening tests to define the severity of this disease in large population groups.
People should be aware of the importance of snoring sounds. In particular, patients with snoring sounds increasing in intensity and of higher frequency should discuss with their physicians the possibility of OSAS.
One of the limitations of our study is that we have a rather small sampling group. More research is required with larger patient groups to assess whether measuring Fmax and SSIL levels in snoring sound analyses is enough as a screening test for OSAS patients.
Footnotes
Declaration of Conflicting Interests
The author(s) declared no potential conflicts of interest with respect to the research, authorship, and/or publication of this article.
Funding
The author(s) disclosed receipt of the following financial support for the research, authorship, and/or publication of this article: With exception of data collection, preparation of this paper including design and planning was supported by Continuous Education and Scientific Research Association. There was no funding source. There was only scientific support.