
Abstract
Objectives:
Despite no observable external sound present, a perceived feeling of a recurrent unpleasant sound is a main complaint in the patients with chronic tinnitus. This phantom perception of sound is considered as the auditory equivalent of phantom limb pain, and altered excitability may be involved in its underlying pathology. Tinnitus-related hyper-excitation is suppressed by inhibitory repetitive transcranial magnetic stimulation (rTMS). However, the neural mechanism underlying the treatment is not fully understood, and quantifying the suppression induced by rTMS has yet to be considered.
Methods:
We evaluated the effect of rTMS on the cortical inhibition status following single-site stimulation over the auditory temporal cortex (T group) or dual-site stimulation over the auditory temporal and the frontal regions (TF group). These effects were also compared with outcomes following sham stimulation (S group). Subjective response was recorded using tinnitus-related handicap index (THI), and changes in the cortical inhibition status were assessed using an auditory paired-pulse suppression index (PPSI).
Results:
TF group showed the greatest benefit from the treatment evidenced in the reduced PPSI and THI scores. T and S groups did not benefit much. TF group overlapped mostly with the responder group, indicating improvement in both subjective THI and objective PPSI measurements.
Conclusion:
Our results suggest that rTMS is a beneficial therapeutic treatment for chronic tinnitus patients and the dual-site treatment was the most effective in terms of both tinnitus complaint and quantitative indices. Thus, subjective reports and electrophysiological signatures may be complementary for the diagnosis/prognosis of tinnitus.
Keywords
Introduction
Despite no observable external sound present, a perceived feeling of a recurrent unpleasant sound is a main complaint in the patients with chronic tinnitus.1,2 It is often considered the auditory equivalent of phantom limb pain, 3 and its underlying pathology might have led to altered excitability of the cortical level.4,5 Neural inhibition is one aspect of the natural defense system that suppresses (or ignores) responses for recurrent less meaningful or less informative stimulation, and the mechanism involved is modality general. 6 Functional loss or decline in this natural defense system has been associated with chronic pain, auditory hallucinations, anxiety, and Alzheimer’s and Parkinson’s diseases.7-10
To date, various attempts have been made to modulate excitability in tinnitus, including the use of inhibitory pharmacological agents, such as benzodiazepines (GABA receptor-binding medications), to control hyper-excitability in patients with tinnitus symptoms. In an animal study, calcium switching was associated with suppression in the auditory cortex, 11 but no additional evidence of tinnitus alleviation using this method is available. Currently, no pharmacological agent has yet been specifically indicated effective for tinnitus despite numerous attempts.
Transcranial magnetic stimulation (TMS), which modulates cortical excitability, 12 is a recent therapeutic technology capable of modifying tinnitus for a short period of time13-16 and is recommended as level C, which is given as a treatment with possible effect of repeated session of rTMS of the temporal region. 17 As stated in Kleinjung et al, 18 cortical stimulation on the auditory cortex has been suggested to relieve tinnitus by modulating the otherwise hyper-excitability of the neurons targeted that is assumed to be associated with generating the neural activity causing some form of tinnitus. Auditory and/or nonauditory stimulation has been suggested, but the reported treatment outcomes have varied. Half the patients who received TMS over an auditory or frontal region experienced tinnitus alleviation, while both frontal and auditory stimulations resulted in relatively better outcomes as measured by subjective questionnaires such as the Tinnitus Handicap Index (THI) or visual analog scale (VAS) assessing tinnitus loudness/awareness.19,20
As early as 1931, Ibbotson 21 observed that tinnitus radiates into the frontal, vertical, and occipital areas of the skull, indicating what is now referred to as the tinnitus network in the brain.22,23 Recently, we found that patients who received dual-site stimulation in the frontal and temporal regions showed significant improvements as evaluated by self-report THI compared with patients with single-site frontal stimulation. 16 Triple-site repetitive (rTMS) has also been explored. 24 The aforementioned evidence suggests that tinnitus is network rather than specific region related. For this reason, we looked at network connectivity in our tinnitus patients depending on the treatments. Our expectation was that responders/nonresponders would show different network characteristics and that the differences would be associated with the specific stimulation.
Although tinnitus is assumed to be alleviated by inhibitory rTMS, little is known about the underlying neural mechanisms and varying effects according to stimulation site. We applied an auditory paired-pulse paradigm to investigate the cortical excitability induced by rTMS in chronic tinnitus. Our hypothesis is based on central sensitization associated with persistent pain. We consider tinnitus as a resulting state of excessive sensitization in the cortex. Altered inhibition has been evaluated using a paired-pulse paradigm that quantifies cortical excitability using the ratio of the response to a second stimulus (PP-S2) to that to a first (PP-S1) stimulus in somatosensory,8,25,26 auditory, 9 schizophrenia, 27 migraine, 28 Parkinson’s disease, 29 depression, 30 and many other studies. We expected that inhibitory rTMS would reduce PPSI in tinnitus patients depending on stimulation methods, and we attempted to examine the behavioral implications of tinnitus severity–related changes in PPSI resulting from the treatment. We focused particularly on the neural response to the second stimulus in the paired-pulse paradigm (PP-S2). Sources of PP-S2 event–related potential (ERP) signatures were identified to determine their change in cortical excitability by the treatment.
Because stimulation over the auditory area alone has not been sufficient to improve tinnitus-related complaints and nonauditory involvement in the tinnitus network is now obvious, a target region apart from the temporal lobes was considered based on previous studies and the literature: the dorsolateral prefrontal cortex (DLPFC).24,31 Our hypothesis is that dual-site rTMS involving the frontal area of the tinnitus network would suppresses tinnitus by potentiating the alpha network. This hypothesis is supported by the report that additional rTMS applied to DLPFC, along with a single low-frequency temporal rTMS, brought about a decrease in THI scores that was significant in 3 out of 5 patients. 31 Langguth et al also stated that tinnitus research has shifted to a more global perspective and citing several studies, is considering nonauditory cortical areas. 5 This research team compared a triple-site (DLPFC and bilateral temporo-parietal stimulation) with a single temporal stimulation. The triple stimulation was found to be more effective in reducing tinnitus-related discomfort, as evidenced in reduction in the tinnitus questionnaire score.
In the current study, our purpose was to reduce and/or restore the hyperactivity of the cortical function owing and/or leading to tinnitus, and we thus applied an inhibiting low-frequency rTMS (1 Hz) paradigm. Our study is based on evidence of tinnitus reduction using a 1 Hz stimulation and a hyper-excitation model of tinnitus, which considers tinnitus as a result of abnormal disinhibition. In particular, a study addressed the idea that a combined low-frequency stimulation over the temporal and frontal sites might support the involvement of the DLPFC in the pathophysiology of tinnitus, although their result did not reach a level of significance. 20 Because a stimulation over the DLPFC has been associated with an antidepressant effect,32,33 we also believe that the mood problems associated with tinnitus can be modulated using a 1 Hz rTMS of the frontal cortex. Although our subjects were not depression patients (according to Beck’s Depression Inventory score), we found that a 1 Hz rTMS applied to the left frontal cortex together with temporal area stimulation has helped our tinnitus patients. 34 We hypothesized that cortical inhibition would be restored in patients who received dual-site (2 core regions in the tinnitus network) stimulation more so than in the patients who received auditory only or sham stimulation. The restored cortical inhibition will be explained in terms of the cortical suppression ratio and patient reports.
Materials and Methods
Study design and inclusion/exclusion criteria
The present study was approved by the Institutional Review Board of Seoul National University Hospital and was conducted in compliance with the Declaration of Helsinki, International Conference on Harmonisation Guidelines for Good Clinical Practice. The study was registered as a clinical trial (NCT02617953) prior to the first enrollment. Patients with chronic tinnitus for more than 6 months were recruited after providing written informed consent. In total, 27 patients were initially recruited from the outpatient clinics of the Department of Otolaryngology–Head and Neck Surgery of Seoul National University Hospital (October 2016 to approximately November 2017). Eligibility criteria were (1) experiencing chronic tinnitus for more than 6 months and (2) chronic tinnitus of an intensity of at least 16 on the THI but no hearing loss. We defined normal hearing as the air-conducted 3-tone (0.5, 1.0, and 2.0 kHz) average <25 dB HL according to 1964 International Organization for Standardization (ISO) criteria. 35 In addition, eligible participants were (3) between 30 and 70 years of age and (4) willing to suspend other medications for at least for 3 weeks. Patients were excluded if they had (1) an unstable major medical condition, (2) concomitant medication with antidepressants and antipsychotics, or (3) contradictions for electroencephalography (EEG), magnetic resonance imaging, or TMS (eg, permanent retainers, pacemakers, or cochlear devices). Normal middle ear status was confirmed via audiometry and otoscopy, and abnormal psychological conditions such as depression, anxiety, and insomnia were screened for using a validated version of the Beck Depression Inventory, 36 State-Trait anxiety inventory, 37 and Pittsburgh Sleep Quality Index. 38
The participants finally confirmed to be eligible for the study were assigned randomly to receive rTMS using an unrestricted randomization technique. The treatment outcomes were evaluated by a physician who was blinded to the treatment method. All patients were informed that they would be assigned randomly to one of the treatment protocols. Because the patients did not know the difference between the treatment arms, they were not able to tell if they were allocated in the true rTMS group or the sham treatment group. Tinnitus severity was assessed before rTMS treatment using a self-rated THI and VAS scale evaluating tinnitus awareness, loudness, annoyance, and effects on daily life. Baseline and posttreatment EEGs were recorded using the same paradigm. All the procedure and outcome measurements were checked to meet the global criteria.39,40
TMS administration
After a cross-check for TMS eligibility and completion of questionnaires, participants were assigned to a group: the auditory temporal cortex (T), dual-site stimulation over the auditory temporal and the frontal (TF) regions, and sham (S) stimulation groups. During the treatment session, the patients were seated in a comfortable chair and a nonwoven fabric cap was fitted tightly to each patient’s head. The caps were measured individually and marked to indicate the international 10-20 EEG electrode positions and a line from T3 to Cz over C3.41,42
The group assignment was performed randomly using a sealed opaque envelope containing the group assignment for each patient. Except for the researcher who performed the rTMS, all other researchers and patients were blinded to the treatment method. The patients were only informed of receiving treatment A, B, or C with no knowledge of which treatment they received.
Clinical evaluation
Pure tone audiometry, tinnitograms, and self-reported questionnaires (THI and VAS) assessing tinnitus awareness, annoyance, loudness, and effects on daily life were performed pretreatment (baseline) and 2 weeks posttreatment. Tinnitogram here refers to the traditional psychoacoustical test that tries to find a sound (or tone) that matches with the patient’s tinnitus.43,44 In the tinnitus pitch- and loudness-matching test, patients were requested to choose the most similar sound with their perceived tinnitus among a pure tone, a narrowband noise, or a white noise. Next, a frequency adjustment from 0.125 to 8 kHz with the 1/1 octave step size was performed on patients who chose a pure tone or narrowband noise. To exclude the possibility of frequency confusion between neighboring octaves, the octave confusion test was performed at a frequency of 1 octave higher than the first pitch-matched frequency and subsequently at a frequency 1 octave lower. 45 After confirming the final octave-confirmed frequency, loudness was adjusted to identify the closest tinnitus loudness. 46
Determination of the responders
A clinically meaningful difference was defined as an improvement in the THI score (ΔTHI) of at least 7 points. 47 The patients who received sham stimulation but reported a placebo response were considered nonresponders. 19
EEG recordings
Baseline EEG was performed prior to the rTMS session and posttreatment EEG, the second week (±3 days) after the rTMS treatment. 16 A 64-channel EEG signal was recorded at a sampling rate of 1000 samples/s using an EEG recording system with the SynAMP2 amplifier and CURRY software (version 7) and an electrode cap with sintered Ag/AgCl electrodes (Quick-Cap, Compumedics, Neuroscan, Charlotte, North Carolina, USA) in a lighted room shielded against sound and stray electrical fields. International placement referenced to linked ears, and the impedances were maintained below 5 kΩ at all electrodes, including electrooculography (vertical and horizontal) and electrocardiography, throughout the recording. Participants sat upright throughout the test with eyes fixated on a cross mark ~1.2 m away at the eye level of the participants.
During the ERP sessions, an auditory paired-pulse paradigm was used. The stimulus was two 20-ms long 1 kHz pure-tone beeps with an interstimulus interval of 300 ms, delivered via an insert earphone (ER2, Etymotic Research, Inc. Elk Grove Village, Illinois, USA). Stimuli were presented using the Presentation software (version 18.1; Neurobehavioral Systems, Inc., Berkeley, California, USA). Although the sound intensity was set at a 65 dB sound pressure level, a few participants heard the stimuli at their individual most comfortable level. Participants were instructed to rehearse two2syllable words, sporadically presented, to stay awake. Two sessions of 7 minutes each were separated by at least a 3-minute break.
Signal preprocessing
Data were filtered offline using 0.1 to 30 Hz Butterworth band-pass filters. The epoch period of the analysis was 1000 ms, including a 200-ms prestimulus baseline. Epochs containing amplitudes exceeding ±100 μV were excluded automatically from calculation of the average. Eye blinks and muscle movement-related artifacts were corrected using an independent component analysis (ICA) based on infomax algorithm48-50 and further visual inspection. Bad channels (less than 10 total channels) were corrected using automated spherical spline interpolation. 51 Data were then re-referenced to a common average reference and baseline-corrected separately for each channel according to the mean amplitude of the EEG over the 200-ms period that preceded stimulus onset. The grand means for each condition (group) were computed for analysis and visualization purposes. From 9 (F1, Fz, F2, FC1, FCz, FC2, C1, Cz, and C2) front midline scalp sites, we assessed the peak amplitudes of each N1 and P2 component in the N1-P2 complex, and the PPSI was calculated as the ratio of the amplitude of the second (A2) to that of the first (A1) response (PPSI = PP-S2/PP-S1). To obtain the “true” activity of the second pulse in the paired-pulse stimuli (PP-S2) 52 and factor out the linear superposition over to the second pulse, we subtracted the response to single-pulse stimuli from the response to paired-pulse stimuli. 26 The differences (ΔPPSI) from post-PPSI (PPSIpost) to pre-PPSI (PPSIpre) were then compared (ΔPPSI = PPSIpost − PPSIpre). Pre-PPSI refers to pre-rTMS treatment, and post-PPSI refers to post-rTMS treatment. For interpretation, a higher PPSI was associated with little suppression, and a negative post-PPSI to pre-PPSI difference was associated with improvement due to restored cortical inhibition. Electrophysiological data were analyzed using the Matlab software (Mathworks, Natick, Massachusetts, USA), along with Fieldtrip 53 and the EEGLAB toolbox. 54
Source localization
Exact low-resolution brain electromagnetic tomography (eLORETA) was used to estimate the neural sources generated by the scalp-recorded activity in 3 frequency bands (2~6, 8~12, 14~24 Hz). The strength of eLORETA is that it computes electric neuronal activity as current density without assuming a predefined number of active sources, including whole-brain gray matter and hippocampi, as defined using the digitized Montreal Neurological Institute 152 space template. 55 Thus, eLORETA is able to localize correctly, within a 5 mm voxel, so-called deep structures such as the cingulate cortex, 56 part of the tinnitus-related network. Because source localization using cognitive ERPs was further validated as being reliably applicable, 57 sources were localized in the time range of 400 to 600 ms post-stimulus onset, which corresponds to the response to the second pulse (PP-S2) of the paired-pulse in which we were particularly interested.
Brain network analyses
Whole-brain network analysis
Whole-brain functional network topology, depending on the group, was evaluated using metrics from Brain Connectivity Toolbox. 58 A graph is used as an abstract representation of a network, which consists of a set of nodes (or vertices) and edges (or connections). The presence of an edge between 2 nodes suggests an interaction between them. In the current study, EEG sources corresponded to nodes, and a link between 2 nodes was determined by calculating the functional connectivity between the EEG time series signals of 2 sources. We particularly focused on the small-worldness property, which reflects the efficiency of the brain function. Details were provided in the Supplemental Material available online.
Directed effective connectivity
To evaluate directed effective connectivity, partial directed coherence (PDC) was used during the time range of PP-S2. 59 Based on a multivariate autoregressive (MVAR) model, PDC estimates connectivity in the frequency domain, providing a linear measure of causality among sources. The measure includes the direction and strength of a connection. PDC values range from 0 to 1, with a value close to 1 indicating that most of the signal in source i is caused by the signal from source j. Conversely, values close to 0 may indicate little information flow from source j to i at a particular frequency, f. The statistical significance of the PDC value was determined by Fisher’s z-transformation at a significance level of .01. In total, 9 regions of interest (ROI) were selected for the directed connectivity analysis (Table S2 in the Supplemental Material). Seven ROIs were from the current source analysis results and 2 others were from the literature.19,60 Detailed information regarding this method is described in the Supplemental Material and our previous publication. 61
Statistical analysis
Demographic data and outcomes of the clinical evaluation were compared among treatment groups using the Mann-Whitney U-test, and the level of statistical significance was set at P < .05. The changes within groups across time were also compared using the Wilcoxon’s signed rank test with Bonferroni correction, and P < .05 was considered to indicate statistical significance. Group effects for rTMS sites and treatment responsiveness were determined using a paired- or independent-samples t test and 1-way ANOVA for group comparisons. To compare sources, nonparametric statistical analyses were performed for each contrast using multiple voxel-by-voxel comparisons in a logarithm of the F ratio. The significance threshold of the log F ratio was based on a permutation test with 5000 permutations. 62 Statistical analyses were performed using the SPSS software (ver. 22.0; IBM Corp., Armonk, New York, USA) and built-in functions provided by Matlab (R2014a, Mathworks). All group data are presented as mean ± SD, and an outlier was defined as greater than the mean 2 SD.
Results
All of the patients completed rTMS sessions, and no adverse side effects were reported. The demographic data showed no significant group differences except for the annoyance of tinnitus on the VAS (Table 1) at baseline.
Clinical and Demographic Characteristics (mean ± SD).
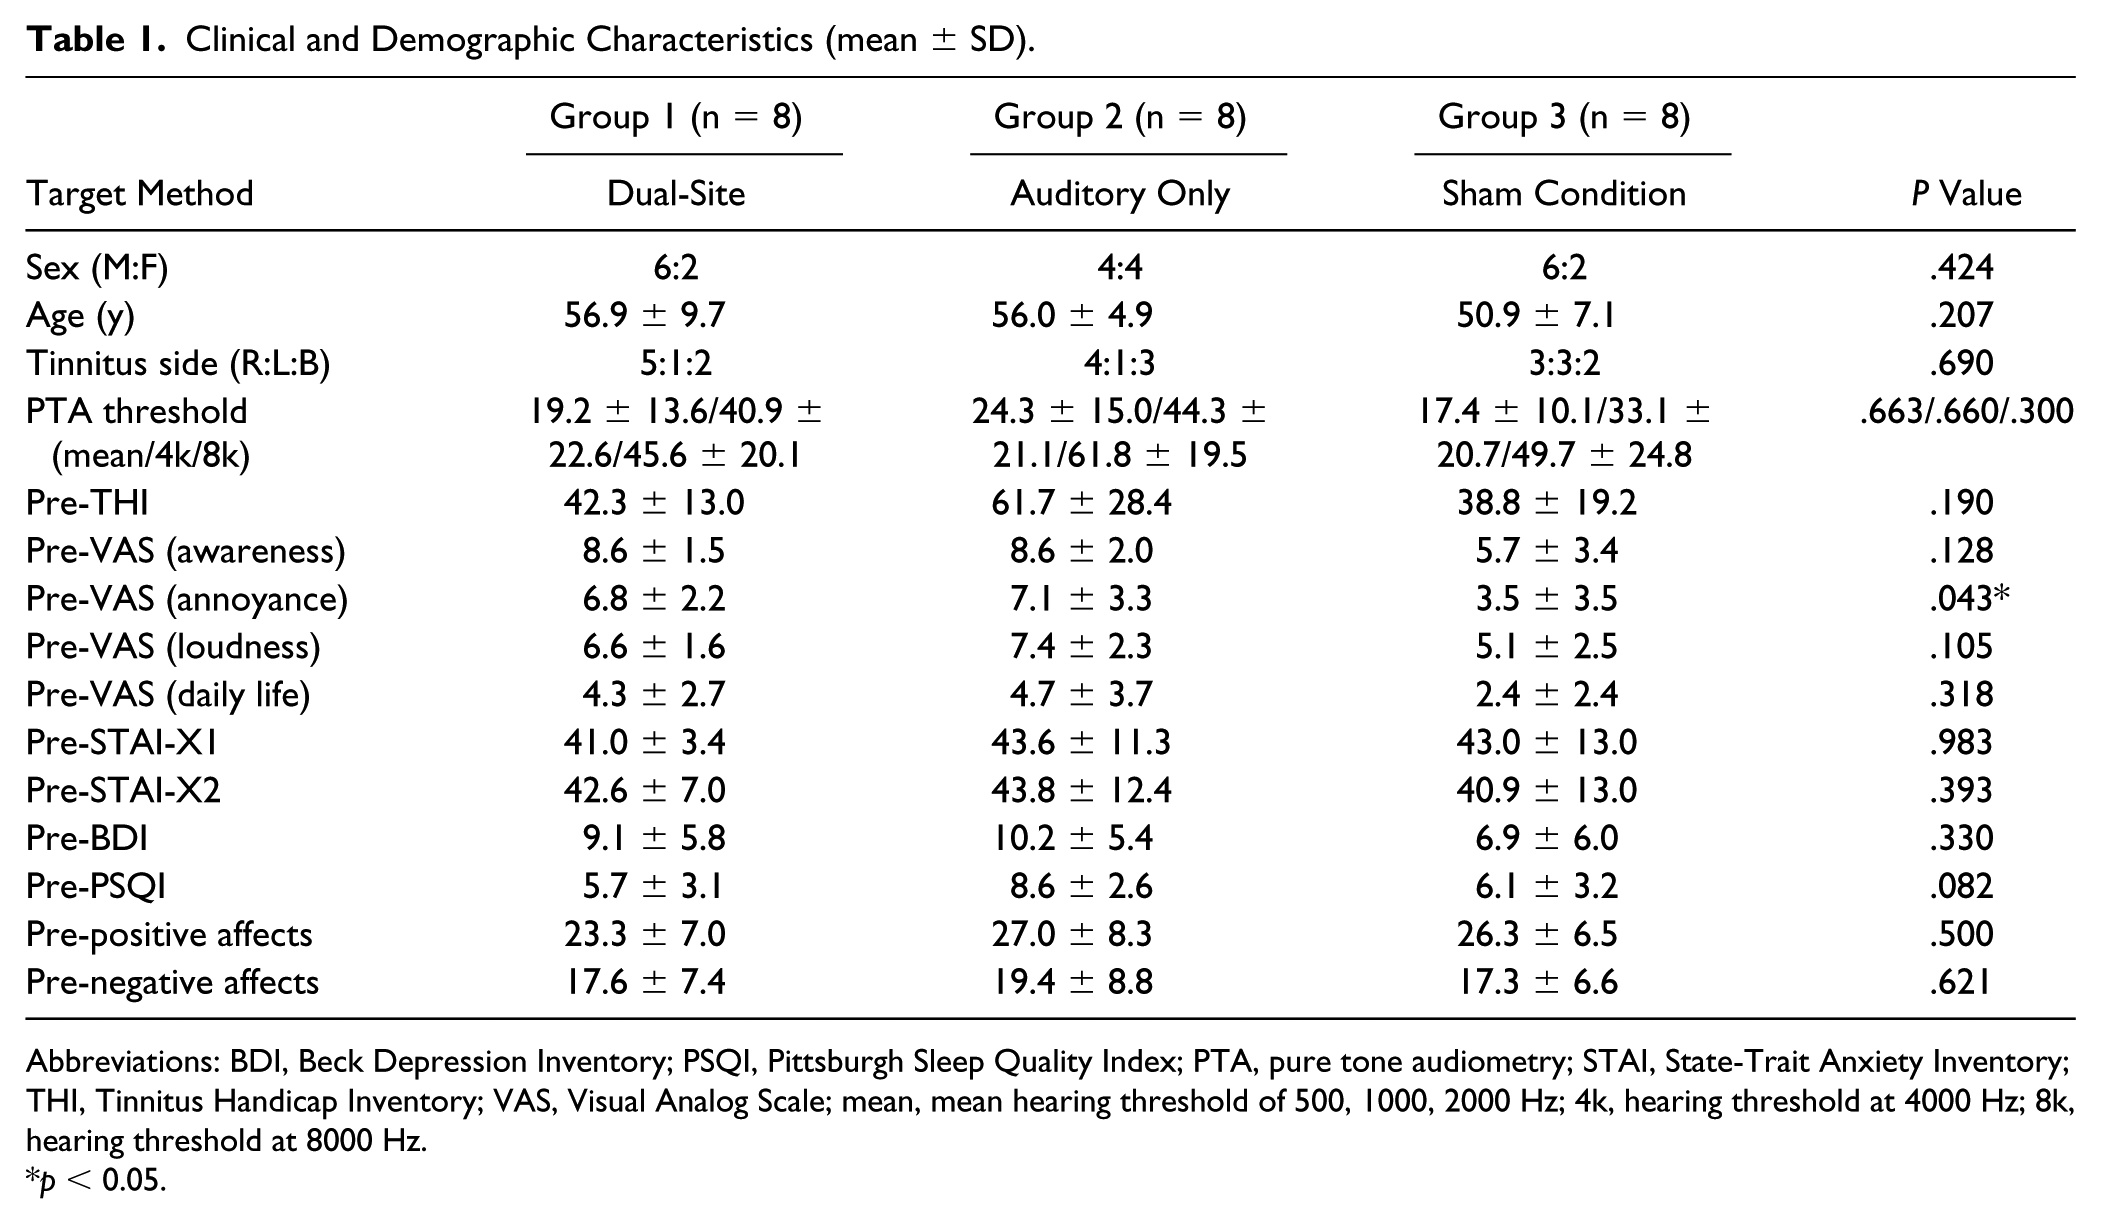
Abbreviations: BDI, Beck Depression Inventory; PSQI, Pittsburgh Sleep Quality Index; PTA, pure tone audiometry; STAI, State-Trait Anxiety Inventory; THI, Tinnitus Handicap Inventory; VAS, Visual Analog Scale; mean, mean hearing threshold of 500, 1000, 2000 Hz; 4k, hearing threshold at 4000 Hz; 8k, hearing threshold at 8000 Hz.
p < 0.05.
Grand mean ERP
Figure 1 shows the grand mean ERPs of the 3 rTMS treatment groups (upper) and the nonresponder and responder groups (lower) between pretreatment (dashed lines) and posttreatment (solid lines). For illustration, the displayed waveforms were from Fz electrodes.
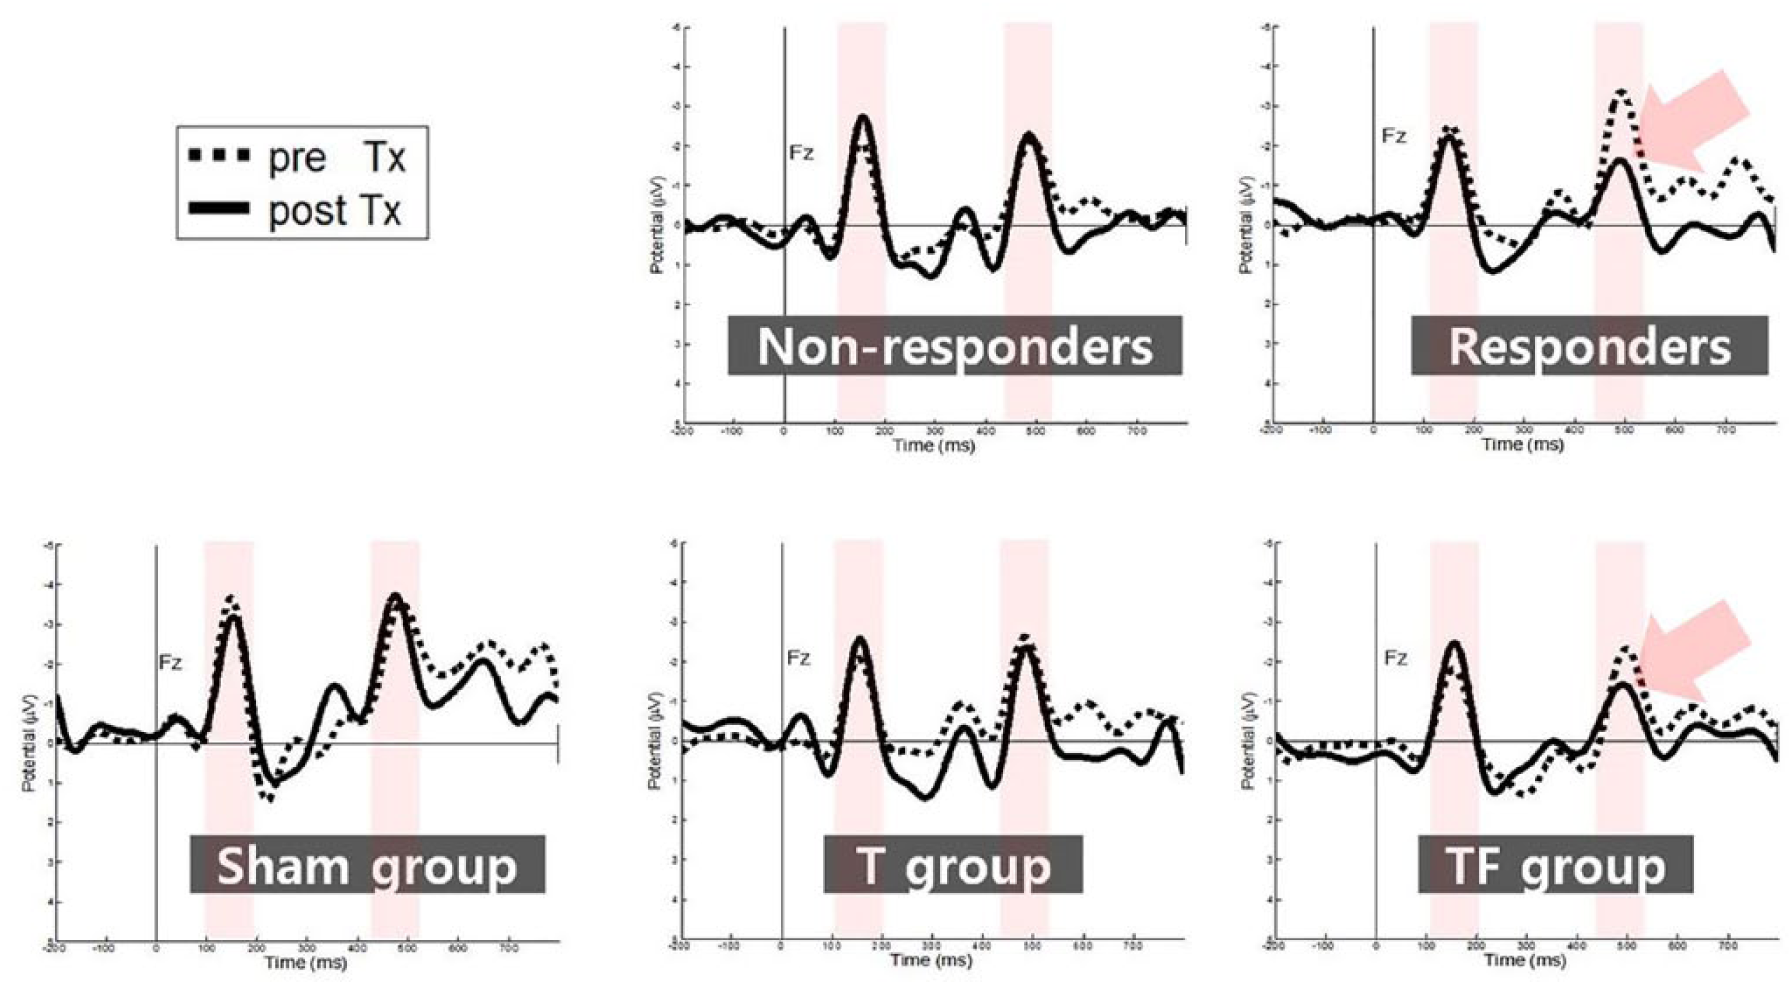
Grand mean event–related potential signatures (ERPs) of the (upper) 3 repetitive transcranial magnetic stimulation (rTMS) treatment groups and the (lower) nonresponder and responder groups between (dashed lines) pretreatment and (solid lines) posttreatment. Shaded are the first and second responses to the paired-pulse stimuli. The displayed waveforms were from Fz electrodes with negative up.
ΔPPSI
The TF group showed a clear decrease in activity in the second stimulus of the paired pulse when the pretreatment waveform was compared with posttreatment waveform, whereas the T and S groups did not show much of a decrease. The ΔPPSI values represented in ratio among the 3 treatment groups were significantly different (P = .035). A post hoc test using Bonferroni correction for multiple comparisons indicated that the TF group (–17.57 ± 7.47) was significantly different from the T (6.94 ± 6.46, P = .023) and S (6.78 ± 7.29, P = .024) groups, whereas the T and S groups did not differ from each other (Figure 2A, left). The ΔPPSI of the responder group (–11.12 ± 5.94, n = 8) was significantly lower than that of the nonresponder group (4.89 ± 3.59, n = 8) according to an independent-samples t test (t = −3.082, P = .009) at a confidence level of 95% (Figure 2A, right). Change in the cortical excitation according to the treatment was definite in the TF group and responder group showing a significant decrease in PPSI compared with the other two groups.
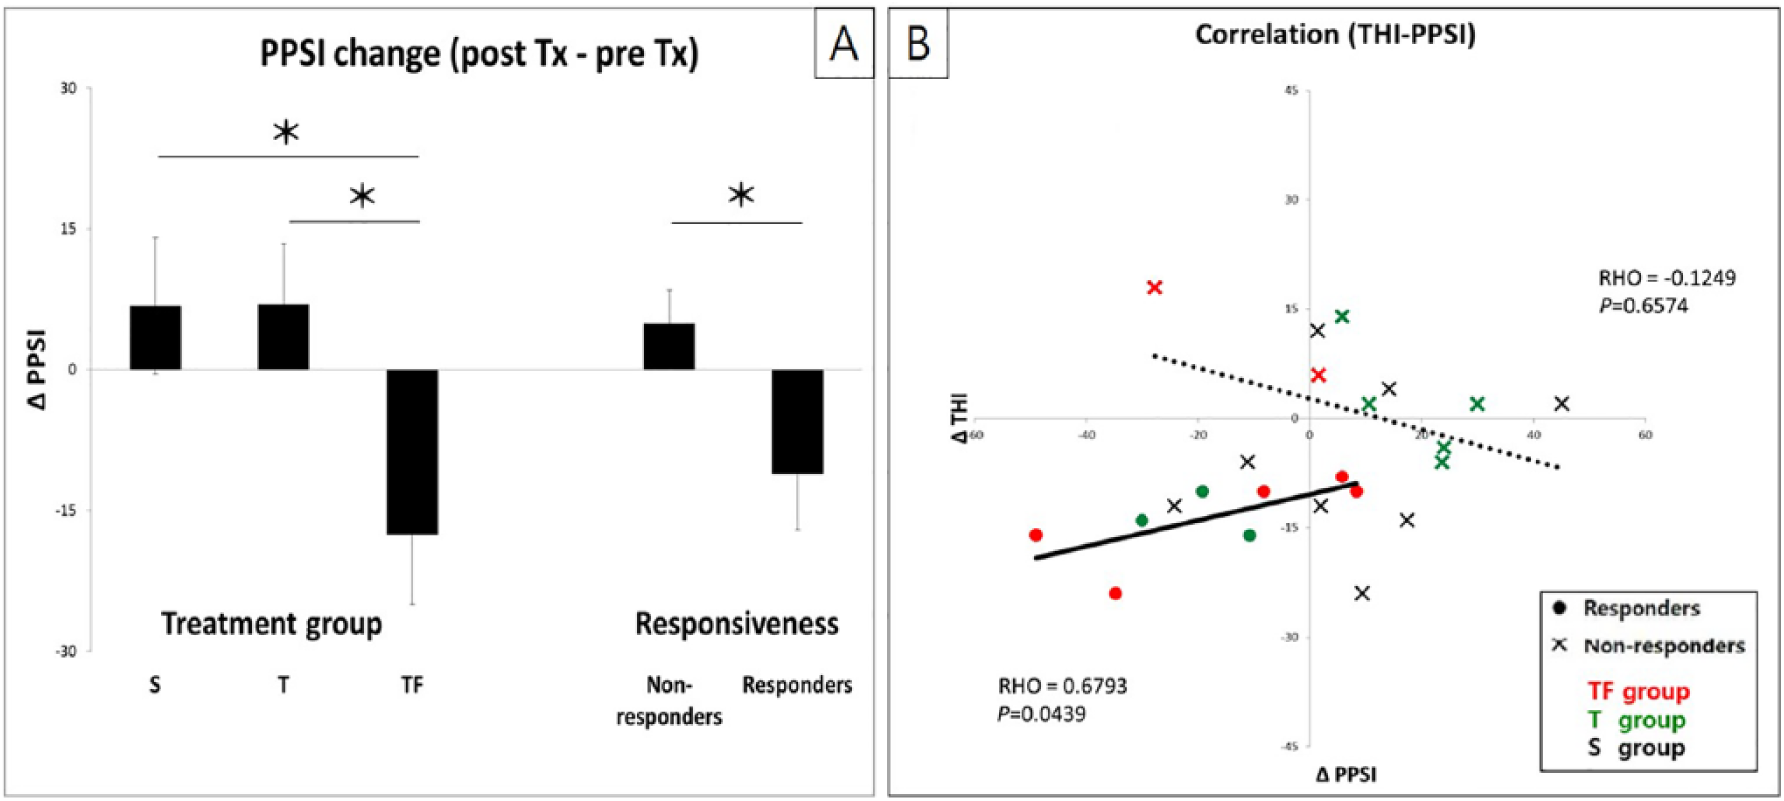
(A) Change in the cortical excitation status according to the (left) treatment group and (right) responsiveness to treatment. The TF group showed a significant decrease in cortical hyper-excitability compared with the other 2 groups, whereas there was no significant difference between the T and S groups. (B) The correlation between the ΔTHI and ΔPPSI in the responder (•) and nonresponder (X) groups, TF (red), T (green), and S (black). A total of 23 data were plotted since 1 outlier was excluded.
ΔTHI
TF group (mean = −6.29, range, –24~18) had greater reduction in the tinnitus complaints compared to both T (mean = −4, range, –16~2) and S (–6~12) groups. Responder group (ΔTHI > 7) included 5 TF- and 3 T-treated patients. No change in tinnitogram was found due to rTMS treatment. Majority reported 8 kHz as matching tinnitus pitch. Four patients reported 4 kHz, and 1 patient reported 2 kHz.
Correlation analyses showed that the ΔTHI was correlated with the ∆PPSI in the responder group (RHO = 0.68, P = .04), indicating that the larger the difference in the THI score, the larger the difference in PPSI due to rTMS in the responder group; no such correlation was evident in the nonresponder group (RHO = −0.12, P = .66). For the correlation analysis, we included S group in the nonresponder group following a previous study in which those patients who had a placebo response to a sham stimulation were considered as nonresponders. 19 Groups were color-coded (TF: red, T: green, sham: black) with responders (•) and nonresponders (X). One outlier was excluded from nonresponder data set (Figure 2B).
Source analyses
Sources were localized from the timeframe of the PP-S2. Comparisons were carried out among groups and between pre- and posttreatment. The results from paired-sample t tests are summarized in Table S2 in the Supplemental Material. After treatment, responders and TF group showed decreased alpha activity during PP-S2 when compared with nonresponders and T/S groups, respectively. Decreased activity was commonly observed in the posterior region (cingulate cortex and cuneus), the frontal area, and the temporal region (Figure S1, left panels, in the Supplemental Material). When compared between pre- and posttreatment, nonresponder group showed overall increased activity. T group showed decreased alpha activity only in the temporal area. S group showed decreased alpha activity in the limbic and cingulate regions and increased alpha activity in the temporal and frontal areas (Figure S1, right panels, in the Supplemental Material).
Functional connectivity
Graph theoretical network topography
TF/responder and T/nonresponder groups were significantly different in the correlation matrices (Figure S2, upper panel, in the Supplemental Material). A network here with small-worldness index >1 is considered as effective. While nonresponder and T showed small-worldness indices around 1, those of the responders and TF were higher than 1. The whole-brain network in the responder and TF was observed to have shorter Lp and higher Cp than in the nonresponder and T, being an effective small-world network. The network topology in the TF group (many overlapping with the responder group) was within a small-world range after treatment. However, the network topography in the T and S groups (overlapping mostly with the nonresponders) did not change in the small-world indices (Figure S2 in the Supplemental Material). Details were provided in the Supplemental Material.
Directed effective connectivity
Correlation between subjective reports (using the ΔTHI) and normalized alpha (α) band connectivity, measured using a PDC, showed the most negative correlation in the connection from the left DLPFC to cuneus (R2 = 0.22, P = .043) and the most positive correlation for the cuneus to cingulate cortex connection (R2 = 0.23, P = .037), as shown in Figure 3. No other connection surpassed the threshold value (P < .05). The greater the inflow to the cuneus from the DLPFC, the higher the patient’s satisfaction with the rTMS treatment, while the greater the inflow to the cuneus from the cingulate cortex, the lower the satisfaction. Normalized PDC values were obtained by comparison with 10,000 surrogate data (P < .01).
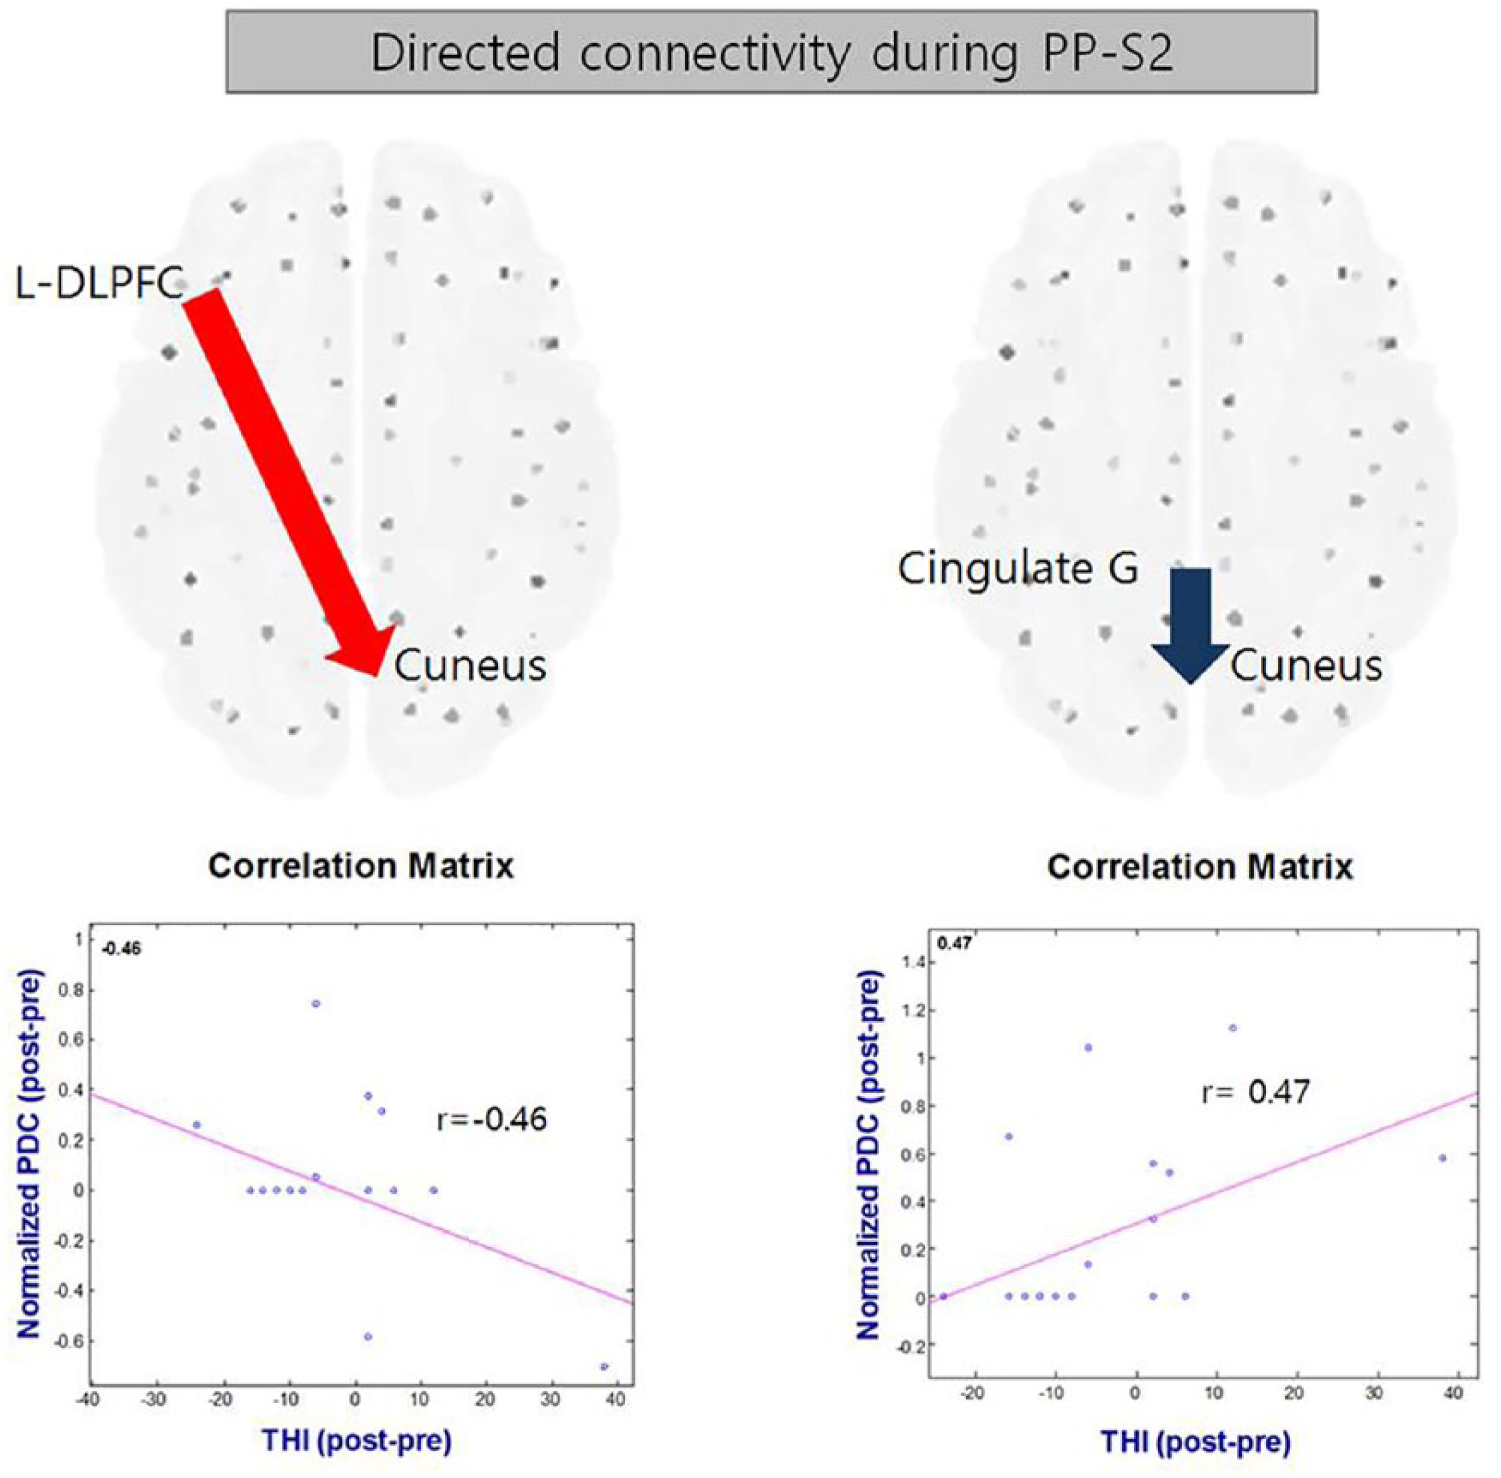
Correlation between subjective reports (using the THI) and normalized alpha (α) band connectivity, measured using a PDC. The greater the inflow to the cuneus from the dorsolateral prefrontal cortex, the higher the patient’s satisfaction with the repetitive transcranial magnetic stimulation treatment (left, r = −0.46, P = .043). The greater the inflow to the cuneus from the cingulate cortex, the lower the satisfaction (right, r = 0.47, P = .037). Normalized PDC values were obtained by comparison with 10 000 surrogate data (P < .01).
Discussion
This study first addresses the cortical inhibition mechanism underlying chronic tinnitus suppressed by rTMS. In a prospective, randomized, double-blind trial, we investigated the efficacy of rTMS for different stimulation methods compared with sham stimulation. Major outcome measures included subjective reports using tinnitus-related questionnaires and EEG signatures. Our results highlight that our dual-site rTMS had a positive effect on suppressing tinnitus-related complaints, presumably by inhibiting hyper-excitation within the major tinnitus networks. Because the paired-pulse paradigm has been used for quantifying the cortical inhibition rate in various modalities (tactile or auditory), an auditory paired-pulse paradigm was used to estimate cortical inhibition by rTMS. The resulting paired-pulse suppression ratios revealed a significant decrease in the dual-site group posttreatment compared with baseline and significant differences compared with both the auditory-only and sham groups, indicating a beneficial effect of dual-site rTMS. Neural sources generated by the second stimulus of the paired-pulse showed significantly decreased activity in the frontal, temporal, and parietal lobes; cuneus/lingual gyrus; and cingulate cortex in the dual-site treatment/responder groups after rTMS. Most notably in the connectivity analysis, connectivity from the DLPFC to the cuneus was the most positively correlated with the subjective complaint score: the higher the connectivity, the greater the effect of rTMS. Additional stimulation over the frontal site might have increased the connectivity to the cuneus from DLPFC, contributing to reduced tinnitus-related hyper-excitability. Because the left DLPFC has been reported to be the strongest predictor of rTMS-related changes, specifically in tinnitus awareness, we might expect that rTMS at this region contributed to restoring the otherwise hyper-excited attentional network. Our results also showed the most negative correlation of connectivity from the cingulate cortex to the cuneus with tinnitus complaints. These results are consistent with recent reports of an association between tinnitus and 2 major networks: a frontoparietal network, regulating cognitive control of attention, and a cingulo-insular saliency network, mediating pain and emotion. 63
The mechanisms underlying paired-pulse suppression are attributable to both presynaptic and postsynaptic GABAergic inhibition. The adaptation in the paired-pulse response depends on the interstimulus interval (ISI) between the adapter (PP-S1 in the current study) and adapted (probe, PP-S2 in the current study). As is stated, the recovery from synaptic depression is accelerated by the buildup of residual presynaptic Ca2+ as a result of repeated stimulation. 64 Our hypothesis was that tinnitus “perception” may be related to an impairment of the cortical inhibition. That is, in the event of acute hearing loss, the irrelevant maladaptive signals generated may be effectively inhibited in subjects with non-tinnitus hearing loss. On the contrary, this process of inhibiting the irrelevant signals may be impaired in tinnitus patients. The maladaptive reorganization of the central nervous system may generate tinnitus, and the cortical disinhibition may be the mechanism of tinnitus perception. We believe that the cortical disinhibition is a general trait of the individual subject and can be detected as PPSI. Normal controls, or hearing loss subjects without a complaint of tinnitus, may show a normal PPSI, whereas chronic tinnitus patients may have a weak cortical inhibition system. Hearing loss or the progression of presbycusis may be irreversible; however, the cortical disinhibition may be plastic and reversible. As has been proposed by many researchers, rTMS may help modulate the cortical activity. We believe that rTMS can help inhibit tinnitus by strengthening the cortical inhibition mechanism. Although the exact mechanism of rTMS is still not clear, our subjects may have benefited from dual-site rTMS because it modulated the perception of tinnitus by strengthening the cortical inhibition within the major tinnitus network.
The effect of our frontotemporal dual-site treatment was nonetheless insufficient (5/8 participants reported alleviation of tinnitus). It seems that the treatment outcome was at least statistically significant and consistent among different trials when the subjects were pooled into a group. Quite recently, a pulsed electrical method inducing neuromodulatory effects, such as transcranial direct current stimulation (tDCS) 65 /transcutaneous vagus nerve stimulation 66 or transcranial random noise stimulation (tRNS) and transcranial alternating current stimulation (tACS), was evaluated, and tRNS showed superior effects compared with tDCS or tACS on alleviating tinnitus. 67 Additional combination treatments deserve consideration.
Caveats
Although the group assignment was carried out in a fully randomized and blinded manner, with no significant difference in the baseline THI scores, the baseline cortical status was not similar among the groups. Indeed, the sham stimulation group had significantly larger ERP amplitudes at baseline.
We acknowledge that our treatment duration (4 consecutive days) was relatively short. However, we also had to take some patients (probably from the sham group) into account. They were expected to wait at least 3 weeks until the study was terminated despite receiving no benefit from the treatment. In our former study, we tried several different sessions and found that rTMS with 4 sessions was effective, whereas that with 3 sessions were not. 68
In the current study, we focused on 2 timepoints (pretreatment and 2 weeks posttreatment). The aim of this study was to find objective changes in the cortical inhibitory system after different rTMS methods, and we selected the timepoints based on our previous publications with randomized clinical trials assessed from pre, 1, 2, 4, and 8 to 12 weeks using the same rTMS protocol.16,34
Moreover, because the frequency resolution in the present ERP data was 3.9 Hz, discrete frequencies cannot be addressed. Thus, we must admit that α band in the current ERP study may slightly overlap with θ and low β bands.
We made every effort to exclude any affective aspect from the treatment outcome by prescreening for depression, sleep, or affective property in the subjects. However, the resulting areas in the present study inevitably were associated with the distress network. We again conform to the integrated tinnitus model, which is characterized by the overlapping parallel framework. 29
We also acknowledge that the choice of the time segment is crucial, and many other studies have focused on the temporal connectivity across lengthy timeframes.69,70 For this reason, we further compared the resting state (pre-fMRI and pre- and post-EEG) in tinnitus patients correlating with the stimulation type (and response). Our results of the resting state fMRI with resting EEG data will be submitted for review in the near future. In the current study, we sought quantifying and estimating measures for a treatment outcome using event-related potential data. Our study was based on a hypothetic model of abnormal inhibition in tinnitus, in which insufficient/disrupted cortical inhibition and cortical disinhibition might lead to a persistent perception of nonexisting sound. Because a paired-pulse suppression index reflects how (well) this inhibition system works, we applied an auditory paired-pulse paradigm to measure the inhibition status. We were specifically interested in the response to the second stimuli, which is thought to be proportionally inhibited compared to the first stimuli in a normal healthy system. For this reason, we focused on the sources and network properties related to the response to the second stimuli in our current study. PPSI is supposed to represent the proportion between the first and second responses, and thus looking at the entire time range of the paired-pulse paradigm as a whole (or lengthy timeframe of a resting state) may explain how people with tinnitus differ from those without. With the matched control data, we hope to compare this with a full-time range of the paradigm. In an unpublished study, we observed very similar resting-state EEG results to the ERP results in the source pattern.
Furthermore, we focused only on the alpha in the current study based on the literature22,71 and our own data set. A decreased alpha-band oscillation power and increased gamma-band oscillation power are reproducible findings in tinnitus patients. In addition, former MEG studies have mentioned the signatures in the oscillation power related to tinnitus relief. For instance, the cortical response to an auditory steady-state stimulus was reduced after rTMS. 72 Strong reductions in tinnitus loudness were associated with increases in alpha power in the stimulated auditory cortex, whereas a decrease in gamma, particularly in the left frontal regions, was linked to an increase in tinnitus loudness. 73 The alpha activity may represent the hyperpolarized (“down”) state of a neuronal assembly and inhibitory control of the cortical processing.74,75 It seems that alpha oscillation plays an active role in the inhibitory control of tinnitus and can be modulated using rTMS.
Since DLPFC has been recognized as integrating emotion and cognition with direct and indirect connections to the auditory temporal region, DLPFC has been a candidate for stimulation. rTMS over DLPFC alone has been tested in several studies: De Ridder et al 19 examined the efficacy of frontal treatment in alleviation of the tinnitus-related pain. They observed 1 Hz stimulation worked better than the 10 Hz stimulation, resulting in 11 respondents out of 44 patients with the mean suppression of 39.23%. Our study is partly based on their findings. A study compared the efficacy between frontal and temporal against sham stimulations and reported that only a small number of the participants responded. 76 In this study, differences in EEG power was observed, but there was no remarkable difference in terms of tinnitus questionnaire. We excluded the frontal alone condition based on the aforementioned studies (only a quarter respondence in Study 1 and little difference of THI between frontal and temporal in Study 2) and our previous study, which tested frontal alone and dual (temporal-frontal) and resulted in clear advantage of dual over frontal only stimulations. 16
Because we were interested in how (well) PPSI reflects changes owing to TMS-induced tinnitus discomfort, we did not consider including control groups in our study. We also thought that a sham treatment group would be the best control for elucidating the effect of rTMS. With an additional control group, it would have been much clearer which alterations are related to the tinnitus pathology. However, it is worth noting that our data from healthy participants without tinnitus (n = 8, aged 45~67 years, 5 females) collected for other purposes, thus not completely matched for age and sex, showed that the PPSI ratio of the patients with tinnitus before treatment was higher (75.3284 ± 25.092, n = 24) than that of the healthy subjects (64.687 ± 8.496, n = 8). The PPSI ratio of the dual-site treatment group was similar to that of the healthy subjects (64.293 ± 9.235, n = 8).
Conclusions
Our findings show a clear advantage of frontotemporal dual-site stimulation over temporal single-site or sham stimulations in reducing tinnitus complaints. We first quantitatively estimated the inhibitory effect of rTMS, measured using the PPSI. Because THI can be subjective and variable even within subjects, electrophysiological signatures are expected to be complementary for evaluating rTMS outcomes for tinnitus alleviation.
Supplemental Material
Supplemental_material – Supplemental material for Phantom Perception of Sound and the Abnormal Cortical Inhibition System: An Electroencephalography (EEG) Study
Supplemental material, Supplemental_material for Phantom Perception of Sound and the Abnormal Cortical Inhibition System: An Electroencephalography (EEG) Study by Jeong-Sug Kyong, Tae-Soo Noh, Moo Kyun Park, Seung-Ha Oh, Jun Ho Lee and Myung-Whan Suh in Annals of Otology, Rhinology & Laryngology
Footnotes
Authors’ Contribution
JK and TN contributed equally.
Declaration of Conflicting Interests
The author(s) declared no potential conflicts of interest with respect to the research, authorship, and/or publication of this article.
Funding
The author(s) disclosed receipt of the following financial support for the research, authorship, and/or publication of this article: This research was supported by the National Research Foundation (NRF) of Korea (NRF-2016R1D1A1B03933793).
Supplemental Material
Supplemental material for this article is available online.
References
Supplementary Material
Please find the following supplemental material available below.
For Open Access articles published under a Creative Commons License, all supplemental material carries the same license as the article it is associated with.
For non-Open Access articles published, all supplemental material carries a non-exclusive license, and permission requests for re-use of supplemental material or any part of supplemental material shall be sent directly to the copyright owner as specified in the copyright notice associated with the article.