
Abstract
This study deals with precise measurements of absolute line intensities, N2-, O2- and Ar- collisional broadening coefficients of N2O in the P-branch of the ν3 vibrational band near 4.5 µm. Collisional broadening coefficients of N2O-air are derived from the N2- and O2- broadening contributions by considering an ideal atmospheric composition. Studies are performed at room temperature for 10 rotational transitions over 2190–2202 cm–1 spectral range using a distributed-feedback quantum cascade laser. To retrieve spectroscopic parameters for each individual transition, measured absorption line shape is simulated within Voigt and Galatry profiles. The obtained results compare well with previous experimental data available in the literature: the discrepancies being less than 4% for most of the probed transitions. The spectroscopic data reported here are very useful for the design of sensors used to monitor the abundance of N2O in earth's atmosphere.
Keywords
Introduction
Nitrous oxide (N2O), a potent greenhouse gas, is an important trace atmospheric constituent. Its tropospheric abundance has increased from approximately 273 ppb in 1750 to 325 ppb in 2012. 1 In higher altitudes, this molecule plays a crucial role in the chemistry of the troposphere and stratosphere involving ultraviolet solar photon absorption. 2 Soil and oceans are the main natural sources of N2O production.3–5 This molecule is also produced by the use of nitrogen fertilizers,6,7 combustion processes and fossil fuels.8–12 Since N2O is the precursor for NOx production that leads to ozone destruction in the higher atmosphere,13,14 detection and concentration distribution measurements of N2O have great environmental significance. For atmospheric sensing purposes, vertical profiles of nitrous oxide have been monitored using a ground-based mm-wave spectrometer.15–17 In the mid-infrared (IR) spectral domain, the N2O molecule has several strong absorption bands which have been used to measure its concentration and altitude distribution in Earth's atmosphere.18–21 Remote sensing of the Earth’s atmosphere, however, requires accurate knowledge of the spectroscopic parameters of N2O. For precise atmospheric monitoring, accurately measured and assigned line positions, line intensities and pressure broadening coefficients are required.
Nitrous oxide has its strongest vibrational bands in the IR spectral region.22,23 The ν3 band appears over 2160–2260 cm–1 range (i.e., near 4.5 µm) and has its origin near 2224 cm–1. The ν1 band is relatively strong and appears near 1285 cm–1 (i.e., 7.8 µm). The ν2 band appears at long wavelengths near 17 µm (i.e., 589 cm–1).24–26 Both the 2224 cm–1(ν1) and 1285 cm–1(ν3) vibrational bands show doublet features corresponding to the P- and R-branches and their rotational structures can be resolved.
Over the years, the study of the ν3 band of N2O with IR spectroscopy, achieving higher and higher resolution, led to the precise knowledge of spectroscopic parameters, such as pressure-induced line shift, line intensities and collisional broadening coefficients. Using grating spectroscopy, Lowder 27 reported room-temperature measurements of line intensities belonging to the ν3 fundamental and a combination band. He also reported half-width measurements of N2-broadened lines in the R-branch (R4 to R50 lines) of the ν3 band. Boissy et al. 28 combined calculations and measurements to determine line intensities at 300 K for 30 vibration rotation lines in the P-branch of ν3 band. Lacome et al. 29 obtained Fourier transform infrared (FT-IR) measurements in the 4–8 µm spectral domain to measure self-, N2- and O2- broadening of N2O over the temperatures range of 220–296 K. Moreover, the air-broadened values of N2O were derived from the combination of N2- and O2- broadened parameters. Henry et al. 30 obtained N2- and O2- broadening parameters of N2O for transitions in the R-branch of ν3 band at 195 and 297 K using a vacuum grating spectrometer. Using FT-IR spectroscopy, Toth 31 measured self-broadened line-width and frequency-shift parameters at room temperature for 136 lines of N2O in the ν3 band over the spectral region of 1800–2630 cm–1 and found that the coefficients have a weak J-dependence. Margottin-Maclouet et al. 32 studied N2O pressure-induced line shift in the ν3 band for P- and R-branches between 1800 and 3100 cm–1 perturbed by N2, O2, He, Ar and Xe using FT-IR spectroscopy. Accurate pressure-shift with N2 and air-broadening coefficients over 1800 – 4800 cm–1 were measured at room temperature by Toth 33 for more than 500 vibration–rotation lines by means of a 0.011 cm–1 spectral resolution FT-IR spectrometer. Moreover, the J-dependence of spectroscopic parameters was also parameterized using polynomial expressions. 33 Nemtchinov et al. 34 measured N2O absolute line intensities and broadening coefficients due to N2, O2 and air perturbers for 41 transitions belonging to the ν3 band in the R-branch between 2224 and 2253 cm−1 at temperature values of 216, 250 and 296 K using FT-IR spectroscopy. They expressed the J-dependence using empirical fitting to extrapolate the measured broadening data to other transitions. Fukabori et al. 35 obtained line intensities and N2- and O2- broadening parameters in the ν3 band as well as in the ν1 + 2ν2 and 2ν1 combination bands of N2O at 296 K using an FT-IR spectrometer with a 0.01 cm–1 resolution. More recently, Loos et al. 36 reported measurements of air-broadening, pressure-shift, speed-dependence and line-mixing parameters for the ν3 band of N2O using FT-IR spectroscopy.
Until recently, however, few measurements have been performed using narrow line-width laser absorption spectroscopy to study the ν3 band of N2O near 4.5 µm. Margottin-Maclouet et al. 32 used a tunable diode laser spectrometer to measure N2O pressure-shifts with N2, He and Ar perturbers for several transitions near 2200 cm–1. To our knowledge, broadening parameters of N2O-Ar have not been studied in the 2190–2202 cm–1 region. The current study deals with precise measurements of absolute line intensities, N2-, O2- and Ar- collisional broadening coefficients in the ν3 band of N2O using a quantum cascade laser (QCL) system. Experiments are performed at room temperature for 10 rotational transitions (P-branch) accessible to our laser system over 2190–2202 cm–1 spectral range. To retrieve spectroscopic parameters for each individual transition, measured absorption line shapes were fitted using Voigt and Galatry profiles. The second section describes the experimental apparatus. In the third section, we present Voigt and Galatry profiles to retrieve N2O spectroscopic parameters. Line intensity and broadening coefficient results are presented in the fourth section and compared with literature data. Since our laser system covers only 10 transitions in the ν3 band of N2O, we report a parameterization of the measured broadening coefficients using empirical expressions to extend the study to other transitions in the P-branch.
Experimental
The experimental setup is schematically illustrated in Figure 1. It consists of an IR laser source producing few milliwatt (mW) power near 2185 cm–1, a temperature control unit (TCU 200), a current source, a function generator, a stainless-steel absorption cell wedged with KBr windows, an IR sensitive detector and an oscilloscope system. The IR source is a distributed-feedback (DFB) QCL procured from a commercial supplier (Alpes Lasers ). Heat dissipation from the laser was enhanced by mounting it on an aluminum plate with recirculating water. Laser emission wavelength can be varied by changing the laser temperature or injection current. Emission frequency was measured using a wavemeter that has an absolute accuracy of ±2 × 10⁻³ nm and a resolution of ±0.001 nm (Bristol Instruments 721B ).
37
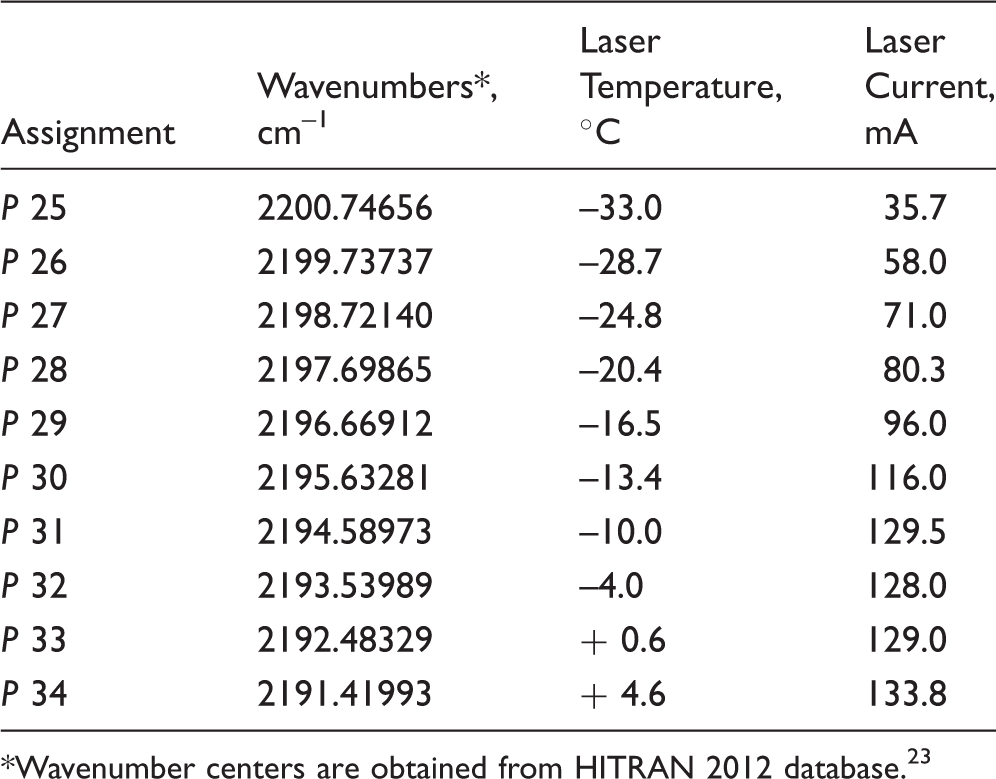
To perform wavelength modulation, a waveform generator (Stanford Research Systems DS-345 ) supplied a saw-tooth ramp of 80 Hz frequency and 0.5 Vpk–pk to the laser head. The operating conditions (laser temperature and current) used to access of N2O transitions with our laser system are listed in Table 1. The line-center positions are obtained from HITRAN 2012 database.
23
Experimental setup. Transitions of N2O molecule accessible to the laser system used in the present work. The operation conditions of the laser to reach the desired transition in the P-branch are shown. Wavenumber centers are obtained from HITRAN 2012 database.
23
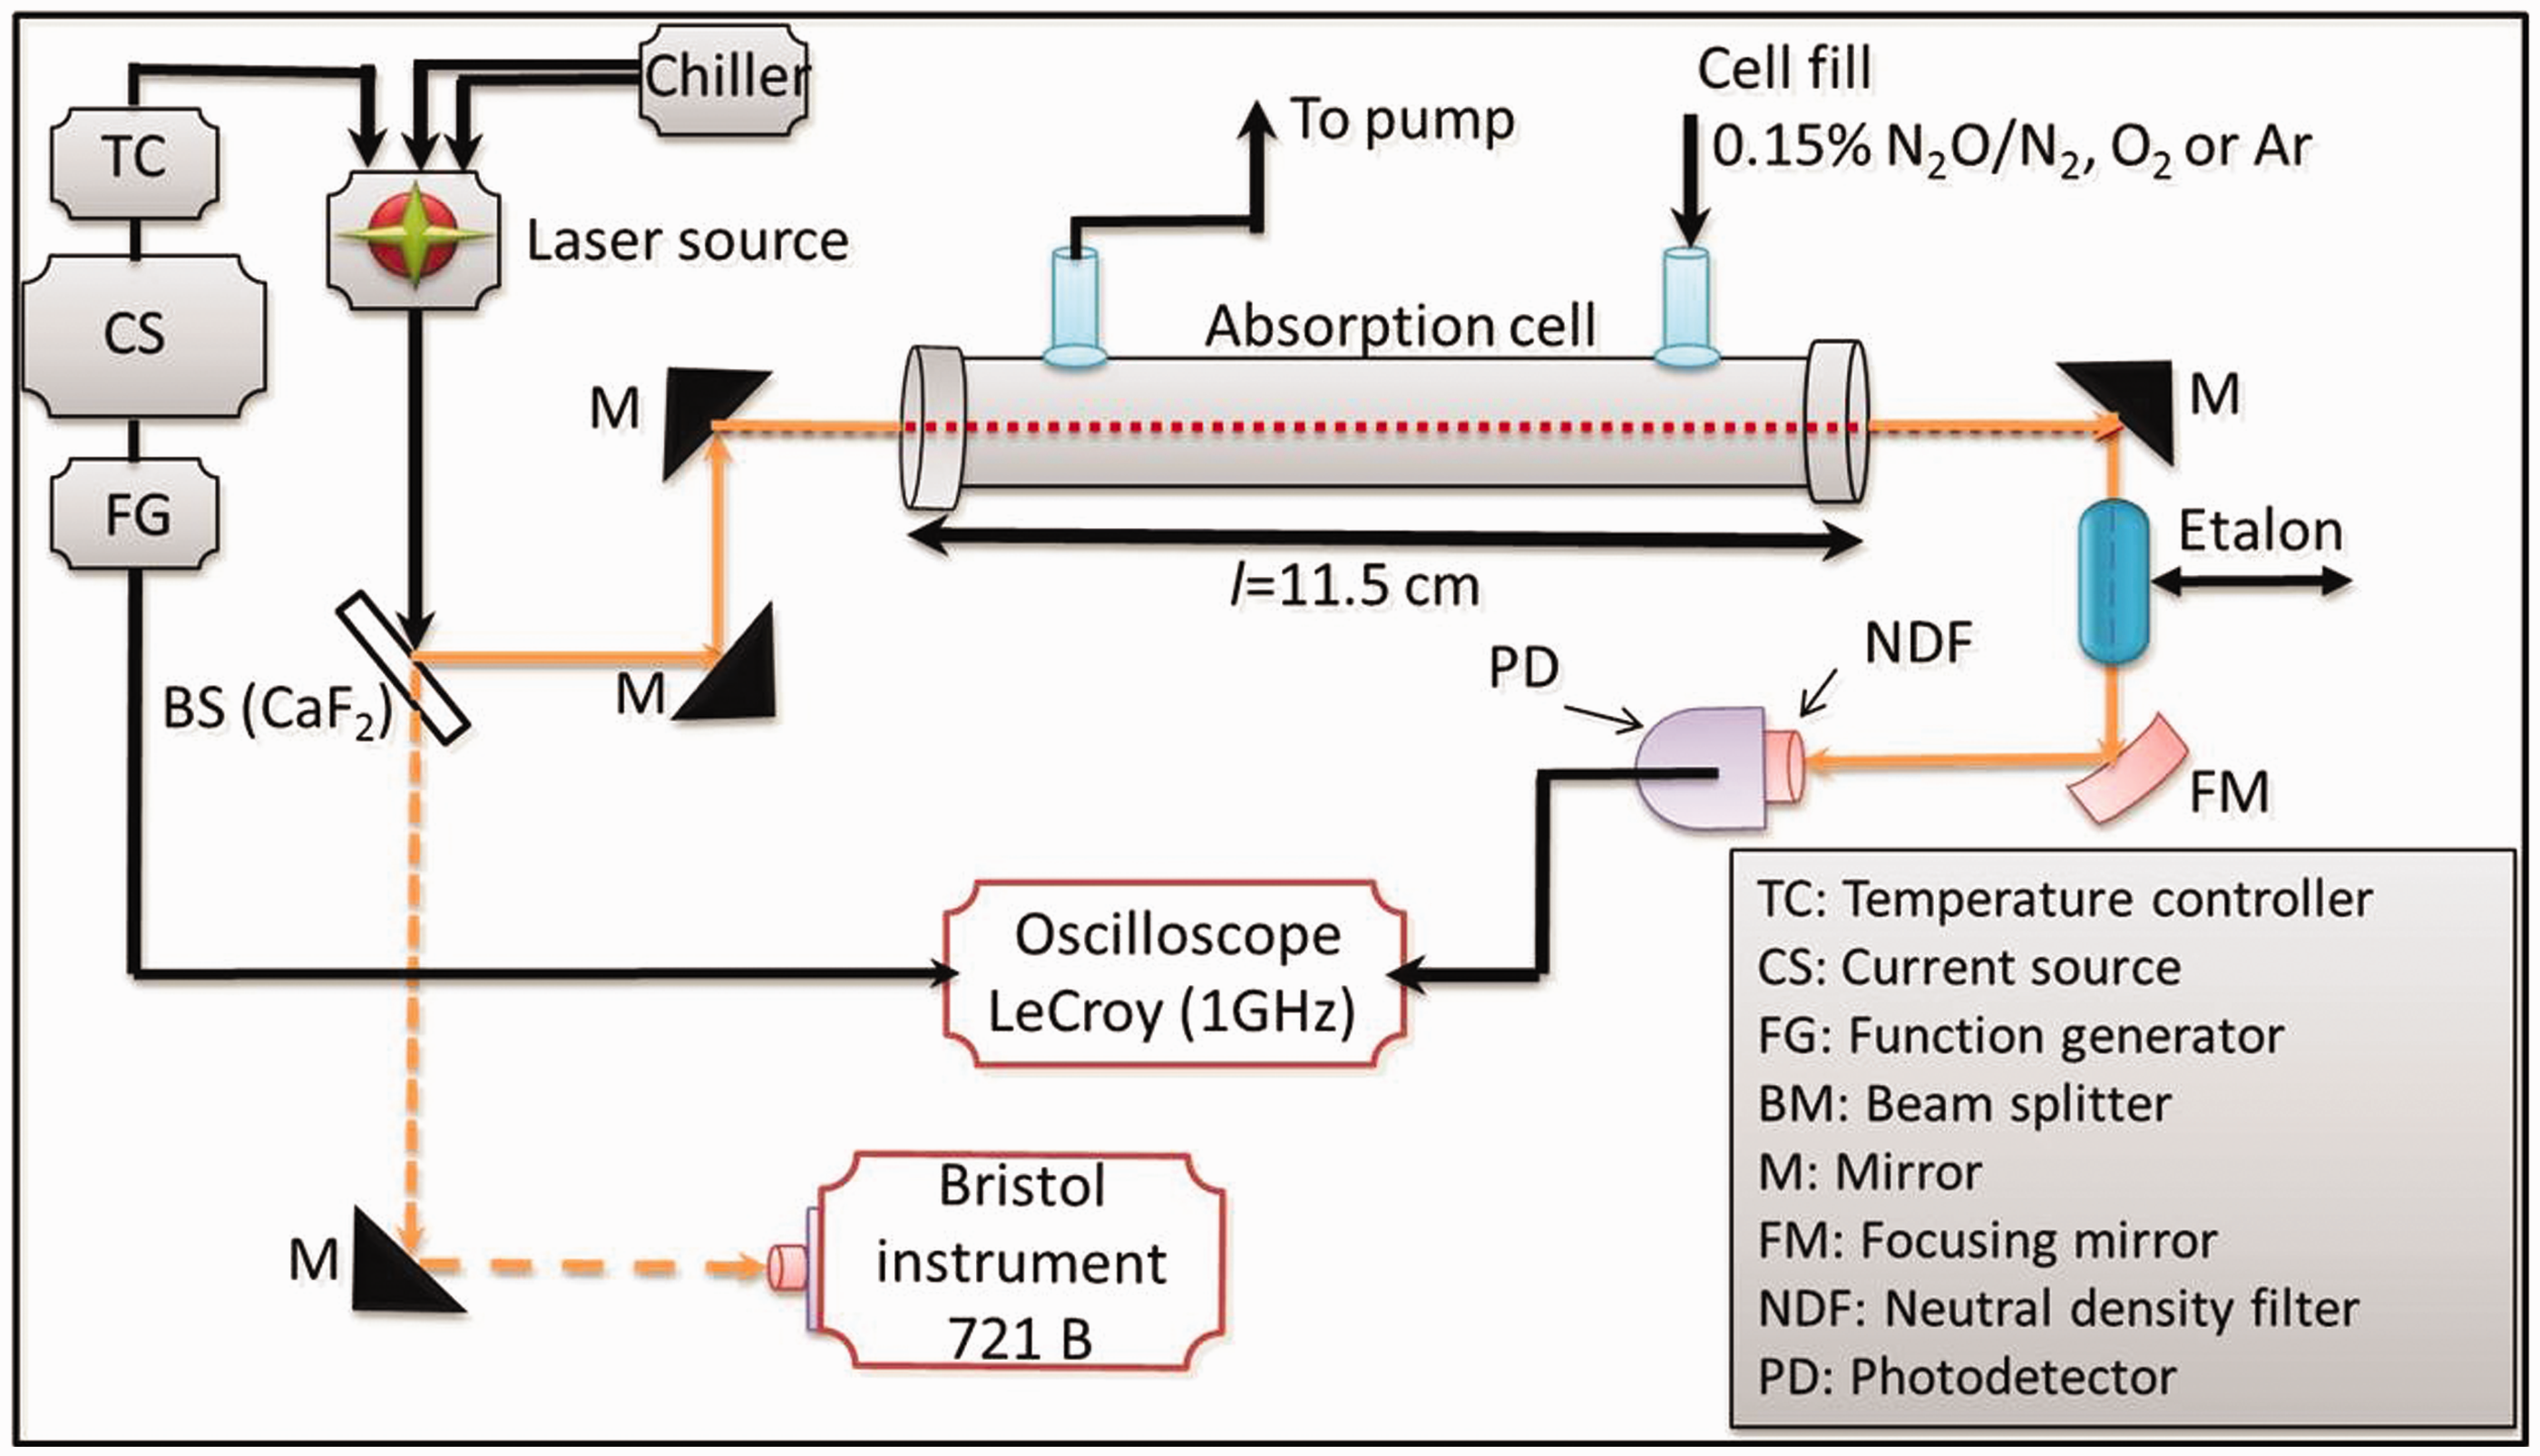
The IR light is split into two beams by the use of a thin beam splitter (Figure 1). One beam passes through the optical cell and the other beam is directed to a wavemeter to measure the laser emission frequency. The transmitted laser light is focused onto a photodetector using a parabolic mirror with a focal length of 4.5 cm. The photodetector (Vigo System PVMI–3TE–10.6) is thermo-electrically cooled and has an active area of 4 mm2. The background signal is recorded under the same conditions but without a sample. The output from the photodetector is sent to a 1 GHz oscilloscope (Lecroy ). The stainless-steel absorption cell can be operated over a range of pressures and temperatures. Research grade (99.999 %) N2O, O2, N2 and Ar were supplied by Abdullah Hashim Gases . Primary impurities include nitrogen, ethylene, ethane and carbon dioxide. Gas pressure in the absorption cell is monitored with a baratron capacitance manometer (MKS Instruments; full-scale range of 100 Torr). To analyze measured line shapes, we employed the experimental procedure described previously.38–40 To determine line strengths and pressure broadening coefficients in the spectral range of interest, absorption was measured over a wide range of gas pressures and for fixed values of path length (11.5 cm), temperature (297 K) and mixture composition (0.15% N2O/perturber gas). A typical scan is shown in Figure 2a for the P(25) transition belonging to the ν3 band (0001←0000) of N2O. Gas pressures in the range of 10–100 Torr have been used in the present work. A Germanium etalon with a free spectral range (FSR) of 0.01634 cm–1 was used for relative frequency calibration (Figure 2b). Line intensity values were determined from integrated absorbance values which linearly depend on the product between gas pressure and optical path length. Broadening coefficients in different perturbed gases were measured from the half-width at half-maximum of the absorbance of each transition as a function of the gas pressure.
(a) An example transmission signal for P(25) transition at 2200.74656 cm–1; mixture: 0.15%N2O/O2; T = 297 K. (b) Ring interferometer signal obtained from the solid etalon used for frequency calibration.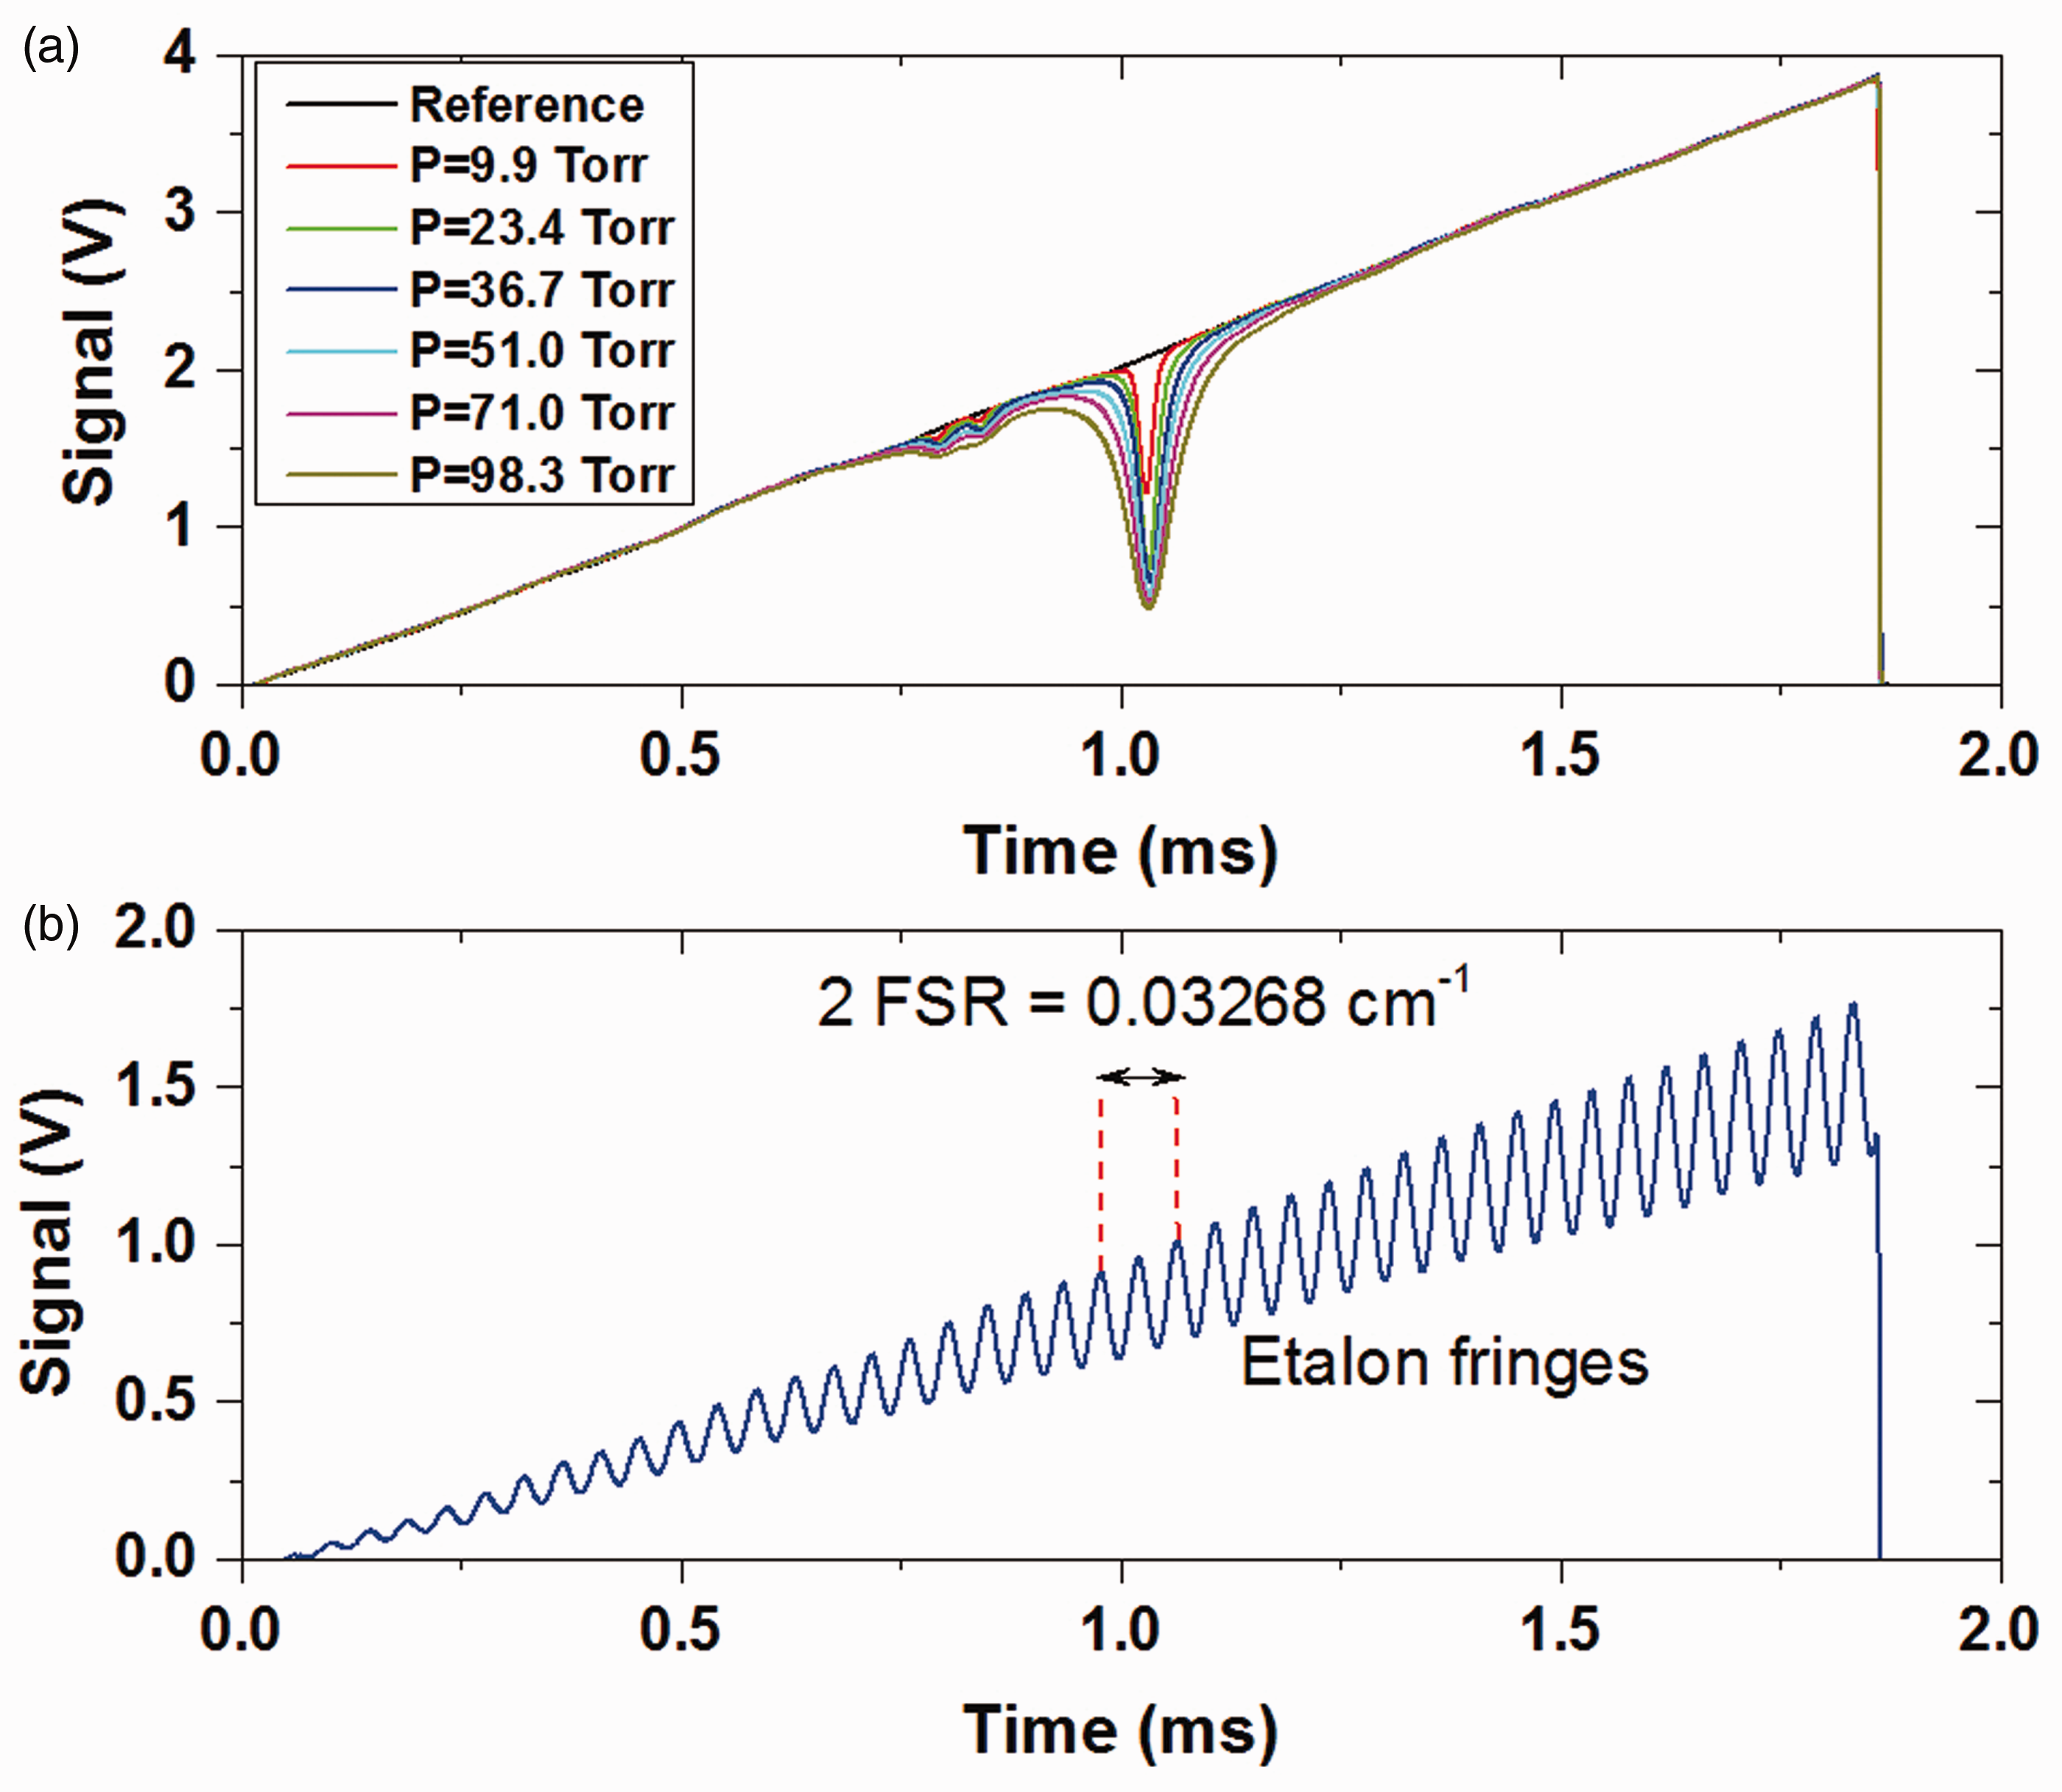
Data Analysis
For direct absorption spectroscopy, transmitted intensity, It, of a monochromatic laser source through a gaseous sample is given by Beer-Lambert law


Generally, the absorption line shape is modeled by a Voigt profile which is a convolution of a Gaussian and Lorentzian functions and is given as

The frequency 
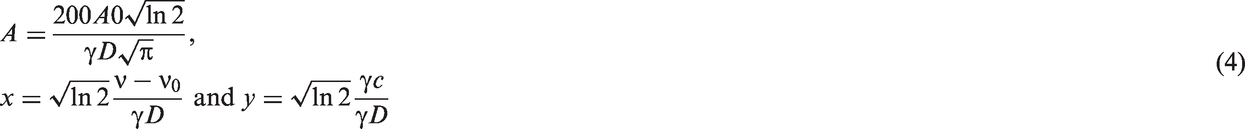
The Voigt profile can present systematic differences with the measured line shape and can thus lead to inaccuracy in the deduced line intensities and collisional broadening data. When Doppler broadening is dominant, collisional narrowing of absorption line shapes can be significant.42,43 When collisional narrowing/Dicke effect is considered, as in the case of Rautian and Galatry profiles, the fit of the observed line profiles is usually very good and the collisional broadening coefficients are quite independent of pressure. To incorporate the Dicke effect, the Galatry line shape, known as a soft-collision model, was incorporated in the present work to obtain spectroscopic parameters of N2O. The Galatry line shape function is given by the following expression

It should be noted that when the normalized parameter z = 0, the Galatry profile is reduced to the Voigt profile. To analyze experimental line shape data using Galatry profile, the retrieval program adjusts collisional width, collisional narrowing, line center and integrated area. During the fitting process, the program was initially provided with frequency position, line intensity and collisional width from the HITRAN 2012 database 23 as initial guess values.
Using Voigt or Galatry profiles, line intensities (S) and collisional broadening coefficients (

Results and discussion
Voigt and Galatry line profiles are used to determine spectroscopic parameters, line intensity (S) and broadening coefficient (γi), of N2O at room temperature. Figure 3a shows a representative case where the two profiles have been used to fit the measured P(25) transition in the ν3 band of N2O at 297 K. The two profiles agree very well the experimental line shape. Figure 3b shows the residuals which represent percentage difference between measured and calculated values, (M − C) × 100. We can see the typical W-shape signature Voigt residual and the improvement achieved by considering the Galatry profile. This small difference is due to the Dicke narrowing effect being incorporated in the Galatry model. Such collisional narrowing effects can manifest in the peak absorption when the Voigt profile is used. At the pressure range used here (10–100 Torr), Doppler broadening is relatively small compared to collisional broadening. Therefore, the Dicke effect is quite small for the present study. The collisional narrowing parameter, β, for the studied transitions is too small to be accurately determined from our measurements. For the conditions of this work, the collisional narrowing effects can thus be neglected. Another physical effect that can be important for species with closely spaced rotational lines is “line mixing”. However, we believe that at the low pressures of current study, line mixing does not play any significant role.
(a) An example of the measured absorption line shape for P(25) transition of N2O at 2200.74656 cm–1. Measurements are performed with 0.15% N2O/O2 at a total pressure of 51 Torr and at a temperature of 297 K. Measured data are simulated with Voigt and Galatry profiles. (b) The residual obtained from the two least-square fittings.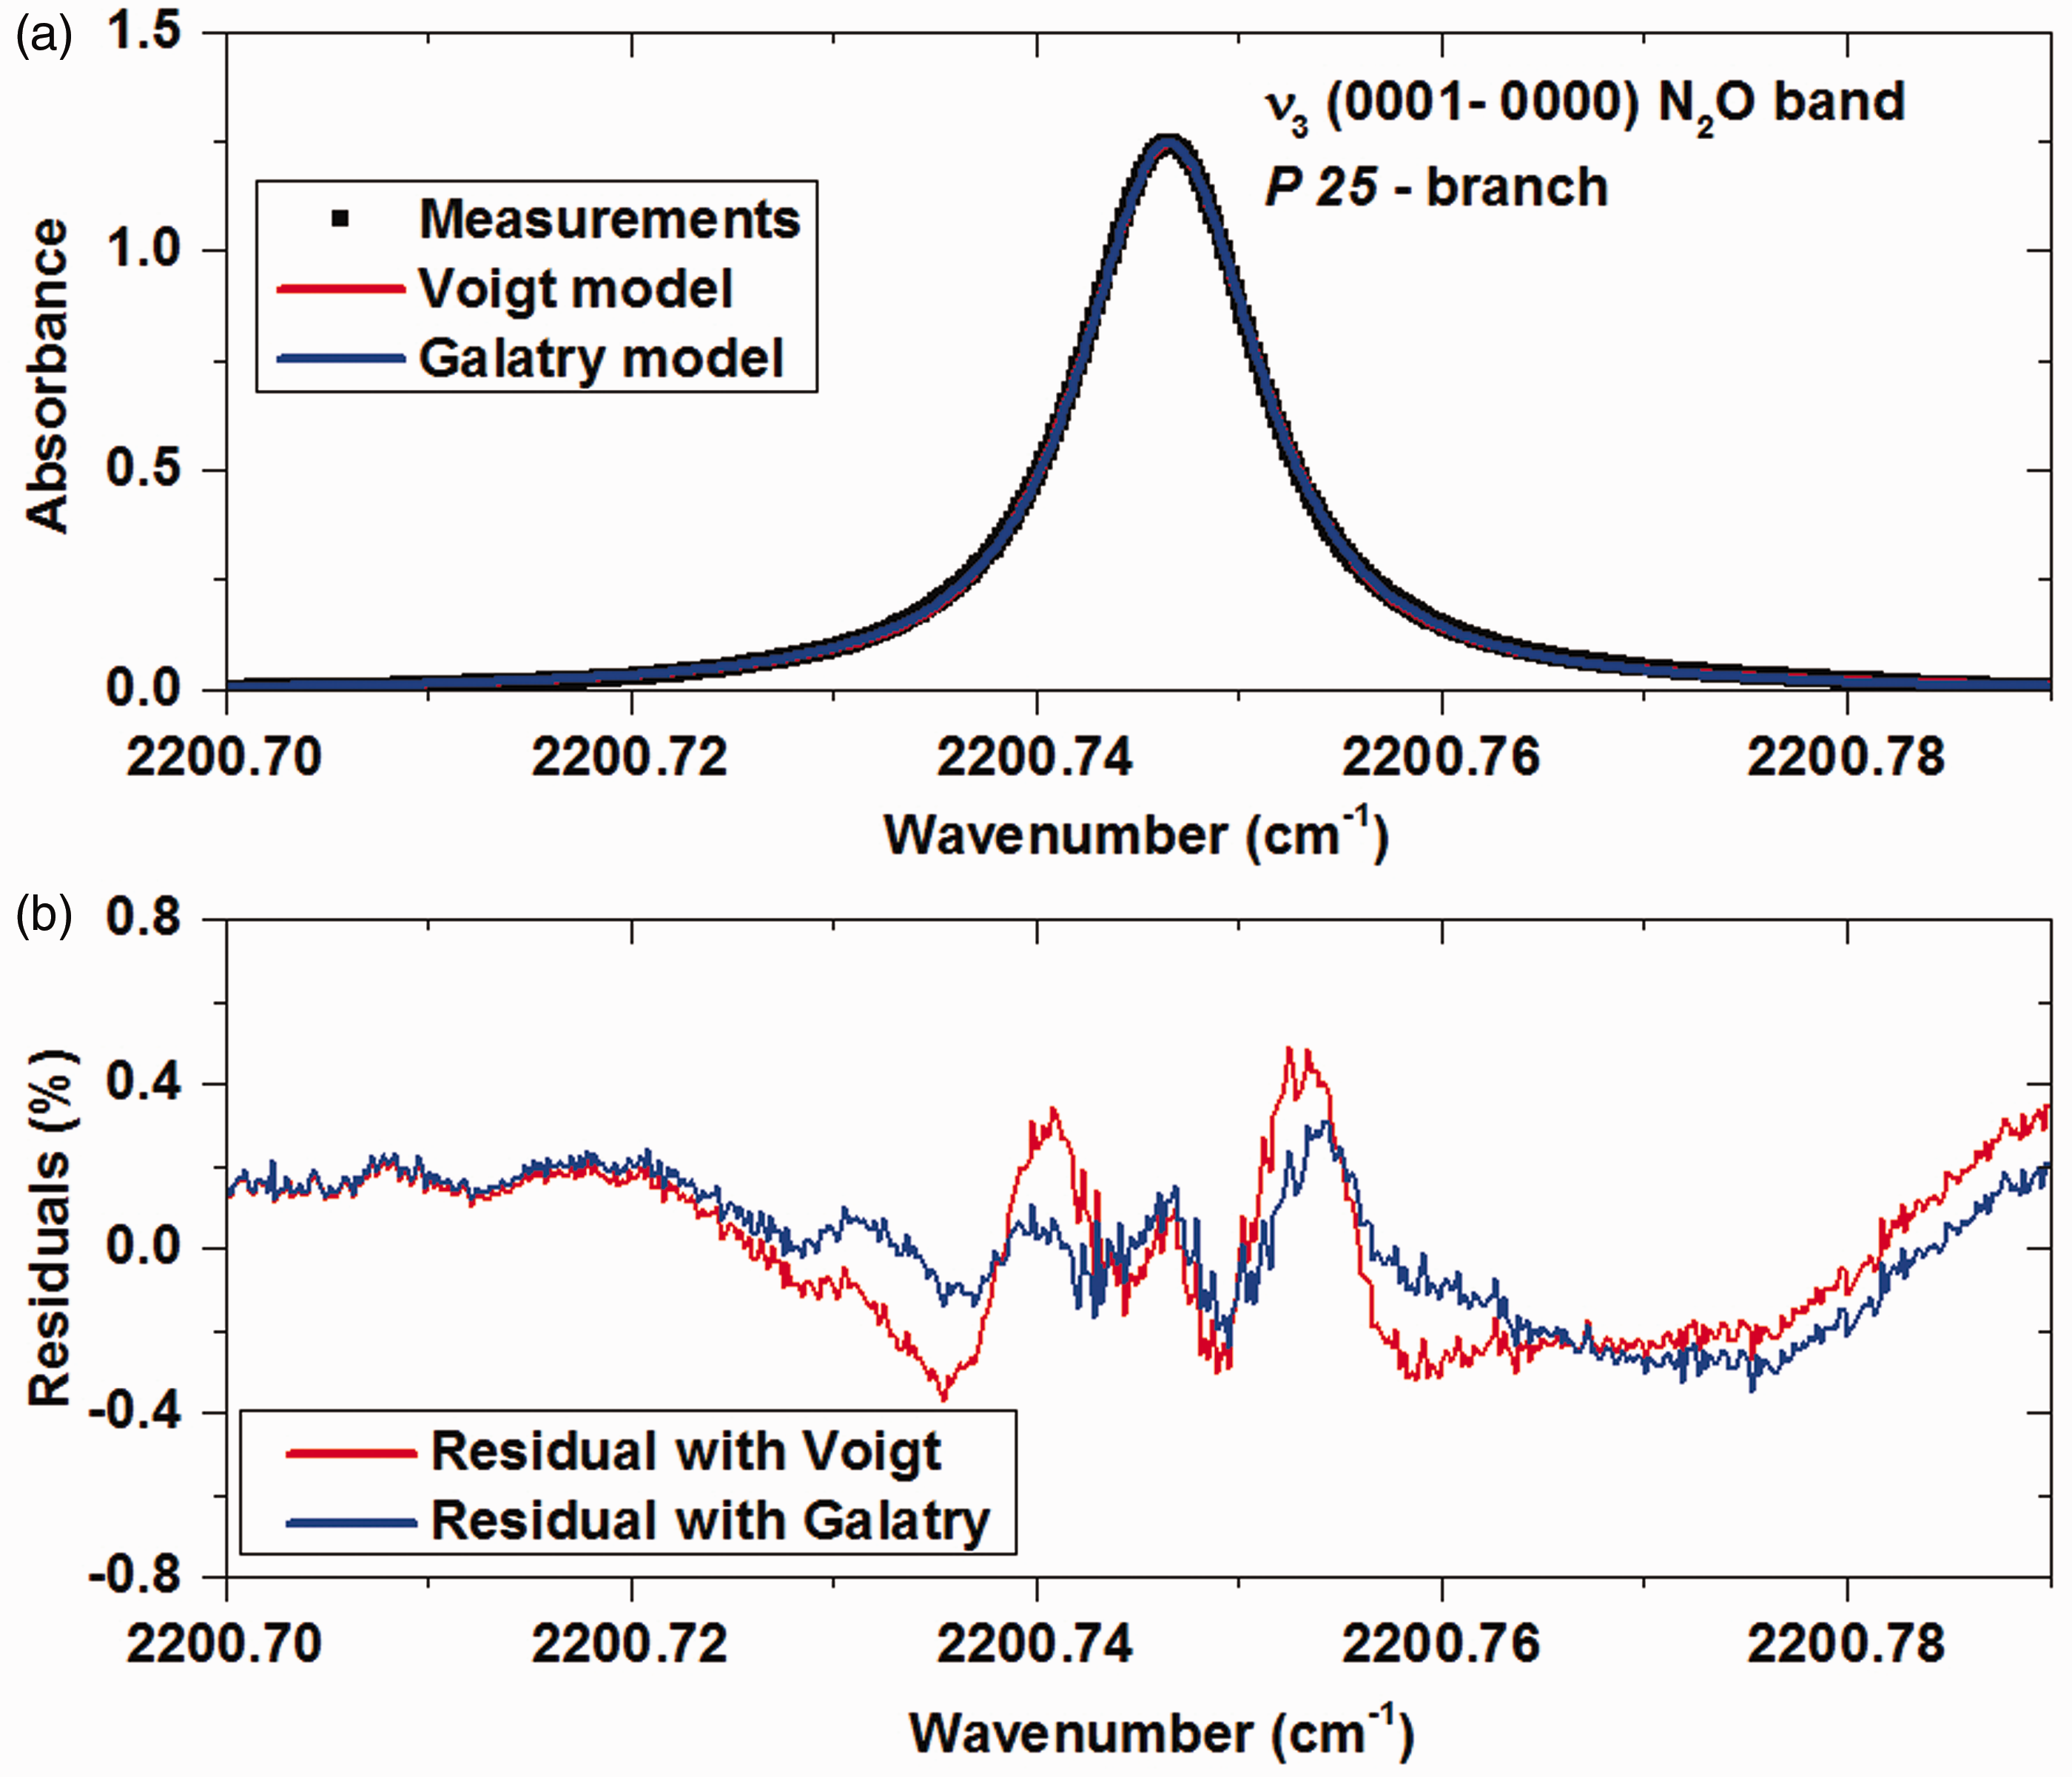
Absolute Line Intensities
Absolute line intensities for the ten transitions accessible to our laser system were determined. For precise measurements with high accuracy, each transition was measured at six pressures. A representative plot of the integrated absorbance versus the product of N2O partial pressure and optical path length is shown in Figure 4. Integrated absorbance values obtained from the Voigt and Galatry profiles agree quite well. The line intensity (S) obtained from the slope of the linear line (Eq. 8) for a given data set routinely yielded a relative standard deviation of < 2% and a high linear correlation of 0.998 with zero-intercept.
(a) Integrated absorbance versus the product of N2O partial pressure and optical path length (PLXN2O) for the P(25) transition; mixture: 0.15% N2O/O2; T = 297 K. Integrated absorbance values are derived from the Voigt and Galatry fits. The lines represent linear fits for absolute line intensity determination. (b) Percentage difference between the integrated absorbance determined from Galatry and Voigt profiles.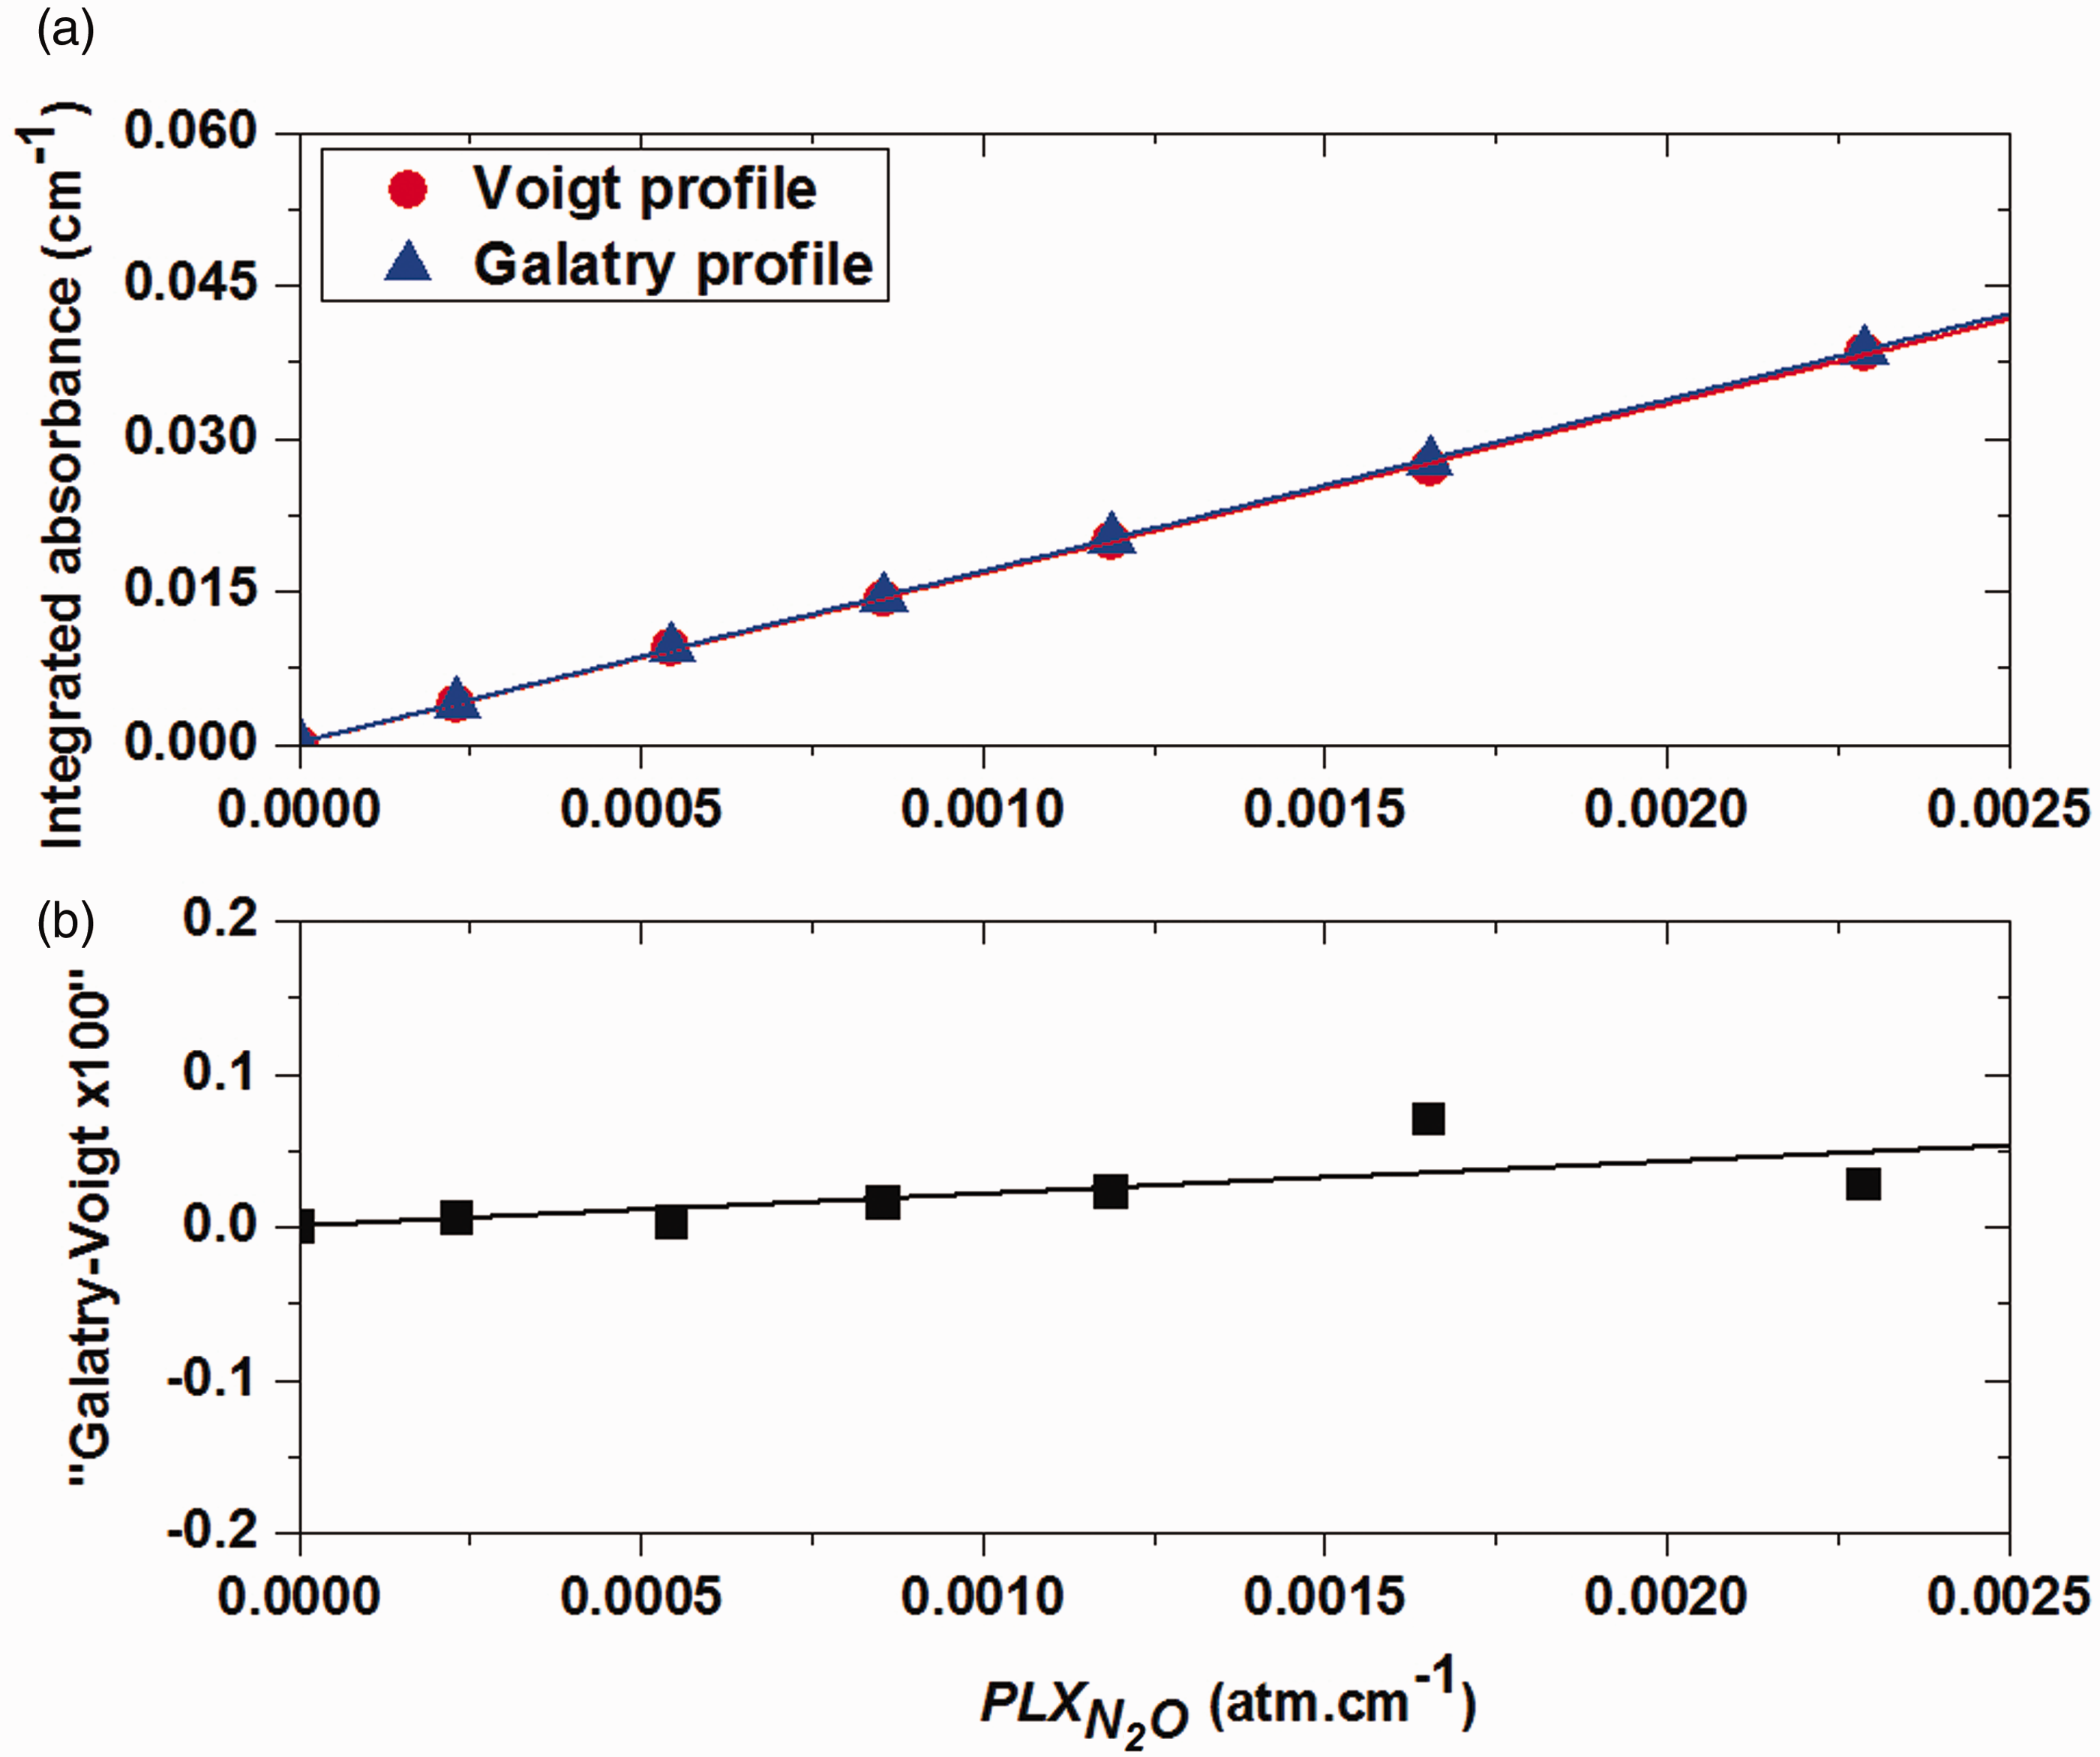
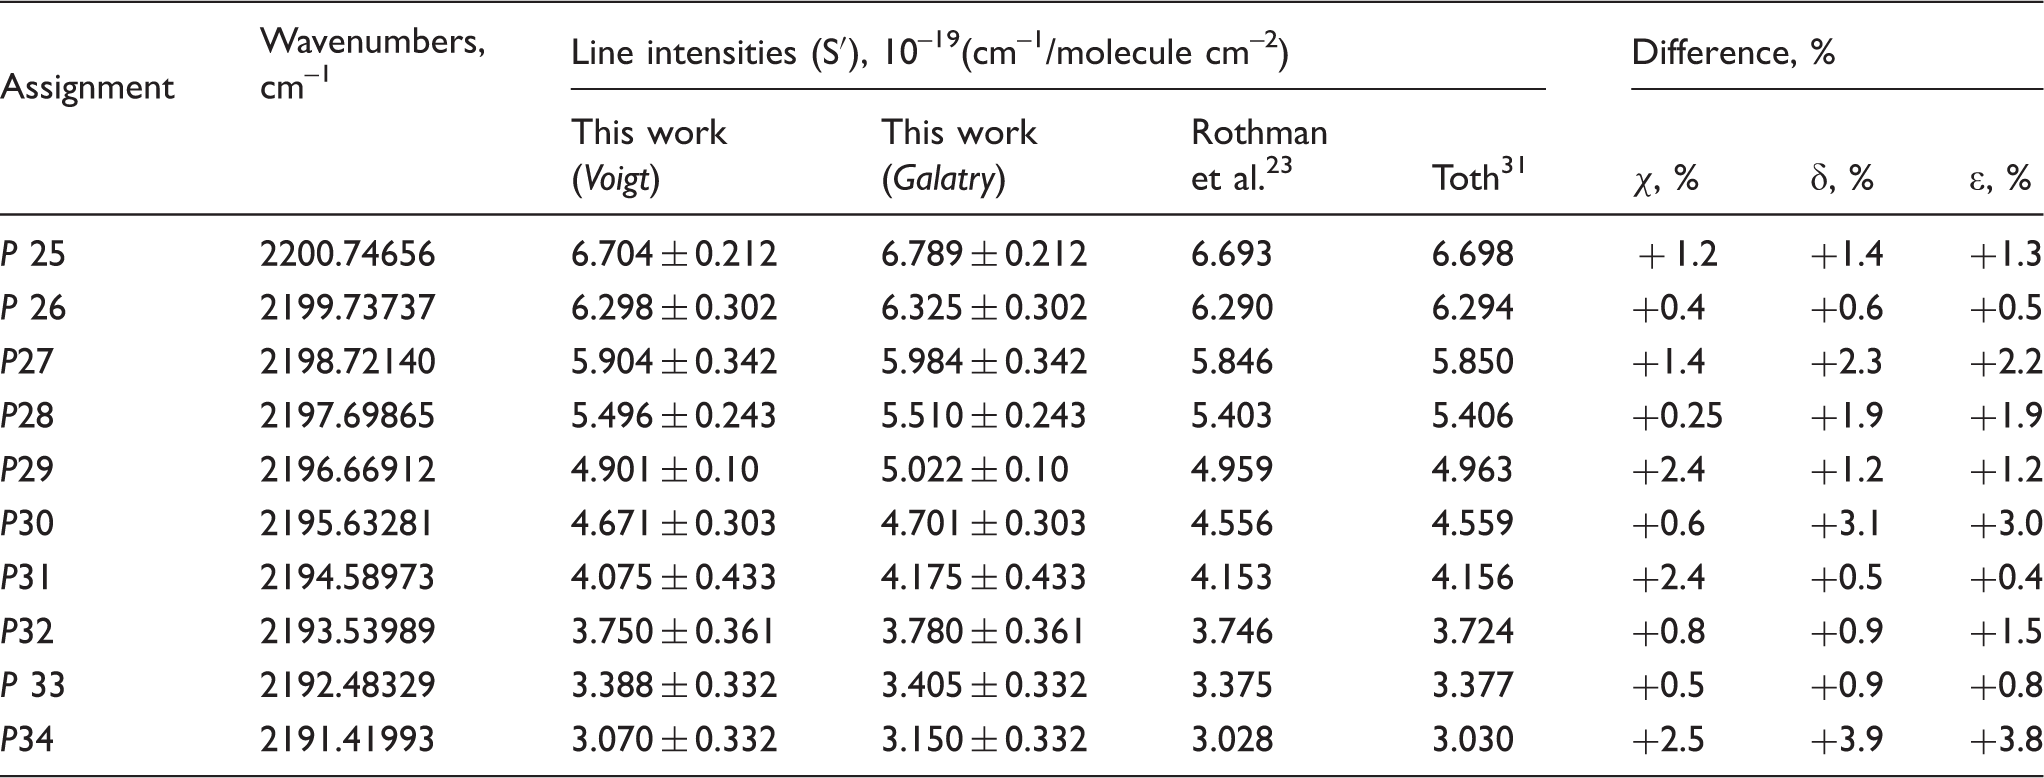
Measured line intensities for the ten transitions of N2O belonging to the P-branch of the ν3 band near 4.5 µm. Comparison is made with HITRAN database 23 and Toth. 31 The last three columns present the percentage differences: χ between Galatry and Voigt; δ between Galatry and Rothman et al. 23 and ɛ between Galatry and Toth. 31
Foreign Gas Collisional Parameters
N2- and O2-broadening coefficients
To obtain foreign gas broadening coefficients of N2O, the line shape is recorded at a range of pressures of N2, O2 and Ar for a fixed N2O mole fraction of 0.15%. The broadening effect may then be derived from a plot of HWHM versus partial pressure of N2O according to Eq. 9. Absorption spectra of N2O were measured at a series of pressures between 10 and 100 Torr to infer collisional–broadening coefficients of N2O with high precision. Figure 5 presents an example of the integrated absorbance versus total gas pressure for the P(25) line in the ν3 band of N2O. Measured half-width is clearly a linear function of the pressure. Excellent correlation coefficients of > 0.989 are obtained from the linear fits. Half-widths and linear fits obtained with Voigt and Galatry models are quite similar. To determine foreign gas broadening parameters, the small contribution of self-broadening coefficients is included (see Eq. 9.), where self-broadening coefficients are taken from HITRAN database.
23
Tables 3 and 4 list the results obtained for N2- and O2- broadening coefficients at 297 K for P(25)–P(34) transitions in the ν3 band of N2O. As in the case of the line intensity, we did not observe significant difference between the collisional broadening coefficients obtained with the Voigt and Galatry models. The resulting values are quite same and suggest negligible Dicke narrowing effect under our experimental conditions. However, the Voigt profile does result in systematically smaller values than those determined using the Galatry model.
(a) Plot of the collisional half-widths versus N2O total pressure (P) for the P(25) transition with 0.15% N2O/O2 at 297 K. Half-widths are derived from the Voigt and Galatry profiles. The slopes of the best-fit lines, passing through zero, represent collisional broadening coefficients γ0. The γ0self data of N2O are taken from HITRAN 2012 database. (b) The percentage difference between collisional half-widths determined from Galatry and Voigt profiles. Collisional-broadening coefficients of N2O with N2 ( Lowder
27
: Broadening parameters belonging to the ν3 band of N2O at 297 K were taken from the smoothed values in R-branch. Measurements are performed using a grating monochromatic. Lacome et al.
29
: Broadening parameters belonging to the ν3 band of N2O at 295 K were taken from the R-branch lines. Measurements are performed using FT-IR spectroscopy at 5.4 × 10⁻³ cm–1 resolution. Henry et al.
30
: Broadening parameters were taken from the smoothed values of R- branch lines in the ν3 band of N2O at 297 K. Measurements are performed using vacuum grating spectrometer. Toth
33
: Broadening parameters were taken from the measured values of R- branch lines in the ν3 band of N2O at 296 K. Measurements are performed using FT-IR spectroscopy at 0.011 cm–1 resolution. Nemtchinov et al.
34
: Broadening parameters belonging to the ν3 band of N2O at 296 K were measured between 2224 and 2253 cm–1. Measurements are performed using FT-IR spectroscopy at 0.002 cm–1 resolution. Fukabori et al.
35
: Broadening parameters belonging to the ν3 band of N2O at 299 K were taken from the P- branch. Measurements are performed using FT-IR spectroscopy at 0.01 cm–1 resolution. Collisional-broadening coefficients of N2O with O2 (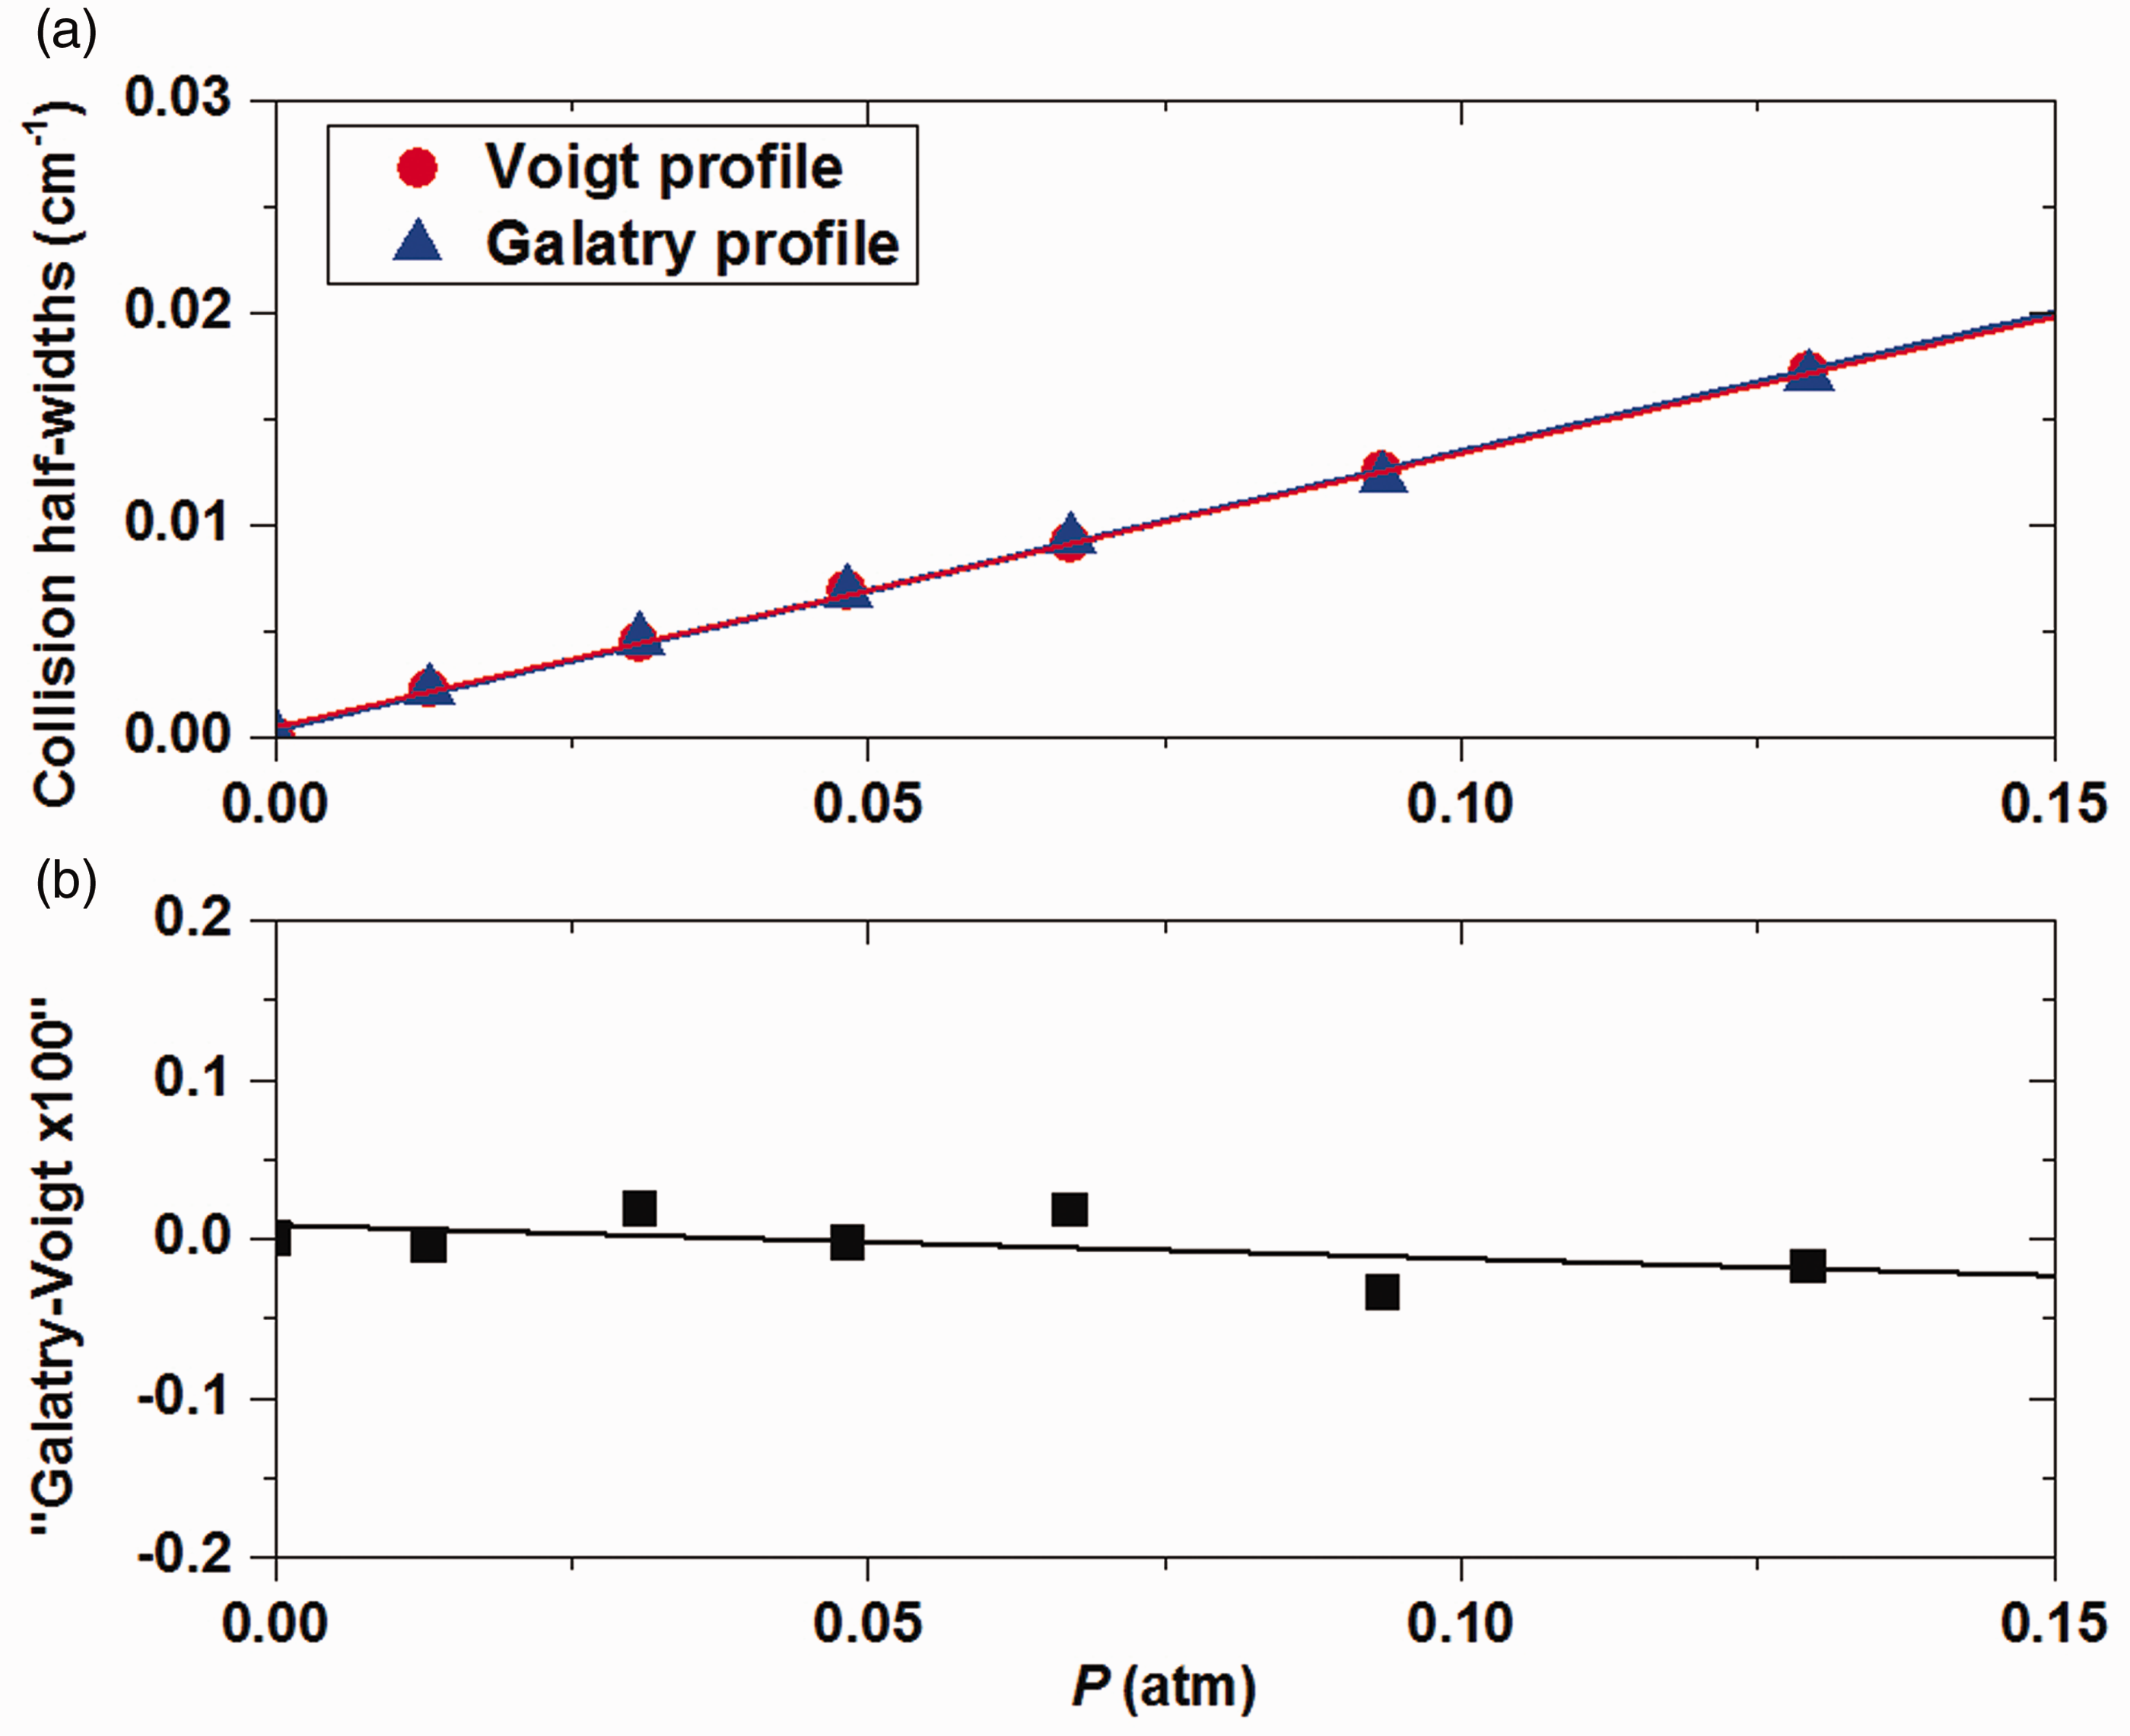
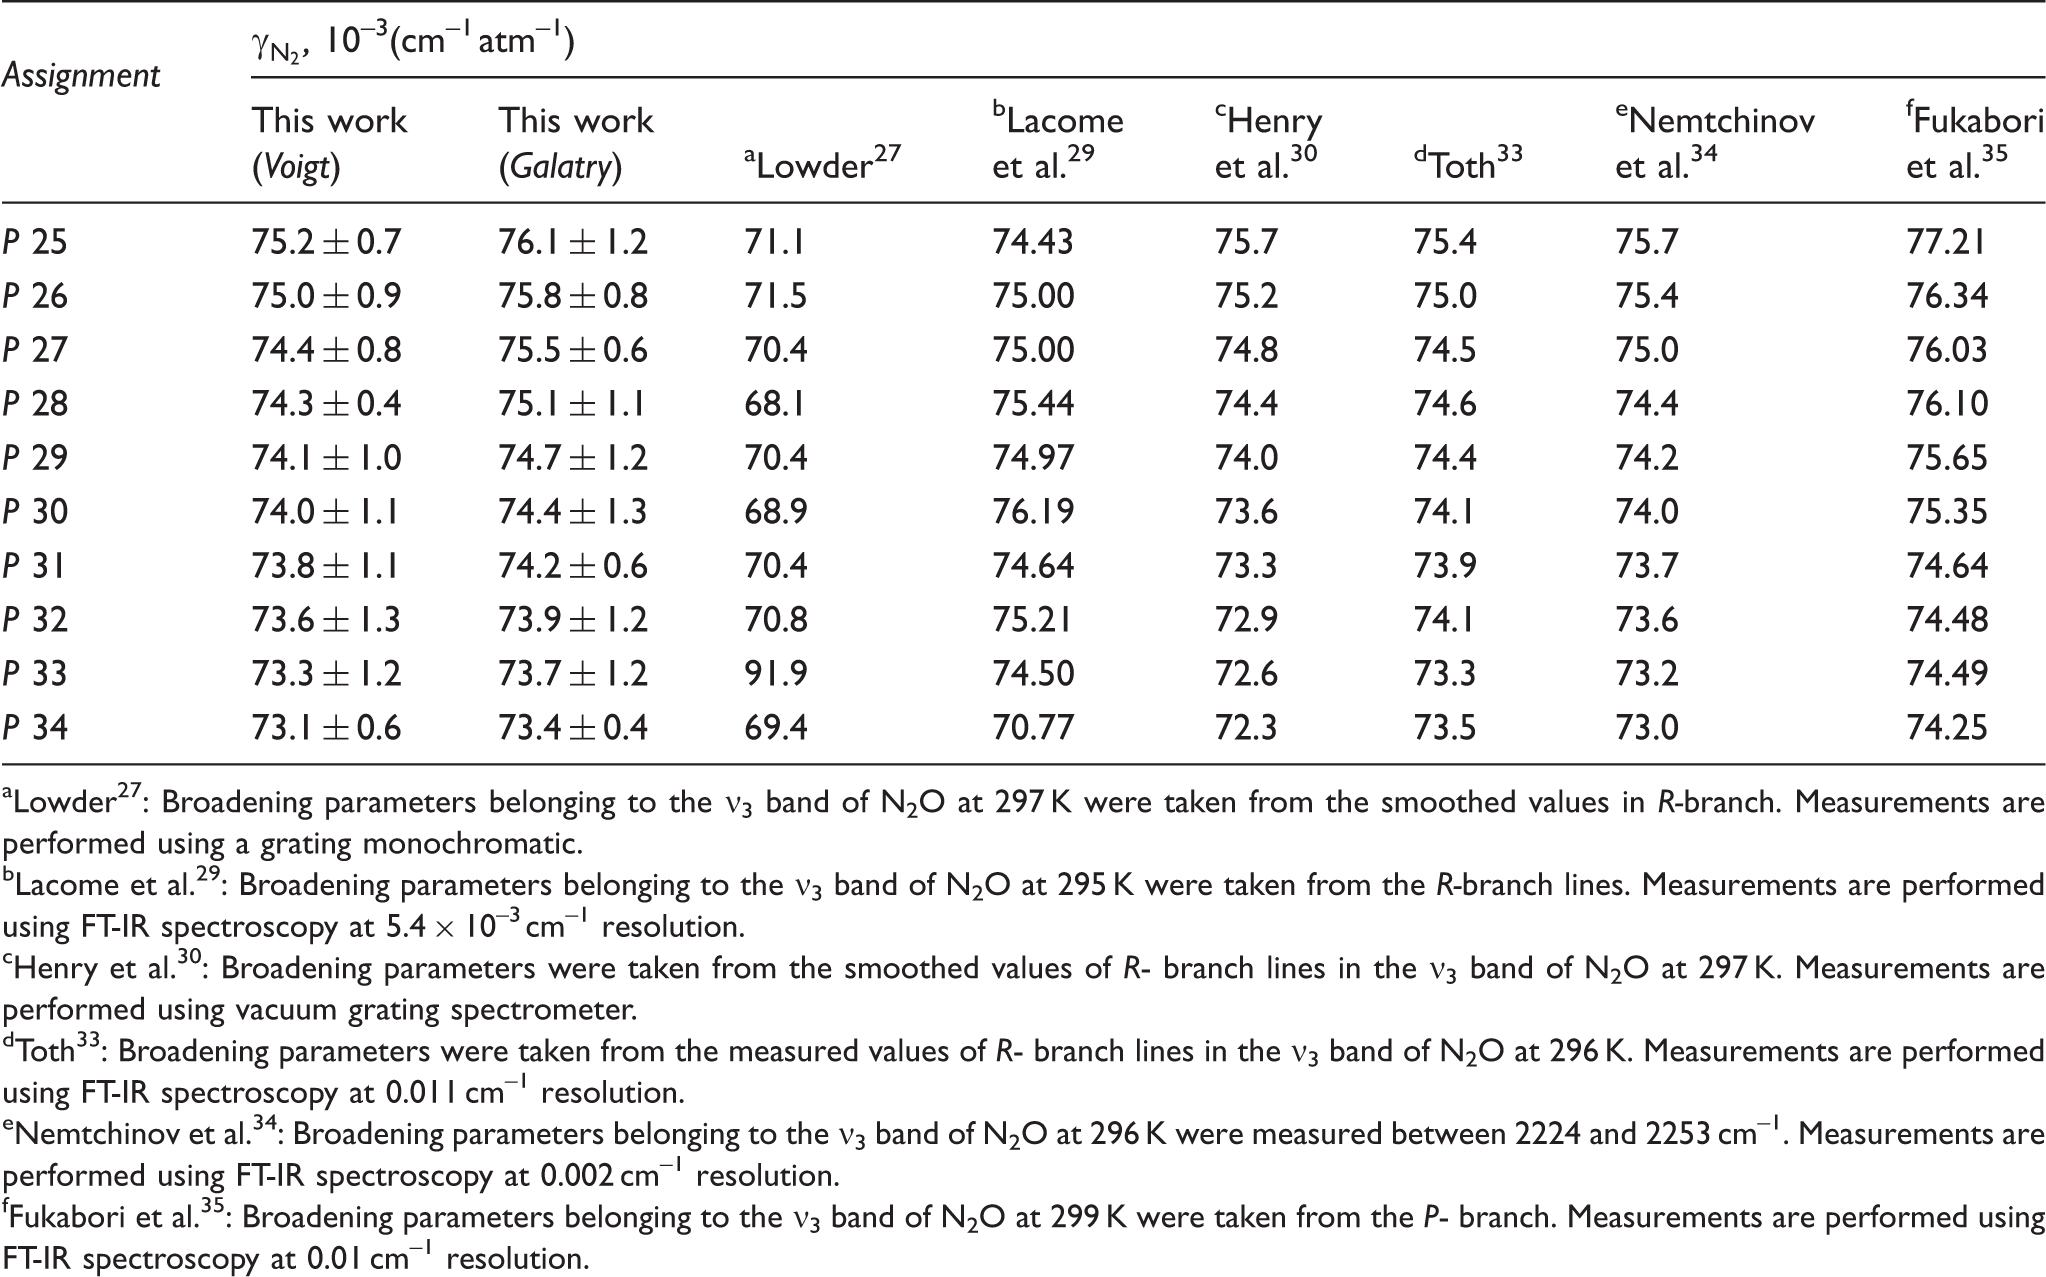
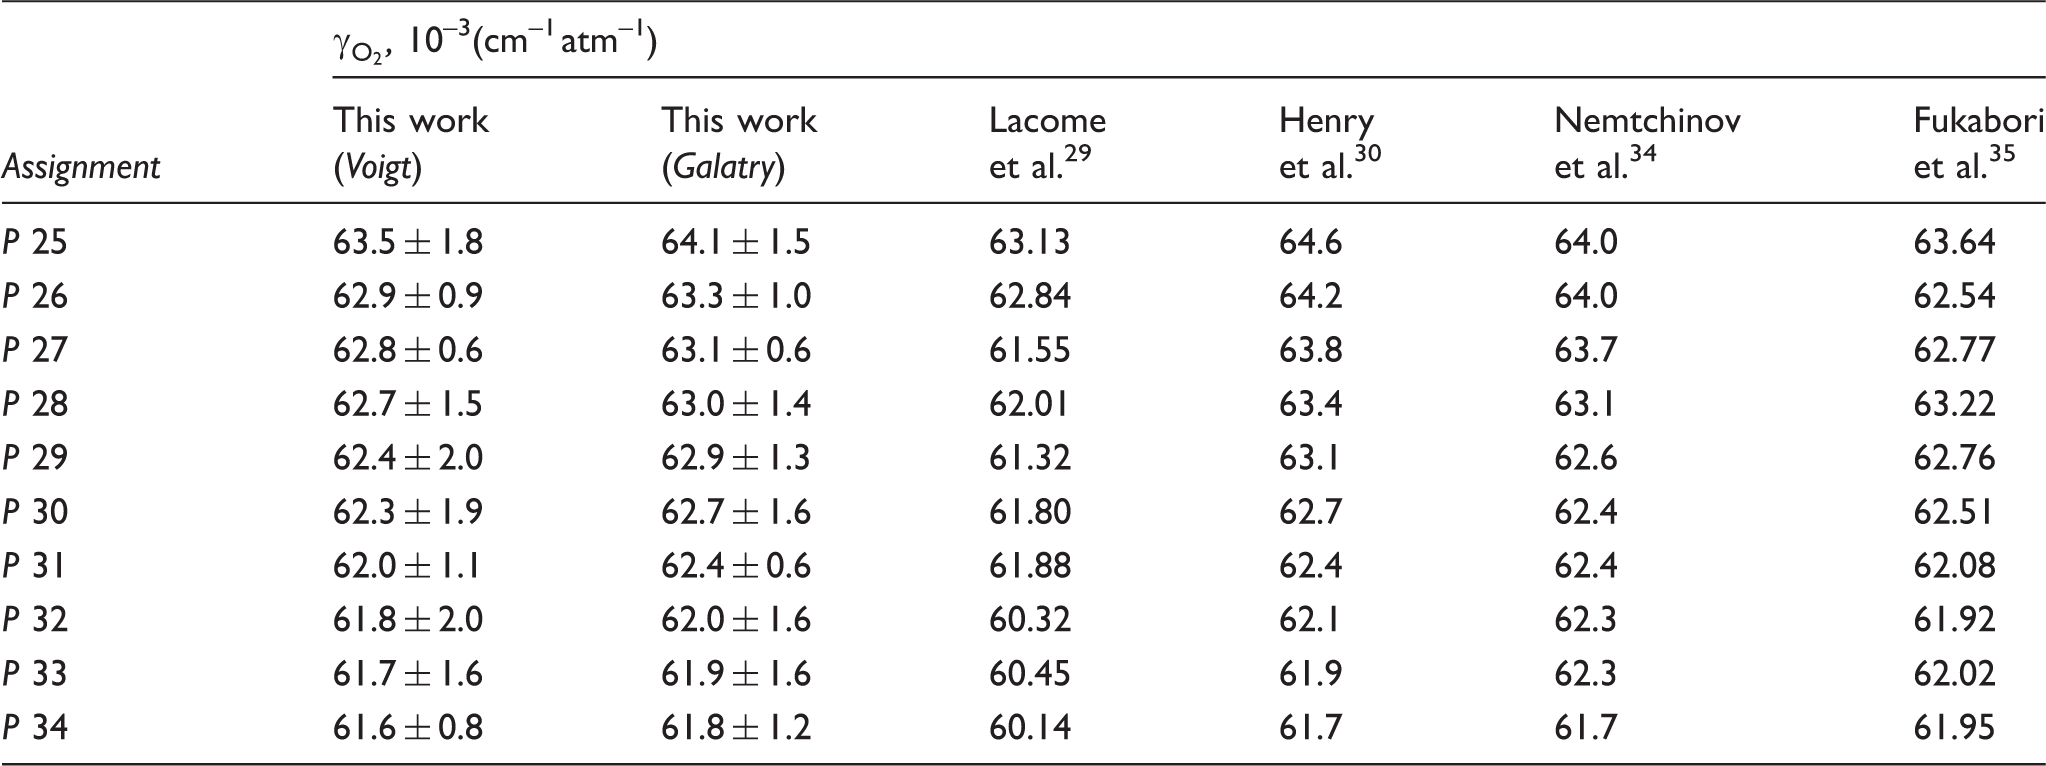
Comparisons of broadening coefficients with available data in the literature, measured by FT-IR spectroscopy, are also shown in Tables 3 and 4. Current work is the first study of broadening coefficients of N2O in this wavelength range using a narrow line width tunable laser source. Values reported by Lowder 27 are systematically smaller than the ones measured here. Our results are in reasonable agreement with the tabulated values of Lacome et al. 29 and Henry et al. 30 Our data are also in good agreement with the FT-IR experimental work performed by Fukabori et al. 35 and Nemtchinov et al. 34
Air-Broadening Coefficients
Collisional-broadening coefficients of N2O with air (γAir) at 297 K. Literature data measured using FT-IR spectroscopy are also shown for comparison.
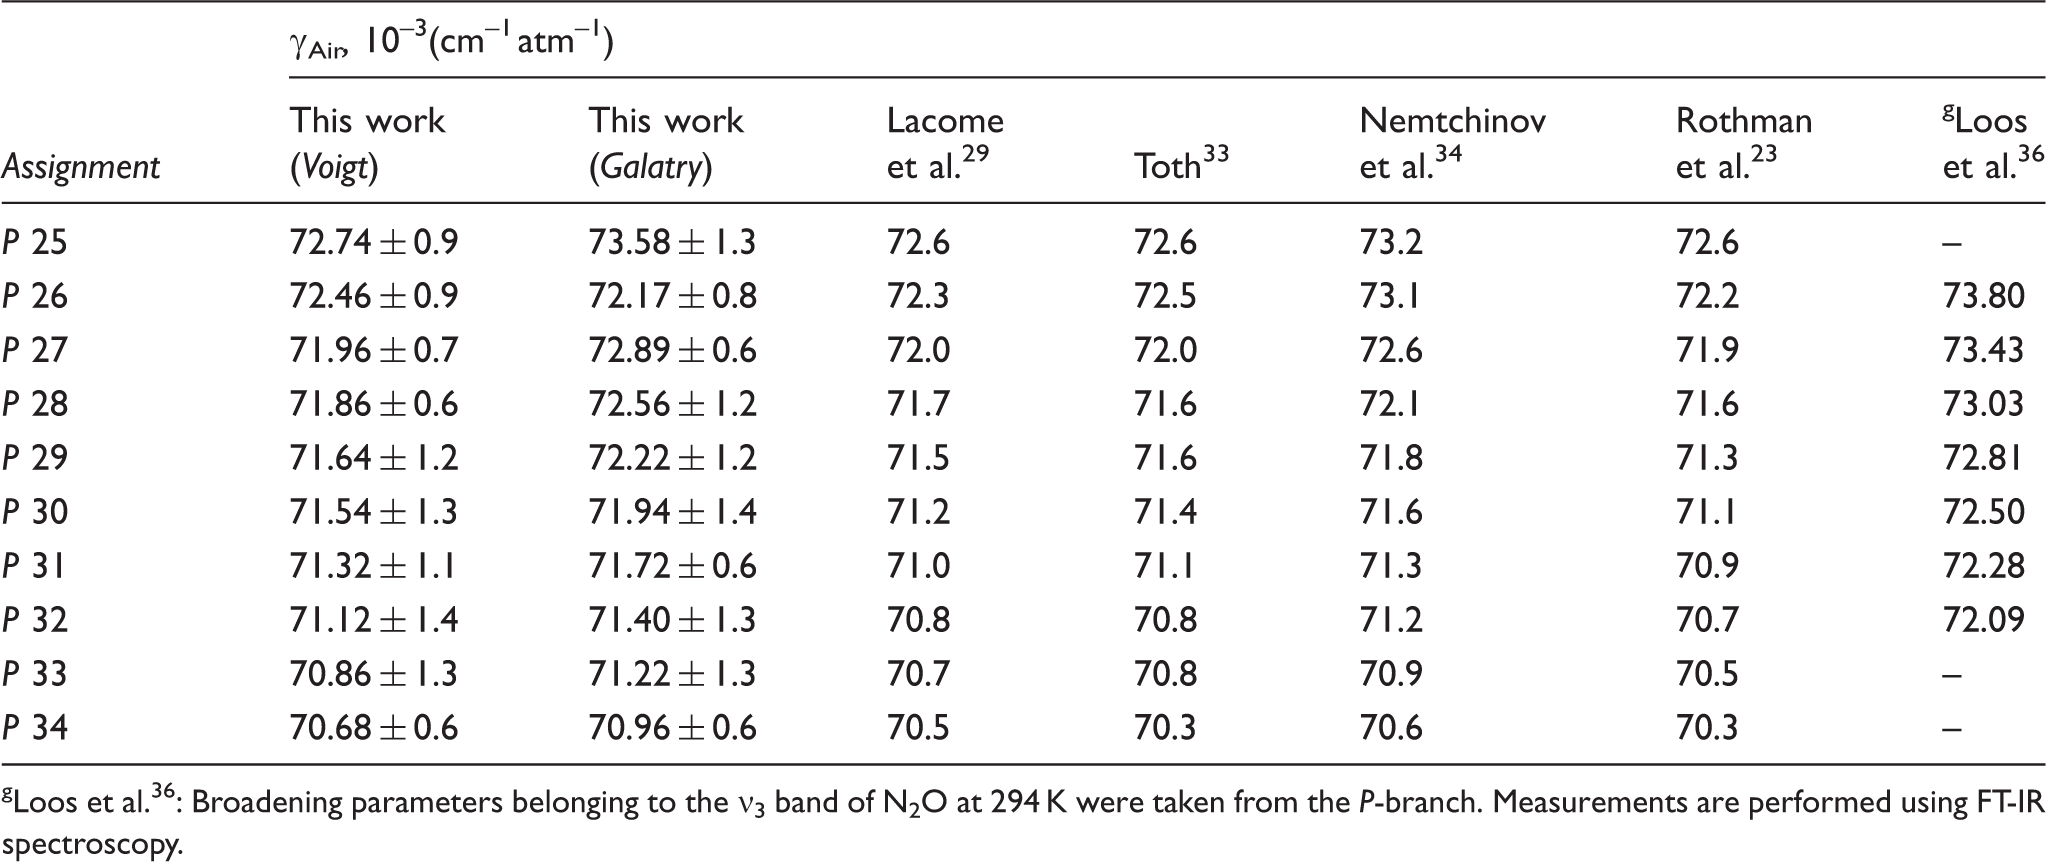
Loos et al. 36 : Broadening parameters belonging to the ν3 band of N2O at 294 K were taken from the P-branch. Measurements are performed using FT-IR spectroscopy.
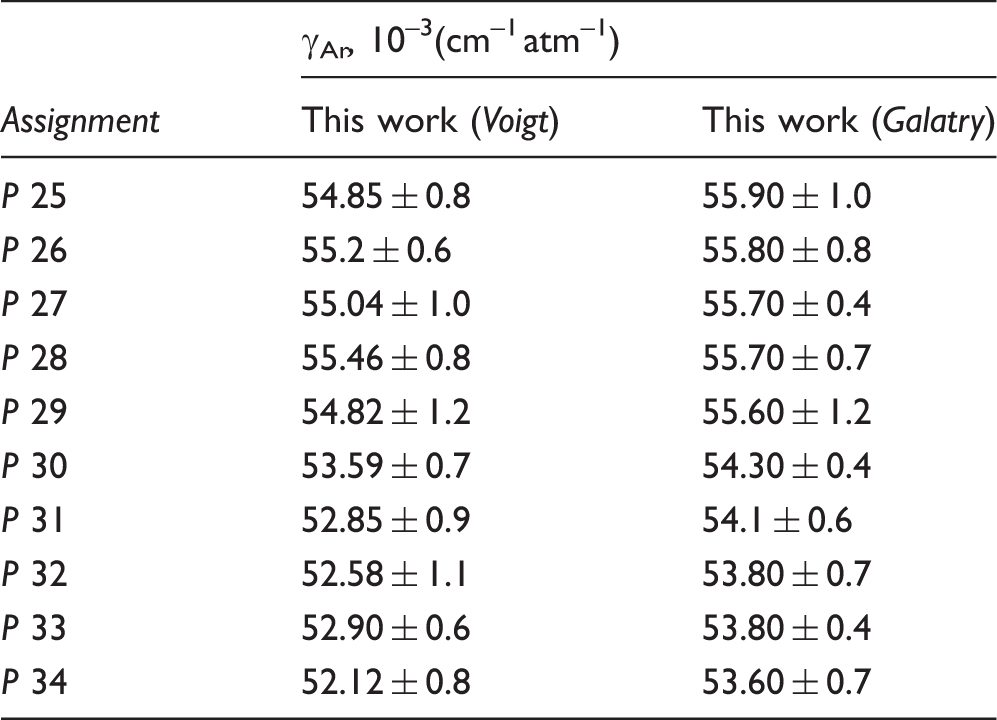
Ar-Broadening Coefficients
Collisional-broadening coefficients of N2O with Ar (γAr) at 297 K.
Broadening Coefficient Parameterization
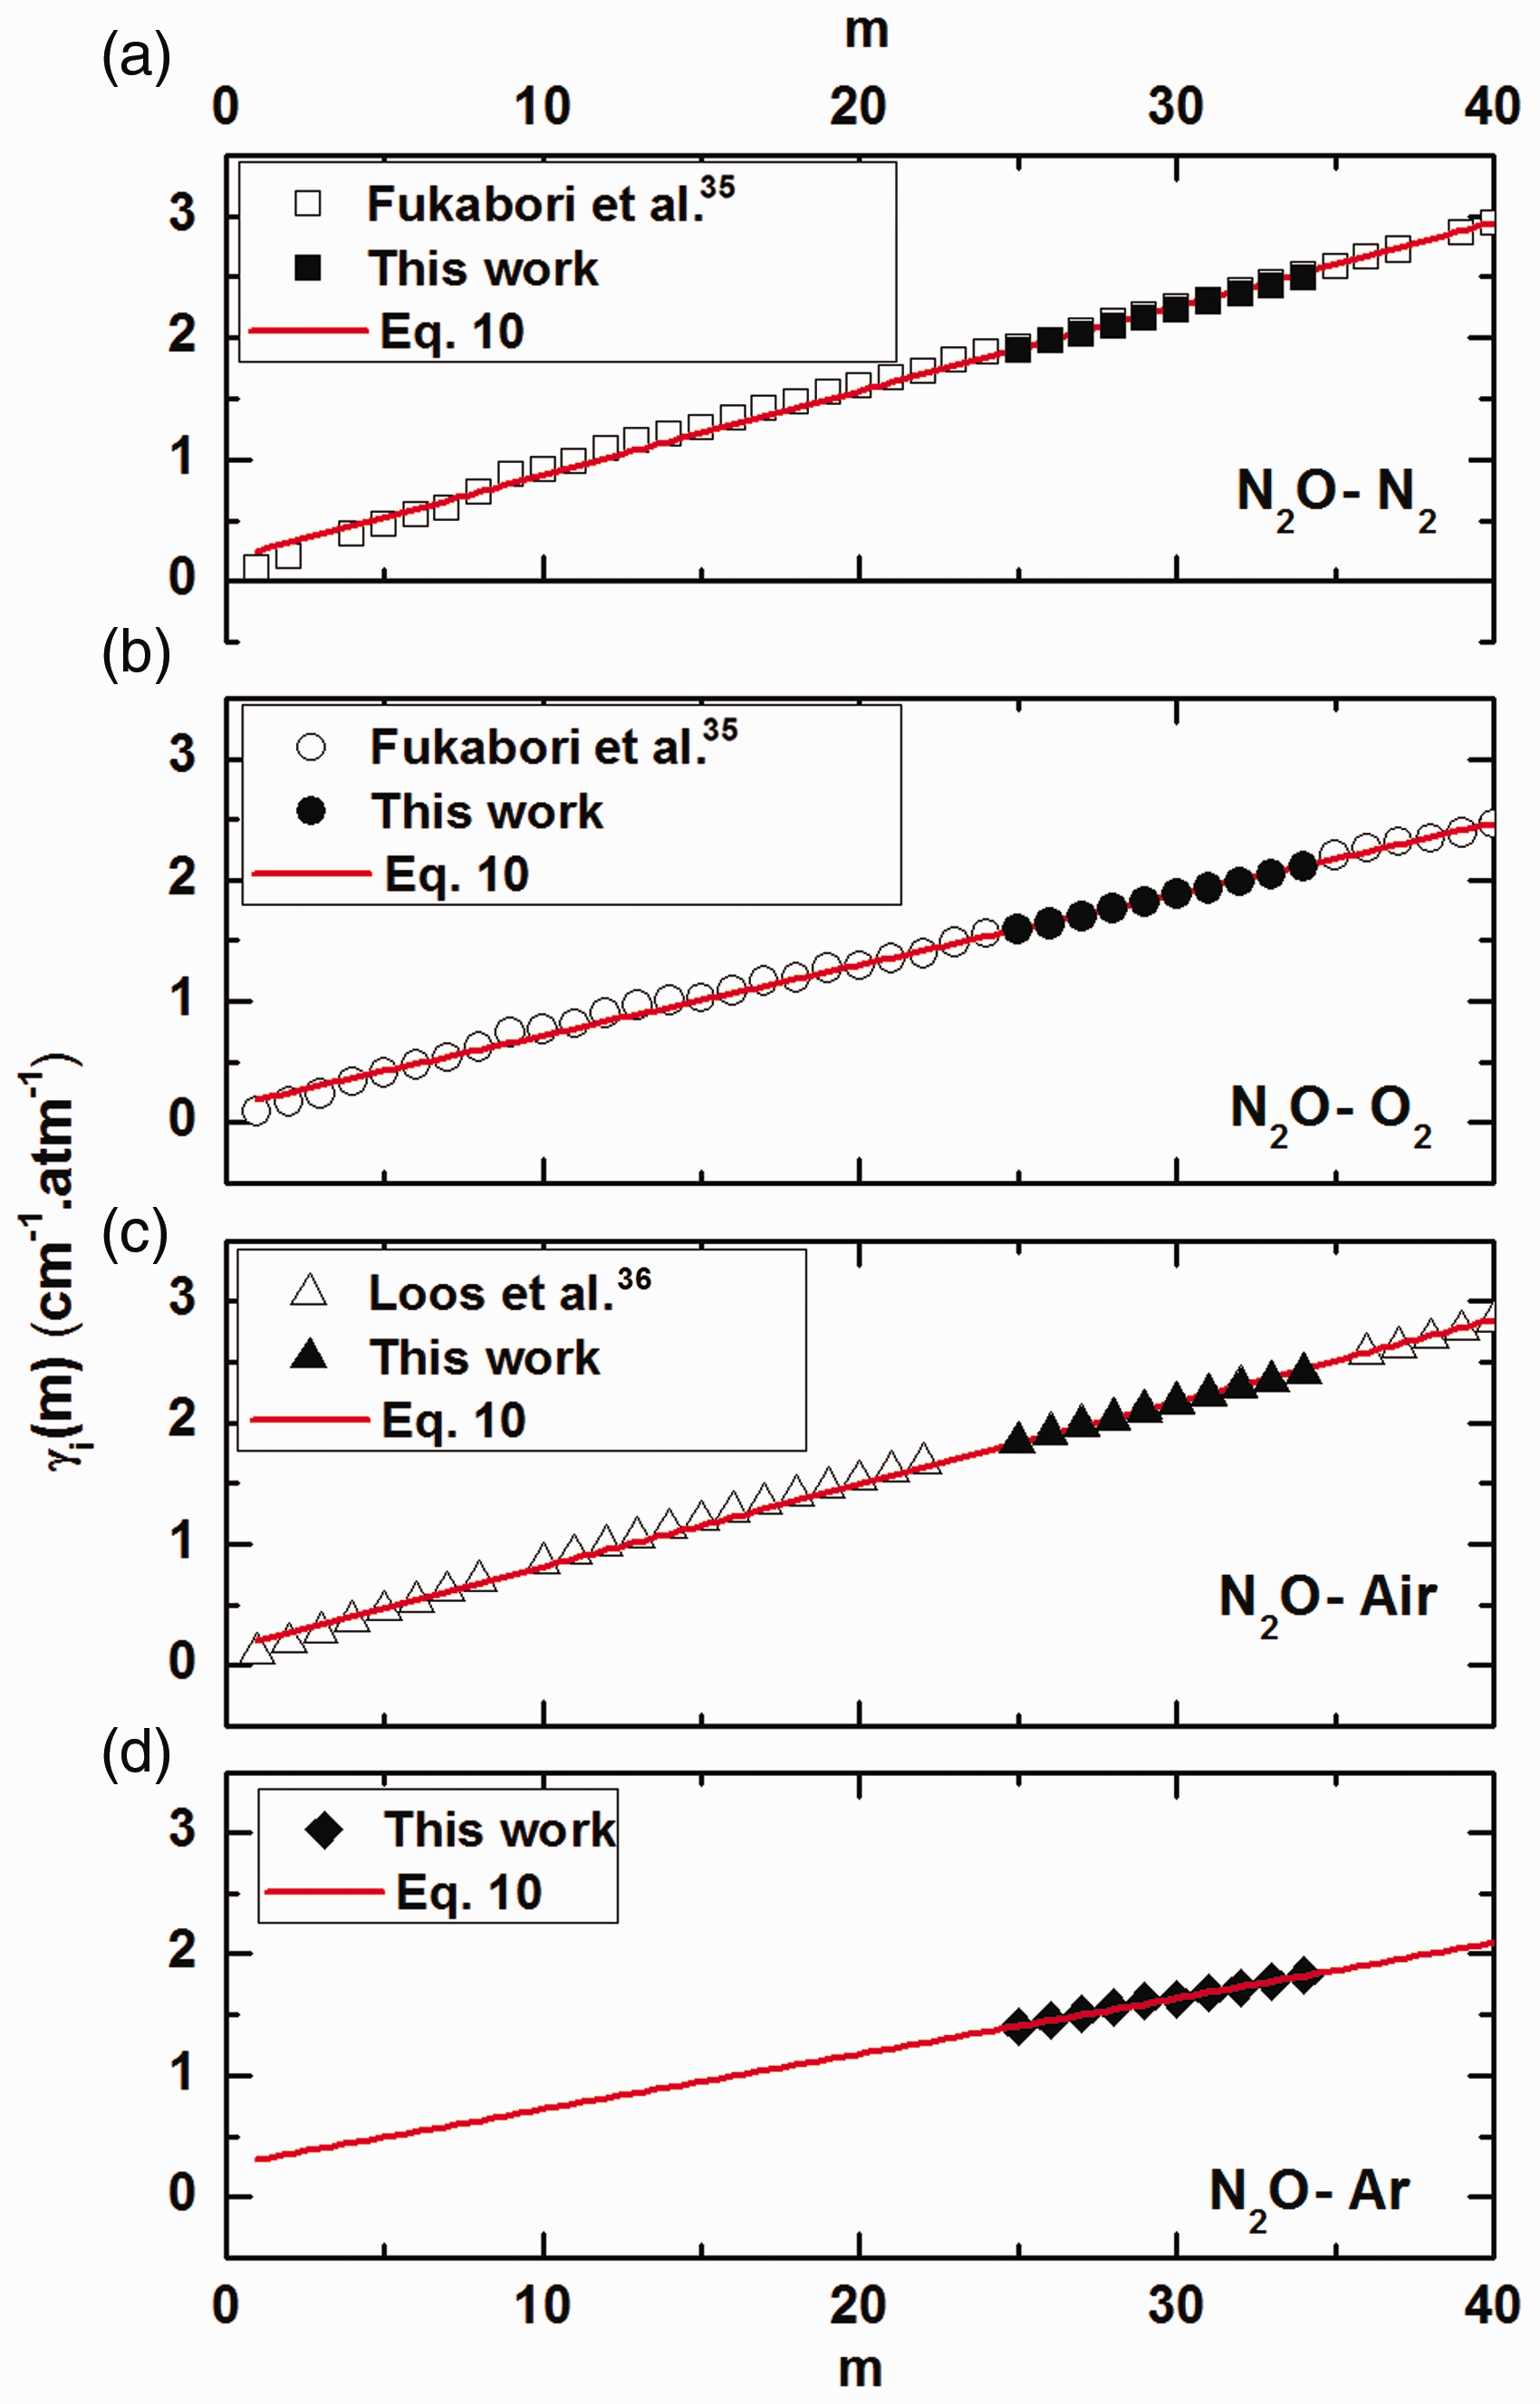
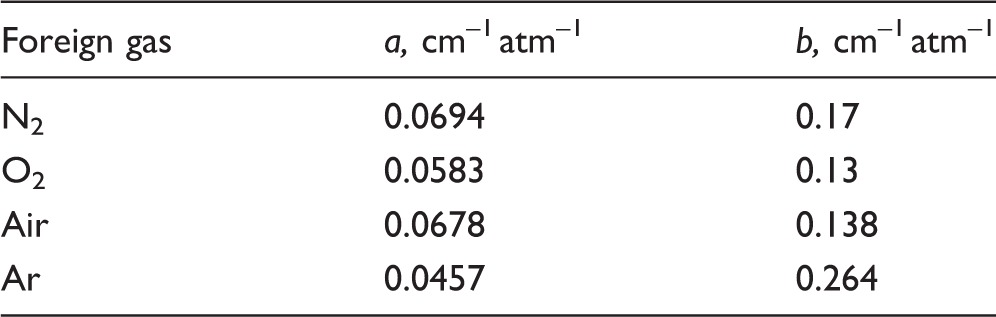
Since our tunable laser system covered only ten transitions in the ν3 band of N2O, the broadening coefficients measured in various foreign gases are parameterized to extend the study to other transitions in the P-branch for rotational quantum numbers (m) between 1 and 40. The obtained equation can be used to easily predict broadening coefficients in a computer simulation. In addition to the measured values of current work, the parameterization also includes FT-IR-measured N2- and O2- broadening data of Fukabori et al.
35
(Figure 6a–b) and the recent FT-IR measurements of air-broadening by Loos et al.
36
(Figure 6c). All data from the literature35,36 are for the P-branch lines of the same ν3 vibration–rotation band of N2O. The following equation is used to fit the experimental broadening data
Parameterization of the measured N2-, O2-, Air- and Ar- broadening coefficients via Eq. 10 to extend data to P-branch transitions from m = 1 to 40 in the ν3 band of N2O.
Constant parameters, a and b, determined using Eq. (10) for N2-, O2-, Air- and Ar- broadening coefficients.
Conclusions
Absolute intensities, N2-, O2- and Ar- collisional broadening coefficients of N2O were measured at room temperature for ten transitions in the P branch of the ν3 vibrational band. Measured absorption line shapes were fitted with Voigt and Galatry profiles to obtain spectroscopic parameters. Collisional broadening coefficients of air were derived from N2- and O2- broadening contributions by considering ideal atmospheric composition. The use of narrow line-width DFB QCL enabled measurements with high spectral resolution. Compared to the previously reported data with FT-IR spectroscopy, our laser-based measurements result in higher precision and higher accuracy of the deduced collisional broadening coefficients. Future work will attempt to expand our measurements to experimental conditions where line-mixing and collisional narrowing effects are more pronounced so that narrowing and mixing parameters can be retrieved by using more sophisticated line-shape models. We believe that the current measurement results are very useful for the design of laser-based diagnostic sensors aimed at monitoring the abundance of N2O in the earth's atmosphere.
Footnotes
Acknowledgments
Research reported in this publication was supported by the King Abdullah University of Science and Technology (KAUST).
Conflict of Interest
The authors report there are no conflicts of interest.
Funding
This research received no specific grant from any funding agency in the public, commercial, or not-for-profit sectors.