
Abstract
Molecular interactions between benzoic, salicylic, and acetylsalicylic acids and water contained within montmorillonite clay interlayer spaces are characterized by using variable temperature diffuse reflection infrared Fourier transform spectroscopy (VT-DRIFTS). By using sample perturbation and difference spectroscopy, infrared (IR) spectral variations resulting from the removal of interlayer water are used to characterize aromatic acid local environment changes. Difference spectra features representing functional group perturbations are correlated with changes in IR absorptions associated with –O–H and –C = O stretching vibrations. Results suggest that adsorbate carboxylic acid functionalities participate in extensive hydrogen bonding and that the strengths of these interactions are diminished when clays are dehydrated. The nature of these interactions and their temperature-dependent properties are found to depend on adsorbate structure and concentration as well as the clay interlayer cation.
Keywords
Introduction
Pharmaceuticals and personal care products (PPCPs) are manufactured in large quantities each year. Unused PPCPs and their metabolites permeate the environment, including food and water supplies. These substances have been engineered to induce dramatic effects on biological systems and are unknowingly assimilated from contaminated plant and meat products. 1 Most studies suggest that short-term effects from recycled PPCPs are minimal because ingested concentrations are typically very low. 2 However, the long-term chronic effects on plants, animals, and humans are unknown.3,4 Detailed studies of interactions between PPCPs and soil constituents will provide a better understanding of contaminant protection mechanisms, which may be useful for determining the environmental fates of these substances and for developing appropriate remediation strategies.
Cooper et al. compiled a list of PPCPs ranked by relative environmental risk.
4
Acetylsalicylic acid (i.e., aspirin), which is a popular over-the-counter anti-inflammation medication,
5
was highly ranked. Approximately 40 000 tons of acetylsalicylic acid are produced annually worldwide.
6
In the presence of water, acetylsalicylic acid readily undergoes deacetylation, yielding salicylic and acetic acids. In addition to acetylsalicylic acid degradation, environmental salicylic acid accumulations derive from its commercial use. In particular, it is a component of treatments for acne and other skin conditions.
7
As shown in Figure 1, salicylic and acetylsalicylic acids share functional group similarities with benzoic acid, which is also abundant in the environment.8,9
Adsorbate structures.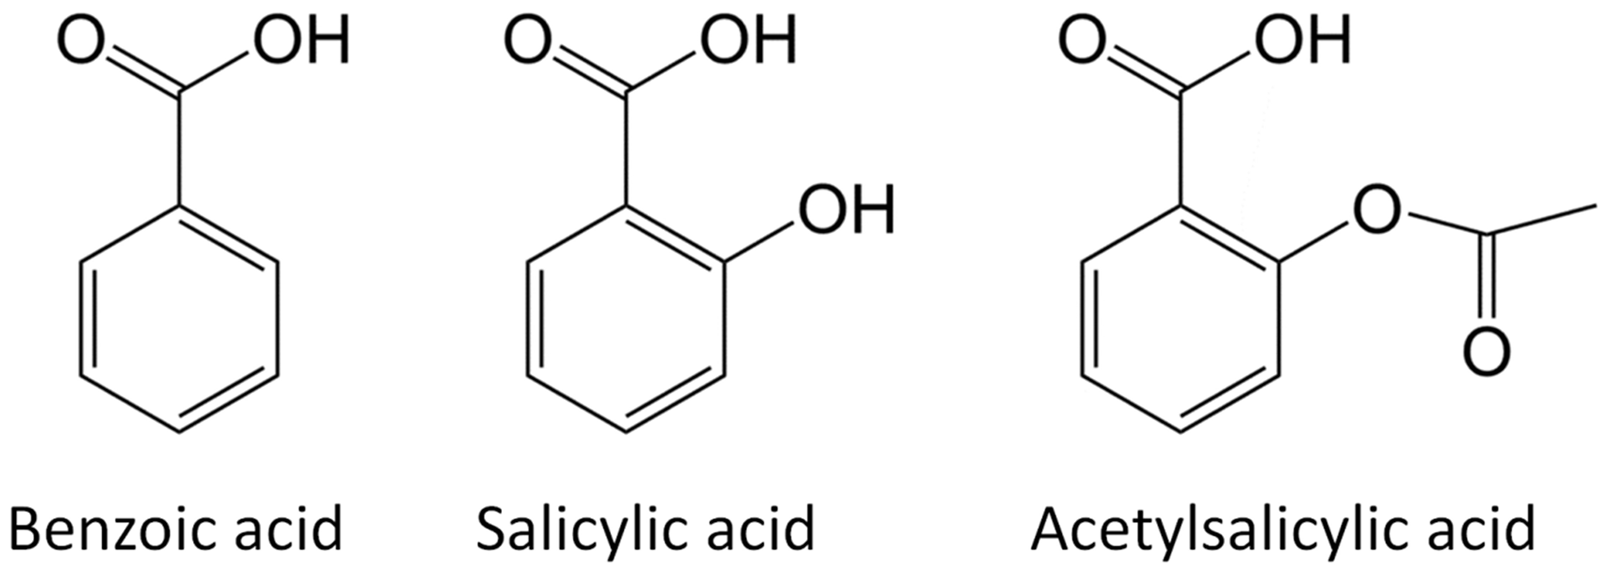
Polar contaminants, such as benzoic, salicylic, and acetylsalicylic acids, typically adsorb to and therefore concentrate in the clay component of soils.10,11 Montmorillonite clays are ubiquitous in soils. Montmorillonite consists of inorganic oxide tetrahedral and octahedral layers in a 2:1 ratio that possesses residual negative charges. 12 Spaces between stacked inorganic sheets contain cations that balance these residual negative charges. The identity of the interlayer cation has a significant impact on the properties of the clay. In particular, it determines the amount of water contained between inorganic layers. 13 Interlayer space water content also depends on ambient humidity, because clays can absorb water from the air. The identity of the cation and water content determine the thickness of the interlayer space or basal spacing. The basal spacing of dehydrated montmorillonite is typically about one nm, but layer thickness increases with increasing water content. 12 Montmorillonite water content and basal spacing tend to increase in discrete steps, roughly corresponding to addition of water monolayers. 14
Although little is known about soil interactions with acetylsalicylic and salicylic acids, benzoic acid has been extensively employed for adsorbate/clay interaction studies.10,15–18 By using thermogravimetry, Lu et al. reported that the rate of benzoic acid desorption from sodium montmorillonite maximized at 140 ℃, which was lower than when the clay contained calcium interlayer cations (179 ℃). 15 They attributed the higher desorption temperature to stronger interactions between calcium ions and benzoic acid molecules. By using infrared (IR) spectroscopy, Yariv et al. reported that the –C = O stretching frequency of benzoic acid adsorbed on montmorillonite was dependent on the cation present in the clay interlayer space and the extent of clay dehydration. 17 They found that singly charged cations, such as Na+, perturbed the –C = O stretch the least relative to neat benzoic acid (dimer), whereas multiple charge cations, such as Ca2+, produced larger wavenumber shifts. They proposed a model to explain their spectroscopic findings in which a water molecule bridges between the acid and cation. Interactions between benzoic acid and montmorillonites have also been studied by using variable temperature diffuse reflection infrared Fourier transform spectroscopy (VT-DRIFTS).19–21 Temperature-dependent IR spectral results confirmed that benzoic acid interacts with interlayer cations through water bridges. 21 The charge carried by the interlayer cation affects the strength of bridging interactions with benzoic acid. Furthermore, it was determined that benzoic acid interactions with montmorillonite are primarily associated with the polar carboxylic acid functionality and not the aromatic ring.
The study described here is an extension of our previous work, which was focused on benzoic acid interactions with interlayer water contained within sodium and calcium montmorillonites. 21 Results described here were obtained by VT-DRIFTS, and characterize interactions between potassium, sodium, and calcium montmorillonite interlayer water molecules and benzoic acid, salicylic acid, and acetylsalicylic acid adsorbates. By comparing temperature-dependent IR spectra obtained from samples containing these adsorbates, changes in adsorbate–water interactions can be elucidated. Variable temperature DRIFTS characterizations provide insights into montmorillonite interlayer water perturbations by aromatic acid adsorbates and reveal details regarding changes to adsorbate local environments that occur during clay dehydration.
Experimental
Montmorillonite (K-10), benzoic acid, salicylic acid, and acetylsalicylic acid were obtained from Sigma-Aldrich. Potassium chloride and sodium chloride were obtained from Mallinckrodt. Calcium chloride was obtained from Fischer Scientific. Carbon tetrachloride and chloroform were obtained from JT Baker Chemical Company. All chemicals were used as received. Montmorillonite clays enriched with K+ (KMMT), Na+ (NaMMT), and Ca2+ (CaMMT) interlayer ions were prepared by cation exchange with the corresponding metal chloride solution by following previously described procedures.22,23 Cation exchanged clays were loaded with adsorbates by incipient wetness. Samples containing benzoic acid were prepared with 1, 3, 5, and 10% (w/w) loadings. Samples containing salicylic and acetylsalicylic acids were prepared with the same mole fractions as the benzoic acid samples. Consequently, they had higher adsorbate percentages. Benzoic acid was dissolved in carbon tetrachloride, and salicylic and acetylsalicylic acids were dissolved in chloroform, and the clay was suspended and stirred in solution for 30 min at room temperature. The solvent was removed by roto-evaporation for 90 min at room temperature. Adsorbate loaded clays were diluted in silver powder, which is highly scattering and inert for this application. Silver diluent was employed to eliminate spectral artifacts that appear in infrared spectra when neat clay samples are analyzed by DRIFTS. 19 Approximately 15 mg samples containing 5% (w/w) clay were employed for VT-DRIFTS analyses. Thus, total adsorbate quantities present in VT-DRIFTS samples ranged from 60 nmol (for the lowest adsorbate/clay loadings) to 600 nmol (for the highest adsorbate/clay loadings).
The apparatus used for VT-DRIFTS studies is described in detail elsewhere. 24 A linear sample heating ramp and 10 mL/min helium purge were used for all analyses. After purging in helium for 1 h, samples were heated at 5 ℃/min starting from ambient temperature. Infrared spectra were measured at 1 min (5 ℃) intervals. Variable temperature DRIFTS spectra were collected by using a Mattson Nova Cygni 120 FT-IR. A software macro was employed so that sample temperature measurements could be saved and correlated with measured spectra. Reflectance spectra were converted to Kubelka–Munk format for display and subtractions. 24
Results and Discussion
Montmorillonite IR spectra are dominated by strong features near 1050 cm–1 corresponding to inorganic oxide vibrations and over the 2500–3750 cm–1 range due to –O–H stretching vibrations.
20
The –O–H stretching band consists of overlapping contributions from inorganic oxide hydroxyl groups and interlayer water.
25
Vibrations of inorganic oxide Al–OH–Al functionalities are represented by an absorption band spanning the 3750–3550 cm–1 range with maximum intensity near 3630 cm–1.
25
Interlayer water molecule vibrations are affected by interactions with cations, inorganic oxide surfaces, and other water molecules, resulting in a broad absorption that extends from 3700 to about 2500 cm–1. The stacked plots in Figure 2 provide comparisons of –O–H stretching vibration regions of IR spectra obtained from neat montmorillonite samples enriched in K+, Na+, and Ca2+ interlayer cations and spectra obtained from samples prepared by incorporating benzoic acid, salicylic acid, and acetylsalicylic acid adsorbates into these clays. Baselines were offset in Figure 2 spectra to reveal band shape differences. A small absorption band at 3740 cm–1 in Figure 2 denotes inorganic oxide hydroxyl groups, most likely Si–OH and Al–OH,26,27 that are not involved in hydrogen bonding. As shown in Figure 2, addition of benzoic acid, salicylic acid, and acetylsalicylic acid adsorbates dramatically increased IR absorption below 3500 cm–1. The presence of these adsorbates disrupted the montmorillonite interlayer water hydrogen bonding network and contributed additional hydroxyl functionalities, which also adsorbed in this spectral region. Although all three adsorbates contained aromatic acid functionalities, salicylic acid also contained an aromatic hydroxyl group (Figure 1), providing additional IR absorption. Figure 2 shows that the presence of adsorbate does not significantly affect the –O–H stretching band associated with inorganic oxide hydroxyl groups, suggesting that these functionalities primarily interact with other inorganic oxide hydroxyls or water molecules, even when adsorbate is present. Interestingly, the small 3740 cm–1 band was greatly reduced or absent in spectra obtained from samples containing adsorbates, suggesting that adsorbate molecules interact with some inorganic oxide hydroxyl groups that do not otherwise participate in hydrogen bonding. Spectra for neat clay samples exhibit increasing contributions from water –O–H stretching band intensity in the order KMMT < NaMMT < CaMMT, which is consistent with TG-MS analysis results confirming that the water content of these clays increased in the same order.
28
Ambient temperature DRIFTS spectra representing the –O–H stretching vibration region for samples containing (a) KMMT, (b) NaMMT, and (c) CaMMT.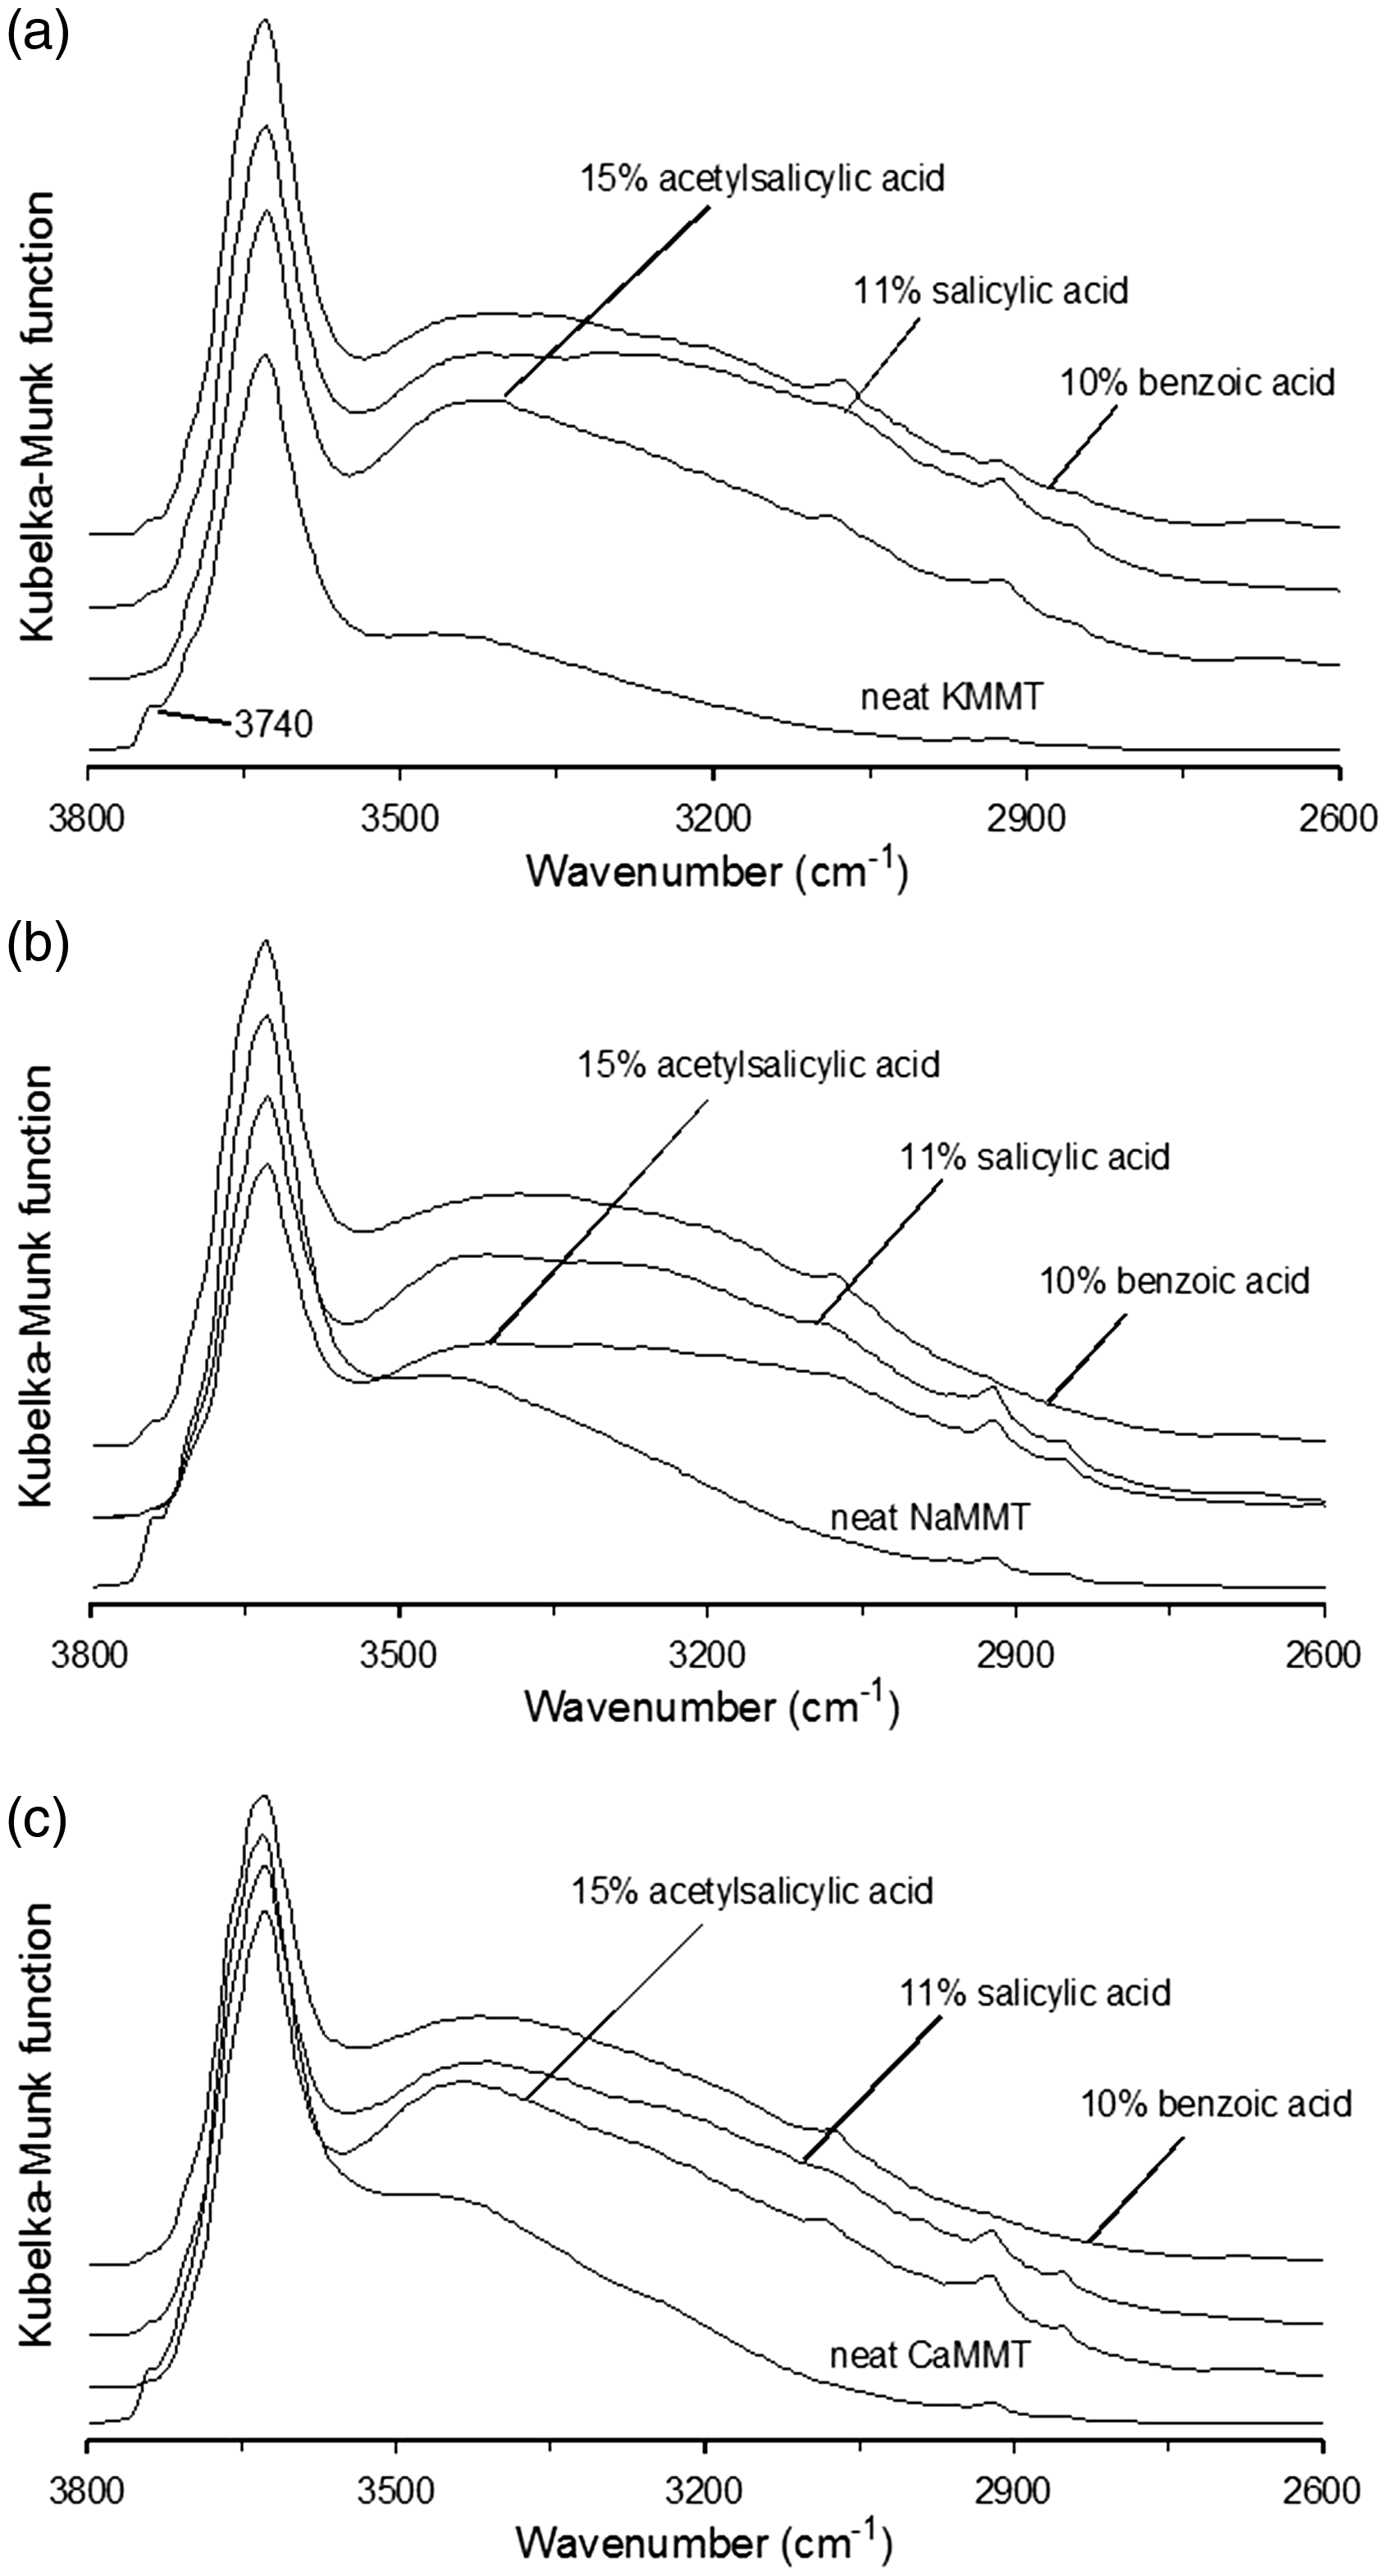
Adsorbate interactions with montmorillonites involve hydrogen bonding to interlayer water molecules that bridge between cations and aromatic acid groups.
21
Hydrogen bonding perturbs the molecular vibrations of adsorbates and the water molecules involved in the interactions. For these water molecules, perturbations cause changes to –O–H stretching and bending vibrations. For adsorbates, vibrations involving the aromatic acid group are primarily affected. Consequently, adsorbate IR spectra exhibit variations in –C = O stretching band shape and position that depend on the properties of the clay interlayer cation. This is illustrated by Figure 3, which shows ambient temperature –C = O stretching band regions of IR spectra obtained from the neat clays and clays containing adsorbates. Neat clay spectra exhibit little absorption in this spectral region, except for small broad bands with maxima near 1630 cm–1 that can be assigned to water molecule bending vibrations. The intensities of the 1630 cm–1 bands vary in the order: KMMT < NaMMT < CaMMT, which correlates with increasing clay water content. Small absorption bands near 1606 cm–1 for benzoic acid, 1618 cm–1 for salicylic acid, and 1610 cm–1 for acetylsalicylic acid that overlap the 1630 cm–1 water bending vibration band exhibit little band shape or intensity dependence on the nature of the interlayer cation and most likely represent aromatic ring vibrations. The more intense and broader absorption bands above 1650 cm–1 can be assigned to –C = O stretching vibrations. Figure 3 shows that the –C = O stretching band position and shape depend on both the adsorbate and the identity of the interlayer cation. For all adsorbates, –C = O absorption bands were most similar for samples containing KMMT and NaMMT clays, which suggests that cation charge largely dictates the frequency of this vibration. When adsorbed on KMMT, the benzoic acid –C = O absorption band appeared as a broad feature with a maximum slightly above 1700 cm–1. When adsorbed on NaMMT, the benzoic acid –C = O absorption band became more broad and the maximum shifted to a lower wavenumber (∼1688 cm–1) relative to the same band for the KMMT sample. On CaMMT, the benzoic acid –C = O absorption was sharper and the band maximum was shifted to a lower wavenumber (∼1677 cm–1) compared to results for samples containing KMMT and NaMMT. The salicylic acid –C = O stretching band for the sample containing KMMT was much sharper than the benzoic acid band and appeared at a lower wavenumber (∼1667 cm–1). When adsorbed on NaMMT, the salicylic acid –C = O bandwidth and band maximum location were comparable to those observed for the KMMT sample. On CaMMT, the salicylic acid –C = O stretching band was broader and extended to higher wavenumber compared to results obtained for samples containing KMMT and NaMMT. The –C = O stretching absorption band obtained for the acetylsalicylic acid/KMMT sample was broad and consisted of overlapping contributions at about 1710 and 1740 cm–1, likely representing the acid and acetyl –C = O functionalities respectively. A similar overlap of bands at these wavenumbers was obtained for the acetylsalicylic acid/NaMMT –C = O stretching absorption band. In addition, a third overlapping absorption contribution was apparent with maximum intensity near 1667 cm–1. Compared to results obtained for samples containing KMMT and NaMMT, the acetylsalicylic acid/CaMMT sample –C = O stretching band was narrower, with the band maximum located near 1710 cm–1.
Ambient temperature DRIFTS spectra representing the –C = O stretching vibration region for samples containing (a) KMMT, (b) NaMMT, and (c) CaMMT.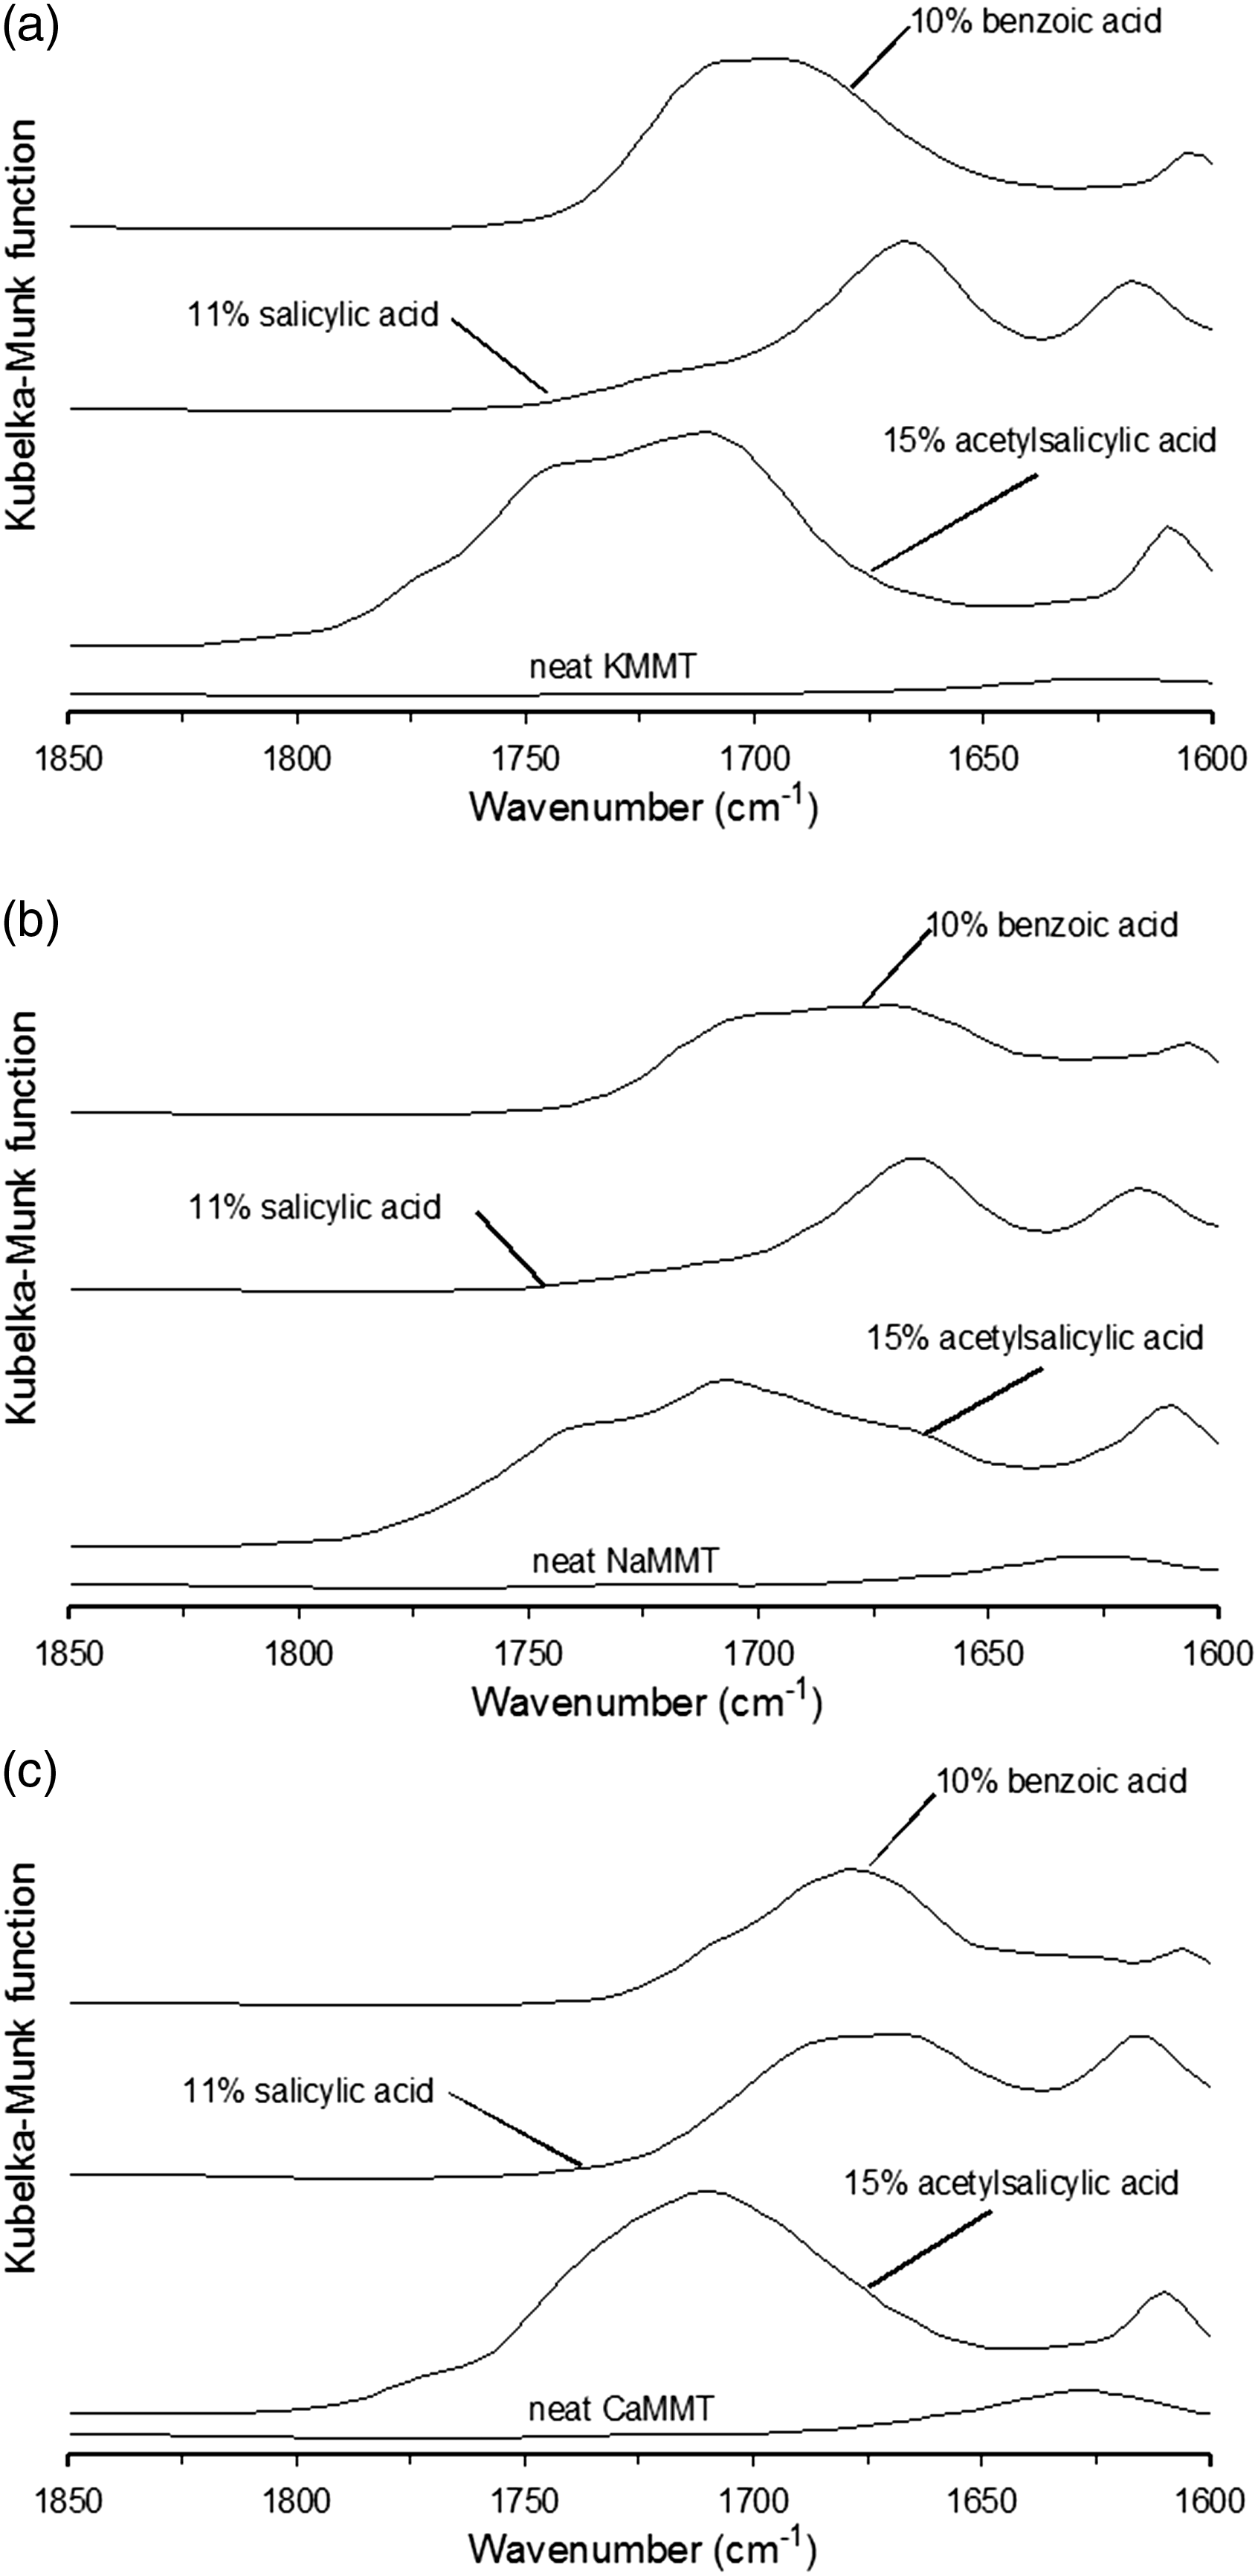
Above 60 ℃, TG-MS analyses revealed that samples containing acetylsalicylic acid decomposed, producing acetic acid.
28
However, between ambient temperature and 60 ℃, TG-MS results showed that all adsorbate/clay sample mass losses were caused by water loss exclusively. Therefore, IR spectral changes detected over this temperature range can be solely attributed to sample dehydration effects for each adsorbate/clay combination. Supplemental Material Figure S1 shows difference spectra obtained by subtracting the VT-DRIFTS ambient temperature spectrum from the spectrum obtained after the sample temperature reached 60 ℃ for each neat clay sample. The broad negative spectral features are associated with water loss, which reduces the overall –O–H stretching vibration band intensity. After heating to 60 ℃, each clay sample spectrum lost about 40% of its initial ambient temperature intensity at 3400 cm–1. The negative difference spectrum band was smallest for neat KMMT (Supplemental Material Figure S1a), which had the lowest initial water content. Two small overlapping positive bands were found at 3735 and 3696 cm–1, which can be assigned to inorganic oxide hydroxyl groups (Si–OH and/or Al–OH) that lost hydrogen bonding partners as a result of sample heating. Neat clay difference spectra have similar shapes with intensity minima located near 3400 cm–1, suggesting that water loss mechanisms for all of the clays were similar over this temperature range. Negative bands for all three clay samples exhibit asymmetry near 3650 cm–1, where inorganic oxide hydroxyl group vibrations overlap interlayer water molecule absorption bands.
Variable temperature DRIFTS difference spectra obtained from samples comprising benzoic acid adsorbed on (a, b) KMMT, (c, d) NaMMT, and (e, f) CaMMT. Top spectra show effect of adsorbate loading and bottom spectra show the effect of temperature for the sample containing 10% benzoic acid.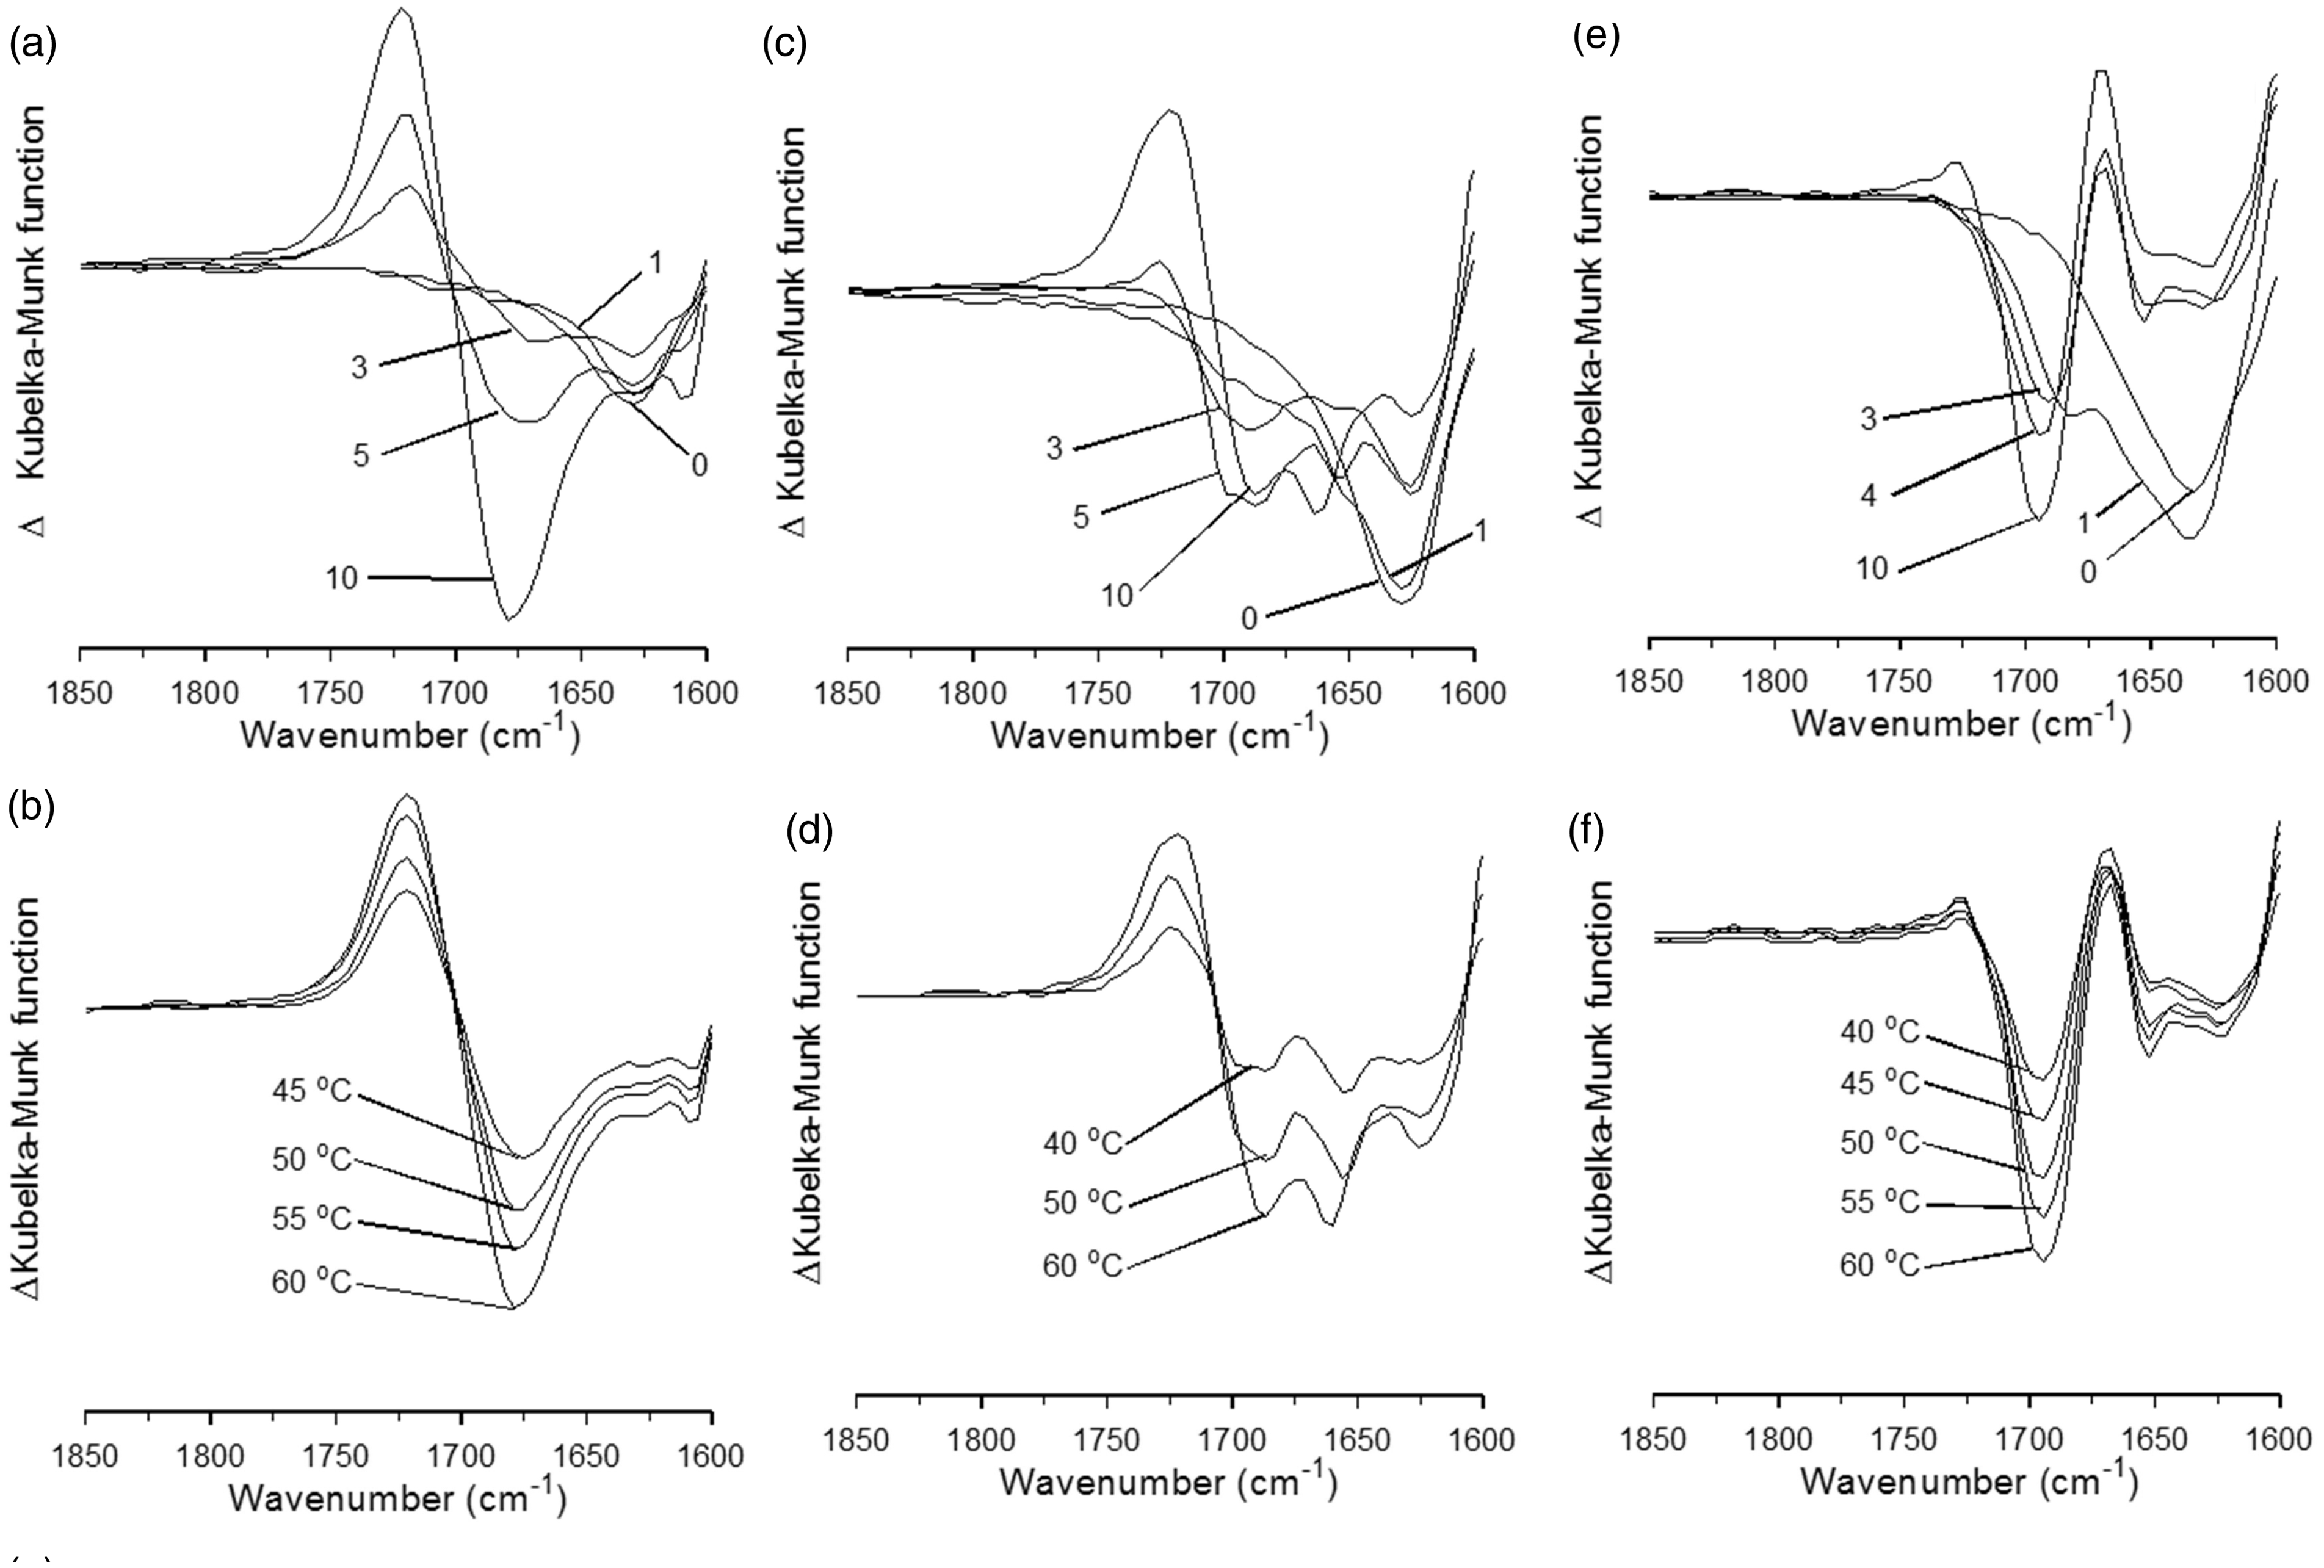
Neat clay dehydration mechanisms were affected by the presence of adsorbates. Variable temperature DRIFTS results suggest that this perturbation depended on the quantity of adsorbate added to clay samples. Supplemental Material Figure S2 shows VT-DRIFTS difference spectra representing IR spectral changes that occurred between ambient temperature and 60 ℃ for various loadings of benzoic acid on KMMT. Difference spectra intensities were normalized with respect to the –O–H stretching band minima so that band shape differences were more apparent. Like the neat clay samples, TG-MS analyses of adsorbate containing samples confirmed that mass loss occurred exclusively by dehydration.
28
Supplemental Material Figure S2 shows that increased adsorbate loadings resulted in a greater shift of the negative –O–H stretching band to lower wavenumbers, indicating a correlation between enhanced water molecule hydrogen bonding and adsorbate content. Similar difference spectra trends were obtained for samples containing each aromatic acid adsorbed on KMMT, NaMMT, and CaMMT.
Variable temperature DRIFTS difference spectra obtained from samples comprising salicylic acid adsorbed on (a, b) KMMT, (c, d) NaMMT, and (e, f) CaMMT. Top spectra show effect of adsorbate loading and bottom spectra show the effect of temperature for the sample containing 11% salicylic acid.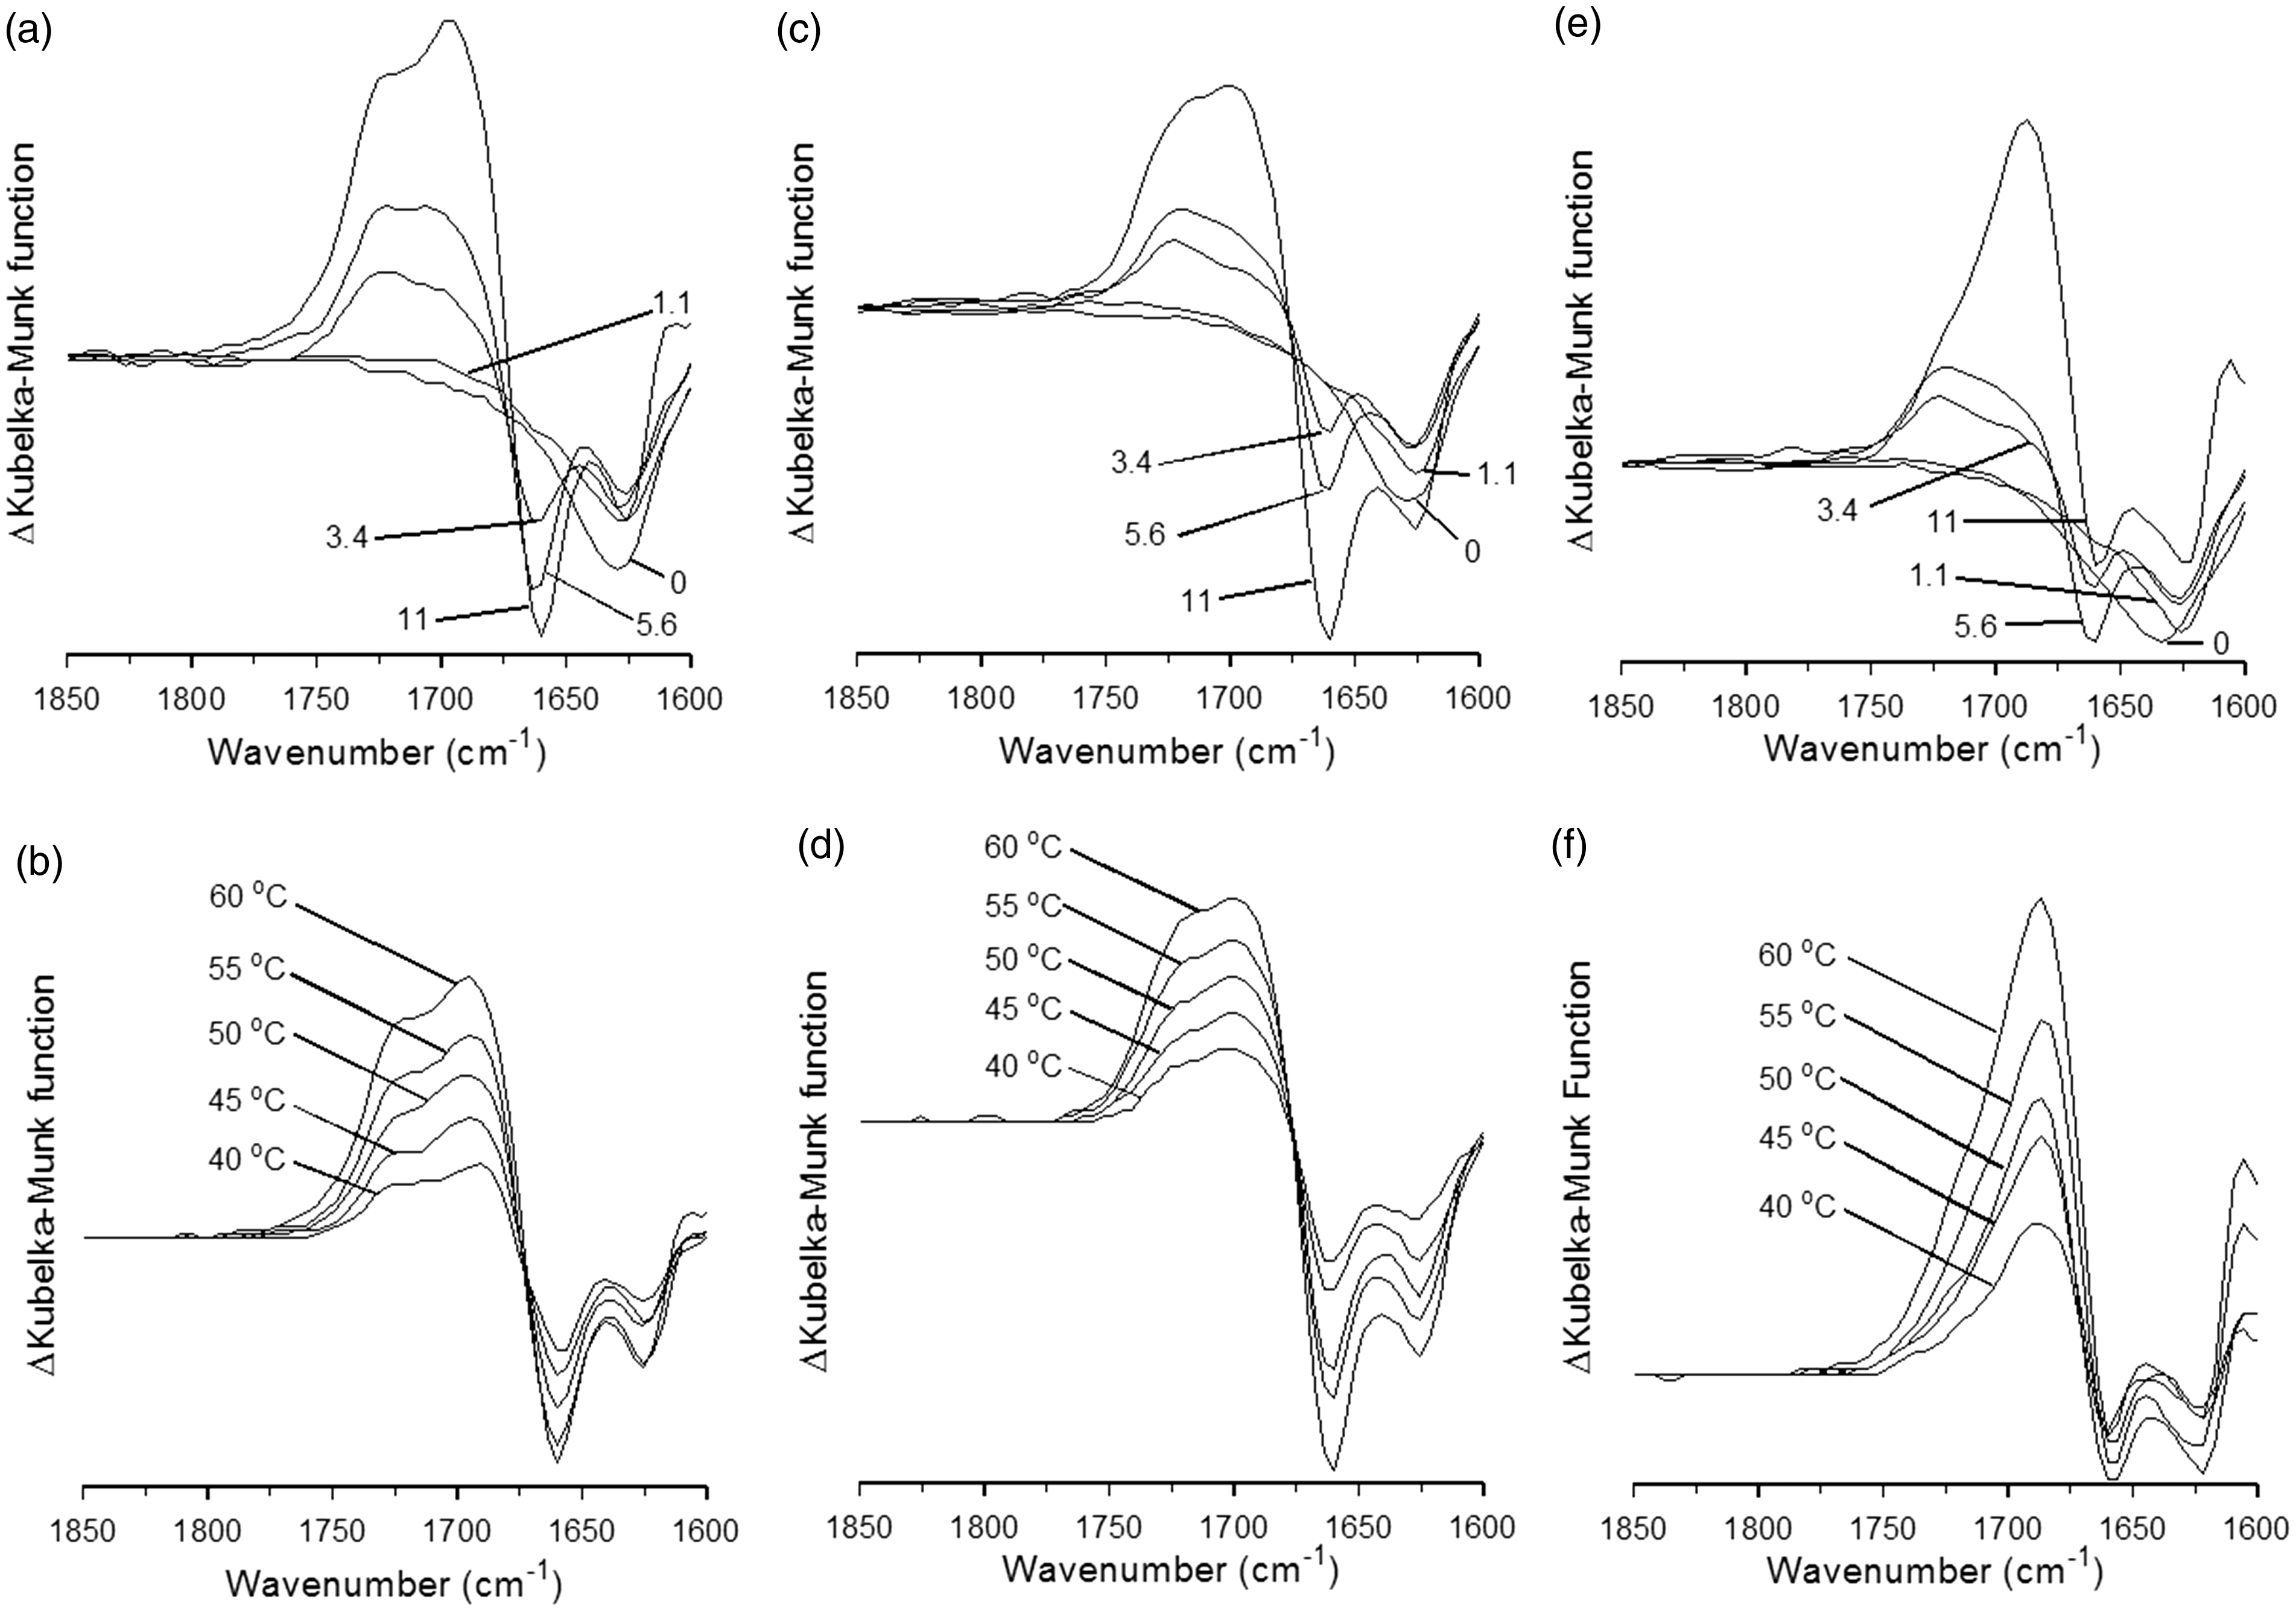
Although trends in the –O–H stretching band spectral region shown in Supplemental Material Figure S2 were similar regardless of adsorbate or clay, changes to the –C = O stretching vibration band region were dependent upon the identities of adsorbate and clay interlayer cation. Figure 4 contains plots of VT-DRIFTS difference spectra (60 C –ambient) in the –C = O stretching band region for clay samples containing benzoic acid. The overlapping plots at the top of this figure reflect the effects of adsorbate quantities on –C = O band shape changes. Graphs at the bottom depict difference spectrum changes as a function of temperature for samples containing the highest (i.e., 10%) adsorbate loadings. Negative bands at 1630 cm–1, corresponding to loss of water bending vibrations, were the only difference spectrum features revealed for neat clay samples (i.e., 0% loading results) over this wavenumber region. The 1630 cm–1 band remained relatively unchanged in spectra obtained for samples containing the lowest adsorbate loadings, but changed shape and shifted in spectra obtained for samples containing higher adsorbate loadings. The 1630 cm–1 bending vibration band features in difference spectra obtained from samples with high adsorbate loadings were typically smaller and more difficult to discern, which is indicative of strong interactions between adsorbate and water molecules.
Variable temperature DRIFTS difference spectra obtained from samples comprising acetylsalicylic acid adsorbed on (a, b) KMMT, (c, d) NaMMT, and (e, f) CaMMT. Top spectra show effect of adsorbate loading and bottom spectra show the effect of temperature for the sample containing 15% acetylsalicylic acid.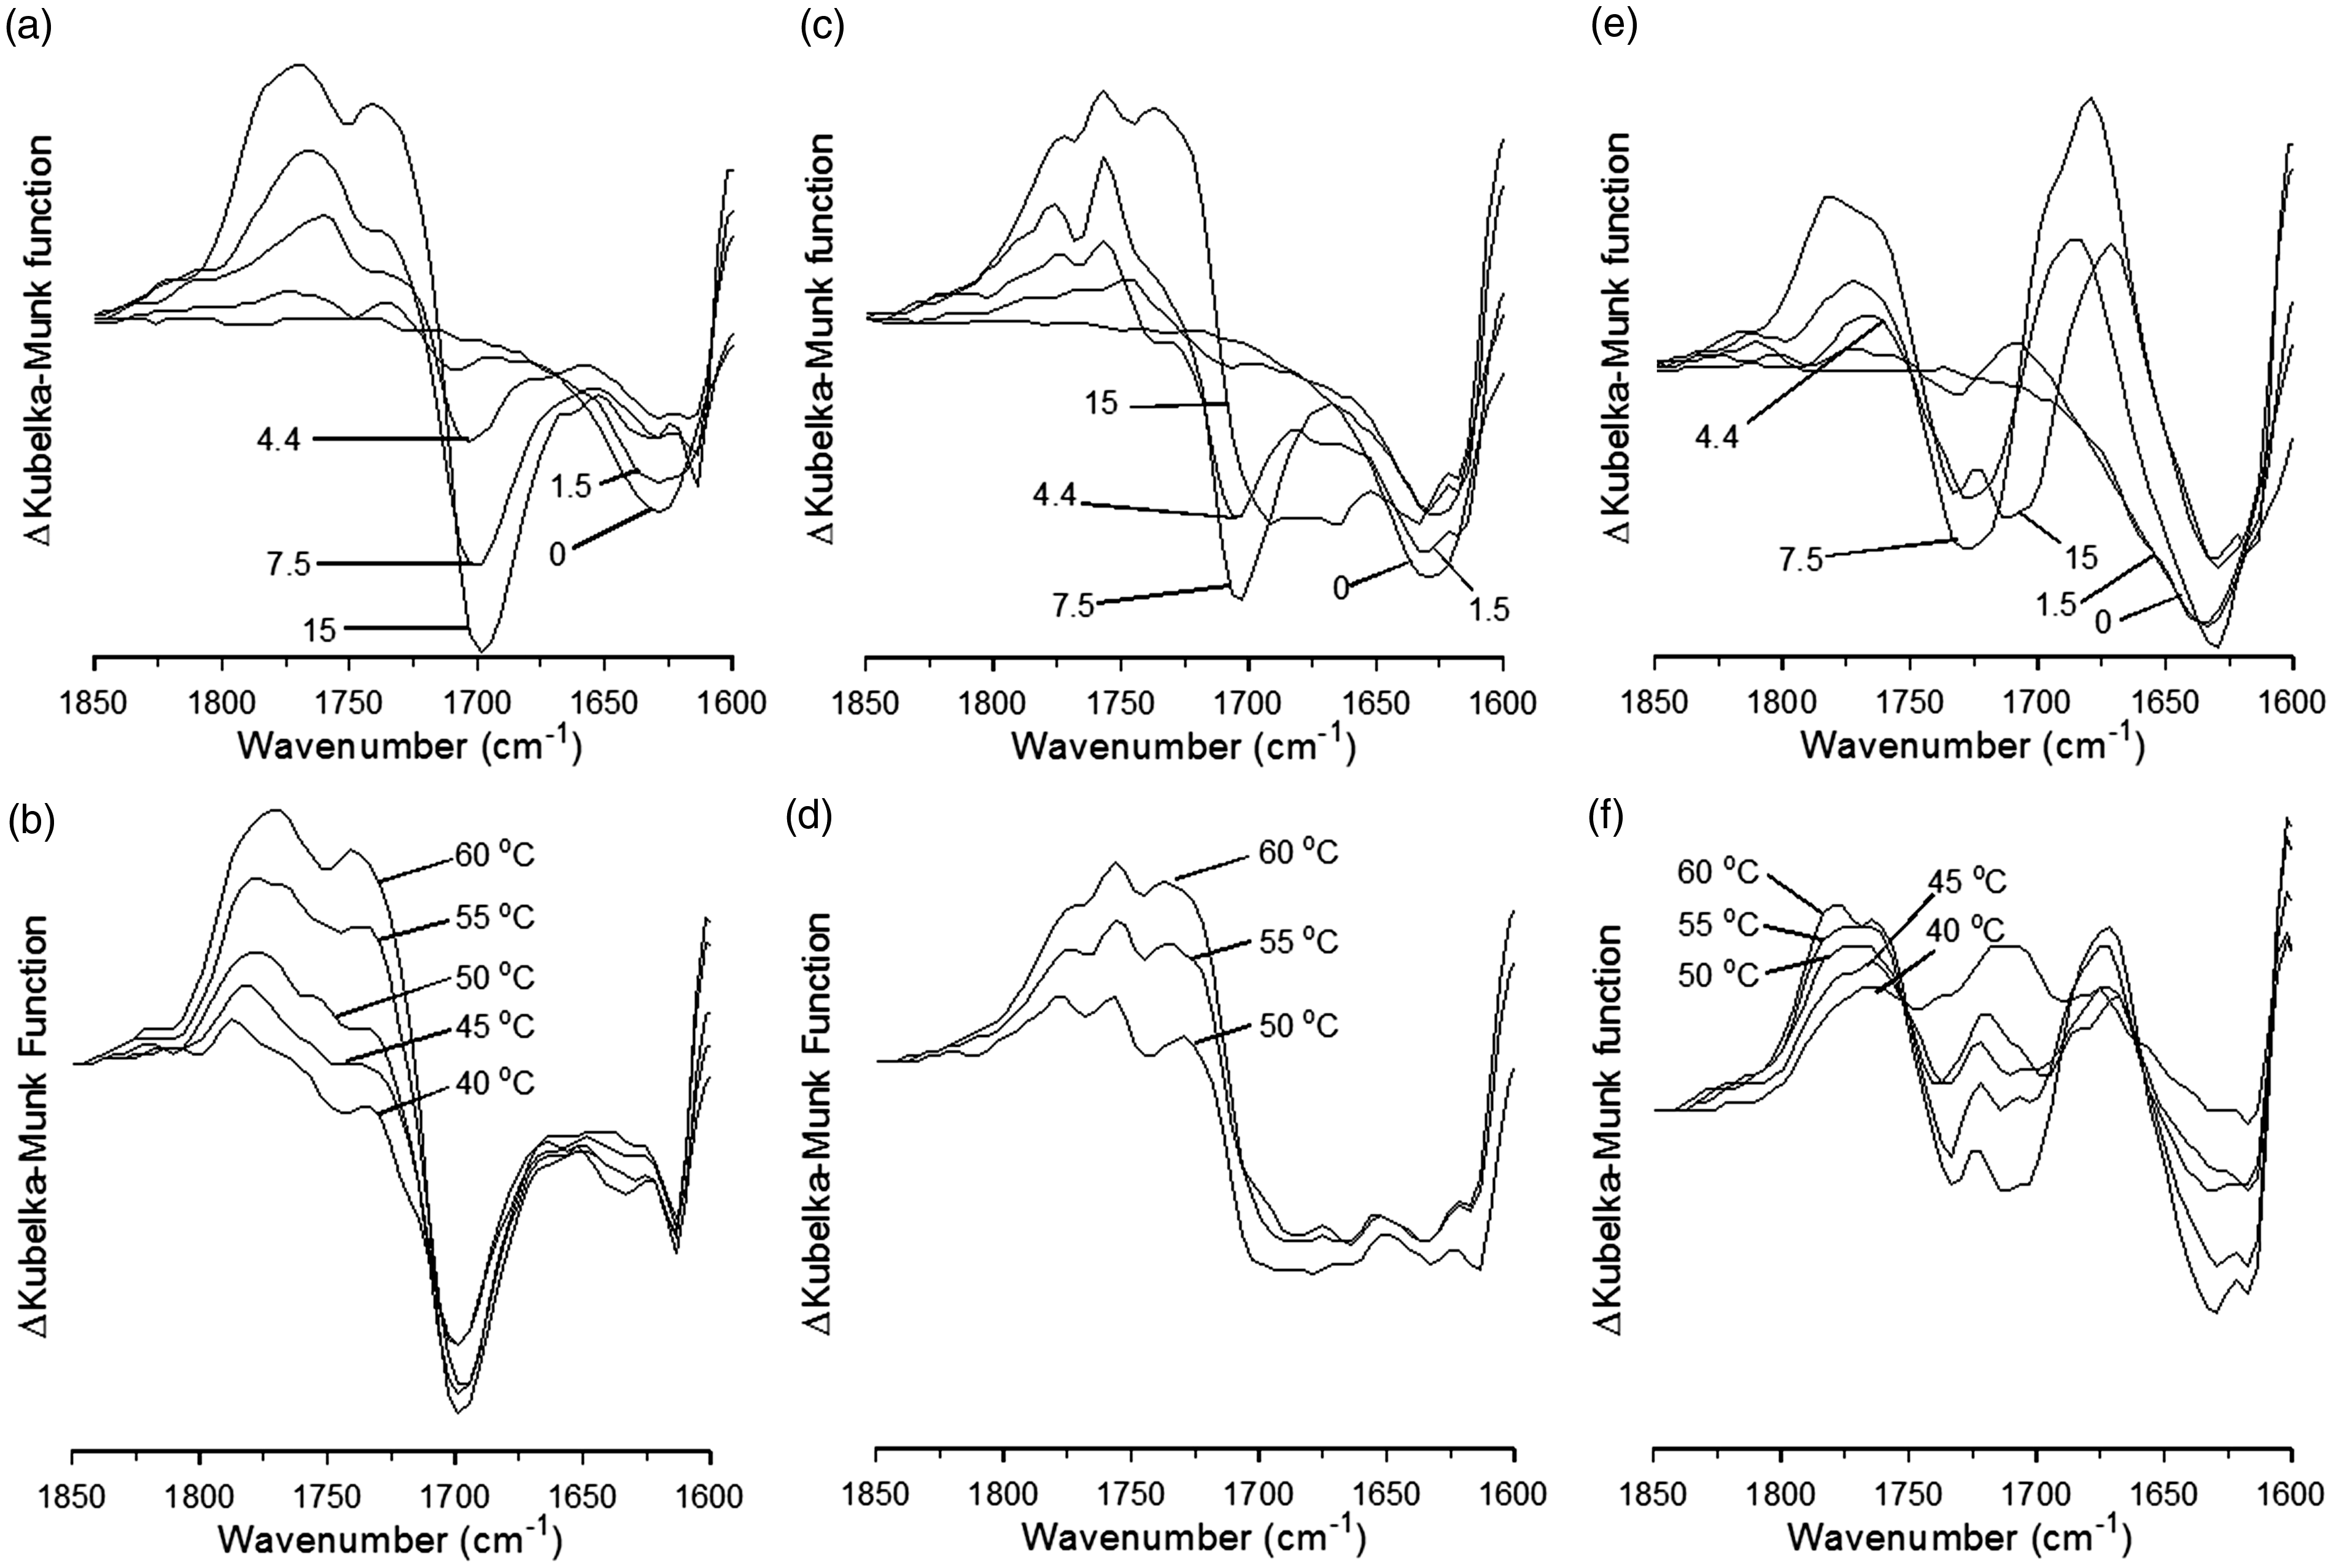
For the benzoic acid/KMMT sample, systematic changes to –C = O stretching vibration bands were apparent for loadings of 3–10% (Figure 4a). Negative features with minima located at 1678 cm–1 and positive features maximizing at 1722 cm–1 increased in magnitude with increasing adsorbate loadings. This “first derivative” peak shape is the result of a blue shift in the –C = O stretching band wavenumber caused by heating the sample. Although the magnitudes of negative and positive –C = O stretching band difference spectra features can be correlated with adsorbate loading, the band wavenumber shift was relatively constant. This suggests that the nature of molecular interactions responsible for these –C = O bands did not change over the 3–10% adsorbate loading range. Figure 4b shows that these trends were also evident for the 10% benzoic acid/KMMT sample as a function of increasing temperature. Apparently, increased water loss from this sample facilitated a consistent blue shift of the –C = O stretching wavenumber, indicating a decrease in adsorbate hydrogen bonding interactions.
Similar trends are evident in spectra obtained for the benzoic acid/NaMMT sample (Figure 4c) except that the negative –C = O stretching band was less intense and its shape was more dependent on adsorbate loading. For the 3% benzoic acid loading on NaMMT, the negative –C = O stretching band occurred near 1690 cm–1 but no positive feature was discerned. With 5% benzoic acid loading, the negative –C = O stretching band consisted of overlapping contributions with minima near 1693 and 1653 cm–1 and a small positive band maximized at 1725 cm–1. Negative bands at the same wavenumbers were detected for the sample containing 3% benzoic acid, but the relative intensity for the 1653 cm–1 band was much lower than the 1693 cm–1 band. Results obtained for the 10% benzoic acid/NaMMT sample at 60 ℃ (Figure 4d) included greater positive band intensity with a maximum near 1720 cm–1 and overlapping negative bands with minima at 1688 and 1662 cm–1. Band locations in difference spectra obtained for the sample containing 10% benzoic acid at 40 ℃ and 50 ℃ were similar to those obtained for samples containing 3% and 5% loadings. Thus, –C = O stretching band shape changes suggest that benzoic acid occupied at least two different hydrogen bonding environments prior to dehydration but adopted a similar environment after water loss. Furthermore, the two initial environments were affected by adsorbate loading, with the 10% loading exhibiting a slight temperature-dependent shift in –C = O band wavenumber. Adsorbate environment differences for samples containing KMMT and NaMMT may have been due to the increased interlayer spacing for NaMMT, allowing for greater flexibility in adsorbate orientations.
Difference spectra shown in Figure 4e exhibit a single negative –C = O stretching band near 1694 cm–1 for the 4% and 10% benzoic acid/CaMMT samples and positive features above and below the negative band location for the sample containing 10% adsorbate. Because the quantity of adsorbate did not change with heating, this shape must be explained by the formation of a positive –C = O band at 60 ℃ that was broader but had lower absorptivity than the corresponding ambient temperature band. The shapes exhibited in Figure 4e would be expected as a result of subtracting these overlapping features. Figure 4f shows that this shape was maintained while heating the 10% benzoic acid/CaMMT sample.
Difference spectra representing dehydration of samples containing salicylic acid and KMMT (Figure 5a, b) indicate that the –C = O stretching vibration of affected acid functionalities shifted from about 1660 cm–1 to environments characterized by –C = O band maxima at 1725 and 1695 cm–1. The results obtained for salicylic acid/NaMMT samples (Figure 5c, d) were very similar to those obtained for samples containing KMMT. Results for KMMT and NaMMT suggest that a single salicylic acid environment characterized by a relatively high degree of hydrogen bonding interactions was replaced by at least two new environments characterized by fewer hydrogen bonding interactions when water was driven from these samples.
Difference spectra obtained by subtracting the ambient temperature VT-DRIFTS spectrum from the spectrum obtained at 60 ℃ for samples consisting of (a) 10% benzoic acid, (b) 11% salicylic acid, and (c) 15% acetylsalicylic acid adsorbed on the designated clays. The dotted line denotes 3200 cm–1.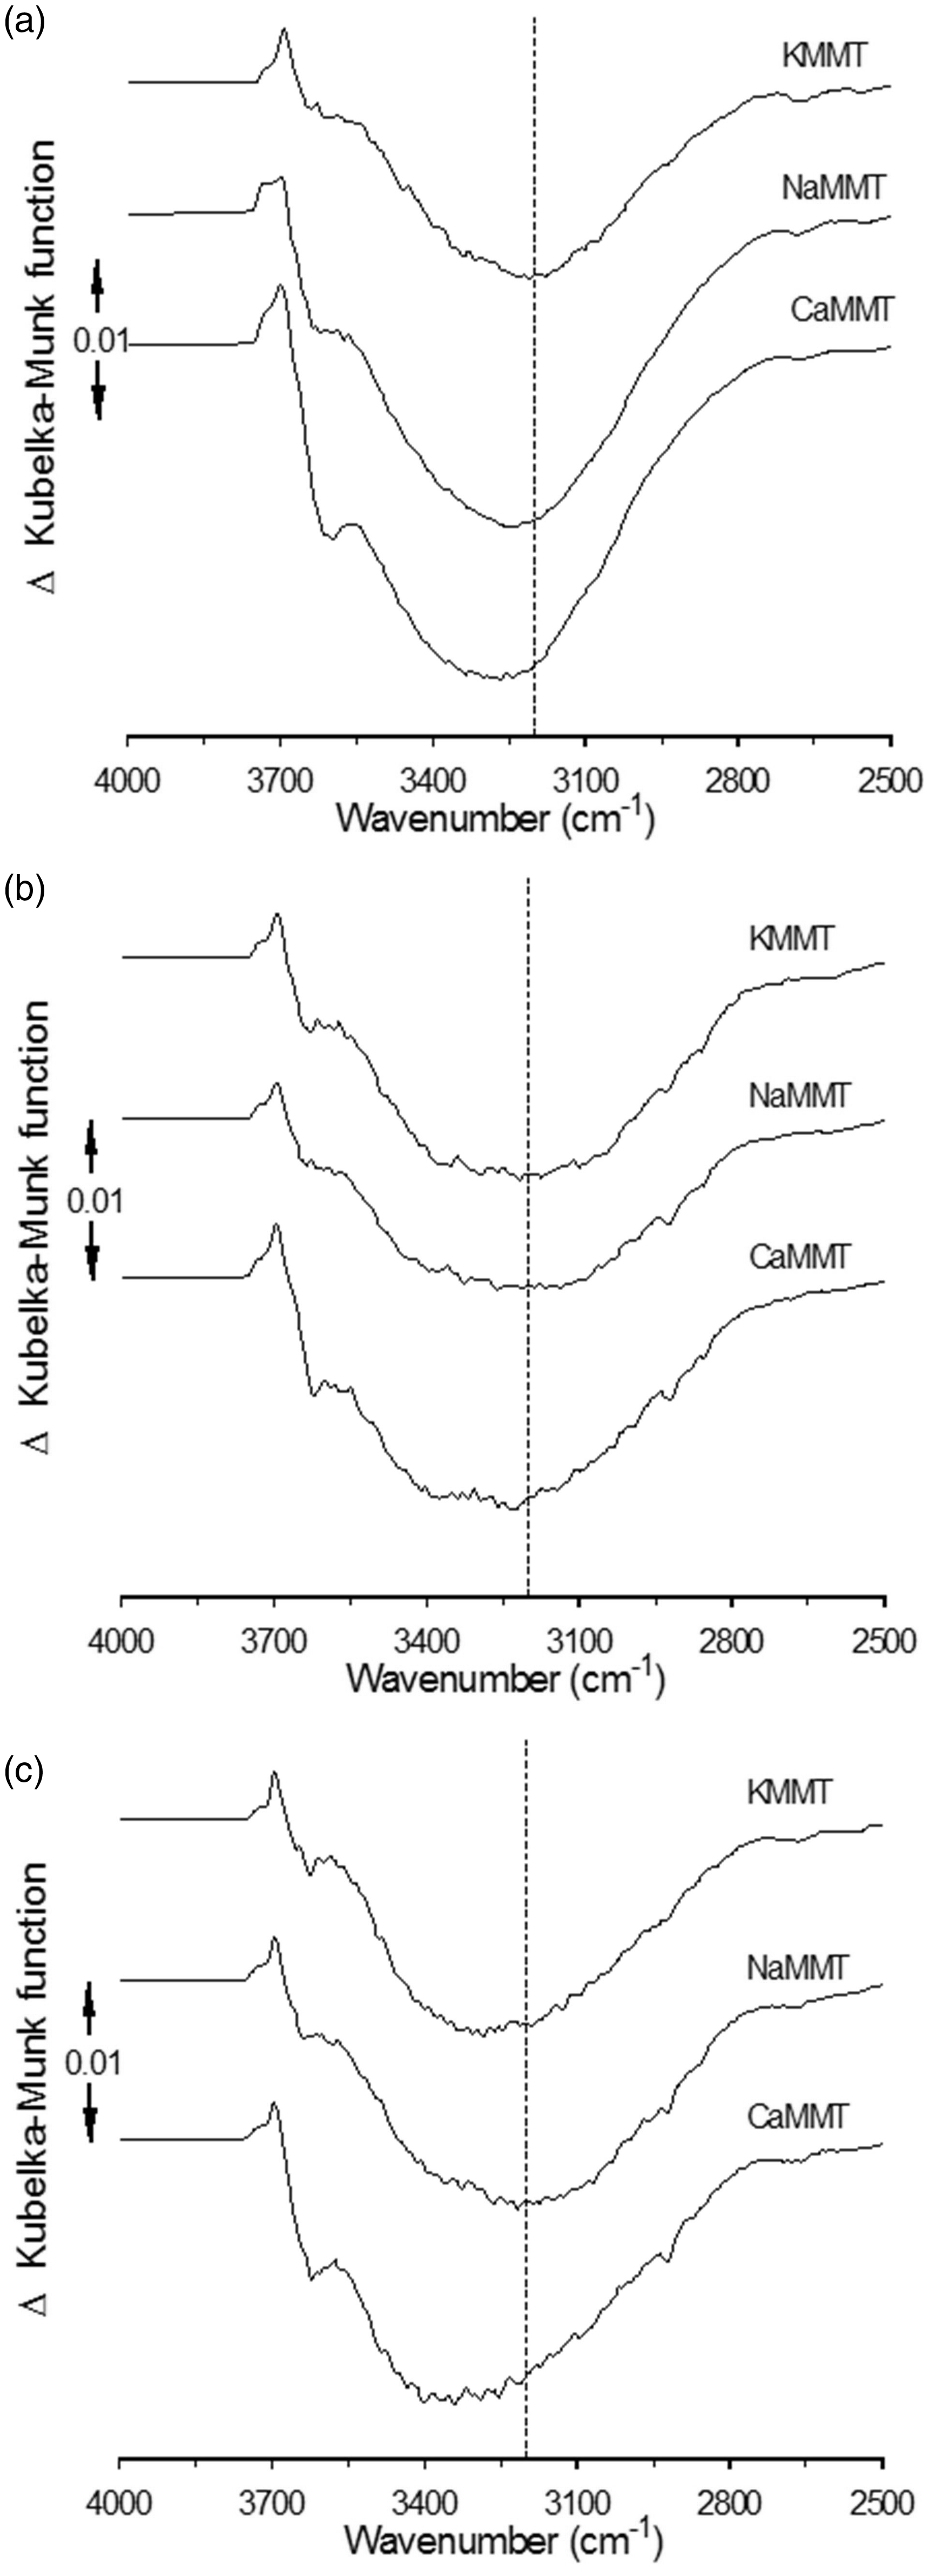
Results obtained for salicylic acid/CaMMT samples with loadings of 3.4% and 5.6% (Figure 5e) were similar to those obtained for samples containing KMMT and NaMMT. However, for the sample containing 11% adsorbate, the positive –C = O stretching band contribution at 1687 cm–1 was much greater than the higher wavenumber contribution. Figure 5f shows that this effect was observed throughout sample dehydration. Apparently, compared to the samples with 3.4% and 5.6% salicylic acid loadings, the higher 11% loading caused a change in adsorbate environment after dehydration that was characterized by a dramatic increase in absorption at 1687 cm–1.
The shapes of difference spectra obtained for acetylsalicylic acid/KMMT samples (Figure 6a, b) were similar to those obtained for salicylic acid/KMMT samples (Figure 5a, b), exhibiting a single negative –C = O band and two overlapping positive features at higher wavenumbers. However, the negative band (1698 cm–1) and the overlapping positive features (1772 and 1738 cm–1) were located at higher wavenumbers. This may be explained by the fact that acetylsalicylic acid molecules cannot form intramolecular hydrogen bonds like salicylic acid. The lack of this hydrogen bonding contribution would lead to higher –C = O stretching band wavenumbers for acetylsalicylic acid compared to salicylic acid. Results obtained for acetylsalicylic/NaMMT samples (Figure 6c, d) were similar to those obtained for acetylsalicylic acid/KMMT samples, except that the positive features consisted of three overlapping contributions (1774, 1756, and 1734 cm–1). Like the results obtained for samples containing KMMT, the relative intensity for the low wavenumber positive band component increased with increasing adsorbate loading and the negative feature relative intensity did not change with temperature as much as the overlapping positive features for samples containing 15% adsorbate. In fact, increased intensity for the positive band canceled some of the negative band intensity for the 15% sample loading, causing it to be smaller and appear to shift to a lower wavenumber relative to the 7.5% loading results. Negative –C = O stretching bands in temperature-dependent spectra obtained for the 15% acetylsalicylic acid/NaMMT sample were much broader and less well defined than those obtained for the samples containing 4.4% and 7.5% adsorbate. Thus, for sample loadings below 15%, –C = O stretching band shape changes were consistent with a single initial adsorbate environment that became multiple environments after dehydration. In contrast, 15% sample loading results suggested that many adsorbate environments existed at ambient temperature, but that they transitioned into environments with adsorbate interactions similar to those detected for the lower adsorbate loadings after dehydration.
Difference spectra obtained by subtracting the ambient temperature VT-DRIFTS spectrum from the spectrum obtained at 60 ℃ for samples consisting of (a) 10% benzoic acid, (b) 11% salicylic acid, and (c) 15% acetylsalicylic acid adsorbed on the designated clays.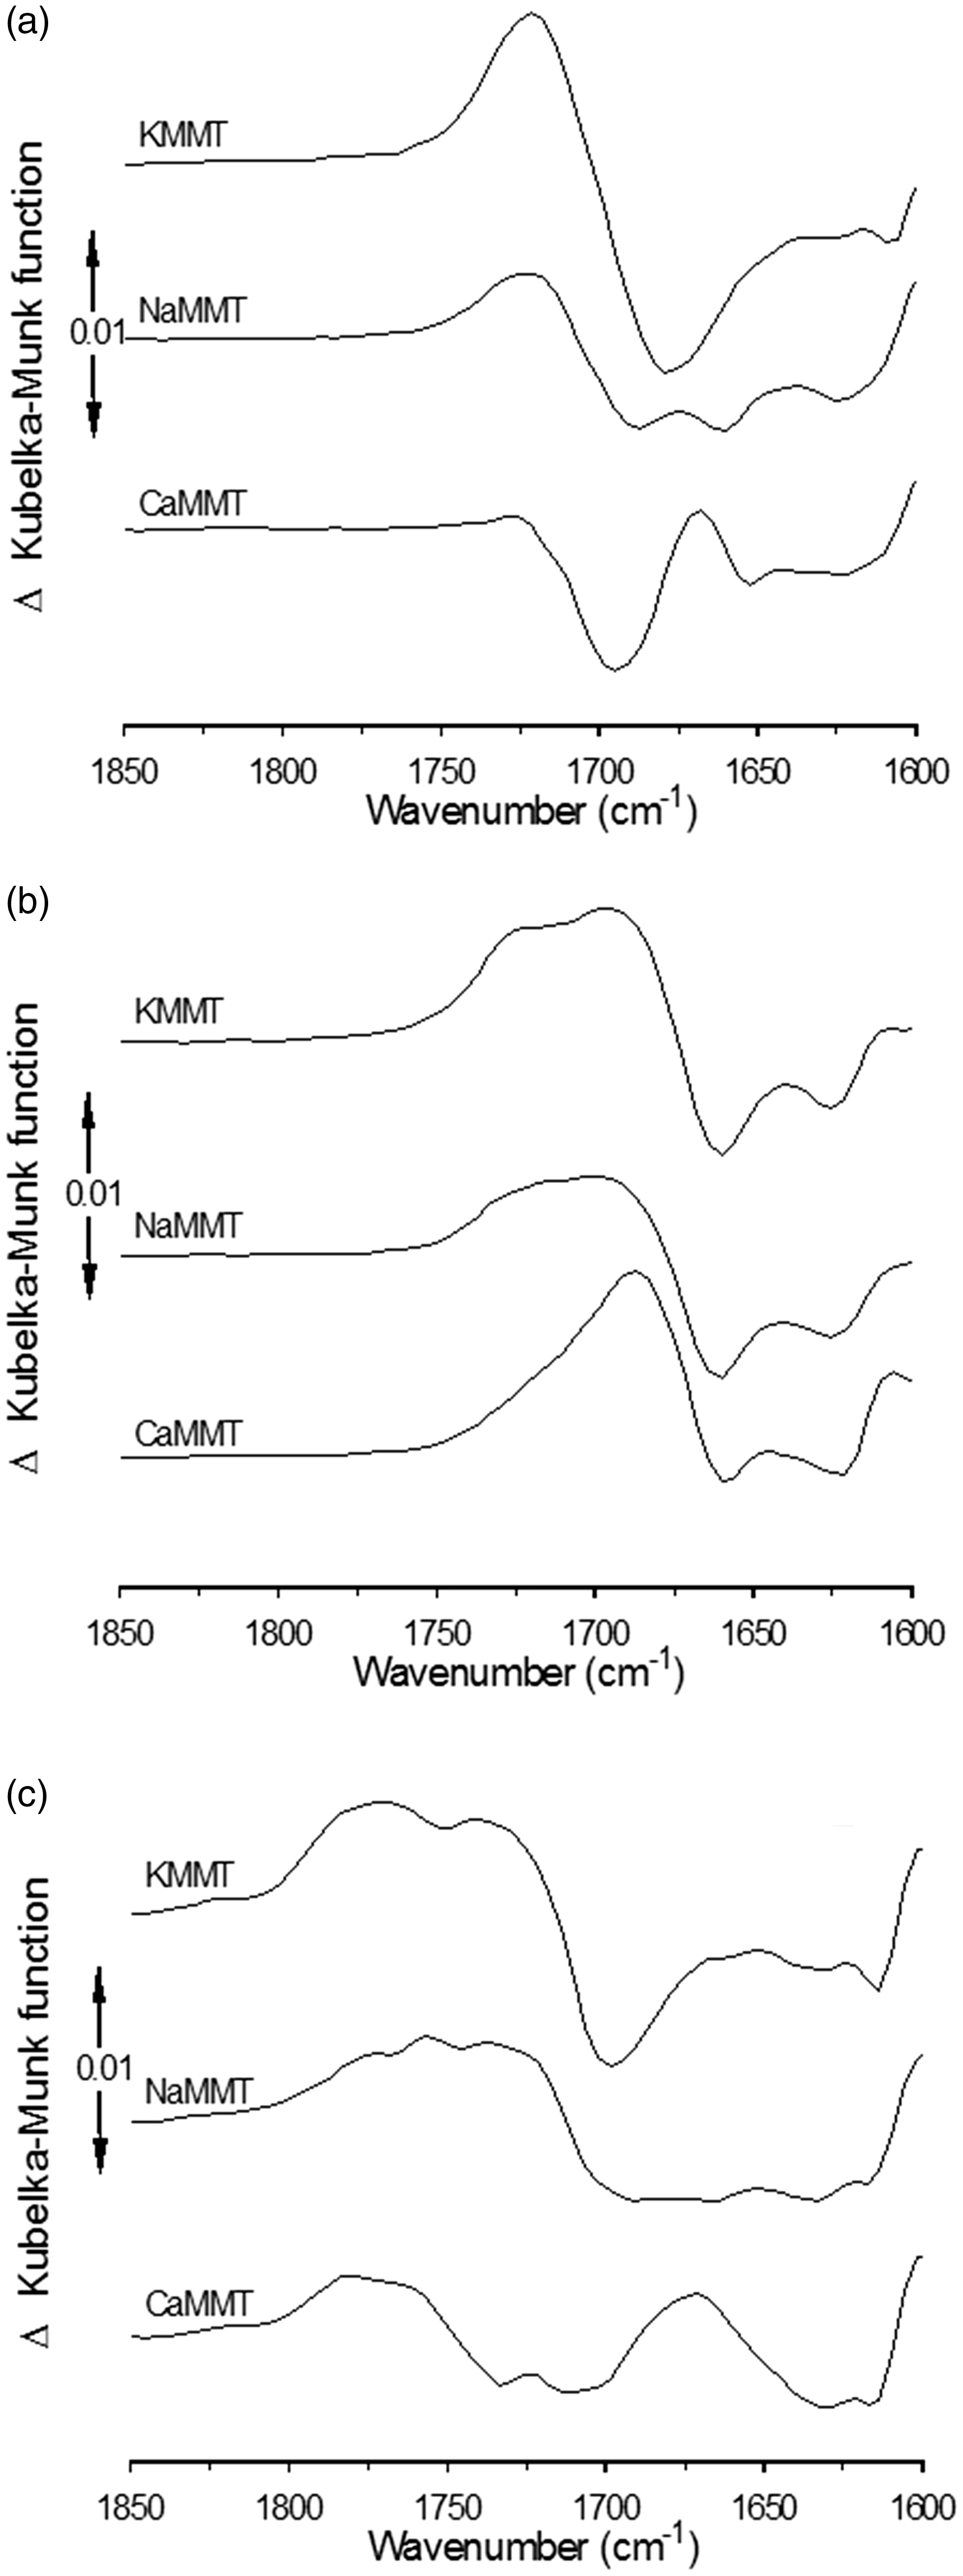
Overall, trends in difference spectra found for acetylsalicylic acid/CaMMT samples were similar to those observed for benzoic acid/CaMMT samples. Overlapping broad positive bands in difference spectra canceled much of the negative –C = O stretching bands, leaving residual positive intensity on either side of the negative bands. This effect was more dramatic for the acetylsalicylic acid/CaMMT samples than for the benzoic acid/CaMMT samples. Figure 6f difference spectra contain small positive bands near 1720 cm–1 superimposed on negative –C = O bands. The maximum of this positive residual shifted to higher wavenumber with increasing temperature.
Figure 7 shows –O–H stretching difference spectra results derived from samples containing the highest adsorbate loadings on each clay. Whereas band minima were found near 3400 cm–1 for neat clay samples (Supplemental Material Figure S1), minima for samples containing KMMT and NaMMT were about 200 cm–1 lower (dotted line at 3200 cm–1). For samples containing CaMMT, minima occurred at slightly higher wavenumbers, but were still below 3400 cm–1. With the exception of the benzoic acid/NaMMT sample, the 3740 cm–1 positive feature intensity was greatly reduced in difference spectra. This suggests that the neat clay inorganic oxide hydroxyl groups that lost hydrogen bonding partners and consequently shifted maximum band absorption to 3740 cm–1 remained hydrogen bonded at 60 ℃ when samples contained adsorbate. It is likely that these hydroxyl groups preferentially hydrogen bonded to adsorbate rather than water molecules. For each adsorbate, results obtained for samples containing KMMT and NaMMT were the most similar, and broad negative band minima occurred at higher wavenumbers in spectra obtained for samples containing CaMMT compared to the other clays. This trend may be associated with the fact that CaMMT contains a divalent cation whereas KMMT and NaMMT cations are monovalent. Alternatively, the shift to higher wavenumber for samples containing CaMMT may be associated with the higher water content of CaMMT compared to KMMT and NaMMT. Thus, a larger fraction of the adsorbate/CaMMT sample interlayer water molecules may occupy environments that are more similar to those in neat CaMMT.
Figure 8a shows overlays of difference spectra spanning the –C = O stretching band range for samples containing the highest benzoic acid loadings on each clay. Although the –C = O stretching band center locations before (i.e., at ambient temperature) and after (i.e., at 60 ℃) sample dehydration for the benzoic acid/KMMT sample cannot be determined accurately from the difference spectrum derivative shape, the minimum wavenumber for the band maximum before water loss was 1678 cm–1 and the maximum band center wavenumber after the shift was 1720 cm–1. For the sample containing benzoic acid adsorbed on NaMMT, the negative –C = O stretching band difference spectrum component exhibited two overlapping minima at 1662 and 1687 cm–1, but the positive feature occurred at 1720 cm–1, which is the same as for the benzoic acid/KMMT sample. This suggests that there were initially two distinct benzoic acid hydrogen bonding environments which, after water desorption, adopted a hydrogen bonding environment that was similar to the dehydrated benzoic acid/KMMT sample. Compared to samples containing KMMT and NaMMT, the benzoic acid/CaMMT –C = O functionality was involved in less extensive hydrogen bonding. Therefore, the –C = O stretching vibration band wavenumber did not shift as much after dehydration.
Figure 8b shows that the –C = O stretching band shifts for samples containing salicylic acid and clays with monovalent cations (KMMT and NaMMT) were similar, but differed significantly from spectra obtained for samples containing benzoic acid (Figure 8a). Negative bands representing –C = O stretching vibrations prior to water loss exhibited minima at 1660 cm–1 for both samples. Positive spectral features were broad, extended to 1750 cm–1, and consisted of overlapping contributions, suggesting that salicylic acid molecules adopted at least two different environments after water desorption. For the salicylic acid/CaMMT sample, the negative –C = O stretching band minimum also appeared at 1660 cm–1. However, unlike the monovalent cation clays, the blue shift due to water loss resulted in a sharper feature with maximum intensity at 1687 cm–1. Thus, salicylic acid samples exhibited the same general trend as the benzoic acid samples, in which the –C = O stretching vibration band shift was less when divalent Ca2+was present compared to K+ and Na+.
Difference spectra representing –C = O stretching band changes resulting from heating clay samples containing acetylsalicylic acid are shown in Figure 8c. The negative –C = O stretching band location for the sample containing KMMT was at 1698 cm–1, which was much higher than in difference spectra obtained for benzoic acid and salicylic acid. This indicates that acetylsalicylic acid –C = O functionalities affected by the water loss were involved in less extensive hydrogen bonding than either benzoic acid or salicylic acid. Like the results obtained for salicylic acid, the positive difference spectrum feature representing adsorbate environments after dehydration consisted of at least two broad overlapping features. However, the positive band intensity extended to higher wavenumbers (1800 cm–1) compared to the corresponding salicylic acid/KMMT spectrum (1750 cm–1). Peak maxima for the two overlapping band components occurred at 1740 and 1770 cm–1. Thus, compared to benzoic acid and salicylic acid, acetylsalicylic acid was involved in weaker hydrogen bonding interactions before water desorption and adopted orientations that also involved weaker hydrogen bonding interactions after dehydration. Results obtained for acetylsalicylic acid adsorbed on NaMMT were qualitatively similar to those for the KMMT sample, except that the negative –C = O stretching band was very broad. The difference spectrum obtained for the sample containing acetylsalicylic acid and CaMMT contained overlapping negative features with minima at 1710 and 1732 cm–1 corresponding to –C = O stretching vibrations that were lost due to sample dehydration. The corresponding overlapping positive –C = O stretching bands were located at 1760 and 1780 cm–1. Thus, the difference spectrum for the acetylsalicylic acid/CaMMT sample indicated that adsorbate hydrogen bonding interactions were weaker for this adsorbate/clay combination than for any of the others.
Liquid water is characterized by a dynamic hydrogen bonding network in which typical molecules participate in two to four hydrogen bonds.29–32 However, the properties of confined water, such as within clay interlayer spaces, differ from the bulk liquid. 29 In particular, cation hydration sphere characteristics are significantly perturbed when water molecules are restricted to movement in two dimensions.33,34 Clay interlayer water molecules can be categorized into three types of local environments. Some molecules are found near inorganic oxide layers, some occupy cation hydration spheres, and others fill voids. 35 In addition to interactions between water molecules and inorganic oxide surfaces or cations, interlayer water molecules participate in hydrogen bonding with other water molecules. The broad negative –O–H stretching bands in neat clay VT-DRIFTS difference spectra (Supplemental Material Figure S1) reflect the net results of changes to interlayer water molecules caused by heating samples from ambient temperature to 60 ℃. Much of this negative band intensity can be attributed to water molecule desorption. However, –O–H stretching band properties can change for the water molecules that remain with the clay due to changes in hydrogen bonding and variations in the strengths of interactions with inorganic oxide layers and cations. In fact, the positive difference spectra features at 3696 and 3740 cm–1 are evidence of a disruption of interactions between water molecules and inorganic oxide hydroxyl groups. Thus, loss of water molecules during sample heating initiates a reorganization of the remaining interlayer water molecules. The similarity of difference spectra shapes in Supplemental Material Figure S1 suggests that mechanisms for water desorption and subsequent interlayer water reorganization are similar for the three clays, even though they initially contain different quantities of interlayer water.
The structures of benzoic, salicylic, and acetylsalicylic acids contain aromatic acid functionalities (Figure 1). All three adsorbates readily form dimers by hydrogen bonding through these groups.36–39 These aromatic carboxylic acid functionalities also participate in hydrogen bonding with interlayer water molecules and inorganic oxide hydroxyl groups. 40 In addition, the hydroxyl and acetyl groups in salicylic and acetylsalicylic acids provide additional sites for hydrogen bonding.36,40 When placed within montmorillonite interlayer spaces, these adsorbates disrupt the hydrogen bonding network, which affects water molecule –O–H stretching band properties. In general, hydrogen bond formation alters –O–H stretching band characteristics by increasing absorptivity (i.e., intensity), increasing bandwidth, and shifting absorption maxima to a lower wavenumber.41–43 Comparing difference spectra in Figure 7 with those in Supplemental Material Figure S1 reveals that the presence of adsorbate molecules caused a general shift in water molecule –O–H stretching bands to a lower wavenumber, confirming that hydrogen bonding interactions were enhanced.
Whereas variations in –O–H stretching vibration wavenumbers provided information regarding trends in water molecule hydrogen bonding interaction strengths, shifts in –C = O stretching vibration wavenumbers provided specific information regarding changes in adsorbate local environments. Results shown in Figure 8 indicate that the salicylic acid –C = O functionality is involved in greater hydrogen bonding interactions compared to the other two adsorbates. This is most likely due to intramolecular hydrogen bonding between the aromatic hydroxyl functionality and the carboxylic acid group. 36 This intramolecular hydrogen bonding is also apparent after sample dehydration, resulting in positive –C = O stretching band features that occur at lower wavenumbers than for the other adsorbates.
Conclusions
Variable temperature DRIFTS difference spectra reveal information regarding changes in sample functional groups caused by clay dehydration. Negative difference spectrum features derive from: water loss, decreasing functional group absorptivity, and shifts in vibrational frequencies. Positive difference spectrum features characterize new environments created after water removal. In the –O–H stretching vibration region, water loss, which reduces the number of absorbers in the sample, was a main contributor to negative difference spectra bands. However, variations in hydrogen bonding for water molecules remaining within the interlayer space also contributed to these negative bands. Furthermore, –O–H stretching vibration frequencies for water and adsorbate molecules that lost hydrogen bonding partners due to dehydration were blue shifted, resulting in positive difference spectra features that were not apparent because of the greater intensity of overlapping negative bands. Thus, the broad negative bands shown in Supplemental Material Figure S2 and Figure 7 represent net changes from overlapping positive and negative contributions. These band shapes were similar for the neat clays (Supplemental Material Figure S1), suggesting that the interlayer space changes caused by dehydration were similar. When adsorbate was present, –O–H stretching vibration difference band minima shifted to a lower wavenumber (Figure 7) due to increased hydrogen bonding opportunities. Although no significant band shape difference was discerned for neat samples, spectra in Figure 7 derived from samples containing Ca2+ exhibit a blue shift relative to spectra obtained for samples containing the same adsorbate and monovalent cations. This suggests that Ca2+ interfered with hydrogen bonding more than K+ or Na+, possibly due to stronger electrostatic interactions with ionic hydration sphere water molecules.
The –C = O stretching vibration region of difference spectra provided information regarding changes to adsorbate molecules that resulted from water loss. Band shape changes and vibration frequency shifts can be attributed to changes in hydrogen bonding. Like the –O–H stretching vibration results, –C = O stretching vibration regions in difference spectra represented the net results of overlapping positive and negative features. In some instances, simple peak shifts produced characteristic derivative band shapes. More complicated spectra resulted when multiple overlapping features were present or when bandwidths changed along with band locations. To varying degrees, difference spectra shapes depended on adsorbate loadings. In general, higher loadings facilitated greater adsorbate–adsorbate interactions. However, for a given loading, difference spectra shapes were consistent as temperature increased, suggesting that the interactions associated with varying loadings were maintained throughout sample dehydration. The positive and negative band multiplicities evident in Figures 4–6 difference spectra are indicative of distinct adsorbate environments. Results show that adsorbate local environment diversity was dependent on adsorbate loading and cation charge, with greater diversity associated with monovalent interlayer cations.
Results described here demonstrate the utility of VT-DRIFTS for discerning subtle changes caused by sample perturbations. Difference spectra represent only those functional groups affected by heating. For samples containing the lowest adsorbate loadings, difference spectrum absorption band maxima (or minima) were typically less than 10% of ambient temperature absorption intensities. Thus, difference spectra features represented local environment changes for at most 6 nmol quantities of adsorbate in each VT-DRIFTS sample. Overlapping spectral features characterized changes to adsorbate environments caused by sample dehydration and provided information regarding the hydrogen bonding environments of adsorbate and clay interlayer water molecules. Development of detailed adsorption site models will require additional information from complementary analysis methods. In addition, vibration frequencies derived from molecular modeling calculations may be necessary to substantiate predicted adsorption site orientations.