
Abstract
Spectral analysis is one of the main non-destructive techniques used to examine cultural relics. Hyperspectral imaging technology, especially on the shortwave infrared (SWIR) band, can clearly extract information from paintings, such as color, pigment composition, damage characteristics, and painting techniques. All of these characteristics have significant scientific and practical value in the study of ancient paintings and other relics and in their protection and restoration. In this study, an ancient painting, numbered Gu-6541, which had been found in the Forbidden City, served as a sample. A ground-based SWIR imaging spectrometer was used to produce hyperspectral images with high spatial and spectral resolution. Results indicated that SWIR imaging spectral data greatly facilitates the extraction of line features used in drafting, even using a single band image. It can be used to identify and classify mineral pigments used in paintings. These images can detect alterations and traces of daub used in painting corrections and, combined with hyperspectral data analysis methods such as band combination or principal component analysis, such information can be extracted to highlight outcomes of interest. In brief, the SWIR imaging spectral technique was found to have a highly favorable effect on the extraction of line features from drawings and on the identification of colors, classification of paintings, and extraction of hidden information.
Introduction
In the long river of history, human beings have created many splendid artistic objects, and painting is an important form of artistic expression of Chinese civilization. Paintings number among the great treasures of Chinese art. The history of painting in China dates back to ancient times, through the late Qing Dynasty, covering a period of over four thousand years. Ancient paintings include everything from Neolithic pottery and prehistoric rock painting with patterns and decorations, painted bronzeware from the Shang and Zhou Dynasties, silk paintings from the Warring States period and Western Han Dynasty, original lacquer paintings from the Qin Dynasty, Qin and Han Dynasty tomb murals, portraits on brick and woodcut from the Han Dynasty, and the famous silk and paper paintings that have been made by famous painters since the beginning of the Six Dynasties. These categories of paintings form the long and uninterrupted history of Chinese painting, and they have impressed many viewers with their profound brilliance. 1
The extraction of line information from ancient cultural relics, characterization of pigment composition, and the search for hidden information are of great significance to the research, protection, and restoration of ancient paintings. 2 Currently, non-destructive testing of ancient paintings depends mainly on spectral analysis technology.3,4 Multi-spectral and hyperspectral analysis technology can provide analysts with a deeper, clearer, and more intuitive understanding of the color, damage characteristics, pigment composition, and techniques used to make the painting.5,6 For a long time, multi/hyperspectral imaging research focused on the field of remote sensing. In recent years, however, scholars have recognized the practical value of multi/hyperspectral imaging technology in the study of cultural relics, and many useful results have been reported. Prior studies of paintings using fiber optic spectrometers have a good foundation for artwork analysis using spectra from the visible/near infrared to shortwave infrared (SWIR).7–10 As the imaging spectrometer technology rapid improved, it has successfully demonstrated the benefits for the study of artworks. The wavelengths used by multi/hyperspectral imaging techniques are mainly concentrated in the visible/near infrared band (400–1000 nm).11–14 In recent years some researchers have noticed the important imaging spectral characters at 1000–1700 nm.15–19 This paper mainly focuses on the use of SWIR wavelengths (especially 1700–2500 nm).
Shortwave infrared is infrared with bands of 1000 nm to 2500 nm. The light reflected by materials show different spectral characteristics in the SWIR band.
20
These provide direct and effective techniques for applications such as identifying lines in drawings and the pigments in ancient paintings. The imaging spectrum data acquired by SWIR ground spectral imaging systems have a high spatial resolution and a high spectral resolution at the same time. This is conducive to finding objects on the Earth’s surface using texture and spectral analysis, which is especially suitable in close-range photogrammetry.
21
In this study, an ancient Chinese painting was used as an example. Its imaging spectrum data were obtained at a wavelength of 1000–2500 nm using a ground-based SWIR imaging spectrometer. The features of line sketches such as the original line draft can be directly extracted from a single band image, without any data processing work. Using hyperspectral image processing techniques, such as band combination, image enhancement, and transformation, certain pigment colors and hidden information can be enhanced for effective extraction. The SWIR imaging spectrometer may play an important role in the production of digital archives and in the analysis and restoration of cultural relics, and so promote the development of digital work associated with cultural relics.
Ancient painting from the Qing Dynasty stored in the Forbidden City (No. Gu-6541).
Methods and Materials
Ancient Painting Samples
The ancient painting in the present study is currently stored in the Forbidden City and numbered Gu-6541. When it was first discovered, it was called “Wanshou painting for Yongyan (seventh emperor of the Qing Dynasty) by an artist from the Qing Dynasty.” Shu Lin from the Palace Museum compared the image to historical archives from the Qianlong period and concluded that this image was painted for the 80th birthday of the Empress Dowager Chongqing by an artist named Wenhan Yao. The painting is 219 cm long and 285 cm wide, painted on colored silk. The picture was mounted on four sides with blue damask silk using a method called Tieluo. The frame is 232.5 long and 286.5 cm wide. The image in the picture can be considered in two parts. The first part depicts seven main halls facing south, and covered with glazed tiles. The main figure is an elderly woman wearing Qing Dynasty robes, a phoenix coronet, and earrings decorated with golden dragons holding beads in their mouths. The woman sits up straight on the throne in front of a folding screen. The second part is a carving painted to show a yellow cloth pavilion in the middle. A long table with tuoni, a traditional decoration, is set in the pavilion. There are also zun (drinking cups), golden lei (ancient urn-shaped vessels), golden zhi (ancient wine vessels), and golden jue (drinking vessels) and goblets for serving wine. Several realistic figures are present in the picture, providing abundant content. The realistic drawing style establishes that this is a documentary painting, and its historical value is significantly greater than its artistic value. 22
Shortwave Infrared Imaging Spectrometer and Data Acquisition
A ground-based SWIR imaging spectrometer was used as the measuring instrument in this research. Figure 2b shows the SWIR imaging spectrometer system. The figure shows a scanning mirror, infrared imaging lens, spectral light splitter, and HgCdTe infrared detector.
23
The detector has 320 × 256 pixels. The swinging scanning mirror is driven by an electric motor, and it sweeps back and forth to spectrally image the sample in the field of view. Infrared imaging uses lenses in the SWIR range, which match the spectral range of optical splitters and detector. The optical splitter is a SWIR PGP((prism–grating–prism) manufactured by Specim Spectral Imaging Ltd. (Finland) with a spectral range from 1000–2500 nm and slit width of 30 nm. The spectral resolution of the splitter is about 10 nm. The field of view is less than 2.0 mrad. Because SWIR imaging is very sensitive to changes in temperature, the panel detector uses four stage semiconductor refrigeration to cool the photosensitive surface of the detector. Temperatures of 80° C below ambient can be reached. An iron loop was fixed to the external side of the PGP splitter component and its top was connected to the photography tripod, which was used to fix the overall system.
Photograph and schematic diagram of the SWIR imaging spectrometer system.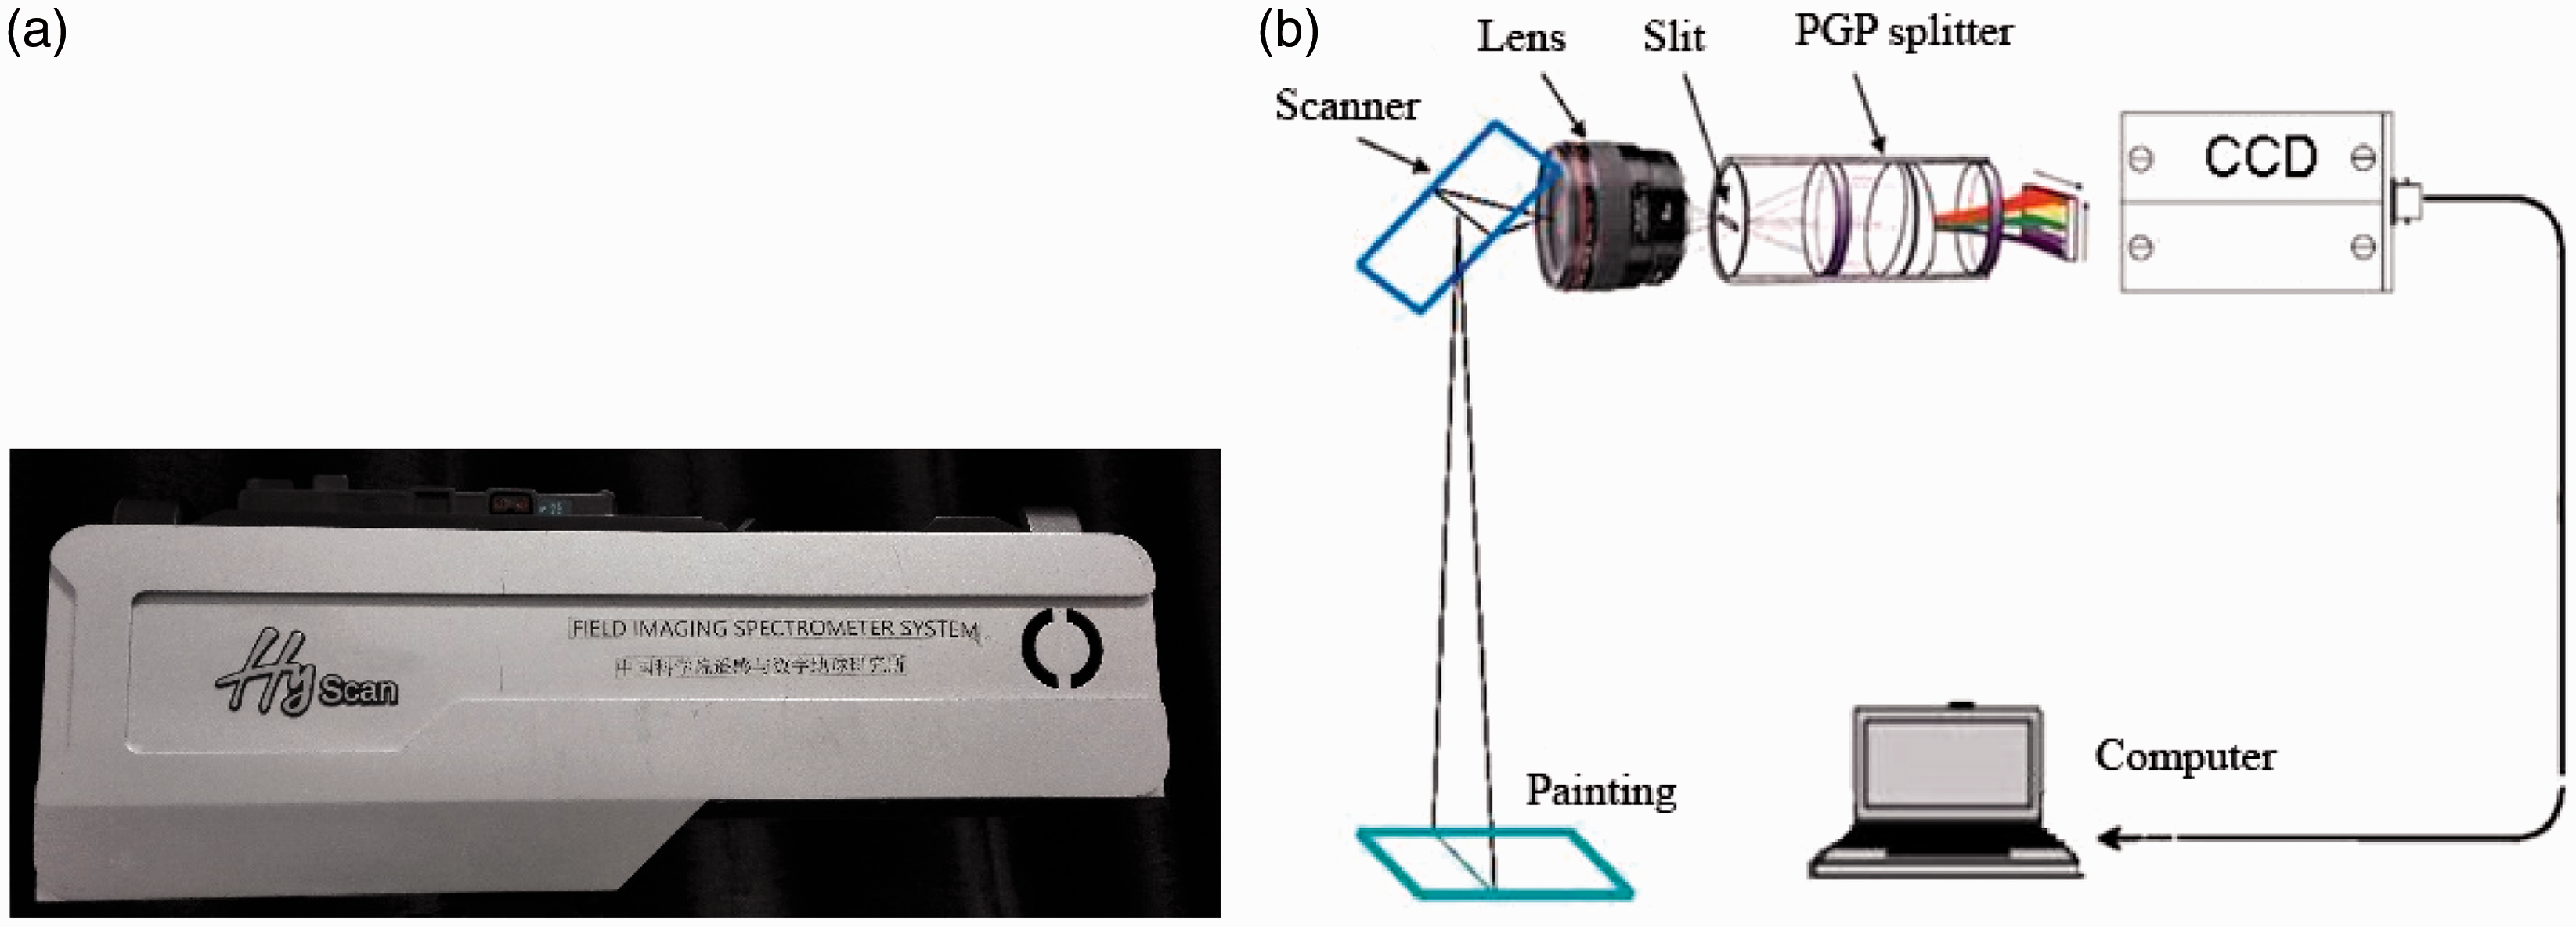
Figure 2b shows the principle underlying the use of the SWIR imaging spectrometer system. The light signal reflected from each ground object entered the objective lens through the reflection from the front mirror, and the light was collected and focused on the slit on the front end of the PGP splitter. Optical signals other than those from the ground sample were blocked by the slit, and spectral resolution was determined collectively by the slit and by the components of the splitter and detector. The light passing through the slit was collimated by the lens in the PGP splitter and the incident light was directed to the prism grating light splitter. After dispersion, light of different wavelengths was distributed to different physical locations. With the convergence of the focusing lens in the PGP optical device, an image forms on the photosensitive surface of the detector array, and spatial dimension information of ground objects can be determined parallel to the direction of the slit, and spectral dimension information of the ground objects can be found vertical to the direction of the slit. The spectral data acquired by the surface array detector is transmitted to the notebook computer for processing, display, and storage. The SWIR data achieved with this system provided “image-spectrum combined” information. Ground measurement provided not just high-resolution images of the object, but also the spectral curve of each pixel in the image. This method increases the work efficiency of field surface spectrum measurement and provides abundant data information for spectral analysis, spectral decomposition, and the extraction of pure pixels.24,25
The data acquisition process is described briefly as follows. The painting was hung on a wall and a halogen lamp served as a light source. The SWIR imaging spectrometer was placed parallel to the picture during the scan. A standard diffuse reflection plate served as the standard during the experiment to calculate reflectance. The data acquisition was based on a self-developed data acquisition program.
Data Analysis Method
Reflectance Correction
The scanned hyperspectral imaging data is a raw digital number (DN) image and can be transferred as a radiance image. Radiance cannot be used directly for spectral analysis because illumination depends on the time of day and meteorological conditions. It first needs reflectance correction.
For Lambertian surfaces, as a first approximation, radiance L(λ) is the product of the target reflectance R(λ), which is intrinsic information, and the illumination during image acquisition, i.e., in this case halogen lamp lighting E(λ)

To solve for the variable of interest reflectance R, it is necessary to know the illumination. For that purpose, a calibrated Lambertian diffuser whiteboard was placed in the field of view of the imaging spectrometer. In given lighting conditions, the following is true


Spectral Angle Mapper Classification Algorithm
Supervised classification is a technique based on statistical identification, and based on a typical sample training method for classification. Spectral angle mapper (SAM), an algorithm based on the overall similarity of the spectral curve, is often used in high spectral data processing. Spectral angle mapper calculates the angle between the test spectra and reference spectrum to describe the similarity between the two. Small angles between the two spectra indicate high similarity.
27
The length (Lρ) is calculated as

The spectral angle (θ) is calculated as
Here, Lρ and Lρ′ are the length of the test spectrum and reference spectrum vector, respectively. Here, θ is the angle between the test spectrum and reference spectrum. The range of values for θ was [0, π/2], with smaller values indicating greater similarity between the test and reference spectra, which in turn indicated a higher probability and more accurate classification. The size of the spectral angle, regardless of the radiance, was related only to the vector directions of the two spectra to be compared, which diminished the effect of illuminance and landscape on the measurement of similarity.
Principal Component Analysis
Principal component analysis (PCA) can be used to reduce the dimensionality of hyperspectral imaging data without losing a significant amount of information. This can be considered to be a data compression technique that puts redundant or correlated information into separate variables. It renders the transformed vectors orthogonal and uncorrelated thus removing any co-linearity problems. 28
Principal component analysis is a linear transformation that projects data onto a new orthogonal feature space in a way that the first few components in the new feature space will represent most of the variances in the original dataset. The transformation is based on the second order statistics (covariance) of the original data. Assume that x represents the vector of a pixel’s grey value in an image of N bands. The transformation is defined as


Results and Analysis
Extraction of Line Drawing
Line drawing is the main technique used to design paintings. It forms the foundation of traditional Chinese traditional painting. Line drawing is not only an essential step in the overall drawing process but also contributes to picture composition, figure scale, light sources, and spatial relationships. Line drawing is also an important way to study the ancient painting style and painting process and prepare for protection and restoration. It is an important measure of China’s Dunhuang mural protection and restoration. However, because colored paint is added on top of most line drawings, distinguishing and extracting lines from drawings can be very difficult. The traditional line description system depends on manual operation, which despite its maturity, is a time-consuming and laborious process.
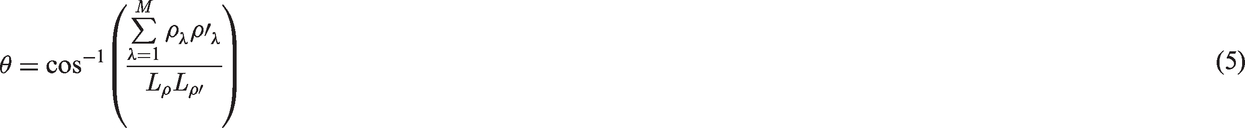
Figure 3 shows the spectral data of SWIR imaging with wavelengths ranging from 1000–2500 nm. A total of eight images were extracted, each one at intervals of about 200 nm. Figure 4 gives the spectral curves for clothes and carbon black pigment extracted from SWIR imaging spectral data, with the longitudinal coordinates representing the reflectance and the transverse coordinates representing the band. The wavelength ranged from 1000–2500 nm. The upper curve in the figure shows the spectral curve of the dark blue pigment of clothes worn by figures in the painting, and the lower curve shows the spectral curve of black pigment used for outlining the clothes.
Shortwave infrared imaging data at different wavelengths (longer wavelengths show more prominent line drafting). (a) 1002 nm; (b) 1202 nm; (c) 1403 nm; (d) 1604 nm; (e) 1804 nm; (f) 2005 nm; (g) 2205 nm; (h) 2406 nm. Shortwave infrared spectrum curves of clothes and carbon black pigment.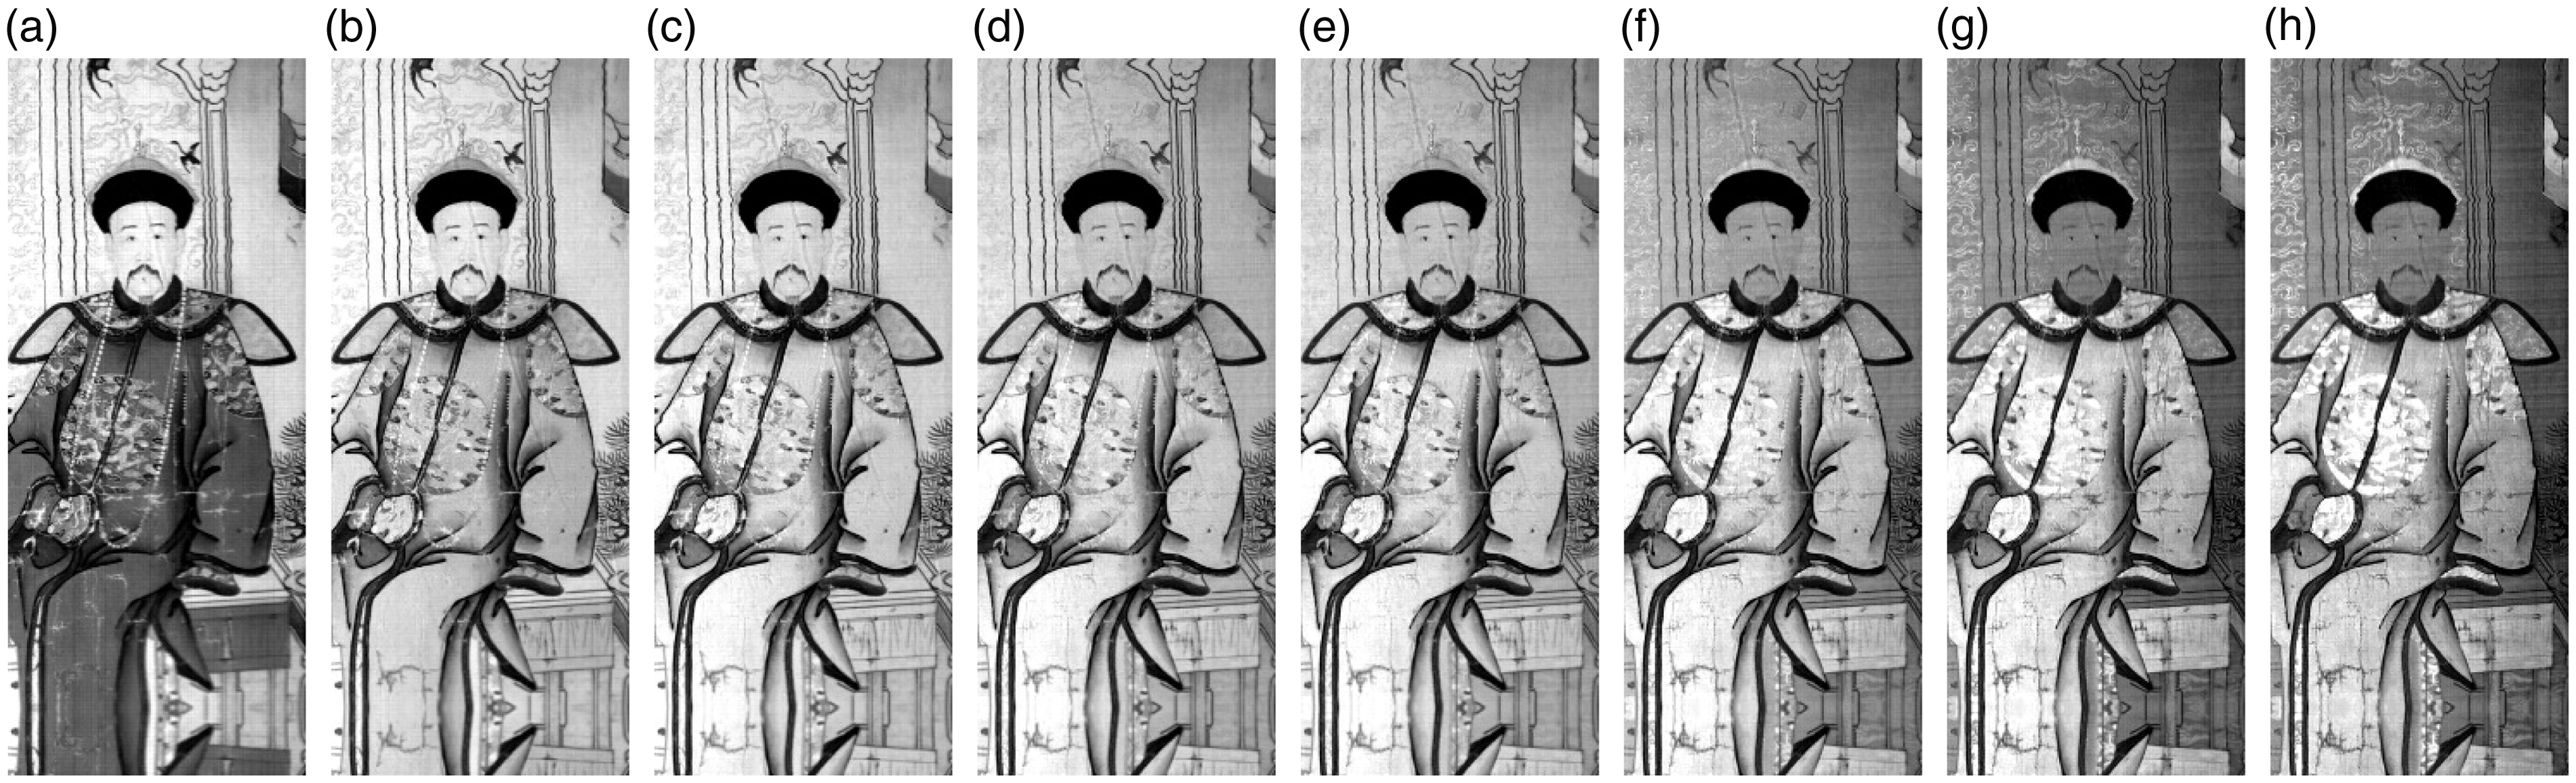
Each band image in Figure 3 shows that, as the wavelength increased, the color of the figure’s clothes transitioned from dark to light, which is consistent with the spectral curve shown in Figure 4. The spectral curve of pigment used for clothes showed increased reflectance from 1000 nm to 1400 nm, which means that the effect of the line drawing of the clothes and pigment differed across different bands. There are small change of clothes color at wavelengths 1600–2400 nm in Figure 3, but differences in expression did show the man’s chest pattern, the top of his hat, and the lower edge of the stool.
Unlike the pigments used for clothes, the black color used to outline the clothes produced a low value for all tested wavelengths and did not show any significant variation. As indicated with the lower curve in Figure 4, the black shown in all images was achieved with different wavelengths. Usually line sketches are drawn with pigments such as carbon black, which shows strong absorption along all wavelengths in SWIR. This is in contrast to the pigments with a relatively high reflection, which results in a light color in images produced with the tested wavelengths, providing a contrast marked enough to extract the lines drawn with carbon black. This also explains the physical basis of SWIR data extraction for line drafting. Figure 5 is the line drafting extraction results, which shows a SWIR image at the 1804 nm band. The relatively low values pixels are colored blue using the density slice method.
30
Density slicing is done by dividing the range of brightnesses in a single band into intervals, then assigning each interval to a color. It shows that the SWIR imaging spectral data provided a satisfactory outcome for the extraction of line drafting.
Density slice for line drafting at 1804 nm.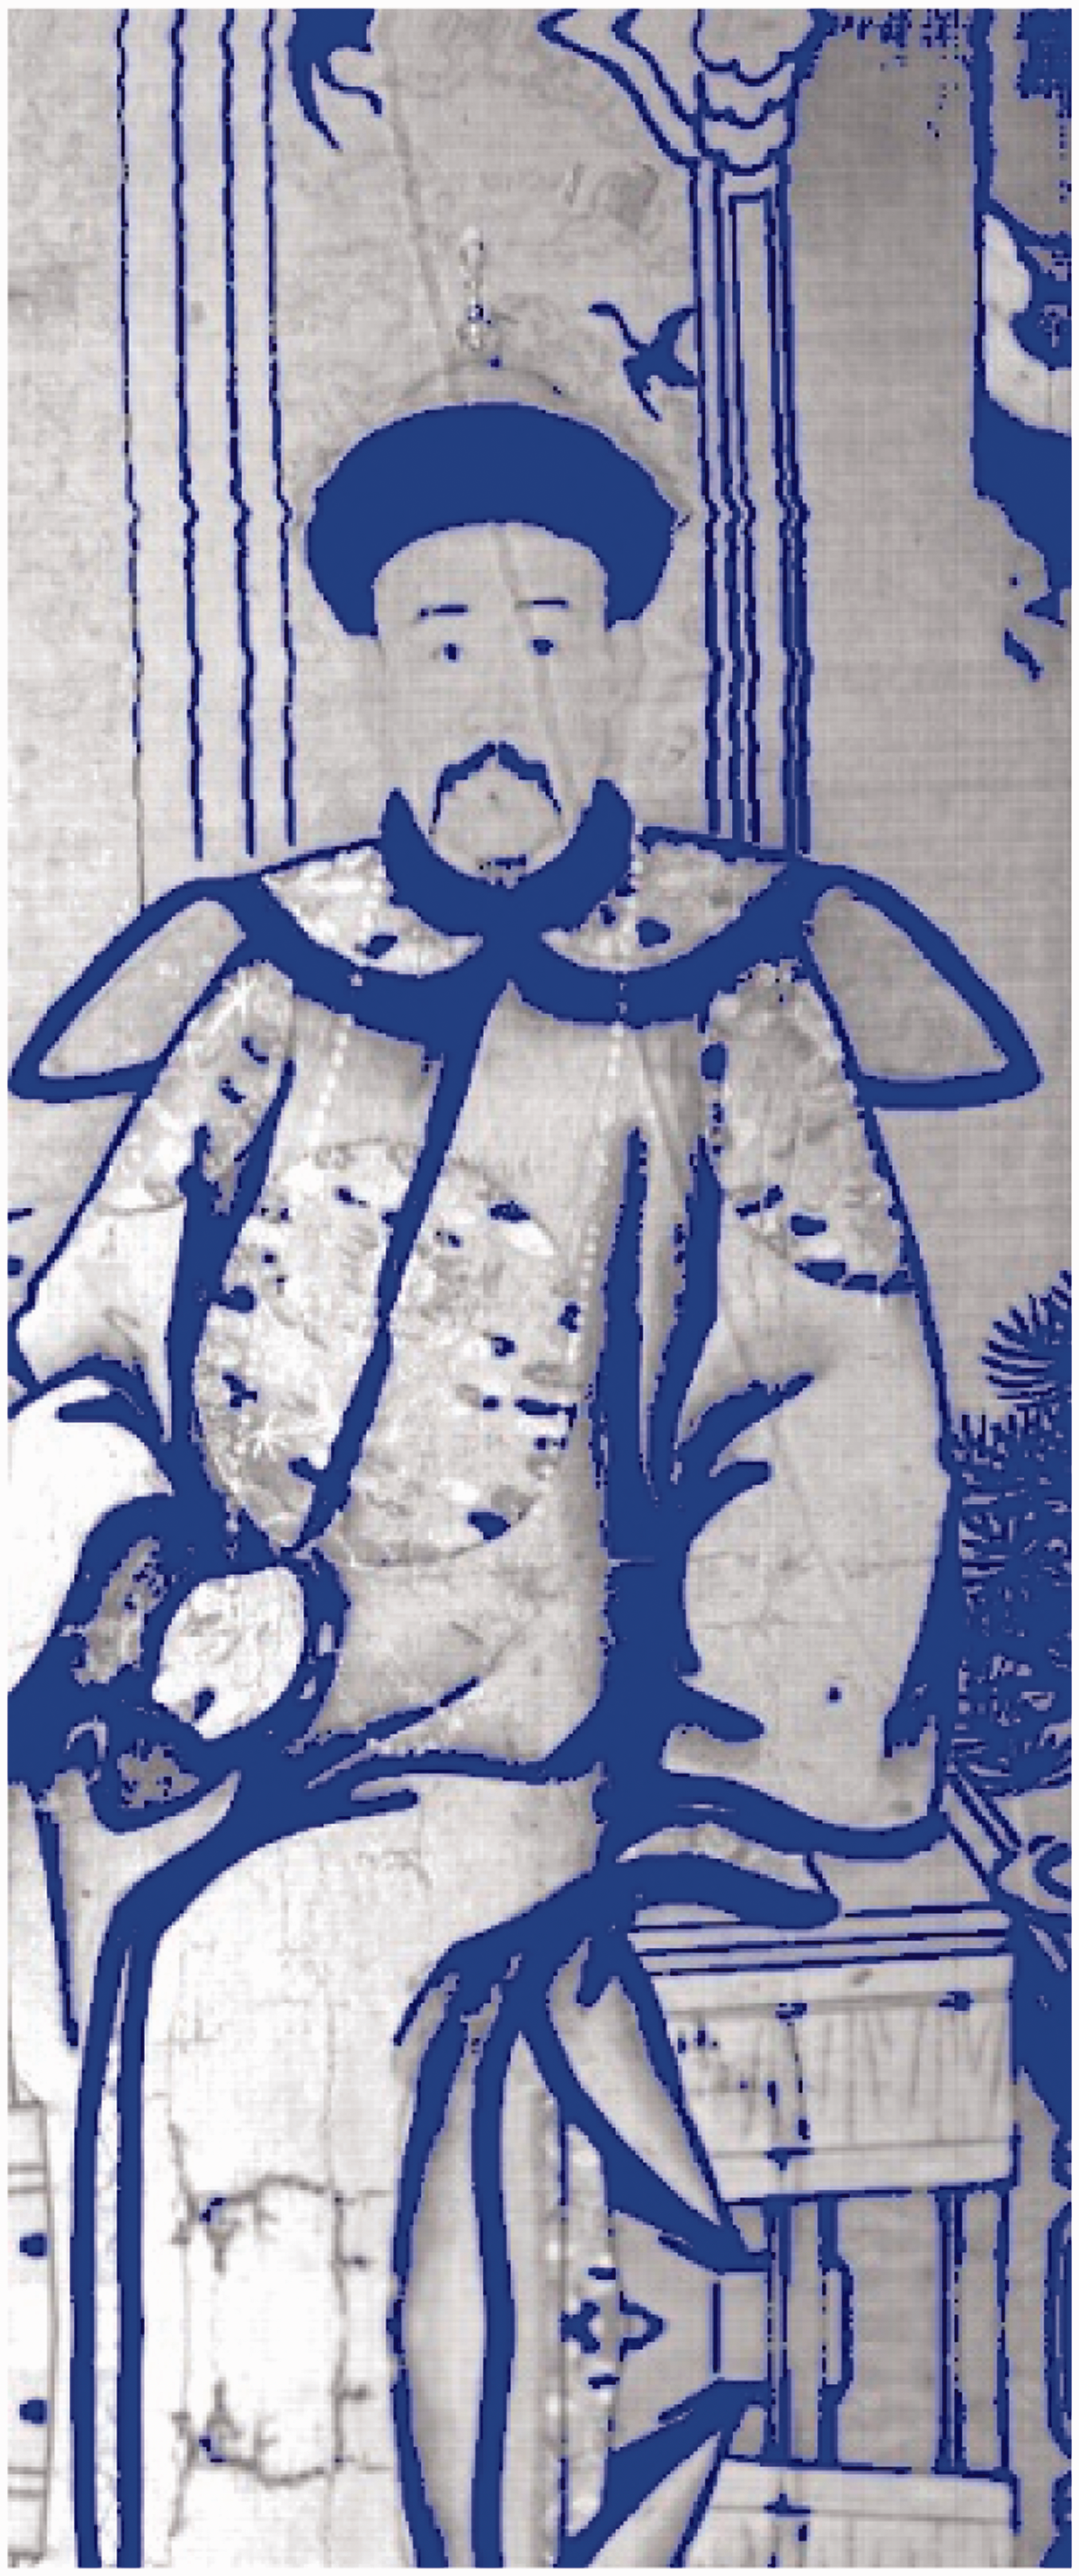
Pigment Information Extraction
Pigment is the main component of the painting. Many of the enduring colors used in traditional Chinese painting can last long into modern times, and most are made up principally from mineral ingredients.
31
For comparison, a portable ground object spectrometer (Model PSR-3500, Spectral Evolution, Lawrence, MA) was used in the study to test the spectrum ranging 400–2500 nm for multiple pigments. The SWIR spectrum (1000–2500 nm) of 12 kinds of typical Chinese painting pigments curves were measured. The pigments are cadmium yellow, clam powder, white lead, red lead, ultramarine, mineral green, azurite, khaki, realgar, iron oxide, ochre, and cinnabar. Here, the azurite and mineral green spectral measured by the SWIR imaging spectrometer and the PSR-3500 portable ground object spectrometer were chosen for comparison, as shown in Figure 6. Azurite, also known as blue copper ore, is an alkaline copper carbonate mineral with the chemical formula 2CuCO3–Cu(OH)2. The absorption valleys at SWIR were detected at 2282 nm and 2351 nm. The main cause of the formation of the three spectral absorption features is the strong absorption of hydroxyl and carbonate in a corresponding position, among which the latter two are more characteristic and more helpful in identifying azurite. Comparing the spectral curve of pigment used for clothes in Figure 4 to the PSR-3500 spectral curve in Figure 6a, the two curves fit perfectly at the two azurite absorption positions at 2282 nm and 2351 nm. The pigment used for clothes in Figure 4 can thus be identified as azurite. Figure 6b shows the continuum removed spectra of malachite
32
(mineral green, chemical formula CuCO3·Cu(OH)2). It presents a typical carbonate ion spectrum, like azurite. Its feature absorption valleys are shown at 2270 nm and 2362 nm. Because of different measurement conditions and pigment contents, the two malachite spectral shapes did not seem to fit well, but there was a good fit at malachite feature absorption positions of 2270 and 2362 nm. Thus we can be sure that the SWIR imaging spectrometer measurement was also for malachite.
Spectral comparisons between SWIR imaging spectrometer (solid line) and PSR-3500(dotted line). (a) Azurite; (b) mineral green.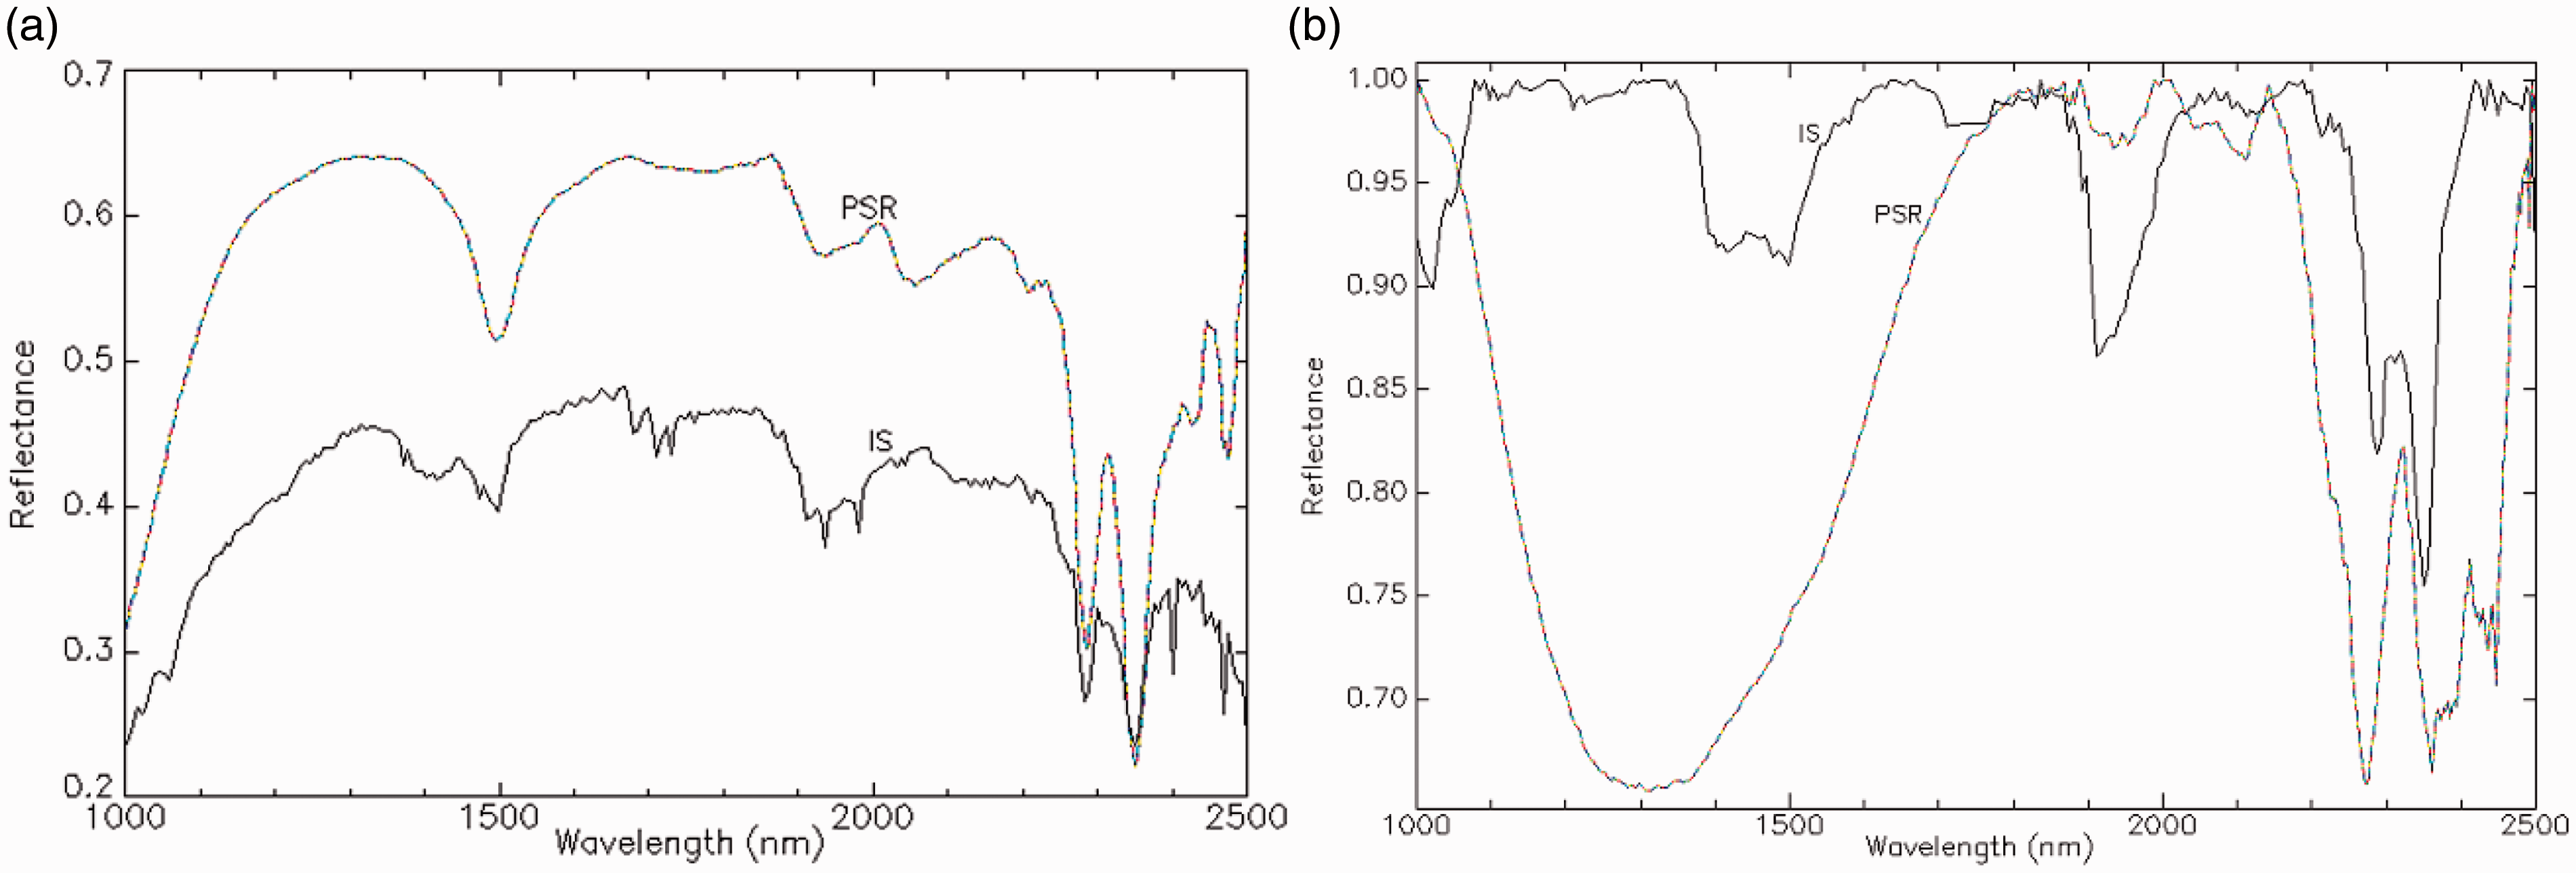
Based on the pigment determination made in Figure 6, batch extraction was performed for pigments used in the ancient painting using SAM and supervised classification.
Figure 7a shows an RGB image. Figure 7b and c shows images at 2282 nm and 2351 nm, respectively, and Figure 7d shows the results of extracting azurite used in clothes using SAM. there are good extractions of the dark blue part of the sample picture, the bottom of the stool, and part of the ribbon on the upper right corner; all of these areas were painted with azurite. The Figure 7d image was combined with the 1159 nm wavelength of the original hyperspectral image for false color composition,
33
shown in Figure 7e, which simulated the effects of putting clothes on the figure in the picture. The background of the picture, which was yellow, was similarly extracted using SAM, and the results showed that the wall and faces of the figures had been colored with the same pigment.
Extraction from the spectral angle mapper for pigment used for clothes (azurite) and background. (a) RGB image; (b) and (c) images produced with wavelengths of 2282 nm and 2351 nm, respectively; (d) azurite extraction of clothes with the SAM technique; (e) false color composition image from (d) and a 1159 nm image; (f) background spectral extraction.
The curves shown in Figure 6 are mainly the spectra of mineral pigments. One big advantage of the mineral pigments that were chosen for painting is that they have stable physicochemical property and do not easily fade. Different minerals have different spectral contributions to optical response from their cation and anionic groups. Not only the azurite can be extracted using the SWIR imaging spectral data as shown in Figure 7, but many other mineral pigments can also be identified from it. Looking at Figure 6, the spectral features are more complicated and identifiable at 2200–2500 nm than 1000–2200 nm. The spectral band 2200–2500 nm mainly identify anionic groups. For malachite, for example, the malachite pigment can also be extracted from the SWIR imaging spectral data, using its spectral features, as shown in Figure 8. The green color shown in Figure 8a is malachite pigment and it can be classified in a similar manner to the blue colored parts in Figure 8b. From Figure 7 and Figure 8 it is shown clearly that the “image-spectrum combined” SWIR imaging spectral data have the ability to recognize and classify mineral paint pigments. The spectrum information can recognize the pigments, while the image shows the pigments’ spatial distribution on the painting.
Mineral green pigment extraction from the SWIR imaging spectral data. (a) RGB image; (b) the blue areas are malachite pigment.
Extraction of Hidden Information
The hidden information in paintings generally include signs of repair, hidden text patterns, and illegible information. Figure 9 is taken from the painting, in which certain patterns and decorations are visible in the woman’s braids. The pattern was not significantly visible in the original RGB image, but extremely outstanding when detected with SWIR at a wavelength of 1547 nm. This indicated that some information not readily visible under visible light can be identified and extracted effectively using SWIR data.
Illegible information of the braid from the image detected at 1547 nm. (a) RGB image; (b) 1574 nm image, the braid is highly visible.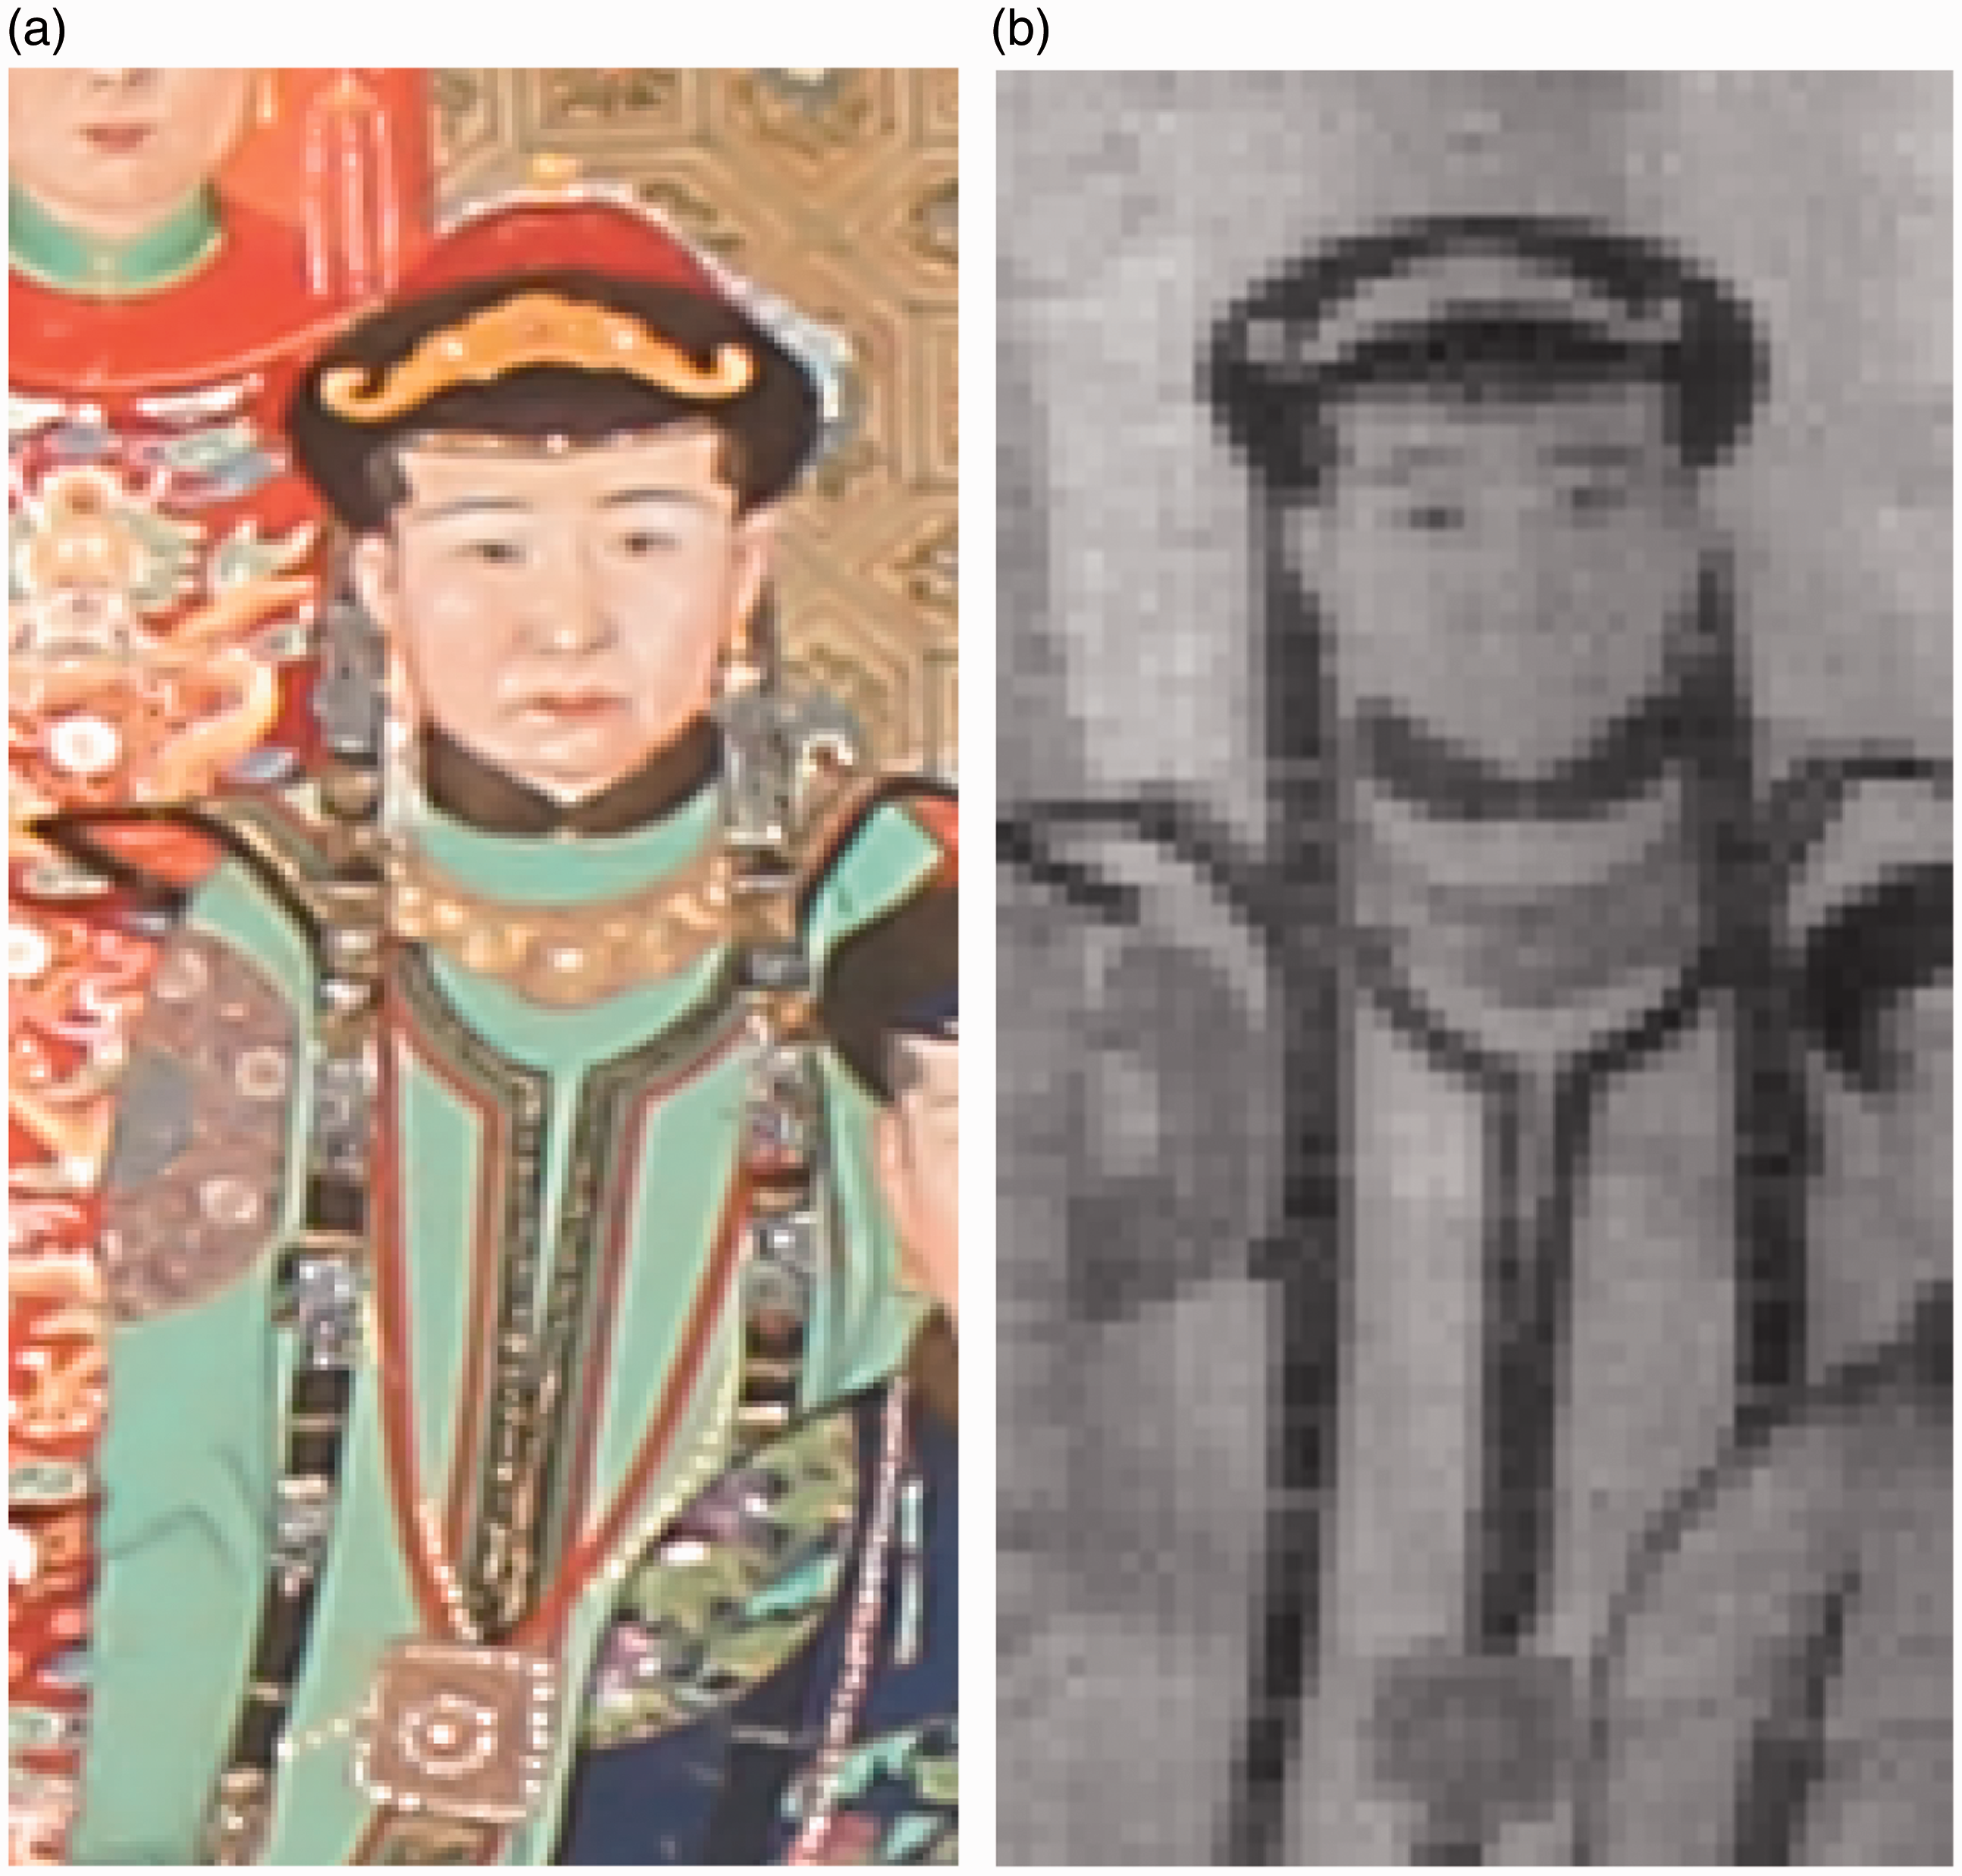
Figure 10 shows the extraction of repaired correction marks. Figure 10a to c corresponds to images produced at wavelengths of 453 nm, 980 nm, and 1302 nm, respectively. The results showed a trace of a correction above the hat worn by the figure, with different traces displayed under different wavelengths. Most significant traces were observed with 453 nm, and the traces faded at 980 nm with the color becoming darker in the upper half of the hat. The color of the upper half of the hat was almost the same as the background at 1302 nm, but relatively large, semi-circular smear marks were detected at 1302 nm. Figure 10d shows false color synthesis at 690 nm, 514 nm, and 453 nm, all of which highlighted the trace of corrections.
Extraction of traces of corrections. (a) 453 nm image; (b) 980 nm image; (c) 1302 nm image; (d) false color composition image corresponding to images at 690 nm, 514 nm, and 453 nm, with significantly visible correction marks; (e) PCA2 image; (f) PCA3 image. (e) and (f) are images of the second and third principle components, which show different signs indicating corrections.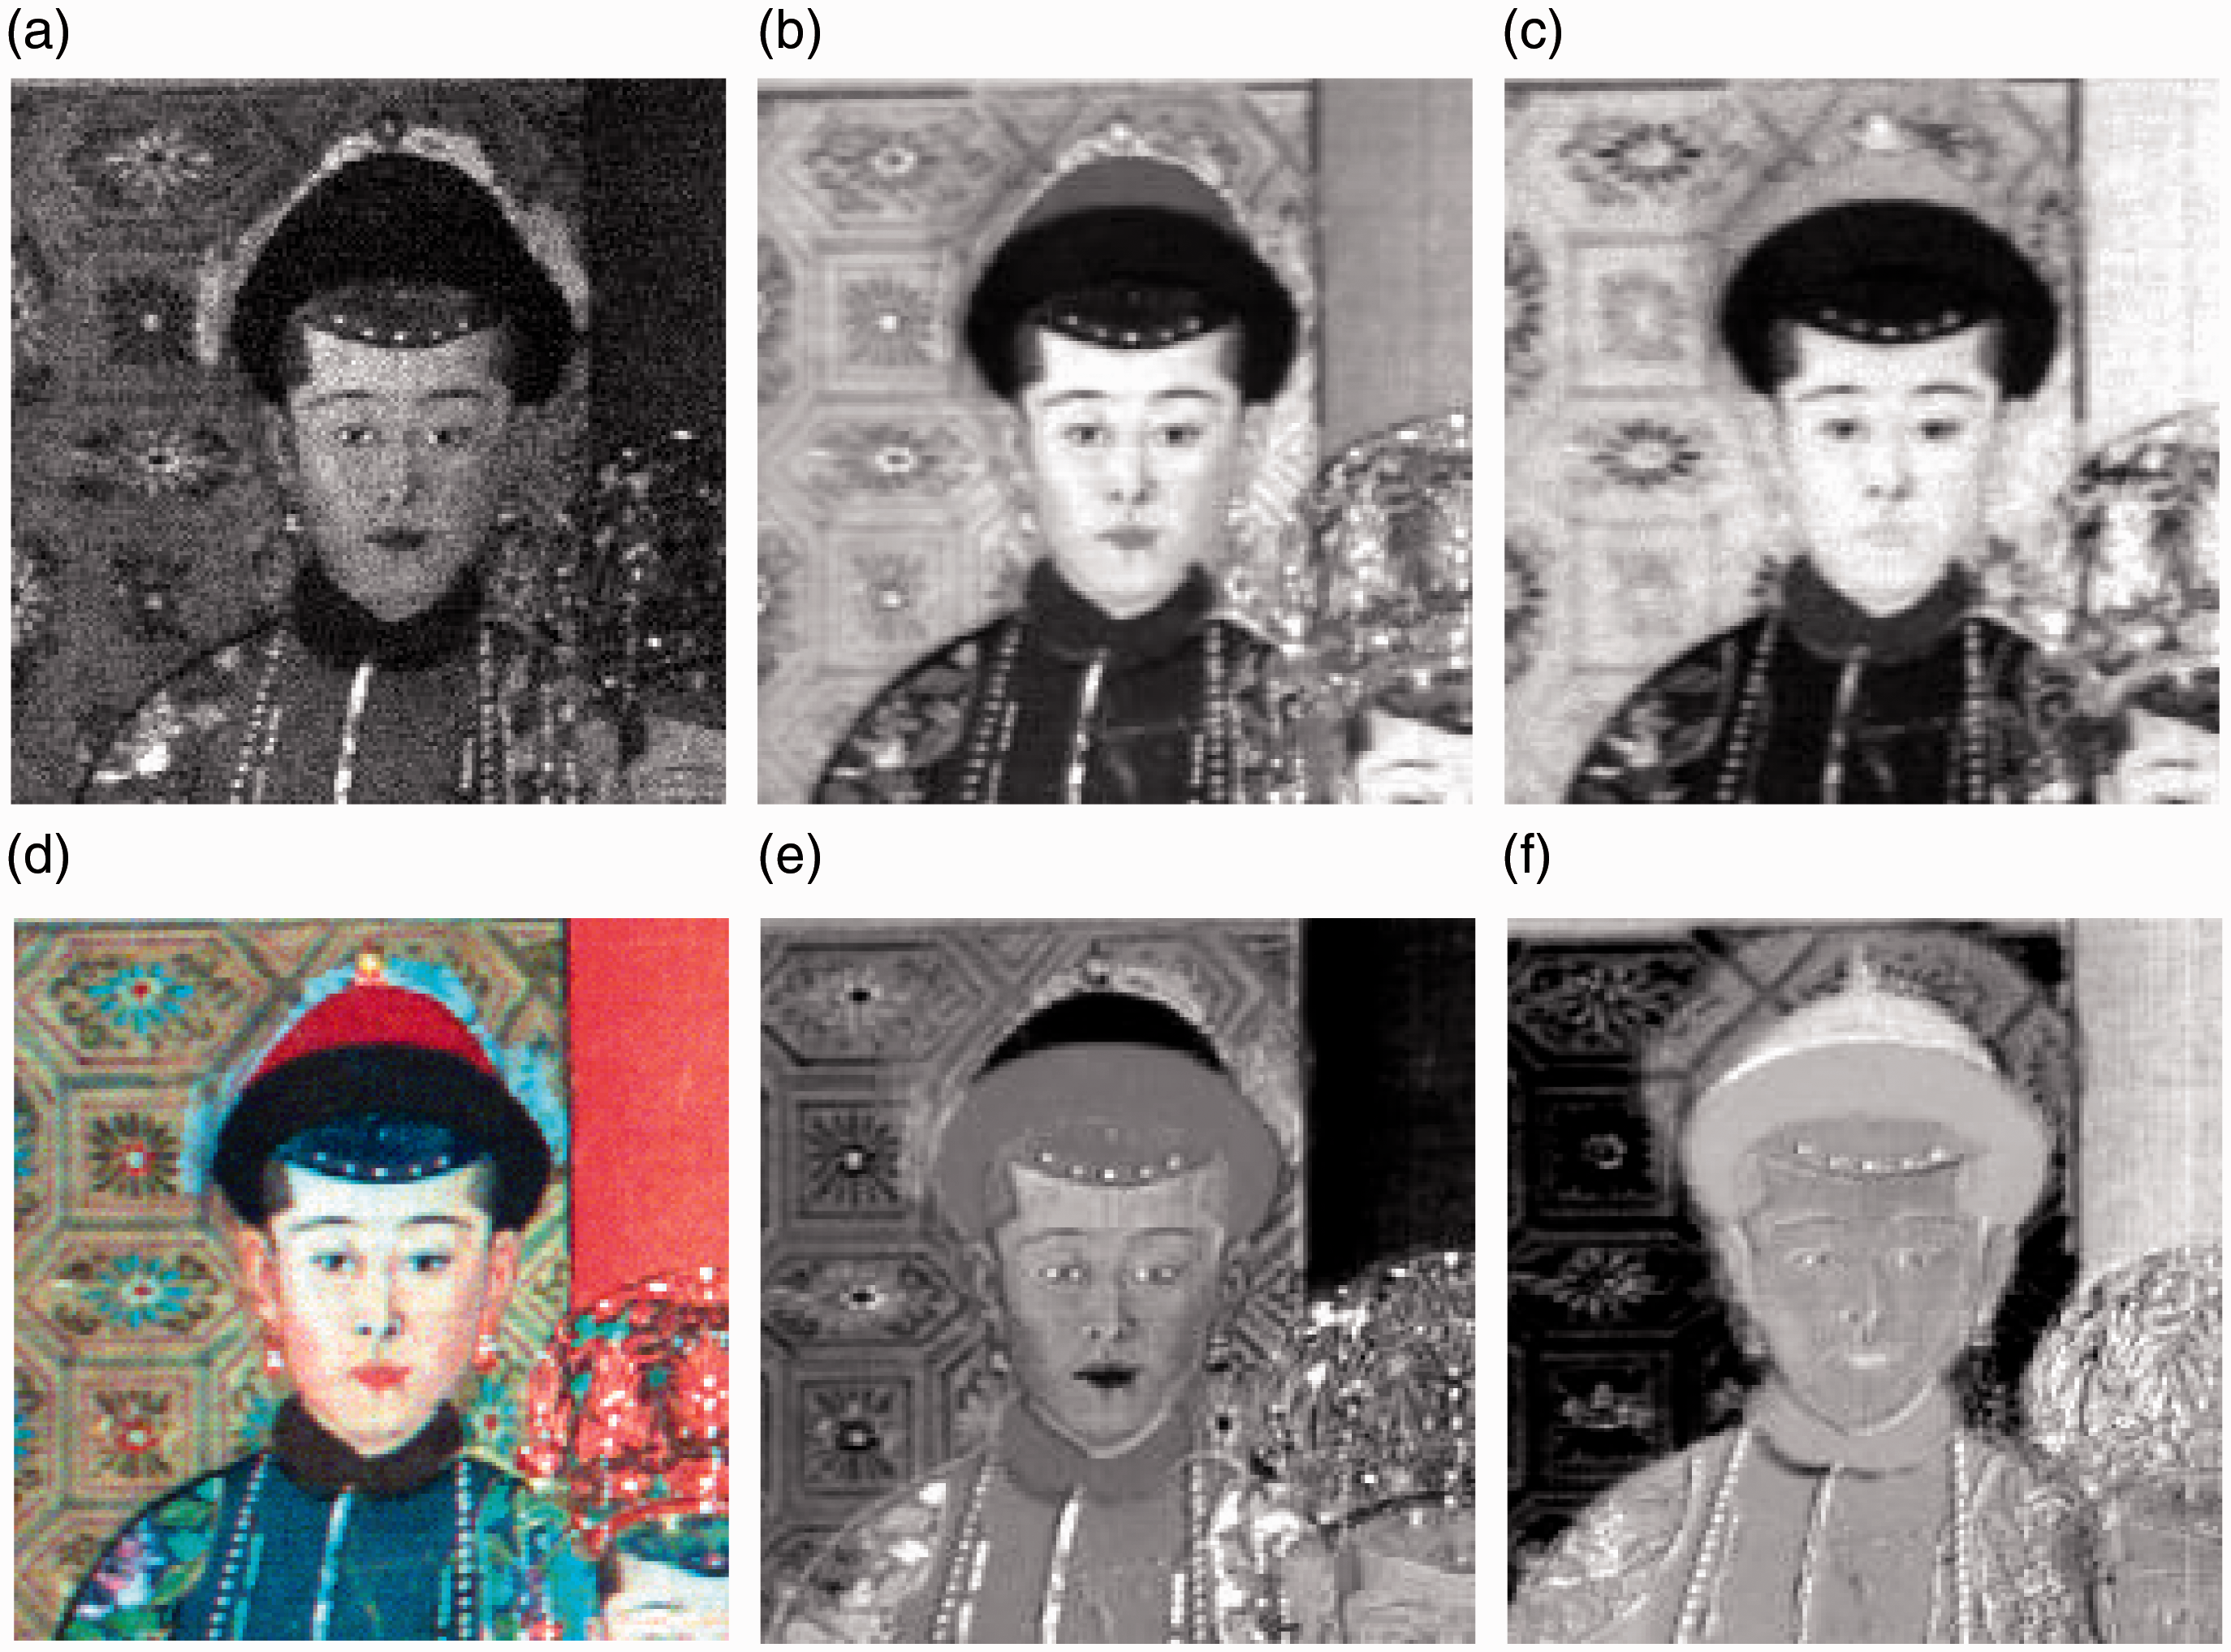
Figure 10e and f are images of the second and third main components achieved from the hyperspectral image using PCA. Because there is a high correlation between hyperspectral images detected with different wavelengths and because the images looked similar visually, some of the data were considered redundant and repetitive from the point of view of extracting useful information. The goal of PCA is to concentrate useful information from the original images. This is achieved using multiple wavelengths on new images of the principle components. The number of principle images should be as small as possible and the principal component images should not be related to each other, which means that information from each principal component does not overlap, thus greatly reducing the total amount of data and enhancing the image information. 15 The second principle component (PCA2) emphasized the traces of correction shown in Figure 10d. The third principle component (PCA3) showed a large, semi-circular pattern over the hat worn by the figure, which may be used to highlight the correction trace shown in Figure 10c.
Characteristic information can also be highlighted by treating other parts of the ancient painting with PCA. As shown in Figure 11, the false color composition image for PCA3 can highlight the figure’s chest, the dragon pattern on the figure’s arm, and the decorative pattern on the wall, which is useful for the extraction of corresponding features and information. Summarized from the samples, SWIR imaging spectral data can easily identify illegible information, reveal painting modification traces, and enhance the detailed information about paintings.
Information features of the third principle component. (a) RGB image; (b) third principle component with emphasized pattern information.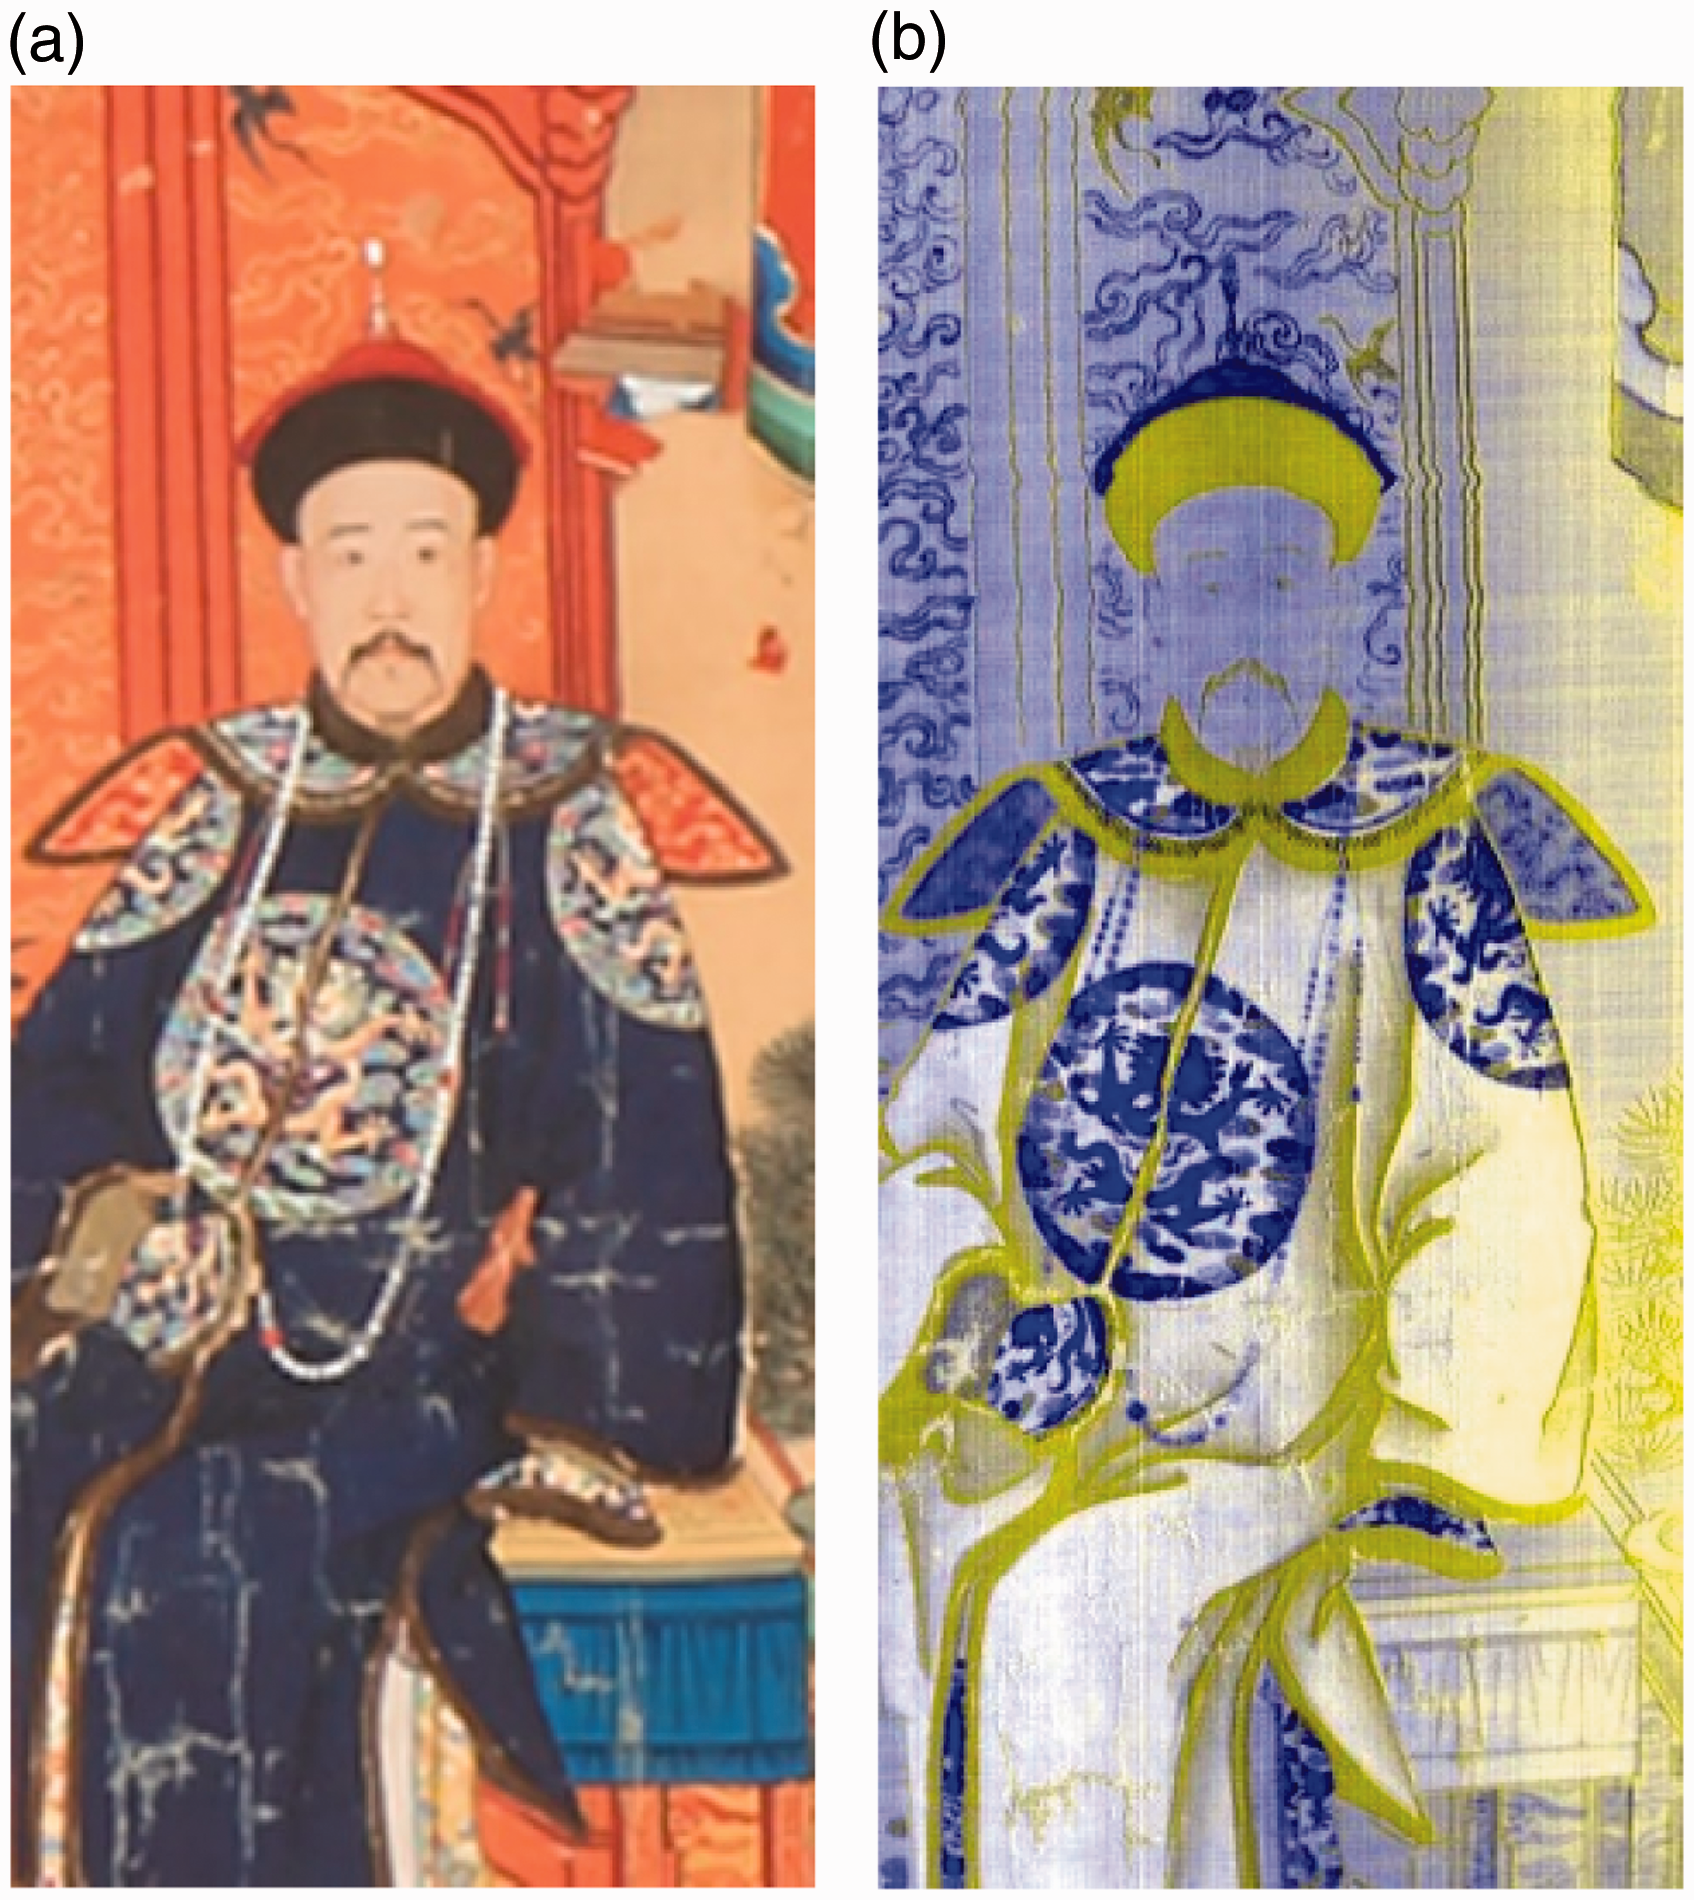
Conclusion
In this study, a ground-based SWIR imaging spectrometer was used to perform hyperspectral imaging on an ancient painting in order to collect SWIR spectral imaging data with high spatial resolution and high spectral resolution. The outcomes of the study can be summarized as follows. (1) Imaging spectrum data collected using ground-based SWIR imaging spectrometer greatly facilitate the extraction of features of line drafting, and effective extraction can be performed directly using a particular single band. (2) Shortwave infrared imaging spectrum data can be used to identify and classify mineral pigments. (3) Shortwave infrared imaging spectrum data can detect the traces of correction and, using techniques such as band combination and principal component analysis, such information can be extracted to highlight outcomes of interest.
The present research will expand the range of application of SWIR imaging spectrum technology in the study of cultural relics, including digital archiving, heritage diagnosis, and repair, and promote the development of the science and technology of examining our cultural heritage.
Footnotes
Conflict of Interest
The authors declare that there is no conflict of interest
Funding
This research received no specific grant from any funding agency in the public, commercial, or not-for-profit sectors.