
Abstract
Cerebrospinal fluid (CSF) is a clear and colorless biological fluid which circulates within brain ventricles (cavities), the spinal cord’s central canal, the space between the brain and the spinal cord, as well as their protective coverings, the meninges. Cerebrospinal fluid contains different constituents, such as albumin and lactate, whose levels are used clinically as biomarkers of neurodegenerative disorders. In current clinical practice, analysis of CSF content for the diagnosis of central nervous system disorders requires an invasive procedure known as lumbar puncture or spinal tap. With the aim of developing a noninvasive alternative, we report here the spectral behavior of albumin and lactate over a broad wavelength range of 600–2000 nm, after each was added separately at varying normal and abnormal concentration levels to artificial CSF (aCSF). Spectral measurements were conducted simultaneously by two different spectrometers working at different spectral ranges in transmittance mode. Spectral analysis revealed that albumin and lactate each possesses its own first and second derivative absorbance spectra fingerprint between 1660 and 1810 nm. Distinguishing albumin from lactate by their spectral data enabled the differentiation between aCSF conditions modeling different neurological disorders. Spectral changes of each compound strongly correlated (R2 > 0.9) with absorbance derivative spectra peaks at specific wavelengths, when analyzed by linear regression with variations in their concentration. These findings suggest the feasibility of CSF biomarker assessment by broadband infrared spectroscopy.
Keywords
Introduction
The brain, as well as the rest of the central nervous system (CNS), is protected in part against physical injury by a clear and colorless biological fluid called cerebrospinal fluid (CSF). 1 Cerebrospinal fluid circulates through the subarachnoid space surrounding the brain and spinal cord through the ventricles of the brain. In healthy humans, 500 mL of CSF is produced daily, or 0.35 mL/min, at a turnover of 14% per hour which maintains a constant CSF volume of approximately 150 mL. 2 Other functions of CSF include transport of nutrients to the CNS and excretion of waste. Since CSF composition is directly dependent upon cellular metabolism within the CNS, analysis of CSF can provide valuable insight to a range of neuropathological conditions, including Alzheimer’s and Parkinson’s diseases, multiple sclerosis, Guillain-Barre syndrome, as well as cancers, such as leukemia and meningeal carcinomatosis.3–7 Cerebrospinal fluid is not easily accessible for clinical assessment, but when necessary may be withdrawn by lumbar puncture (or spinal tap) in which a needle is inserted into the spinal canal between lumbar vertebrae L3/L4 or L4/L5.8,9
Human CSF contains a range of components, including glucose, electrolytes, amino acids, lipids, proteins, etc. Among other CSF components, albumin and lactate are widely used as biomarkers for diagnosis and monitoring of CNS disorders.10,11 The normal ranges for lumbar CSF albumin and lactate are 10–25 mg/dl and 10–20 mg/dl, respectively. Increased CSF albumin levels are usually attributed to changes in blood–CSF barrier function, since CSF albumin originates exclusively from peripheral blood. Thus, elevated albumin levels may also result from a lesion in the choroid plexus or a blockage in the flow of CSF. Pathogenic factors yielding a secondary rise in CSF albumin indicate meningitis, subarachnoid hemorrhage, multiple sclerosis, or syphilis.12–15 On the other hand, increased lactate levels may suggest inherited metabolic disease, bacterial and fungal infections, or leptomeningeal metastases. Furthermore, CSF lactate levels also rise during head injury, prolonged convulsions, and stroke.16–22 To the best of our knowledge, this study is the first to utilize broadband infrared (IR) spectroscopy to simultaneously evaluate albumin and lactate levels in artificial CSF (aCSF) conditions modeling different neurological disorders.
Infrared spectroscopy is a developing technique widely used over the past three decades in various fields such as taxonomy, pharmacology, food quality control, and biomedicine. Infrared spectra contain information regarding a given sample’s chemical and physical properties. In biomedical research, it is used to measure optical properties which reflect a tissue’s morphology and function.23–28 Typical configurations entail a broadband light source (anywhere from near-infrared (NIR) to short-wave infrared (SWIR)), detector (spectrograph), and flexible optical fibers for delivery and collection of light during measurements. As light is irradiated upon a biological sample, such as a turbid liquid in our study, it undergoes a combination of scattering and absorption. 29 The scattering and absorption bands of the spectra are attributed to the vibration of specific molecules such as water, lipids, protein, glucose, etc. Fingerprinting the spectra of specific molecules enables the precise measurement of selected components of the medium. Thus, changes in physiological conditions will lead to changes in the sample’s scattering and absorption spectra, enabling rapid measurement of tissue morphology and function. Since several neurological diseases possess unique spectroscopic fingerprints, monitoring of spectra derived from spectroscopy measurement can be a good surrogate marker of specific diseases in lumbar puncture test.
Several analytical methods are currently used to perform quantitative metabolomics on human CSF samples, including nuclear magnetic resonance (NMR), 30 gas chromatography-mass spectrometry (GC-MS), 31 liquid chromatography-mass spectrometry (LC-MS), 32 direct flow injection-mass spectrometry (DFI-MS/MS), 33 and inductively coupled plasma-mass spectrometry (ICP-MS). 34 However, these techniques have important limitations, as they are: (1) time-consuming (requiring hours to days to receive quantitative results); (2) technically complex; (3) expensive to operate; and (4) not readily mobile. Thus, light spectroscopy coupled with analysis of spectral changes over extensive wavelength ranges to detect signs of disease in CSF might alleviate these drawbacks and may contribute to more efficient medical decision-making. While IR spectroscopy cannot meet all the requirements of chemical composition analysis, it may eventually enable the identification and monitoring of neurological disease in a simple, fast, low-cost, and portable manner.
In the present work, we analyzed the ability of optical spectroscopy to differentiate between and to evaluate the levels of two CSF compounds within the broadband IR spectrum range, not commonly used in biomedical diagnosis. Most studies employing IR spectroscopy utilize the wavelength ranges of 600–1000 nm, named NIR.35,36 Going beyond 1000 nm was, until recently, difficult, primarily due to the low sensitivity of detectors. Recent developments and improvements in light sources and detector technologies, as well as in optical fibers and filters have broken this barrier and current optical components work efficiently within extended NIR region of 1000–2000 nm, known as SWIR. 37 This spectral region holds an important advantage for spectroscopy and imaging purposes: scattering is attenuated monotonically (∼λ−4), leading to increased transparency of photons within the sample and hence improved penetration depth.38,39 Short-wave IR includes more absorption peaks, thereby adding additional information to the raw spectra and hence improved sensitivity for various CSF analytes. 40 Thus, an important advantage of the current optical setup lies in its ability to perform wideband spectroscopy data analysis over the NIR to SWIR spectral ranges.
Materials and Methods
Sample Preparation
Since ethical considerations preclude the collection of human CSF for research purposes, aCSF is extensively used as an alternative. It was prepared by dissolving in double-distilled water (in millimoles): 120 NaCl, 3.3 KCl, 26 NaHCO3, 1.3 MgSO4 × 7H2O, 1.2 NaH2PO4, 11 D-glucose, and 1.8 CaCl2 (pH 7.3–7.4). 41 Separate solutions of albumin and lactate, purchased in dry form, were then prepared and added separately to aCSF at final concentrations in the range of 0.07–33 g/L. All compounds were purchased from Sigma-Aldrich, Ltd. (Rehovot, Israel). The samples were loaded into optical glass cuvettes (Emproco Ltd., Ashkelon, Israel), permitting 82% light transmission from 300 to 2500 nm. Cuvette path length was 10 mm. All the measurements were carried out at room temperature (22℃) and no attempts were made to control the cuvette temperature during data collection. A total of 80 samples were used for the analyses.
Instrumentation
In order to cover the NIR-SWIR spectral range, we used two different portable spectrometers: an NIR spectrometer and Fourier transform spectrometer (FTS), each of which possesses its own operation capabilities and limitations. Computer control allowed only one spectrometer and its light source to be operated at any given time, to avoid any possible cross-talk between the two instruments. Figure 1 presents a schematic diagram of the entire experimental setup in transmission mode. The NIR spectroscopy system is equipped with a broadband quartz-tungsten-halogen light source (HL-2000-FHSA, Ocean Optics), monolithic miniature spectrometer (MMS1, Carl Zeiss), and optical fibers for light delivery and collection. The NIR spectrometer spectral range is 400–1200 nm with wavelength accuracy of 0.3 nm. The in-house built FTS spectrometer used the same basic optical configuration of a Michelson interferometer platform
42
to collect spectroscopic data over the range of 1200–2000 nm, with resolution of 8 cm−1. It consisted of a uniform, constant, blackbody light source (mini-igniter) with a color temperature of approximately 1035 ℃, matched fused silica beam-splitter and compensator plates, fixed and moveable (active) corner-cube retroreflectors, 1 mm diameter extended-wavelength InGaAs PIN photodiode, and a data acquisition system that digitizes the interferogram data and stores them in the computer. Spectra from each spectrometer were acquired using in-house scripts written in Matlab. Because we were not concerned with real-time result analysis, spectral data were stored for later offline processing using the Matlab routines. Each acquired data set was comprised of replicate spectra co-added to a single average spectrum to increase the effective signal-to-noise ratio. Measurements were also repeated on different days to further evaluate the repeatability of results obtained with the setup.
Experimental setup for NIR-SWIR spectroscopy measurement.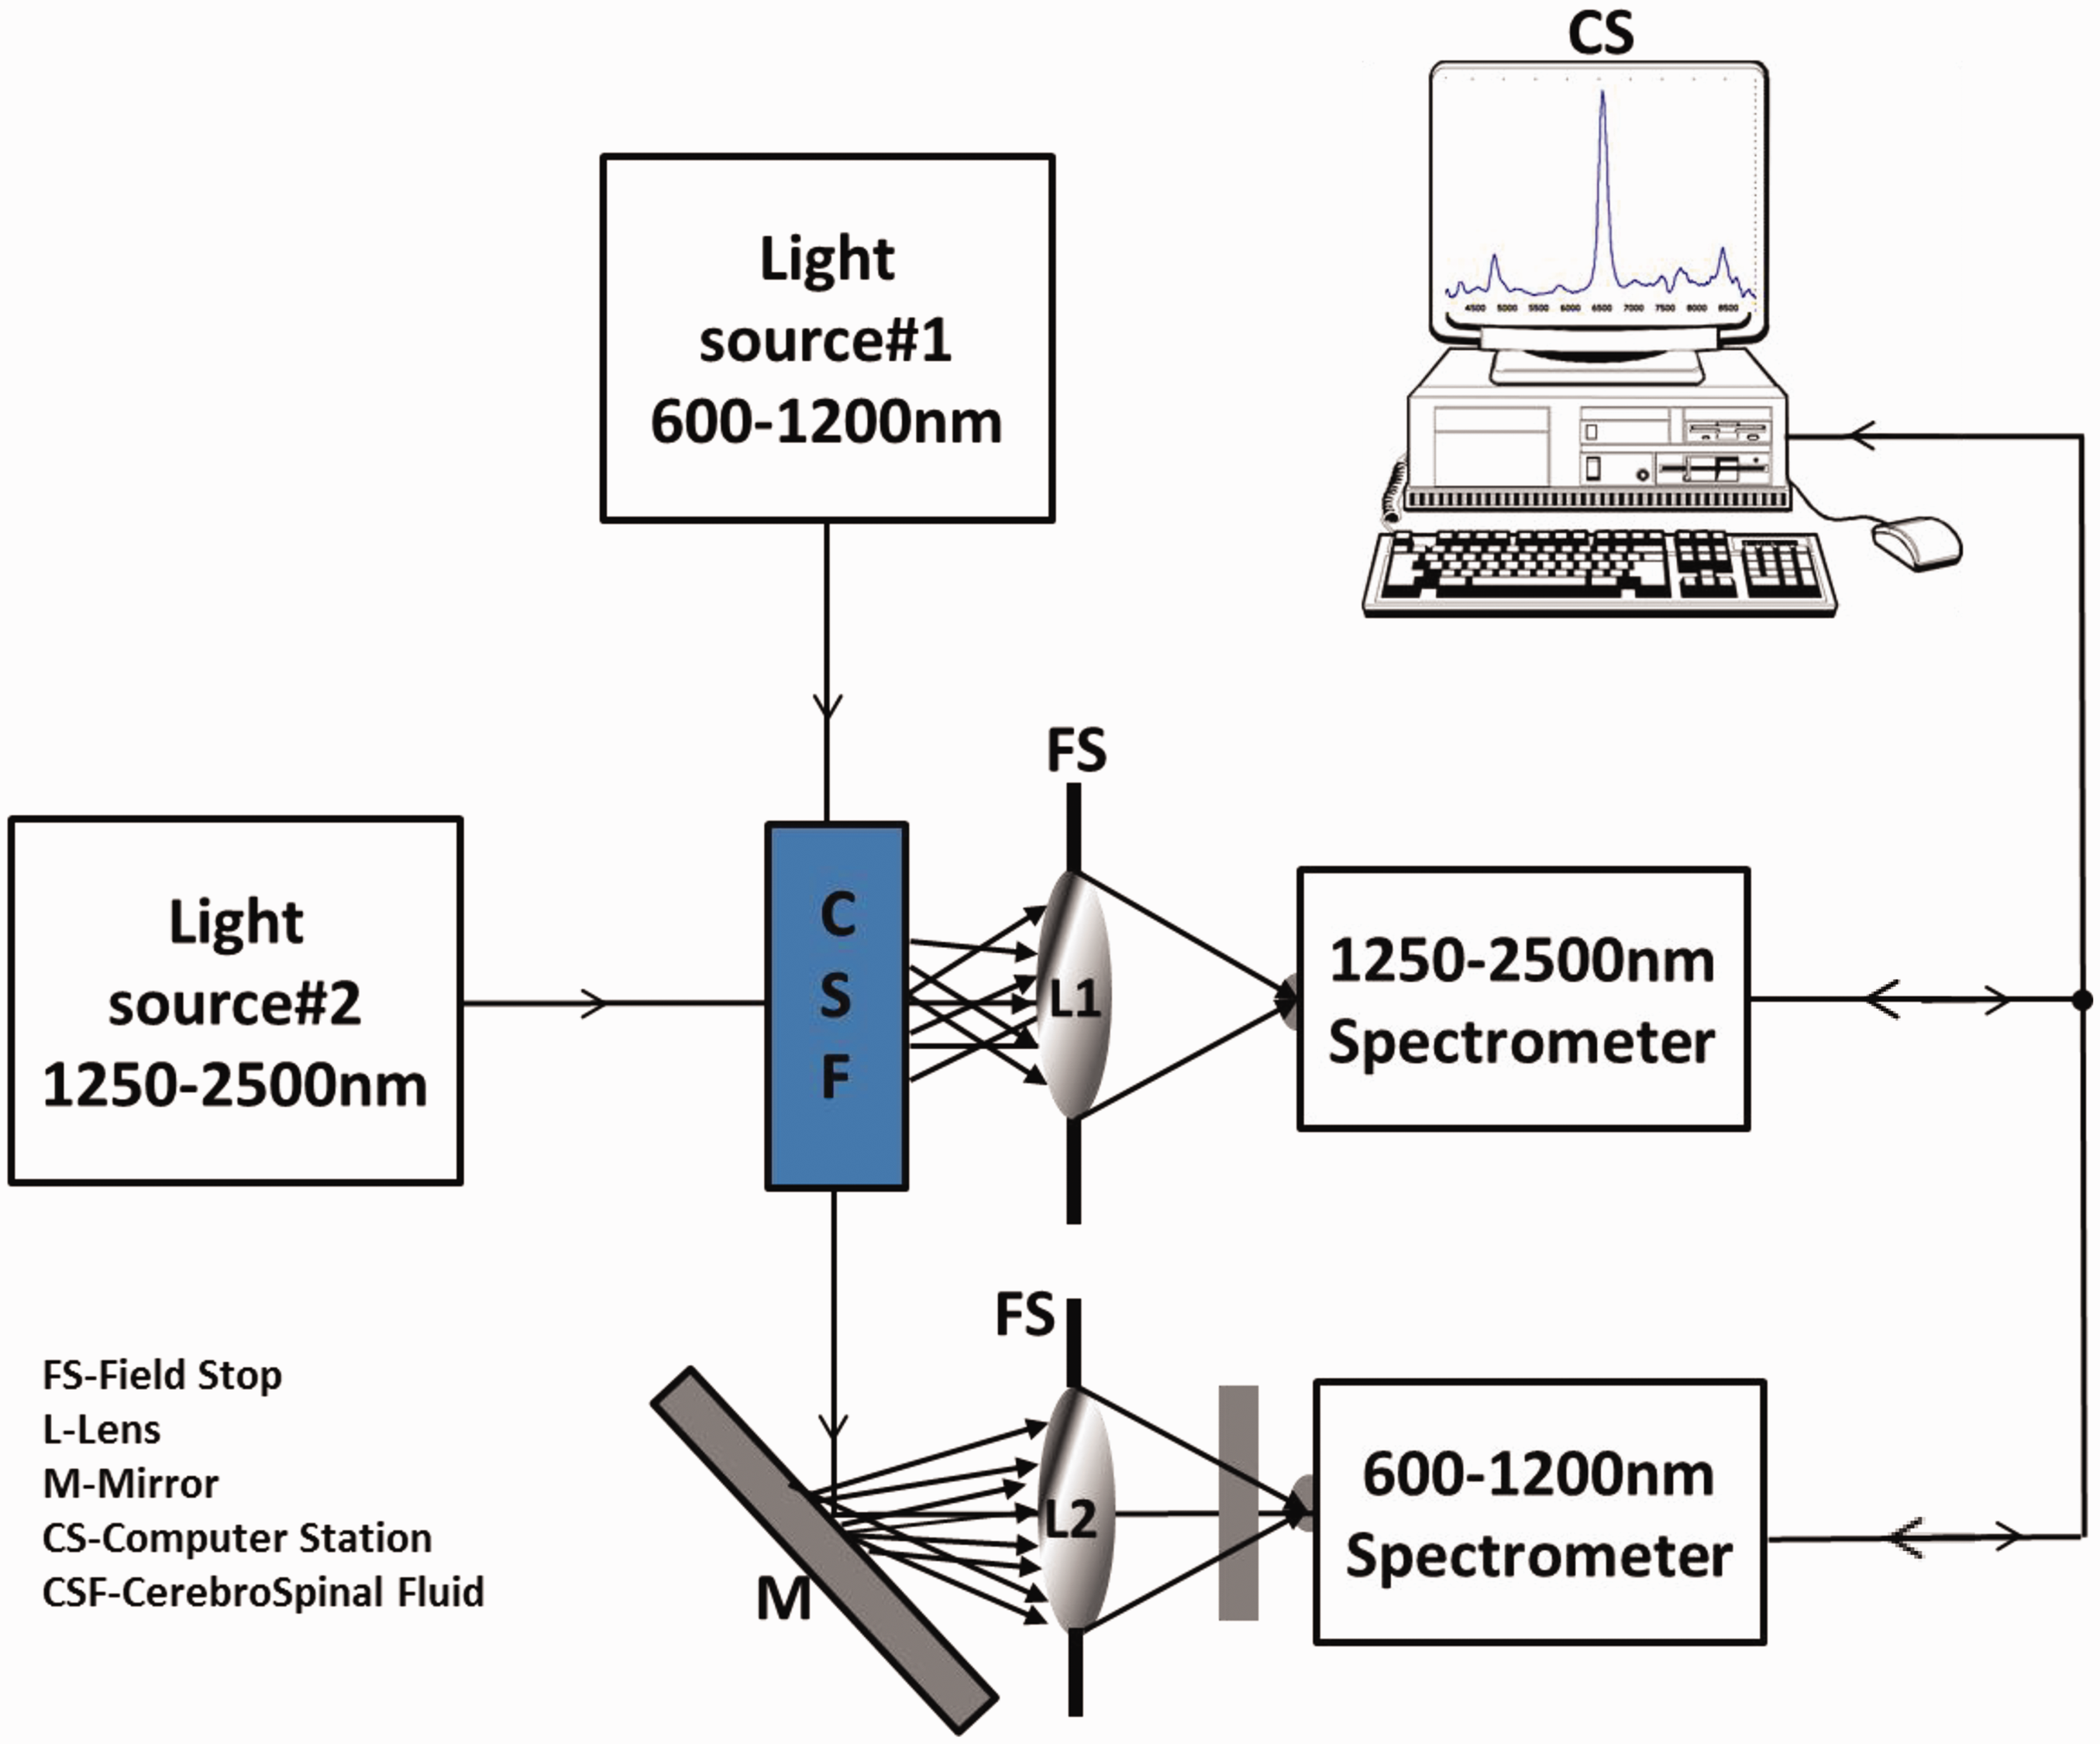
It should be mentioned that measurement of low concentration levels found our current setup to be not sensitive enough to distinguish between subtle differences in albumin/lactate levels. To overcome this drawback, we suggest future use of a FTS combining higher resolution, sensitivity, and spectral precision than used in this study. We also acknowledge the fact that a number of factors, such as sample handling, temperature, and other compounds of CSF, can affect the sensitivity to subtle differences during analytes measurements. Thus, we believe that high resolution FTS, SWIR derivatives approach, data pre-processing, and multivariate regression methods possess great potential to discriminate between lower concentration levels. Our ongoing research aims to pursue this goal.
Data Processing
The measured diffuse transmittance spectra were normalized to remove the effects of the light source spectrum, fiber attenuation, instrument drift, and detector response by the relation:


Absorbance outliers were detected if the following condition was satisfied,

Results and Discussion
Albumin Near-Infrared Study
Figure 2 shows in four panels different traits of the albumin spectra in the NIR region: Figure 2a, raw transmission intensity; Figure 2b, corresponding absorbance; Figure 2c and 2d, first and second derivative of absorbance, respectively. Each panel includes four albumin concentration levels. Each concentration is the average of ten measurements. As seen in Figure 2a and 2b, the curves of spectra had very similar shapes, all showing broad overlapping peaks. Thus, in order to resolve overlapping signals, enhance signal properties, and to suppress unwanted spectral features we calculated the first and second derivatives of the absorbance spectra. Indeed, Figure 2c and 2d demonstrate differences in concentration levels specifically surrounding the 1023 nm and 1056 nm peaks, respectively. However, these differences are subtle and cannot be used as criteria to distinguish between albumin levels of natural CSF. At the same time, the difference between low (0.08 g/L) and high (17 g/L) levels is easily distinguishable, with most pronounced differences of 32% observed in Figure 2d in the vicinity of the 1056 nm peak. Noteworthy is a linear, inverse relationship: as concentration increases, the second derivative absorbance decreases, demonstrating the influence of high albumin concentration upon the spectra. Nevertheless, natural CSF samples may reach albumin levels of up to ∼10 g/L under certain pathological conditions. It is therefore necessary to note that NIR spectroscopy failed to detect spectral variations between low albumin levels within the range of < 3.08 g/L. In order to overcome this limitation and to improve sensitivity, we next analyzed the albumin spectra in the SWIR spectral range.
The NIR albumin spectra at four concentration levels of 0.08, 3.08, 17, and 33 g/L. (a) Intensity spectra of the diffusely transmitted light from the sample. Each spectrum is the average of ten measurements. (b) Absorbance spectra of (a). (c) First and (d) second derivative of the absorbance spectra shown in (b).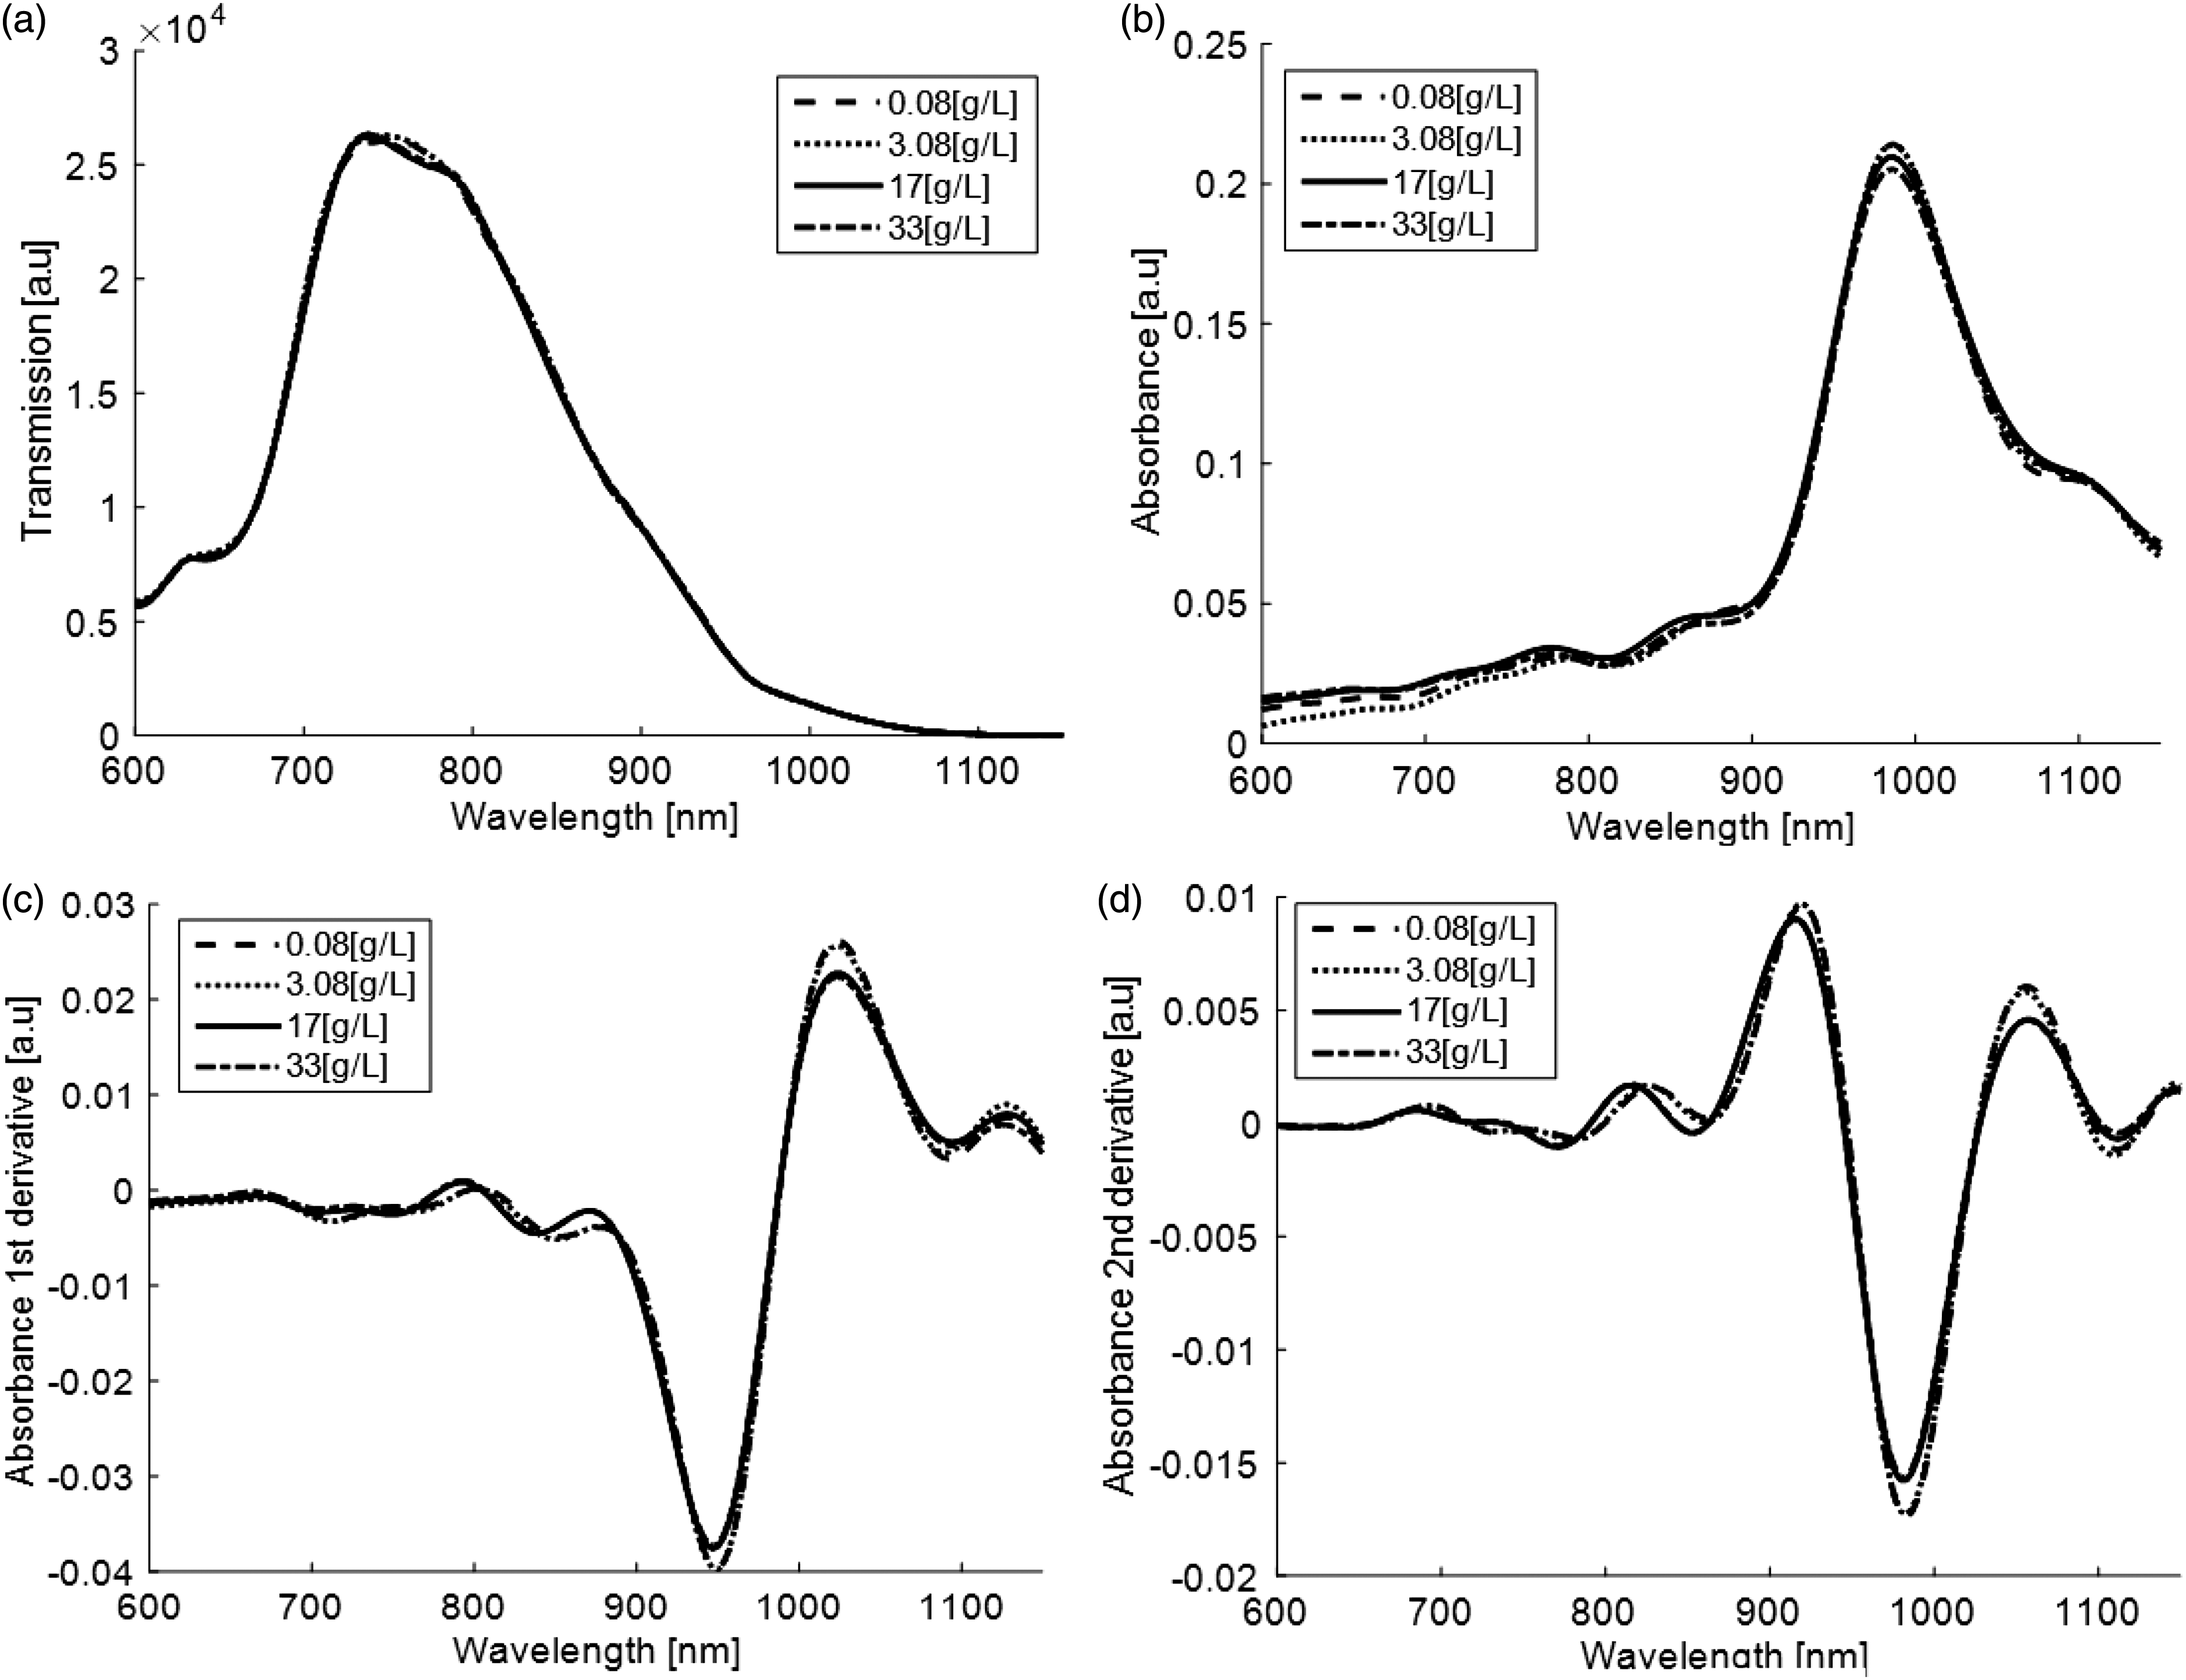
Albumin Short-Wave Infrared Study
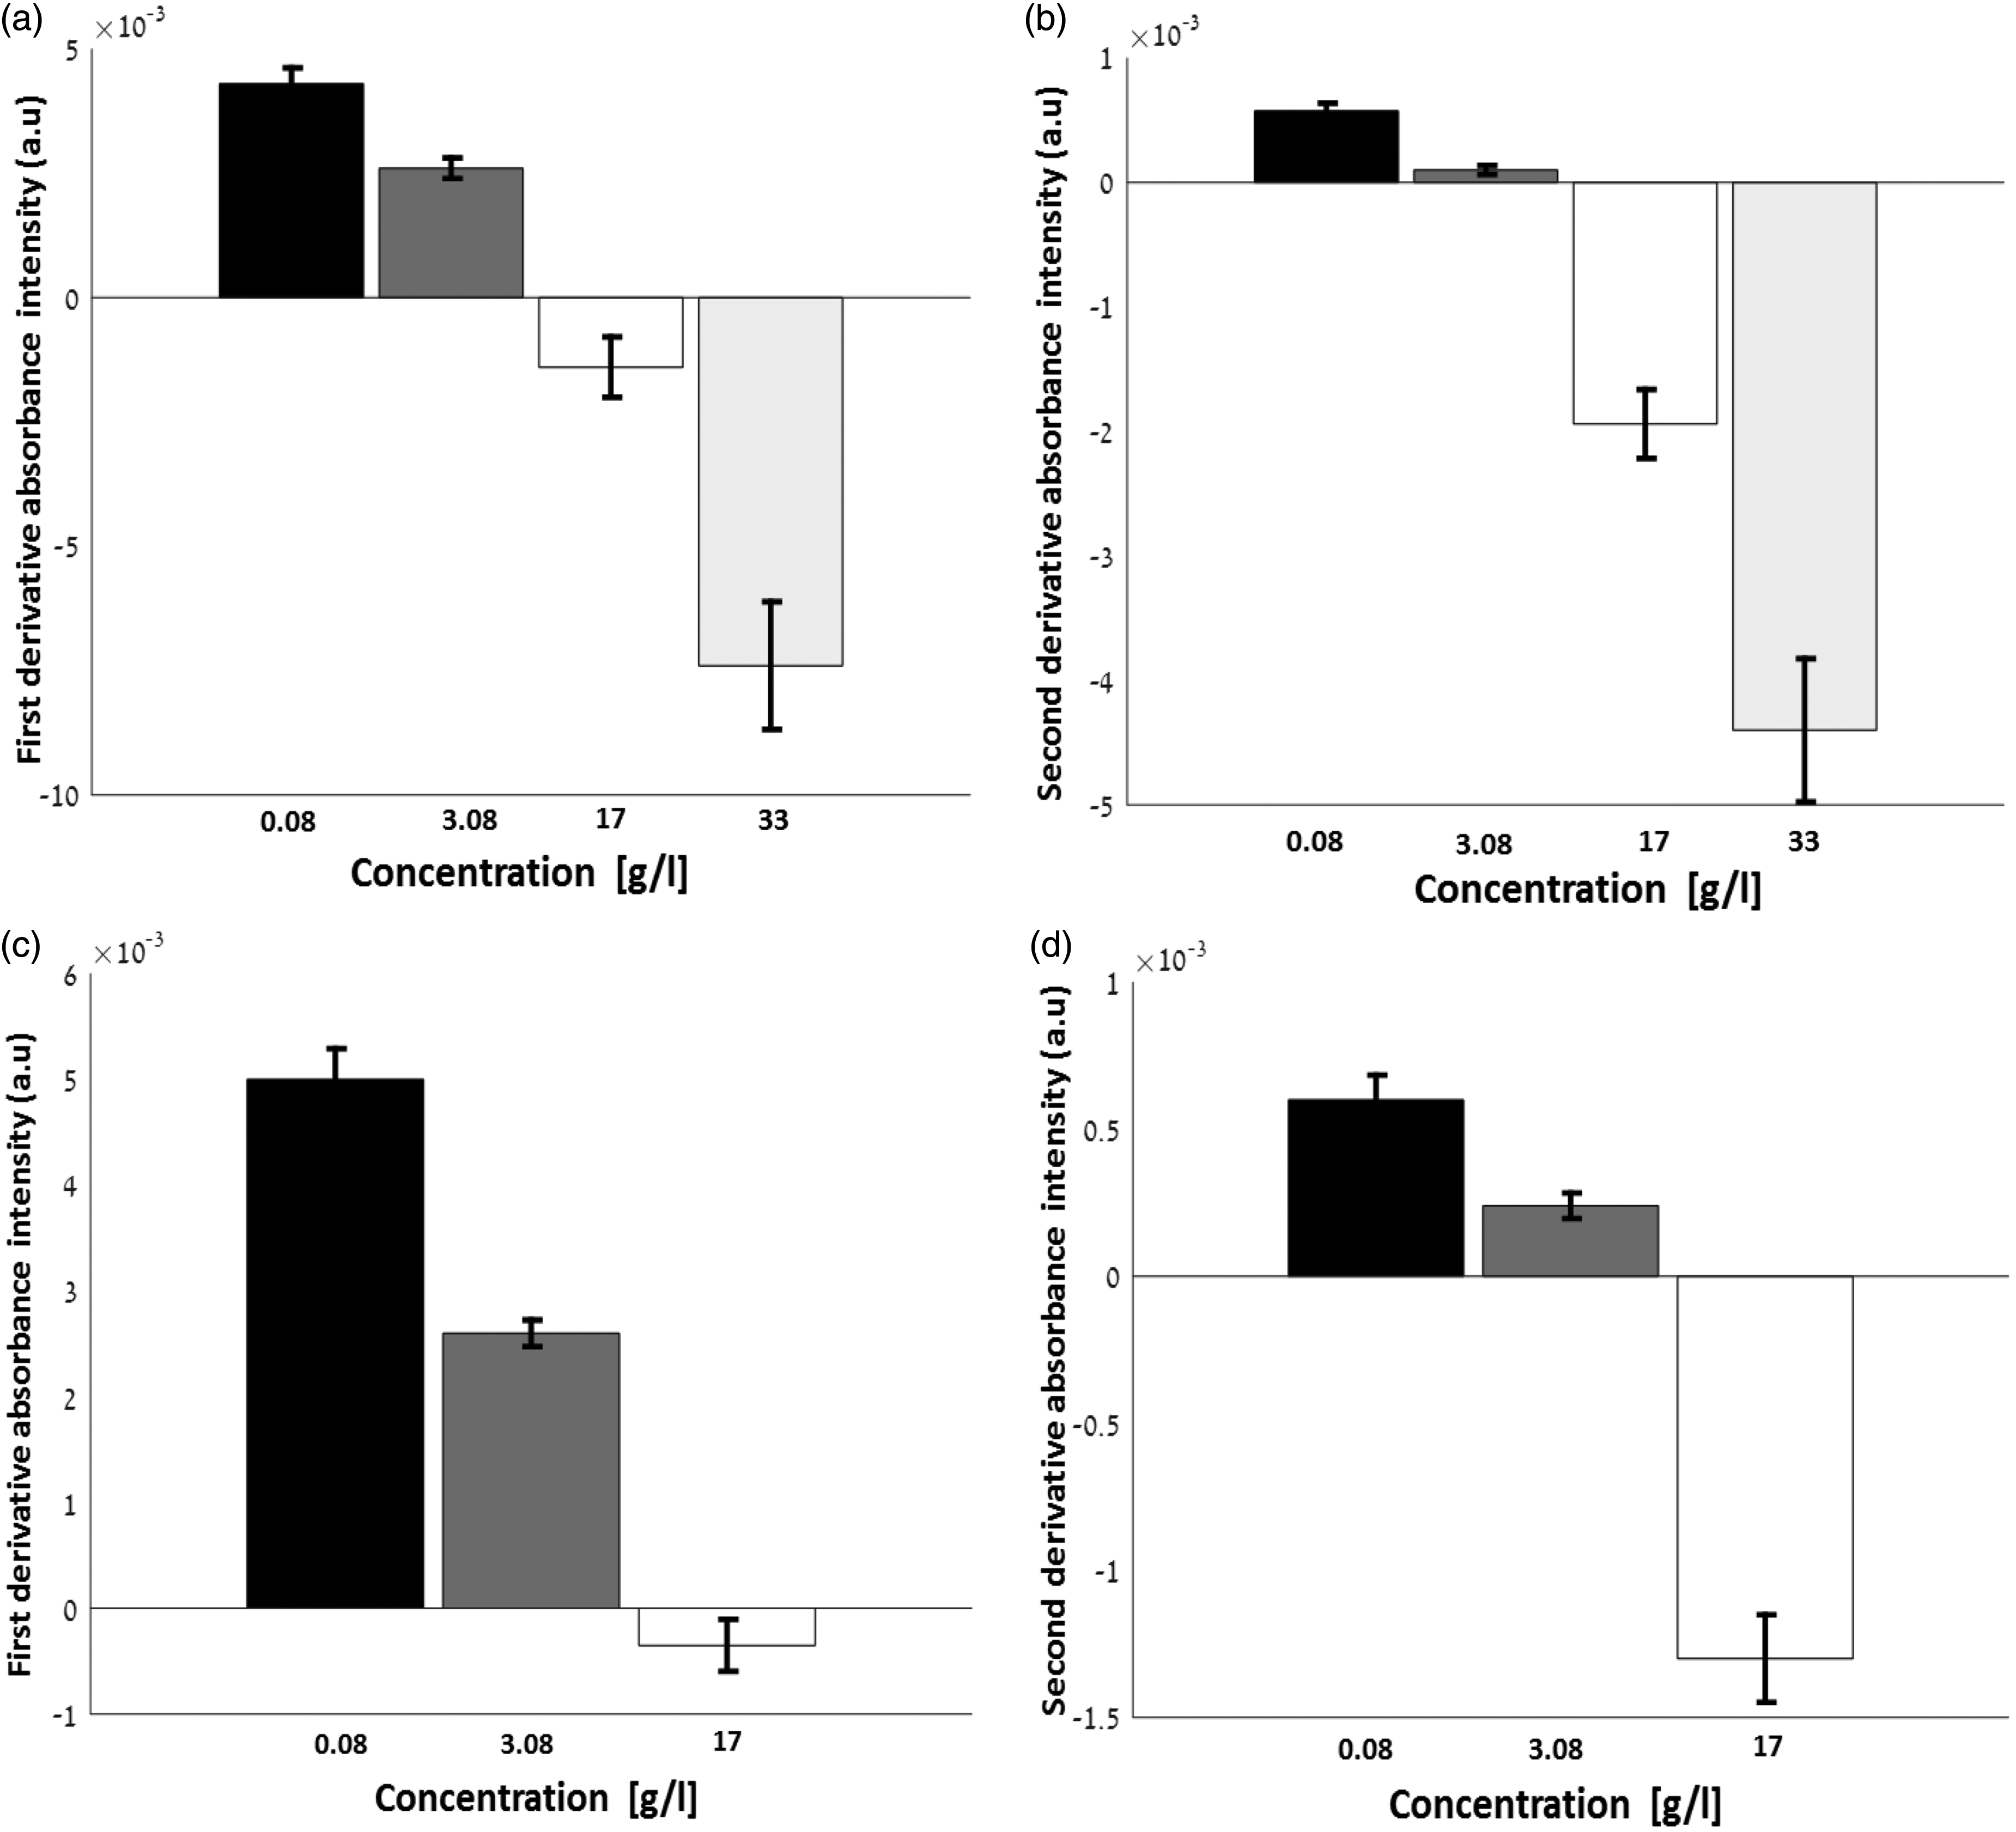
Figure 3 displays four different attributes of the albumin spectra in the SWIR region: Figure 3a, transmission intensity; Figure 3b, corresponding absorbance from 1550 to 1850 nm; Figure 3c and 3d, the first and second derivatives, respectively, of the absorbance in Figure 3b. We found that variation in albumin concentration results in readily discernible alterations in spectra derivative within this specific wavelength range. In most practical applications, it is more convenient to use spectral data obtained at specific wavelengths rather than from wide spectral ranges. The regions marked by the broken line in Figure 3c and 3d highlights the resolution of discernment between concentrations and demonstrate that spectral differences become more apparent as albumin levels increase and each spectrum is characterized by its minimum and maximum points. Thus, increases in albumin concentrations result in a lower derivative of light absorbance through the sample. The strong inverse relationship between albumin concentration and derivatives of values is visible in the linear relationship plots shown in Figure 3e and 3f which reflected in an overall Pearson correlation coefficient of –0.99. Therefore, albumin concentration may be calculated from the derivative absorbance spectra, using the linear regression equation. Importantly, the decrease in absorbance derivative intensity is not uniform across wavelengths, demonstrating spectral specificity in the SWIR range. Figure 4a and 4b presents the mean ± SE of the first and second derivative absorbance intensity, respectively, for each albumin concentration tested, across the above marked regions appears in Figure 3c and 3d. Concentration levels are clearly distinguishable and the magnitude of change specifically in the first derivative of SWIR absorbance can be easily used as an indicator of albumin levels in aCSF. In contrast with the NIR region (Figure 2), the results summarized in Figure 3 indicate that albumin at different levels can be more easily measured and distinguish using both SWIR derivative spectra. These preliminary findings await future validation using natural CSF.
The SWIR albumin spectra at four concentration levels of 0.08, 3.08, 17, and 33 g/l. (a) Intensity spectra of the diffusely transmitted light from the sample. Each spectrum is the average of ten measurements. (b) Absorbance spectra of (a) from 1550 to 1850 nm. (c) First and (d) second derivative of the absorbance spectra shown in (b). The dashed rectangles in (c) from 1720 to 1800 nm and (d) from 1670 to 1770 nm highlight areas in which alterations in spectra derivative between albumin concentrations are readily discernible. Absorbance first (e) and second (f) derivative values plotted against albumin levels. The dots represent derivative absorbance values, while the broken lines delineate the best-fit linear regression of the data. High correlation was obtained with R2 = –0.99. Bar graph representation of the mean ± SE of (a) first and (b) second derivative absorbance intensity at each albumin concentration across the wavelength range (dashed rectangle) in Figure 3c and 3d, respectively. Concentration levels are clearly distinguishable, especially according to the first derivative. The same representation for first (c) and second (d) derivative absorbance intensity at each lactate concentration across the wavelength range (dashed rectangle) in Figure 6c and Figure 6d, respectively. Also here the concentration levels are distinguishable, especially according to the first derivative.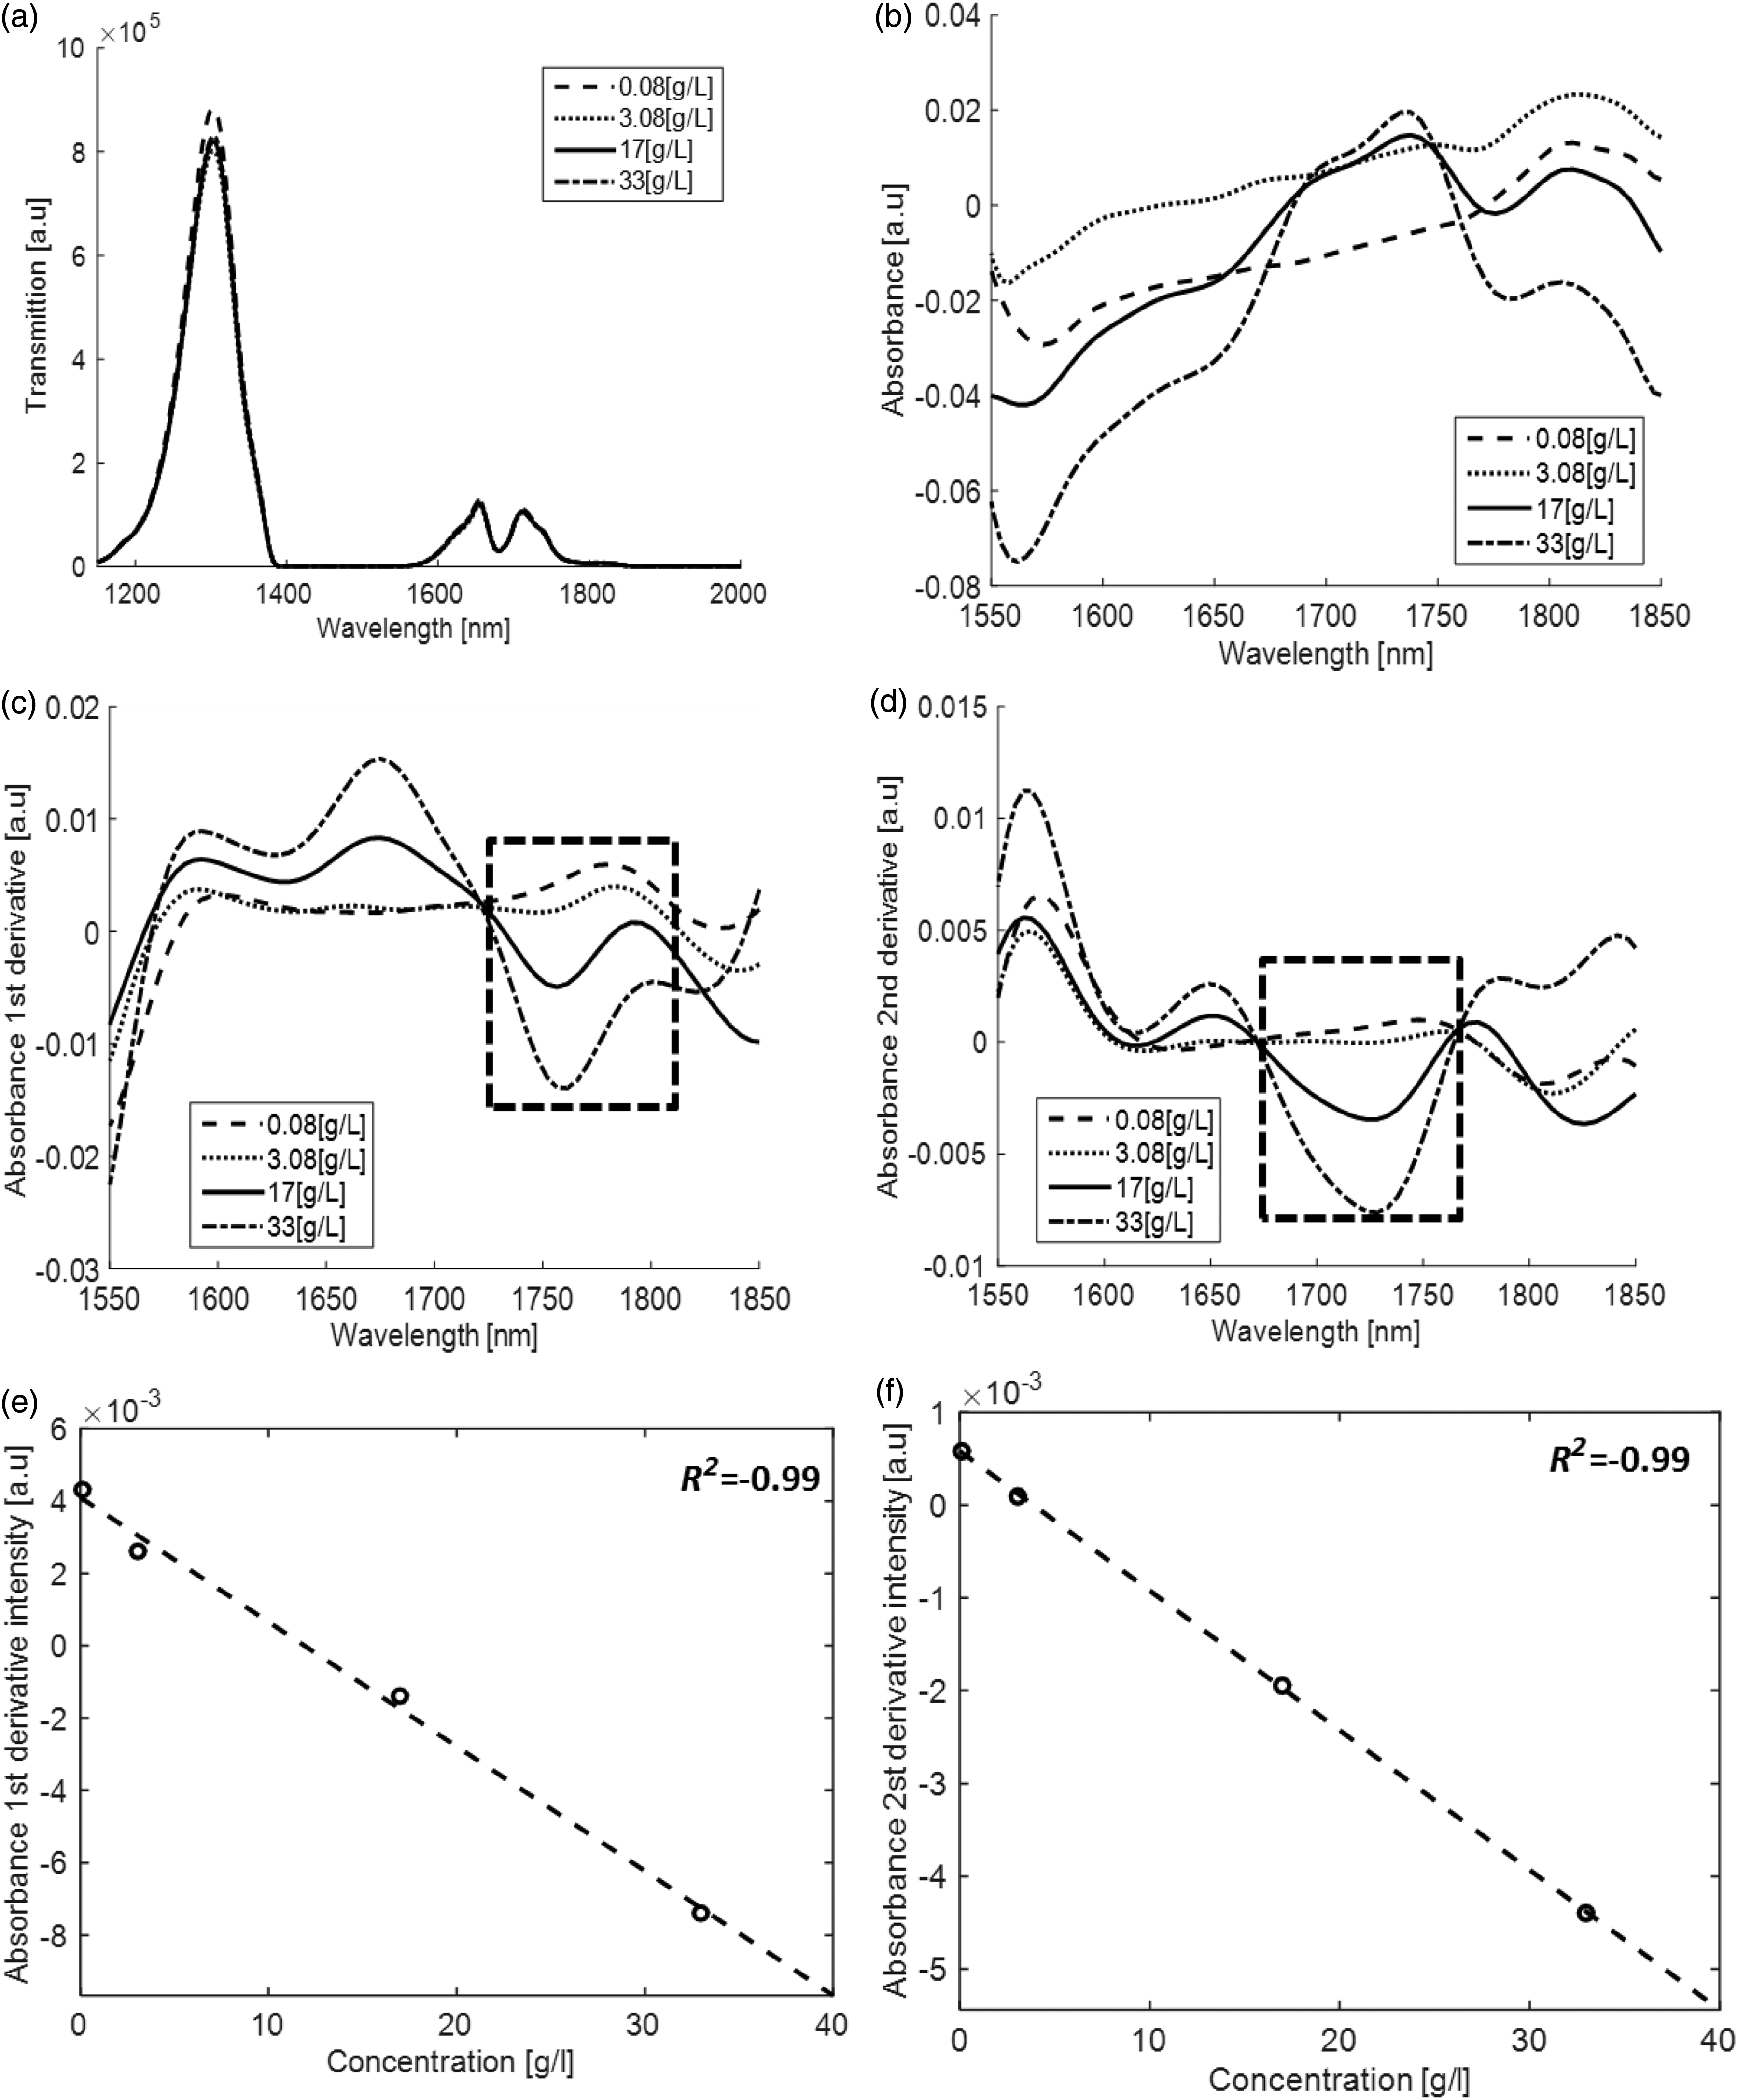
Lactate Near-Infrared Study
As in Figure 2, Figure 5 shows four panels of the lactate spectra in the NIR region: Figure 5a, raw transmission intensity; Figure 5b, corresponding absorbance; Figure 5c and 5d, first and second derivatives of the absorbance, respectively. Each panel includes four concentrations of lactate. Each concentration is the average of ten measurements. As readily apparent, it is difficult to distinguish between concentrations, both by absorbance levels and by their first derivative. However, the second derivative does reflect concentration differences around the 1147 nm peak. Indeed, a difference of more than 10% is detected between the lowest (0.07 g/L) and the two highest (3.07 and 17 g/L) concentrations. Nevertheless, the difference of 10% was anticipated to be found less in natural CSF samples. Therefore, we next analyzed the lactate spectra in the SWIR range in order to improve this sensitivity.
The NIR lactate spectra at three concentration levels of 0.07, 3.07, and 17 g/L. (a) Intensity spectra of the diffusely transmitted light from the sample. Each spectrum is the average of ten measurements. (b) Absorbance spectra of (a). (c) First and (d) second derivative of the absorbance spectra shown in (b).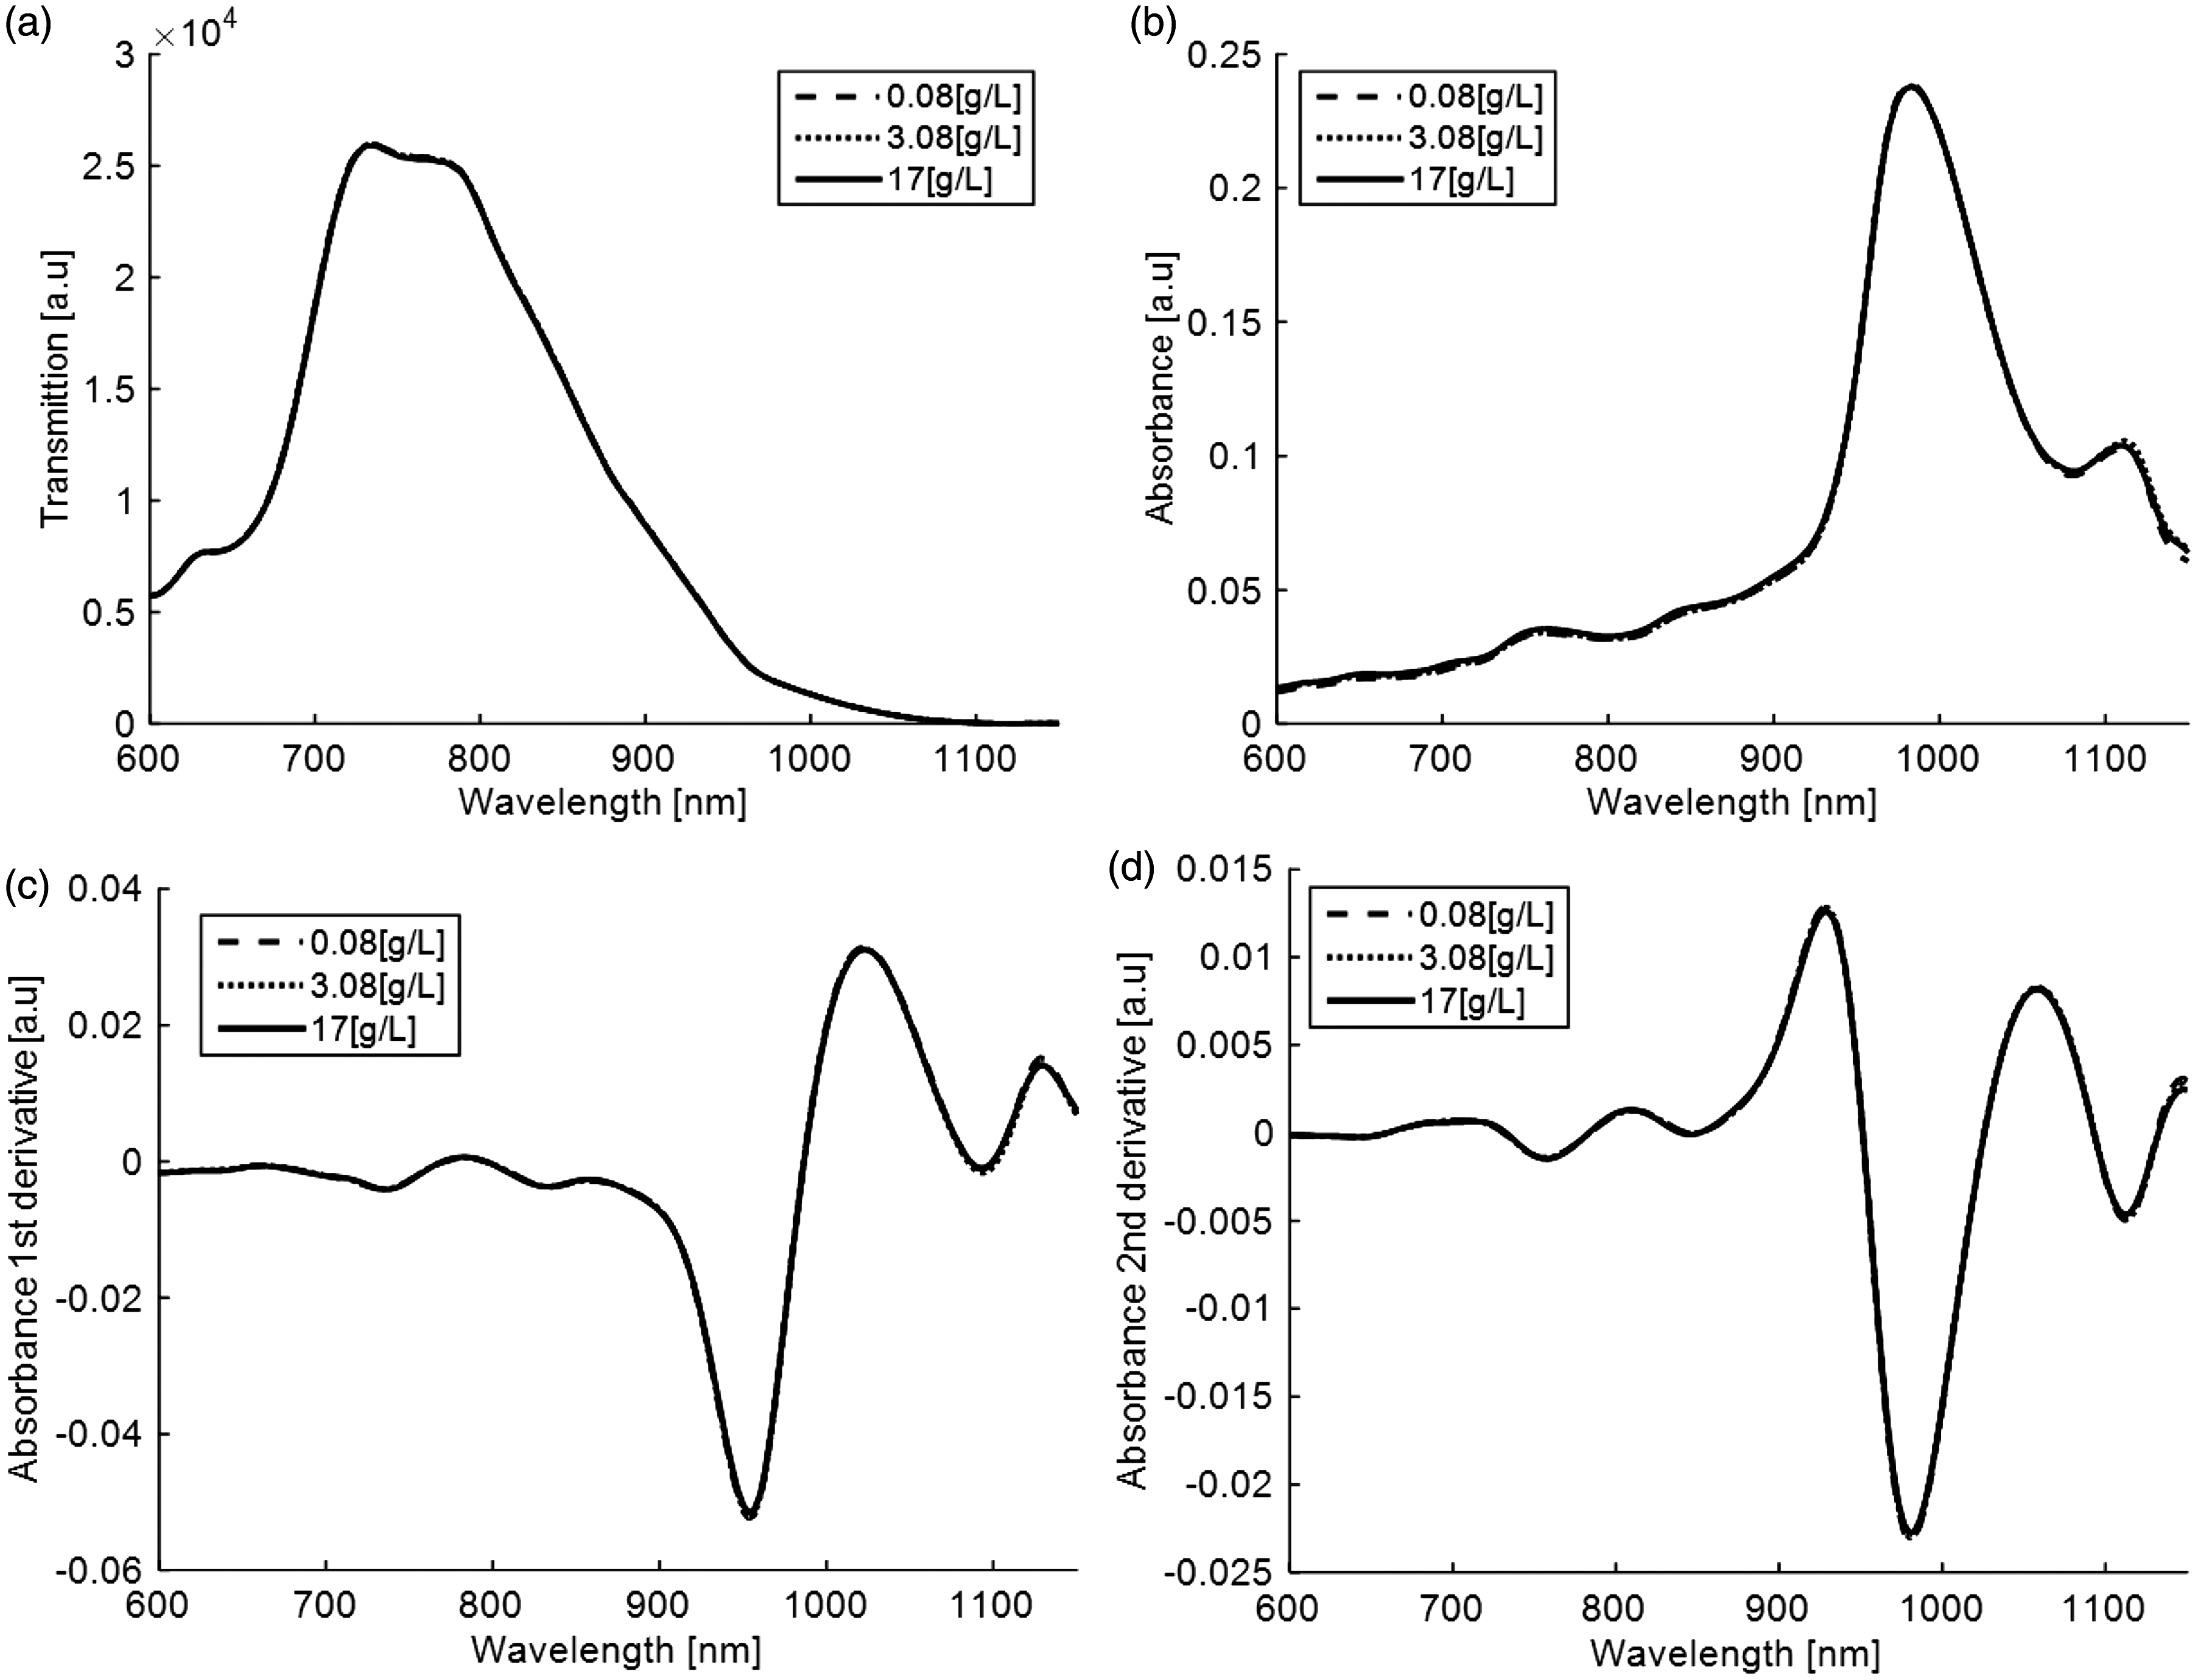
Lactate Short-Wave Infrared Study
As in Figure 3, Figure 6 displays four panels of the lactate spectra in the SWIR region: Figure 6a, transmission intensity; Figure 6b, corresponding absorbance from 1550 to 1850 nm; Figure 6c and 6d, first and second derivatives, respectively, of the corresponding absorbance in Figure 6b. As mentioned above, the regions marked by the broken line in Figure 6c and 6d highlight the resolution of discernment between concentrations and demonstrate that spectral differences become more apparent as lactate levels increase and each spectrum is characterized by its minimum and maximum points. Thus, increases in lactate concentrations result in a lower derivative of light absorbance through the sample. The direct linear relationship between lactate concentration and absorbance derivative intensity presented in linear relationship plots of Figure 6e and 6f were reflected in a Pearson correlation coefficient of –0.95 and –0.99, respectively. Therefore, lactate concentrations can be calculated from the derivative absorbance spectra using the linear regression equation, potentially to aid in the diagnosis of specific neurological conditions. Figure 4c and 4d presents the mean ± SE of the absorbance derivatives for each lactate concentration across the marked regions in Figure 6c and 6d, respectively. By comparing the panels, it is evident that aCSF lactate concentration levels can be distinguished and calculated using the first absorbance derivative. In contrast with spectral results from the NIR region (Figure 5), Figure 6 clearly indicates that lactate concentration can be easily measured and distinguish using derivative spectra from the SWIR. These preliminary findings await future validation using natural CSF.
The SWIR lactate spectra at four concentration levels of: 0.07, 3.07, and 17 g/L. (a) Intensity spectra of the diffusely transmitted light from the sample. Each spectrum is the average of ten measurements. (b) Absorbance spectra of (a) from 1550 to 1850 nm. (c) First and (d) second derivative of the absorbance spectra shown in (b). The dashed rectangles in (c) from 1720 to 1810 nm and (d) from 1660 to 1780 nm highlight areas in which alterations in spectra derivative between lactate concentrations are readily discernible. Absorbance first (e) and second (f) derivative values plotted against lactate levels. The dots represent derivative absorbance values, while the broken lines delineate the best-fit linear regression of the data. High correlation with R2 = –0.95 and –0.99, respectively, was obtained.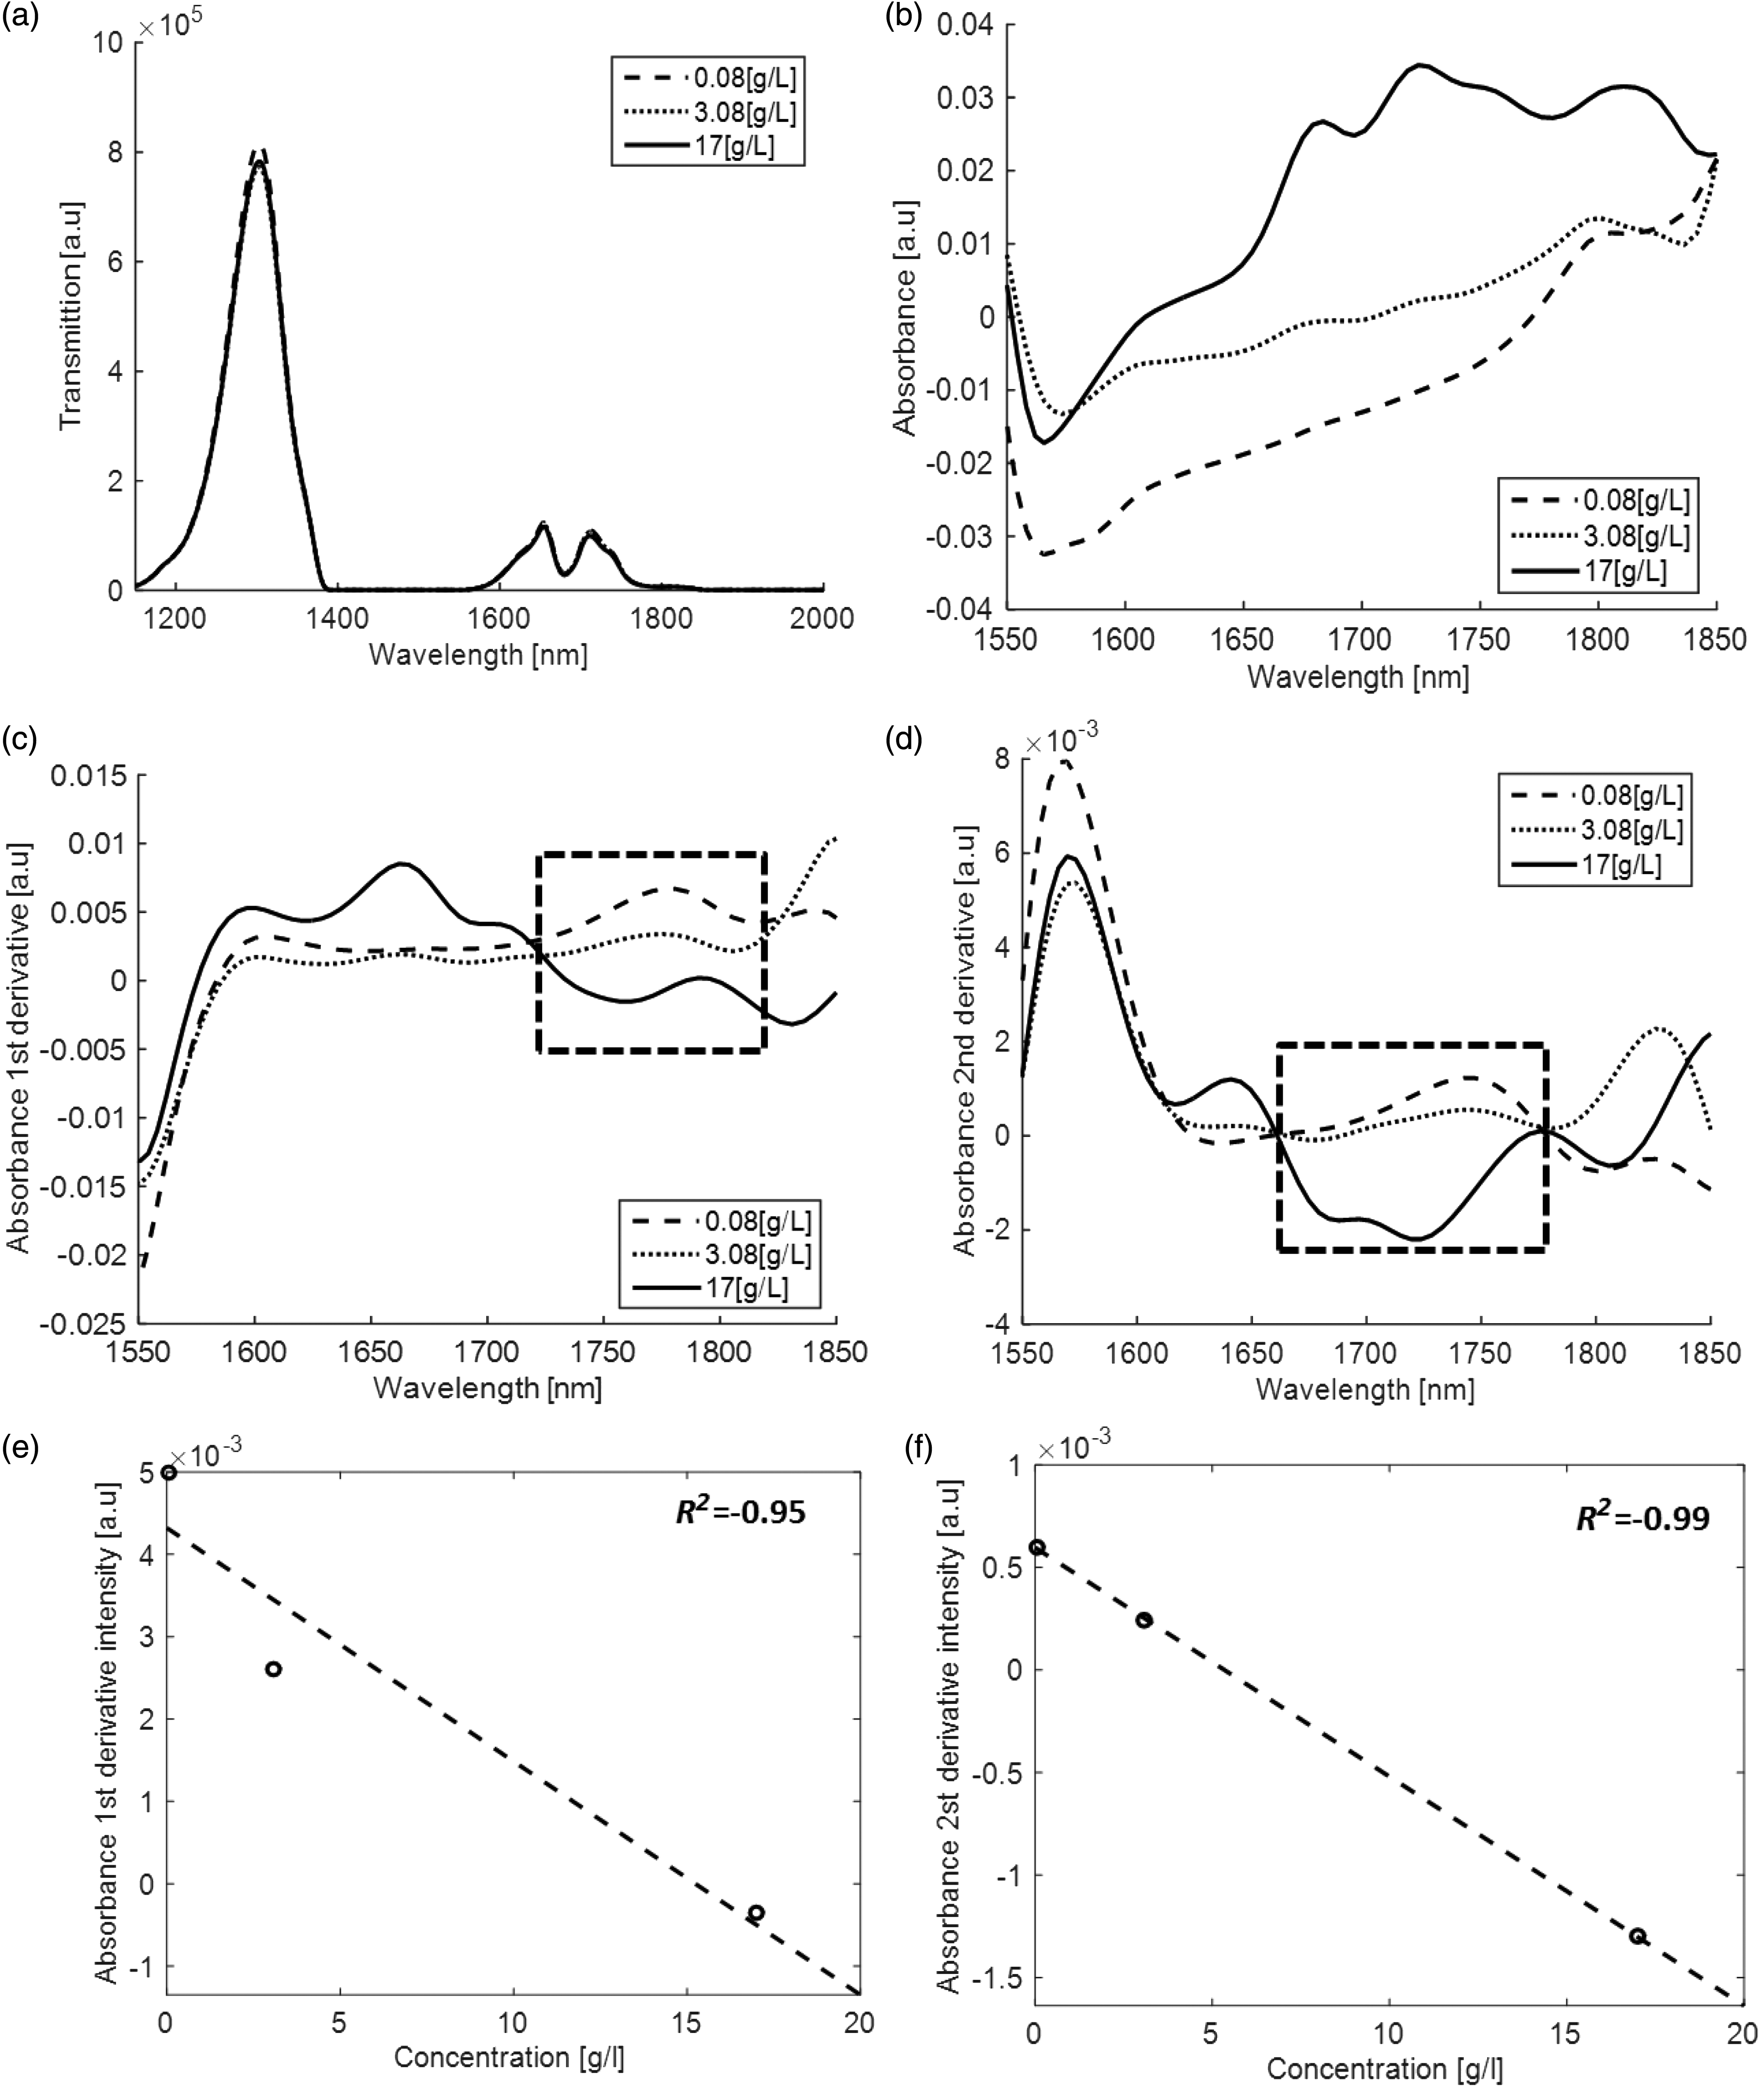
It must be said that although in this work we studied the effect of altered concentration levels either of albumin or of lactate in aCSF in real-life situations, however both concentrations will change simultaneously. This will affect the resultant spectra and the linear dependency that we have observed. Since spectroscopic sensitivity to the main solutes is inevitably affected by the contribution of other solutes, diagnostic uncertainties could potentially occur and the differentiation between different neuropathological conditions may become harder to determine. To address this issue, we suggest future experimentation involving SWIR derivatives combined with preprocessing procedures (OSC, SNV, MSC, etc.) and multivariate statistical methods (MLR, PCR, PLS, etc.)43,44 for increasing analyte specificity and sensitivity while limiting the effects of other CSF compounds, in order to discriminate between neurological diseases. Such further optimization of the current setup for detection of additional analytes at varying concentrations is the subject of our ongoing research.
Overall, the current findings provide proof of concept for future experimentation using animal models to test the feasibility of noninvasive measurement of the CSF through the intact skull. We believe that the noninvasiveness may be enabled by use of longer wavelengths together with an optical clearing agents 45 in order to reduce the scattering effect and increased transparency of photons within the tissue and hence improve penetration depth.
Conclusion
In summary, two spectrometers covering a wide wavelength range of 600–2000 nm were used to assess albumin and lactate concentrations of aCSF samples. It was found that derivative SWIR spectroscopy, at wavelengths between 1660 and 1810 nm, shows better performance and sensitivity to albumin and lactate concentration variations than those obtained in the NIR regions. Furthermore, different fingerprint shape between derivatives at this window was found; Figure 3c versus Figure 6c and Figure 3d versus Figure 6d which further assist to distinguish between albumins to lactate. It is interesting to note the work of the Alfano group who reported recently on the advantage within this window for deep imaging of brain and other tissues.38,46 They named this specific region a “golden window” since it is featured with minimal absorption (high transmittance) and greater penetration depth. Other researchers report on the same.47,48 It should also be noted that temperature is a great influence on the absorption of water and consequently the CSF spectrum. However, in the spectral region of 1527–1820 nm, a small and almost flat dependency on temperature is observed by Jensen et al., 49 which adds more to the advantages of using this specific spectral window. Strong linear relationships between analyte concentration and derivative absorbance demonstrate the ability to provide quantitative information of CSF components which might aid in the diagnosis of neurological conditions in which albumin or lactate levels are altered, leading to improved medical decisions. The current findings await further validation using natural CSF, before it can advance towards application at the patient’s bedside. We acknowledge the fact that a number of factors such as sample handling, temperature, and other compounds of CSF can affect the accuracy/sensitivity for analyte measurement. Nevertheless, as mentioned earlier we believe that SWIR derivatives combined together with preprocessing algorithms and regression methods for increasing particular analyte specificity and sensitivity and lowering the effects of other CSF compounds, has great potential to discriminate and classify different neurological diseases. Alongside its potential as a diagnostic tool, the current methodology may also aid the monitoring of response to therapy of neurological disease, as a fast, reliable, and low-cost alternative platform to the conventional LP test. To our knowledge, this is the first report demonstrating the efficacy of derivative SWIR spectroscopy for detection of neurological disease biomarkers in CSF.
Footnotes
Conflict of Interest
The authors report there are no conflicts of interest.
Funding
This research received no specific grant from any funding agency in the public, commercial, or not-for-profit sectors.