
Abstract
Dairy products play an important role in our daily nutrition. As a turbid scattering medium with different kinds of particles and droplets, each alteration of these components changes the scattering properties of milk. The goal of this work is the determination of the amount of main scattering components, the fat droplets and the casein micelles, by understanding the light propagation in homogenized milk and in raw milk. To provide the absolute impact of these milk components, the geometrical and optical properties such as the size distribution and the refractive index (RI) of the components have to be examined. We determined the reduced scattering coefficient
Introduction
Milk and other dairy products are some of the most important ingredients in everyday foods and beverages. Although the components of milk are wellknown, there is no regularly used technique to determine the constituents of raw milk samples on-line at the farms. Commercial devices to determine the fat and protein content via Fourier transform infrared (FT-IR) measurements exist; however, they cannot be used to measure the milk components on-line during, for example, a milking process, because separating of the samples from the storage vessel and a calibration of the device by the company are necessary. Nevertheless, by determination of the constituents in process monitoring and quality assurance in dairy industries and at farms, the health of cows and the economic value of the milk could be analyzed.
Many examinations of milk products via optical measurements were performed in the preceding years. The number of publications concerning milk increased, especially with the focus on sensing the concentrations of fat and protein. For best use of resources, an optical sensor should be implemented to determine the composition of milk in every step from the farmers’ raw milk to the bottling of homogenized ultra-high temperature (UHT) milk without dilution or separation of a sample and without the need for calibration. Recently, a lot of effort was put into investigating commercial or homogenized milk using different methods, using hyperspectral imaging,
1
laser light scattering,2,3 oblique incidence reflectometry,
4
spatially resolved diffuse reflectance spectroscopy,5,6 transmission mode spectroscopy,
7
photon time-of-flight spectroscopy,
8
or using diluted milk samples in an angular resolved setup.
9
All these techniques showed correlations of the fat content and the scattering properties of milk. Tsenkova
10
measured raw milk without any homogenization just as Aernouts et al.
11
and Bogomolov and Melenteva,
12
but in their methods a statistical classification is necessary to determine the fat and protein content. Aernouts et al.
13
published similar integrating sphere measurements as presented here, where they determined the reduced scattering coefficient, the scattering coefficient, and the absorption coefficient of different undiluted raw milk samples and found correlations of these coefficients and the fat and protein content. In Aernouts et al.,
14
they add the theoretical description of the light propagation using Mie theory to present
In our work, the refractive indices of both milk fat droplets and casein micelles were determined to make the theoretical description of the light propagation more reliable. Furthermore, we provide a more sophisticated analysis of the light propagation by fitting Mie theory to the measured data in order to determine the concentrations of fat and casein and the size of the fat droplets of different milk samples absolutely. The examined milk samples differ from the ones used in Aernouts et al. 14 with regard to the kind of milk samples, since we investigated raw milk samples from different cows and at different times during the milking process. The raw milk samples were specially treated to destroy the casein micelles, so the influence of the casein micelles on the scattering behavior could be investigated. Furthermore, raw milk samples after different homogenization steps are regarded.
The geometrical and optical parameters of the components of milk, such as the particle size distribution (PSD) of the scatterers, their refractive indices (RI), and the concentrations of the scatterers, have to be known to describe the light propagation in milk using Mie theory assuming the scattering particles to be spherical. However, some of these parameters vary in each sample of milk. We examined the influence of all parameters relevant for Mie theory to identify the constant properties and the changing determinants to reduce the fit parameters. We found that the remaining number of fit parameters for the Mie theory calculations are the concentrations of fat and protein as well as the mean size of the fat globules for raw milk.
At first, an introduction to milk and published values of different parameters are given in the “Materials and Methods” section together with the used materials, the applied setups, and the used Mie theory algorithm. In the “Results” section, we show at first the examination of the particle sizes of the fat droplets and the casein micelles. In the next subsection we present the determination of the refractive index (RI) of both, the results were used in the following Mie theory calculations. Then, the measurements of the scattering coefficient
Materials and Methods
The three main components of milk beside water are lipids, protein, and lactose. They form a specific mixture of a solution (lactose, whey protein), a dispersion (casein protein), and an emulsion (lipids). To simulate light propagation in milk correctly, the shape, the size distribution, and the RI of the scatterers and the surrounded medium have to be known. The particles which are responsible for the turbidity of milk are mainly the lipid droplets and the insoluble part of the proteins, the casein micelles. The latter represent about 80% of the proteins in milk. 16 Besides, there are whey proteins, which are fully dissolved, just like lactose. They form the milk serum, which is a clear transparent medium with a RI of 1.342 (589.3 nm). 17 To simulate the light propagation, the interaction of optical radiation with homogeneous spheres can be calculated using Mie theory. 18 It is applied for the fat droplets and the casein micelles with milk serum as a surrounding medium (with the RI of 1.342 and the dispersion of the RI of water 19 ).
Lipids
Lipids are important nutrients for humans. The milk fat forms spherical droplets with sizes of a few hundred nanometers 20 up to 10 µm. 21 In raw milk, the size of the droplets differs between different cows, time in milking process, or lactation state. Also, the concentration of milk fat in raw milk is in the range of 2–8%. This depends on the cattle breed (typically: cow, buffalo, goat, or sheep),22,23 the health of the animals,11,24,25 or the lactation state. 26
The fat globules form a fairly stable emulsion, one of the reasons for that is the thin protein layer around each globule, acting as emulsifier. 27 An emulsifier has a hydrophilic part and a lipophilic part. To reduce the diameter of these globules an ultrasonic treatment can be applied. Since a change in size of the fat droplets comes along with a change of the surface area of the fat droplets, the effect of homogenization may not only depend on the homogenization power and the time, but also on the concentration of the emulsifier.
Casein
The casein protein, which comprises about 80% of the protein in milk, consists of four main types, namely α1-, α2-, β-, and κ-casein. These four proteins together form a solid spherical formation, which is called a micelle. Shape, structure, and size of these micelles are described in the literature,16,28–32 but some of the data are contradictory. However, whether the micelles consist of small spherical sub-micelles or if they form a radially symmetric structure has not been shown yet. As already shown in literature, the diameters of the casein micelles vary in a wide range from 50 nm 31 to 680 nm. 33 The mean diameter differs between 120 nm 31 up to 230 nm. 29 The micelle structure subsists only in liquids. By drying the dispersion, the micelles change their geometry.
Samples and Preparation
Non-Fat Milk
To determine the RI of the casein micelles and to examine the scattering properties of the micelles in milk, deep-frozen milk samples were used. These standards with a fat content of 0.03% and a protein content of 3.15% were extracted by QSE GmbH, Germany.
Extracted Milk Fat
For the determination of the RI of milk fat, commercial butter was heated up to 60 ℃ to separate the fat phase from the water phase and to get a liquid sample. The measurements were done on the liquid sample just before it thickened. In modern manufacturing, the fat for commercial butter is separated by a centrifuge and heat-treated. This can cause a small error in the RI compared to the RI of milk fat from untreated milk. The fat could also be separated from milk by chemical methods, but since the chemicals dissolve in the fat phase, this will change the RI more considerable. Remaining ingredients in the fat phase of butter are β-carotene or riboflavin, which occurs in a low concentration and this conforms to the ingredients in the fat phase of cow milk.
Raw Milk
Raw milk from dairy cows was used. In one measurement series, the milk from three cows was measured. Two samples were taken from each cow, one at the beginning and one at the end of the milking process. For another measurement series with raw milk, a mixture from the milk storage vessel was used. The milk was not older than three days. The fat content was determined by the Röse-Gottlieb method. 34 For homogenization experiments, the milk was treated by a Sonifier 450 homogenizer (Branson, Germany). Samples of 400 g each were treated for times from 0 min to 25 min. During the sonification, the milk container was surrounded by an ice-water bath to reduce heating of the sample.
For some measurements, raw milk was mixed with ethylenediaminetetraacetic acid (EDTA) to denaturate the casein micelles. Ethylenediaminetetraacetic acid destroys the calcium phosphate nanoclusters inside the casein micelles, whereby the casein micelles denaturate. Thereby one EDTA molecule acts as a chelating agent for one Ca2+, 35 so the amount of the required EDTA was calculated through the known amount of substances of casein in the milk samples. Afterwards, the casein proteins are dissolved and do not give rise to the scattering anymore.
Experimental Methods
Collimated Transmission Setup
The extinction coefficient

Integrating Sphere Setup
A single integrating sphere system consisting of a halogen lamp (Osram, Germany), a commercial sphere (Labsphere) with a diameter of 25.4 cm, and two spectrometers (Maya2000 Pro, Ocean Optics, from 180 nm to 1100 nm and NIRQuest512, Ocean Optics, from 900 nm to 1700 nm) were applied to determine the total transmittance and the total reflectance of the sample slice. Two adjacent ports (each 2.54 cm in diameter) are utilized to align sample and reference (SRS99, Spectralon) in equatorial plane to perform measurements with a comparison method without using any correction factors.
We use a baffle between sample and reference to prevent the direct interactions between both. The total transmittance and the total reflectance were obtained by illuminating subsequently the sample and the reference by an imaged beam. The signal of the hemispherical intensity is detected using an optical fiber (numerical aperture (NA) = 0.22) at the north pole of the sphere connected to the spectrometers. For evaluation of the optical properties, namely the reduced scattering coefficient
Fit of Mie Theory
The Mie theory algorithm used is implemented in Delphi (Embarcadero Technologies, Inc.). The algorithm handles polydispersity by dividing the PSD into nine discrete sampling points for particle size values for which the scattering coefficient is calculated and summed up. The parameters necessary for the calculation of the scattering coefficient by Mie theory are the mean diameter and the width of a log–normal size distribution (which is used for milk), the volume concentration, and the complex RI of the scatterers. The complex part of the RI indicates the absorption coefficient. Since the complex part is by a factor of 10–5 smaller than the real part, the complex part is neglected.
For the measurements of the collimated transmission, the milk samples were diluted, hence no dependent scattering was considered. For the integrating sphere measurements, dependent scattering can influence the results and has not been considered in our calculations. It is reported that dependent scattering can decrease the scattering coefficient by about 5% comparing a twofold dilution to the pure state. 14 However, the occurrence does not only depend on the concentration of the scatterers, Voit et al. 39 found that derivations due to dependent scattering remain small, even for concentrations up to 20% for particle size of 2 µm and a RI of 1.59. We expect dependent scattering because of the small particles in milk, like the casein micelles or homogenized fat droplets, hence the influence of dependent scattering on the scattering coefficient should lead to a greater variance at small wavelengths. This effect has to be examined in further studies.
For the fit the “lsqcurvefit” nonlinear least square solver from the optimization toolbox in Matlab (The Mathworks, Inc.) is used. For numerical calculation of finite-difference gradients a minimum change in variables of 10–4 has been chosen. Depending on the goal of the measurement different fit parameters were used like the Cauchy coefficients of the RI, the PSD, or the volume concentration.
Results
Particle Sizes
Milk Fat Droplets
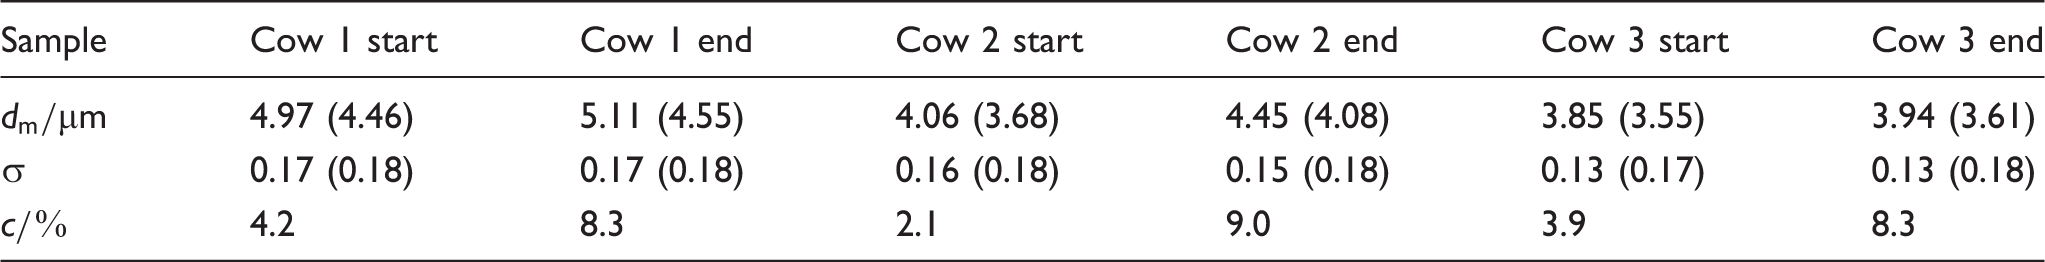
First, we regard the size of the milk fat droplets that is measured with a Mastersizer (Malvern, UK). The RI was chosen in the Mastersizer software to be 1.4564 for the particles and 1.33 for the dispersant. We used the default RI of this software, because it differs negligible from the value we determined (see the “Refractive Index” section below: n = 1.459 (633 nm)). The “polydispers” analysis model in the software of the Mastersizer was adjusted. The results of milk samples during an ultrasonic homogenization process and the results of milk samples from three cows at the beginning and at the end of the milking process are shown in Figure 1. All samples were treated with EDTA. We found that the size distribution of the fat droplets in fresh raw milk has the shape of a log-normal distribution. During the homogenization process, the Gaussian peak does not shift to smaller sizes with a fixed width, but a second peak arises at small sizes. So, a bimodal distribution describes the results properly during the whole homogenization process. For untreated milk, the smaller peak seems to be an artifact of the measured data, because the milk was treated by EDTA, which destroys the casein micelles and the size distribution is calculated by the scattered light based on laser diffraction analysis, particles smaller than the size range of the Mastersizer can affect the size distribution. This assumption is affirmed by the fit of the scattering spectra, which is shown later, where the peak of smaller sizes vanishes for untreated milk. However, the measurements show that bigger fat droplets directly reduce to smaller sizes, so the mean diameter do not decrease linearly with the homogenization time. The PSD of the fat droplets for different cows can also be described with a log-normal distribution. The mean diameter of the smaller fat droplets (left peak) stayed almost constant, which solidifies the assumption of an artifact. The mean diameter of the larger fat droplets (right peak) varied in a range of about 1 µm. The width of the log-normal size distribution of the right peak and the mean diameter of the droplets stayed approximately the same for each cow from the beginning to the end of the milking process. These results are later used to compare and discuss the results of the fit procedures on the scattering measurements.
Size distribution of milk fat droplets measured with the Malvern Mastersizer. The solid line connecting the data points shall serve as a guide to the eye. The size distributions can be described by a bimodal log-normal distribution. (a) During a homogenization process after the homogenization steps of 0 min (circles), 3 min (squares), 6 min (diamonds), 8 min (triangles), and 20 min (stars). (b) For different cows each one sample from the beginning of the milking process (circles) and one from the end (diamonds).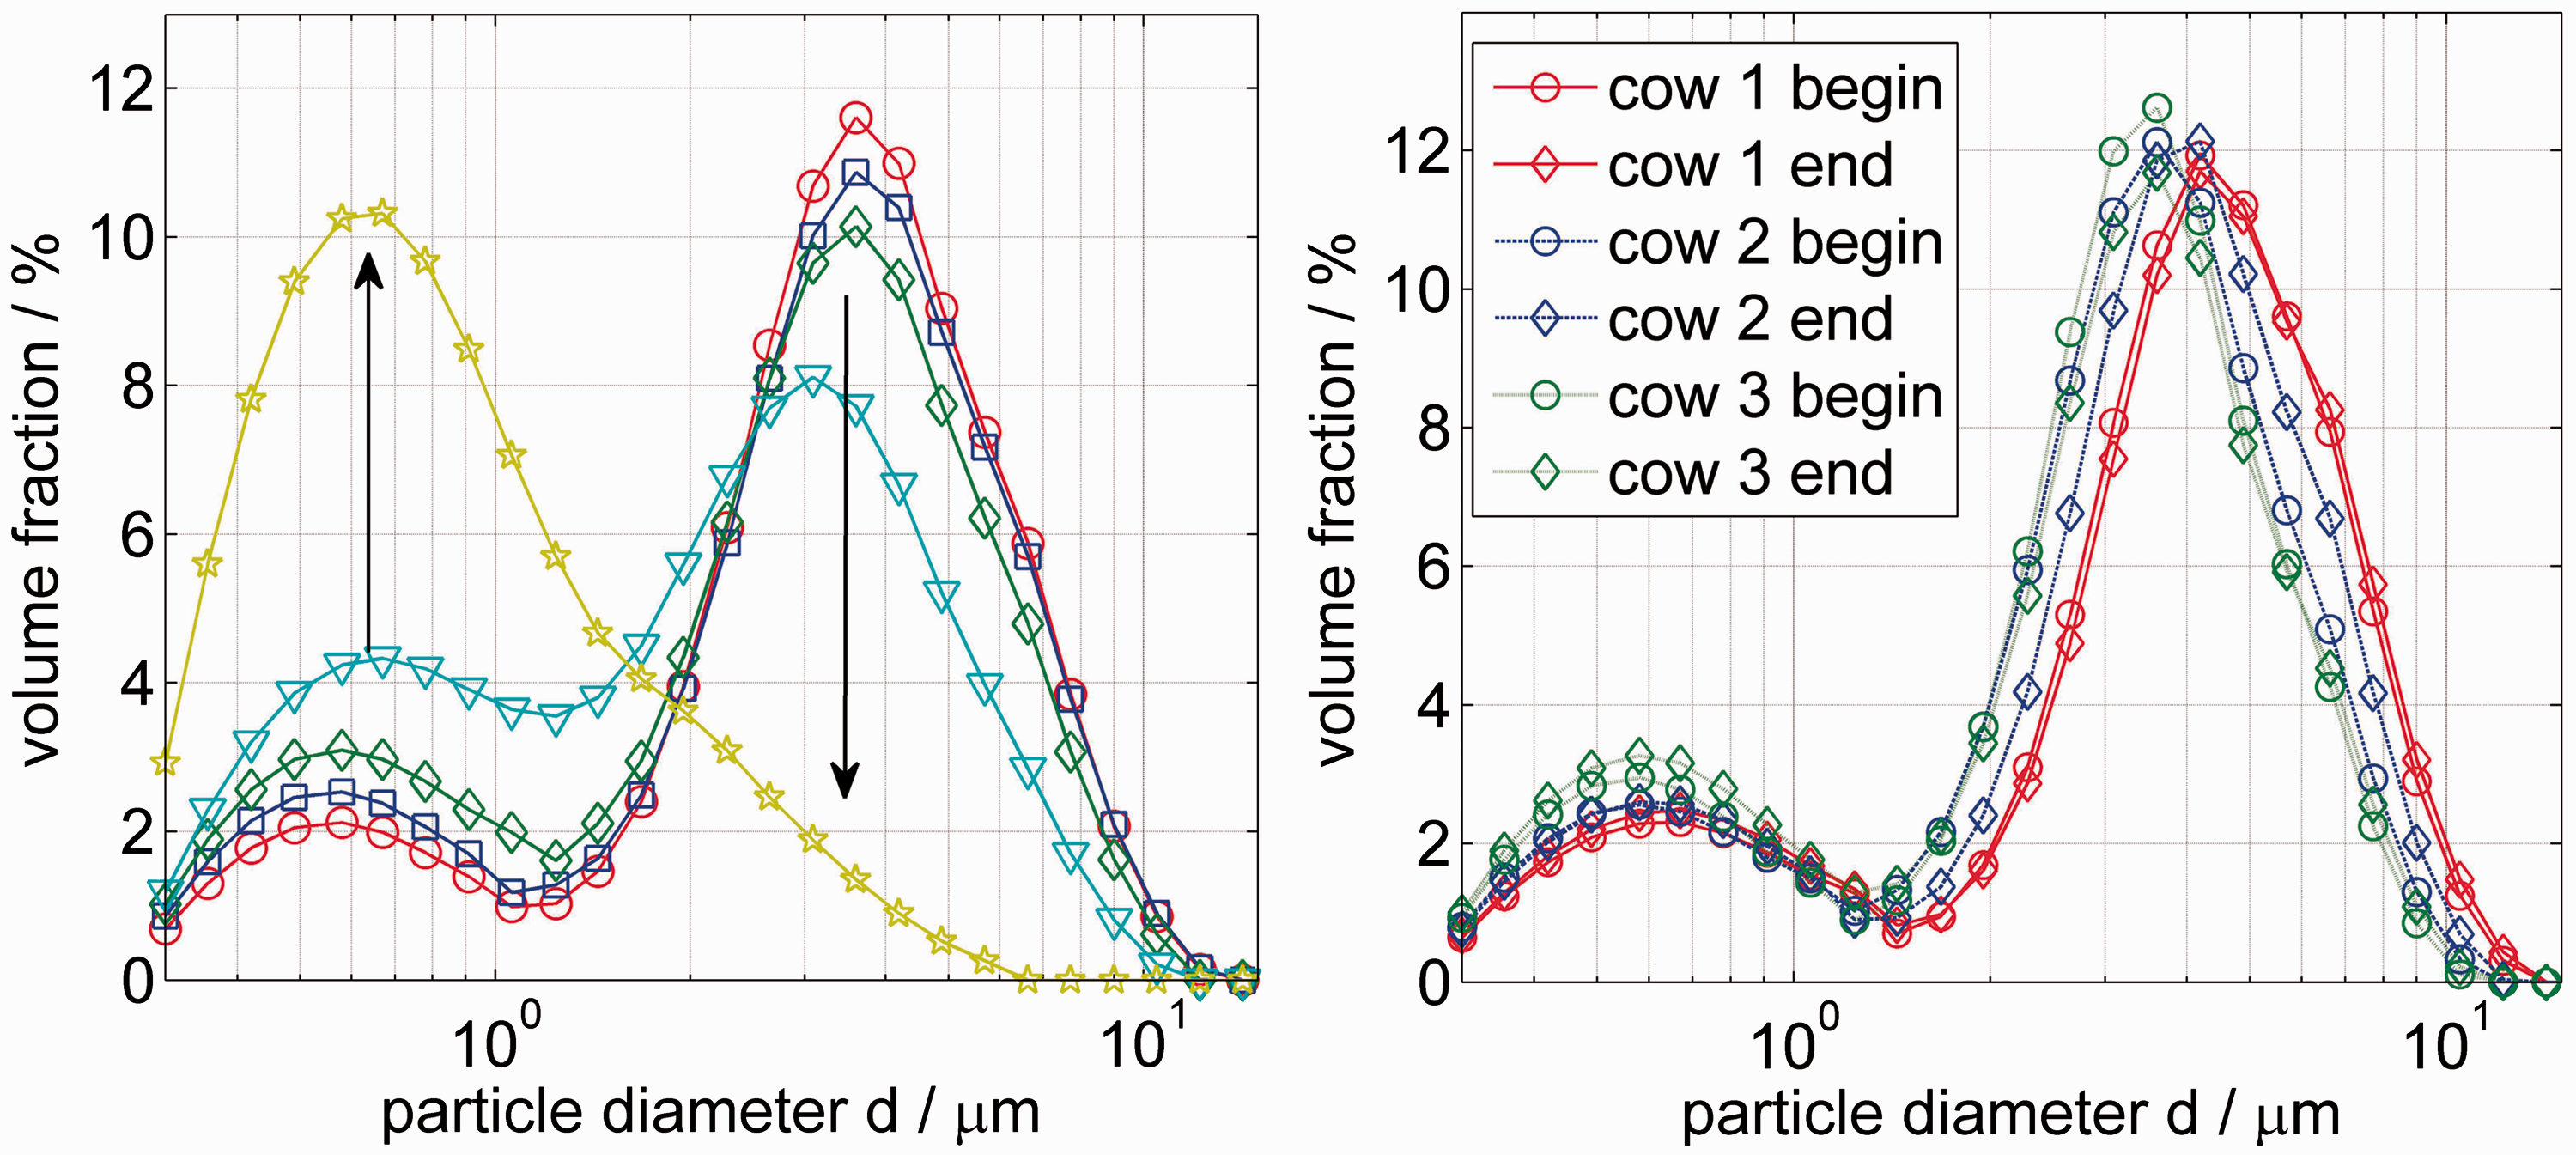
Casein Micelles
For determining the PSD of the casein micelles, we applied a Zetasizer Nano (Malvern, UK). It detects the backscattered light and uses Mie theory to generate the size distribution assuming spheres. For this experiment we used commercial skim milk. For the determination of the PSD of the casein micelles, the default RI values from the Zetasizer software were used as there were for the continuous medium (1.33) and for the scattering material (1.45). From this measurement we got a mean diameter of 189 nm. The validity of the assumption of a monomodal distribution is shown through the polydispersity index of 0.072, which shows that we have a narrow distribution. In the case the polydispersity index is above 0.1, it is no longer called a monomodal distribution.
For an exact value, the shape of the distribution and the RI of the particles should be fully variable and the sample should only consist of casein micelles. Here, commercial skim milk was used, which contained remaining milk fat droplets. These droplets were expected to have a similar size to the casein micelles, because commercial milk is usually skimmed using a centrifuge, so fat droplets with similar weights and sizes to the casein micelles will remain in the skim milk. As a consequence, it cannot be guaranteed that the result was not distorted by the fat droplets. To verify this value, we used the mean diameter later (see the “Refractive Index” section) as a fit parameter while matching Mie calculations with
Refractive Index
Milk Fat
To determine the RI of milk fat, the method recently described was used.
40
The result of the measurement and the fit are shown in Figure 2. The Cauchy’s equation
Measured RI values (crosses) of milk fat extracted from butter at seven different wavelengths. The parameters 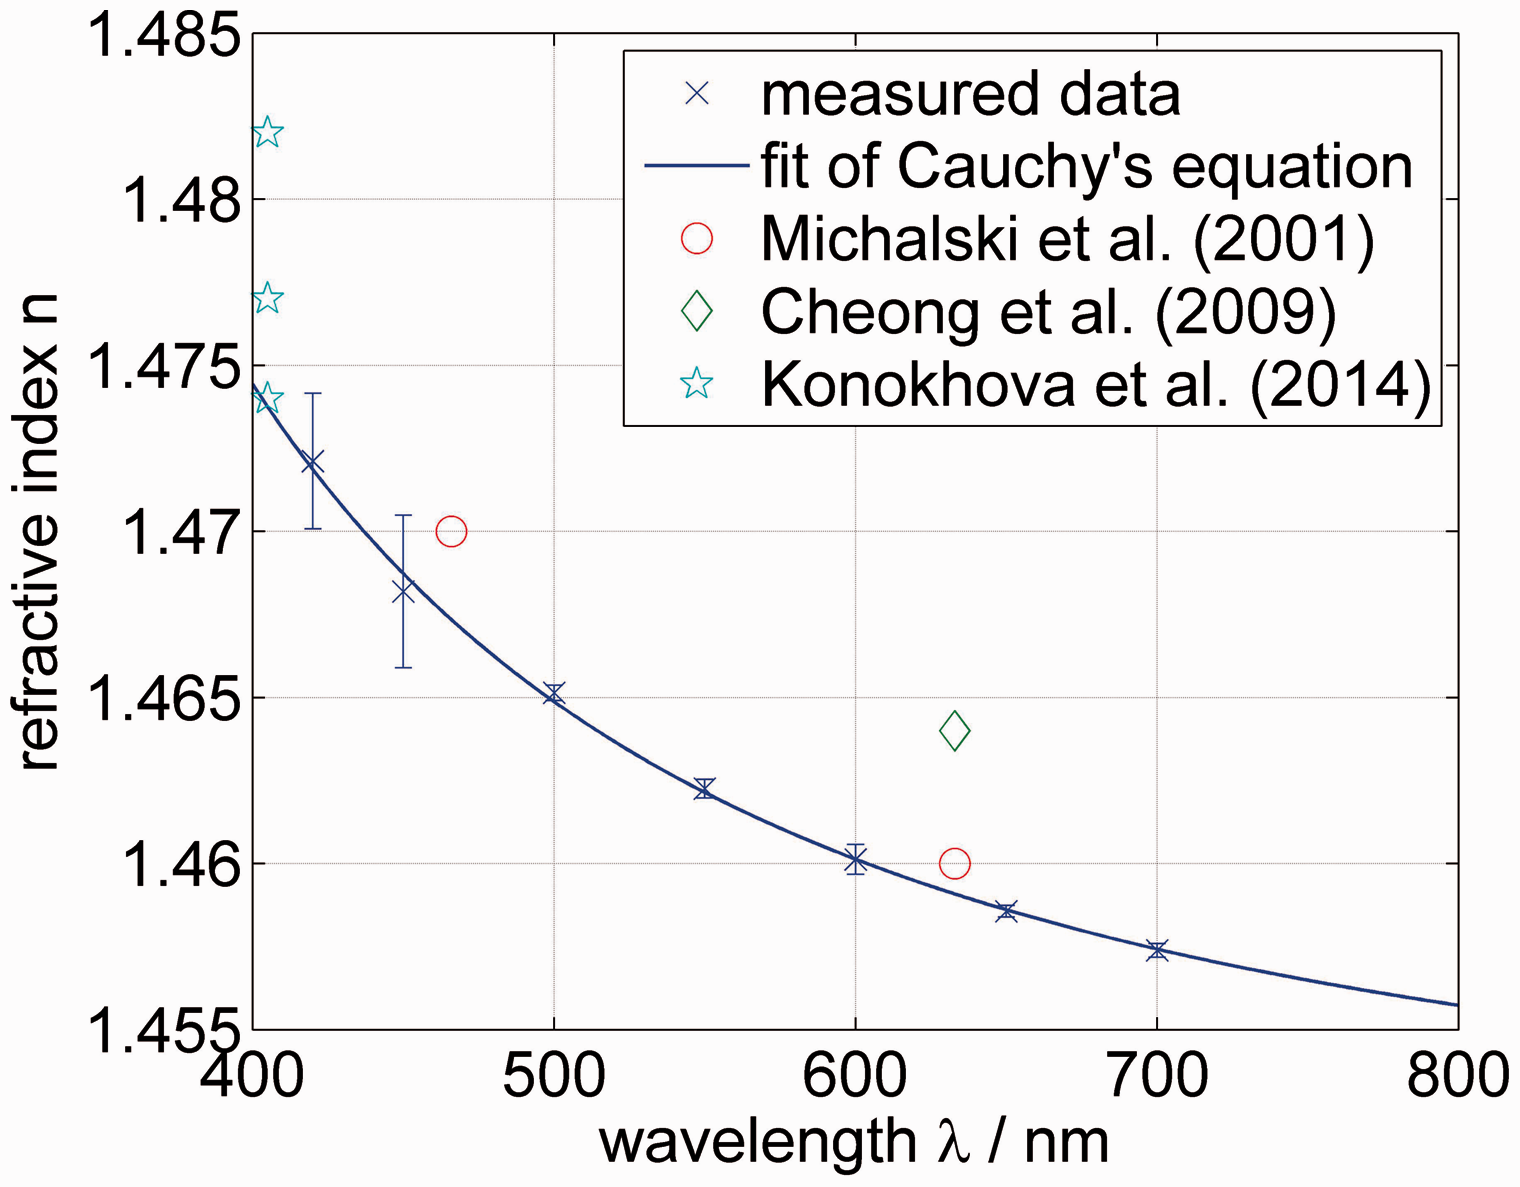

Casein Micelles
In order to determine the RI of casein micelles, we used “non-fat” milk samples. The collimated transmission of the non-fat milk samples was measured to get the scattering coefficient

In Figure 3, Measured scattering coefficient 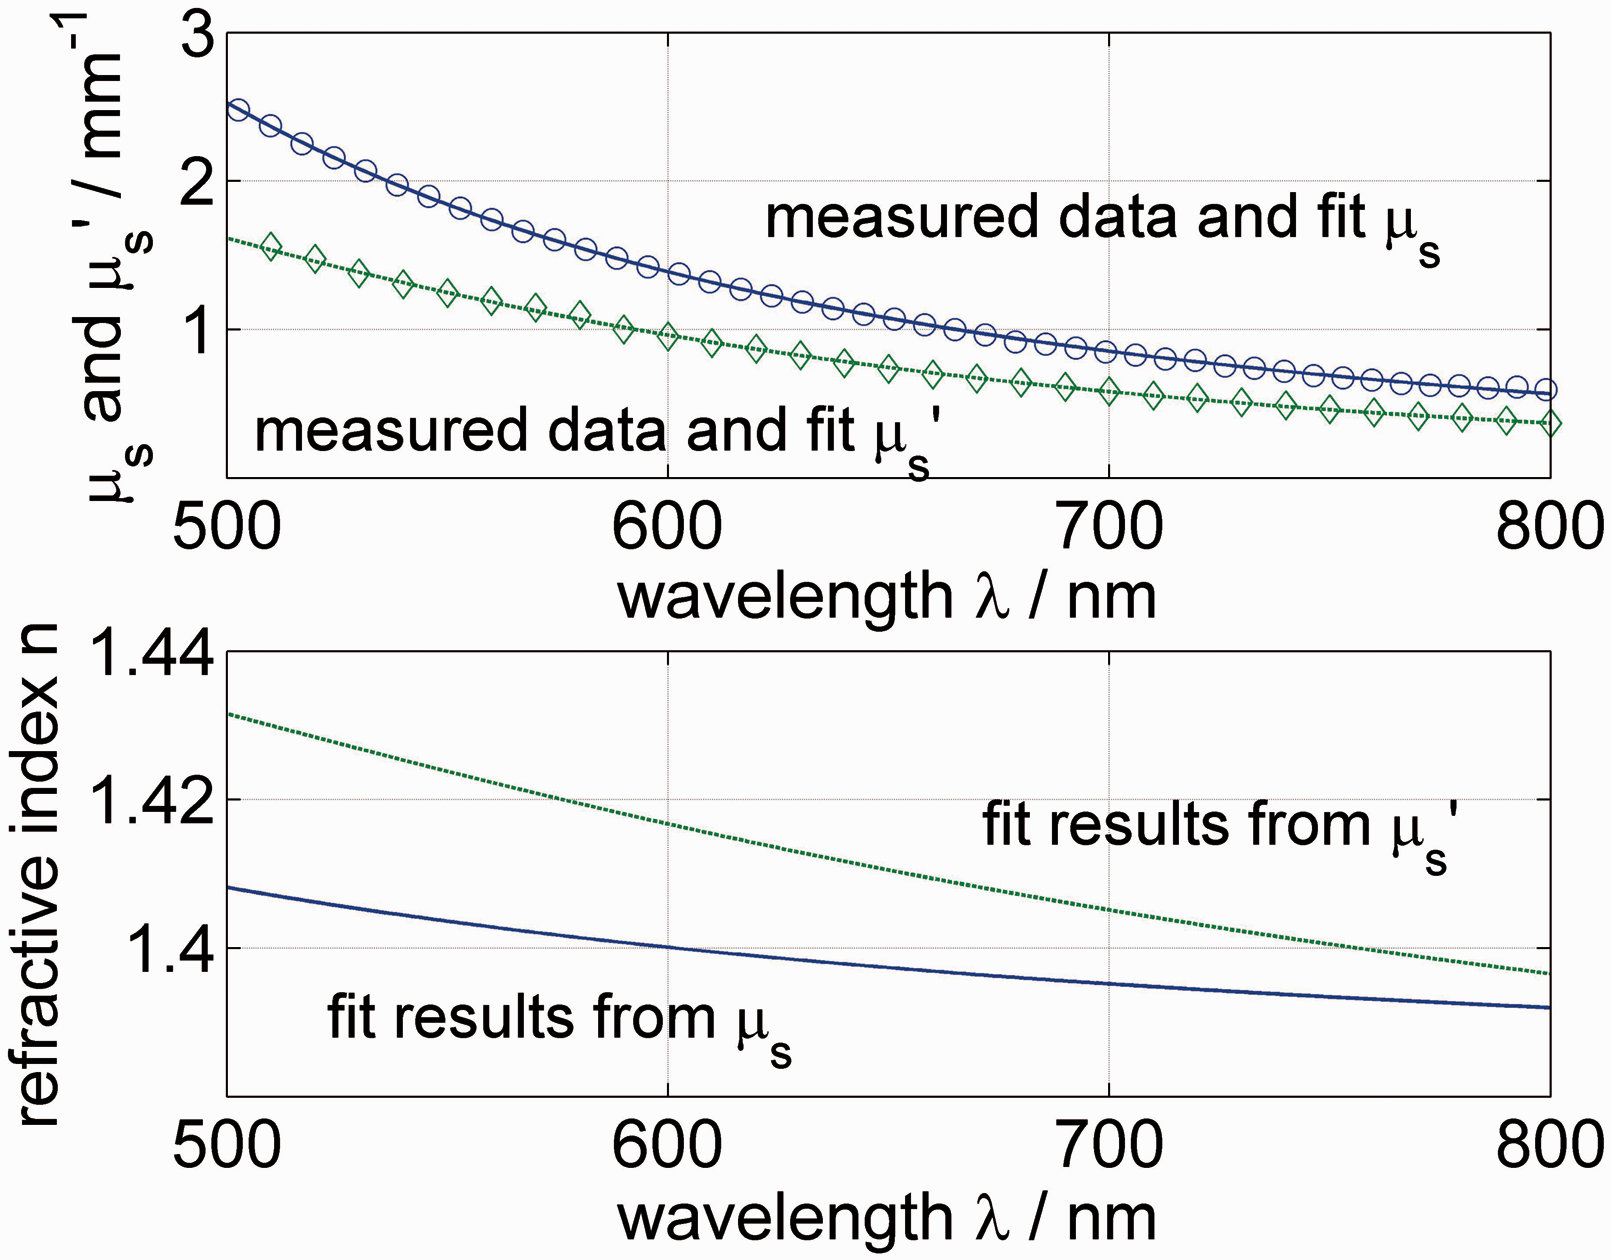
Since the size distribution of the casein micelles could not be determined reliably by the Zetasizer, the mean diameter
The fit yields
As a result, a mean dispersion of the RI of the casein micelles can be given as:

This result differs clearly from the only found measured value for casein micelles reported in Griffin and Griffin 42 (1.57 at 600 nm). In Attaie and Richter, 22 a value of 1.503 (at 589 nm) for the RI of casein micelles was determined, which is distinctly lower than the value of Griffin and Griffin 42 and closer to our result. In a later publication, a value of 1.462 at 589 nm is assumed, 5 but not verified. According to the explanation in the section on the RI of milk fat, we use this result in the following calculations of Mie theory in a wavelength range of 400–1300 nm.
Scattering Coefficient
The results of the raw milk samples of different cows (samples already discussed in the “Particle Sizes” section) are presented first. We focused on the change of the fat globules size, so the samples were mixed with EDTA. The result of Scattering coefficient Fit result of 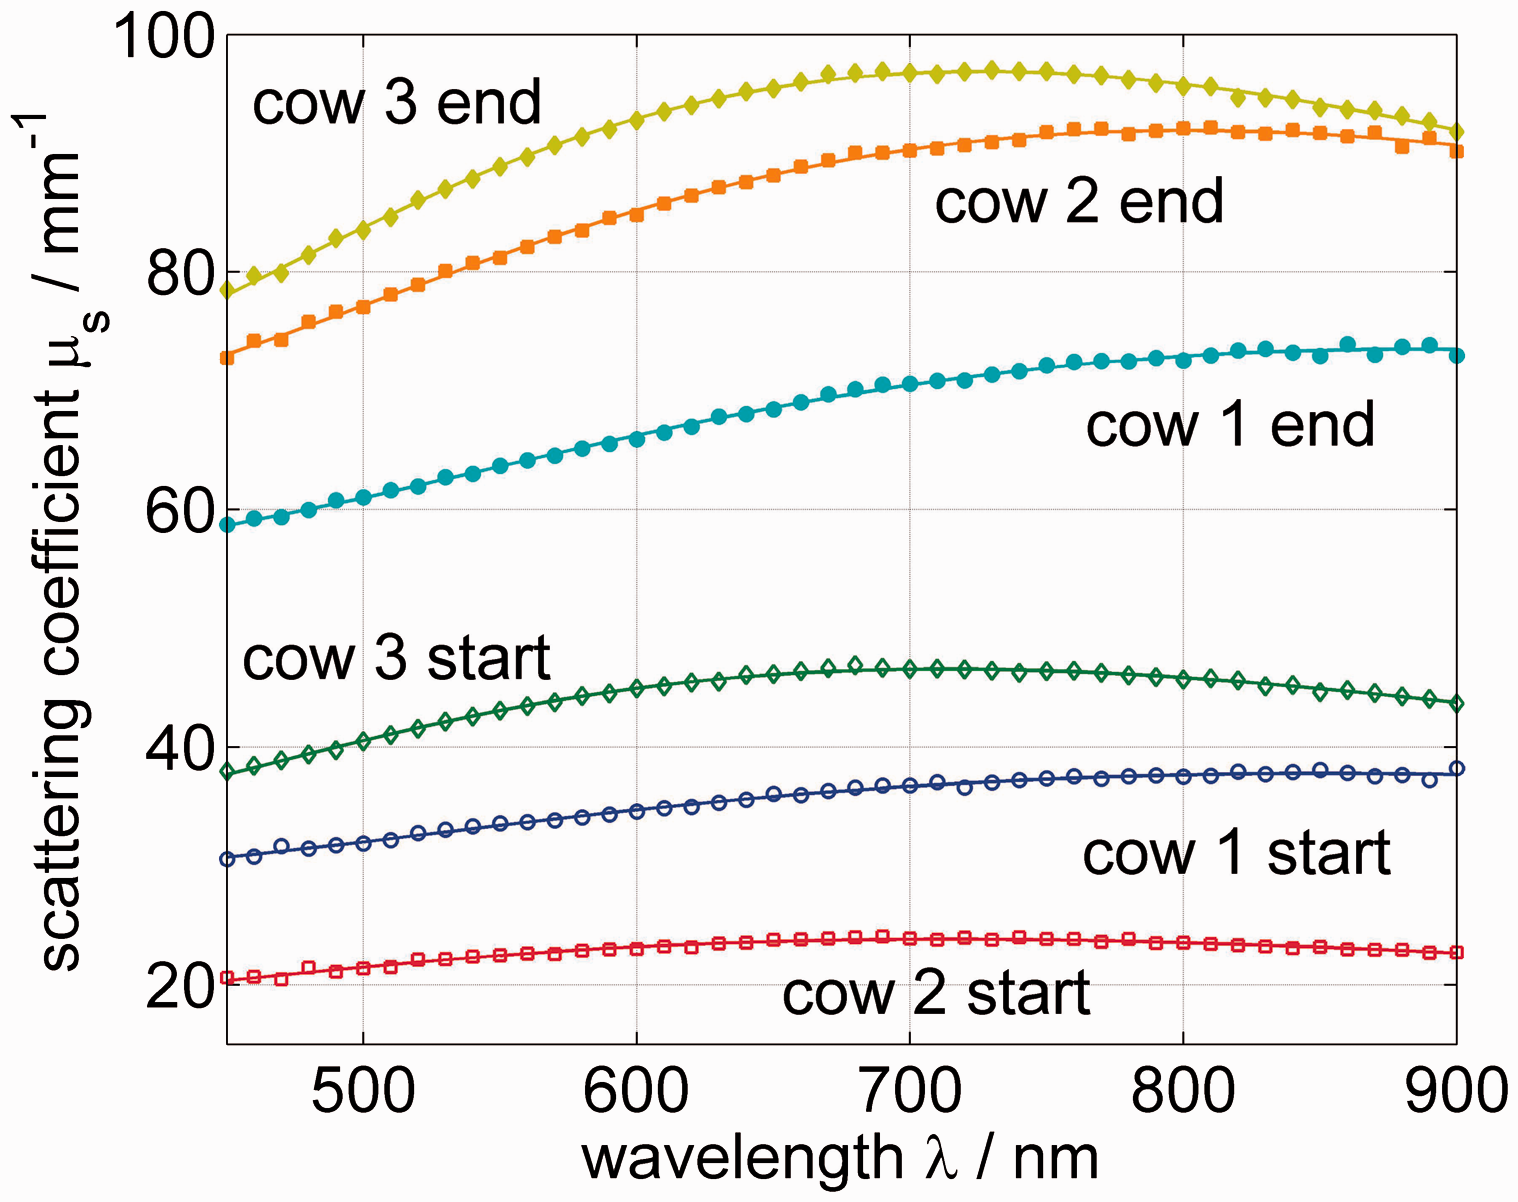
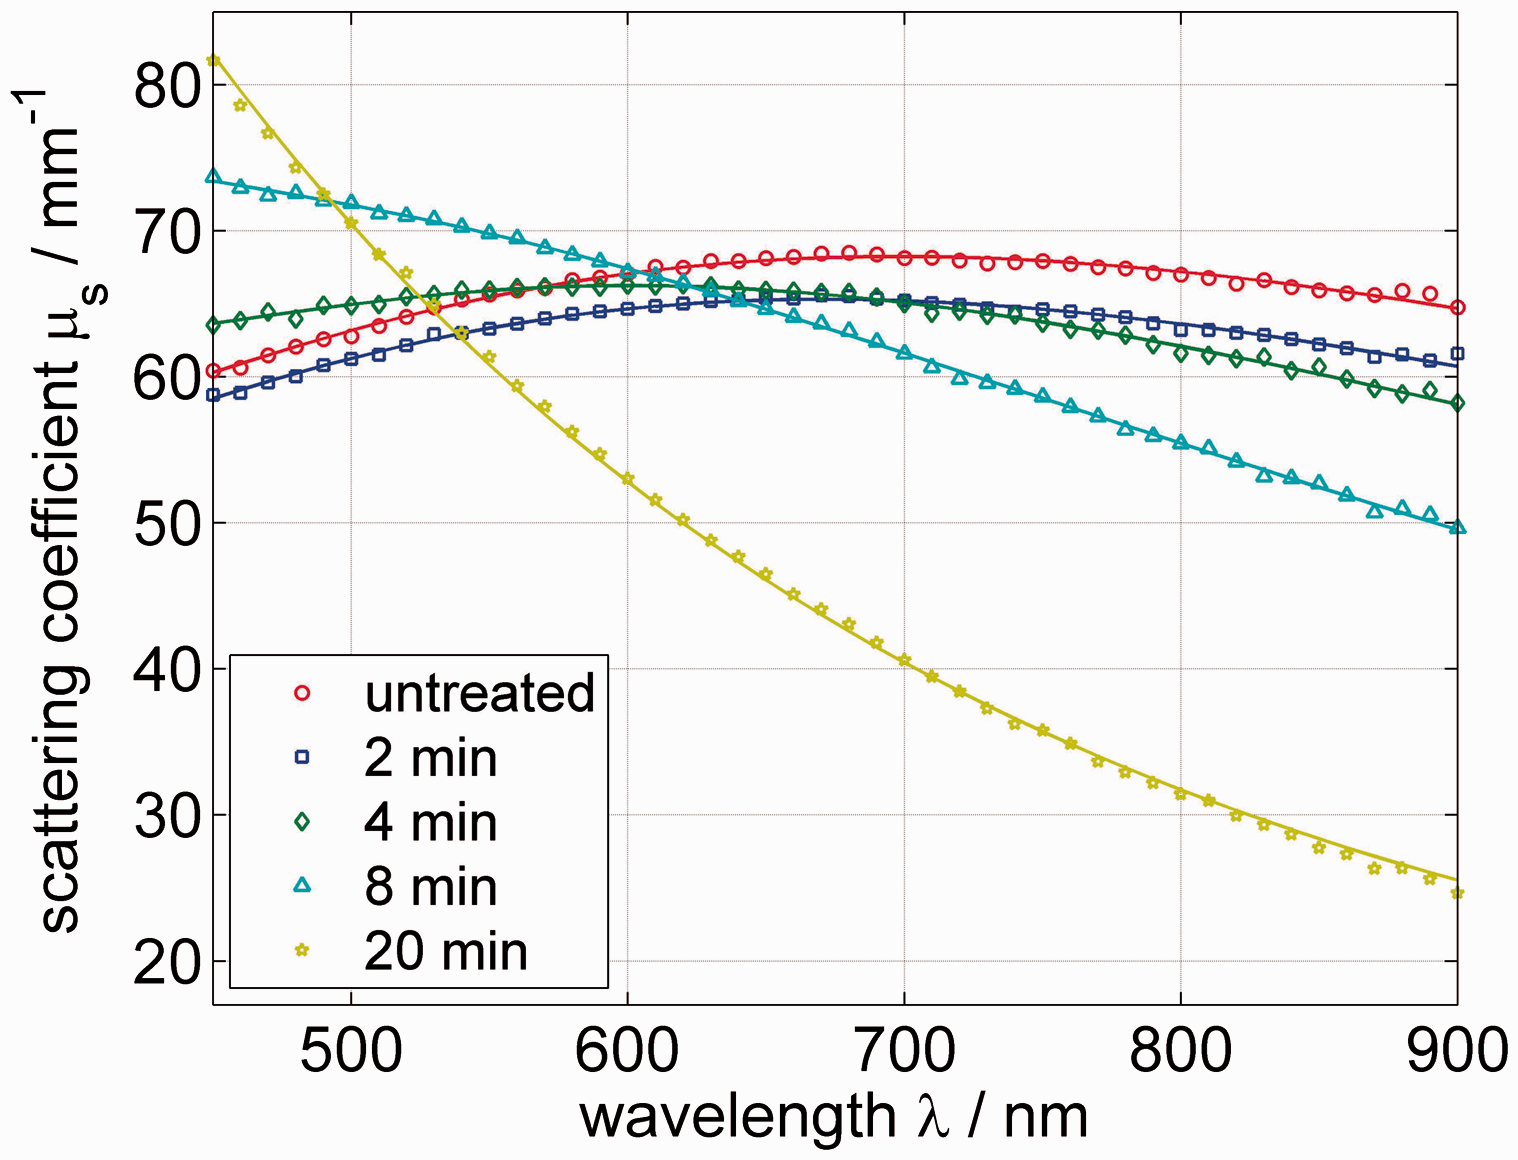
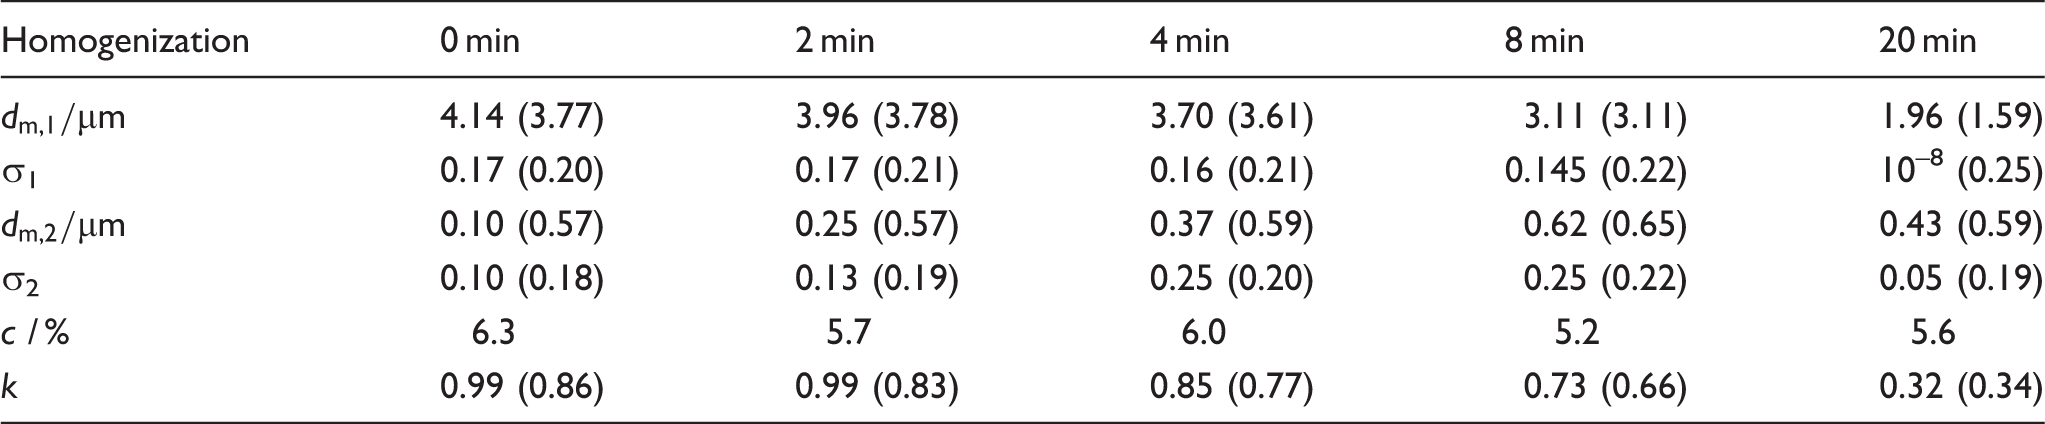
Furthermore, the mean diameter of the fat particles during homogenization was investigated. Therefore, raw milk was homogenized for different time steps. The homogenized samples were also mixed with EDTA to destroy the casein micelles. Like in the measurement series before, Mie theory was fitted to the data. Five samples were measured: one raw (unhomogenized) sample and four samples with the homogenization times of 3 min, 5 min, 8 min, and 20 min. Here, a bimodal log-normal size distribution
Scattering coefficient Fit results of 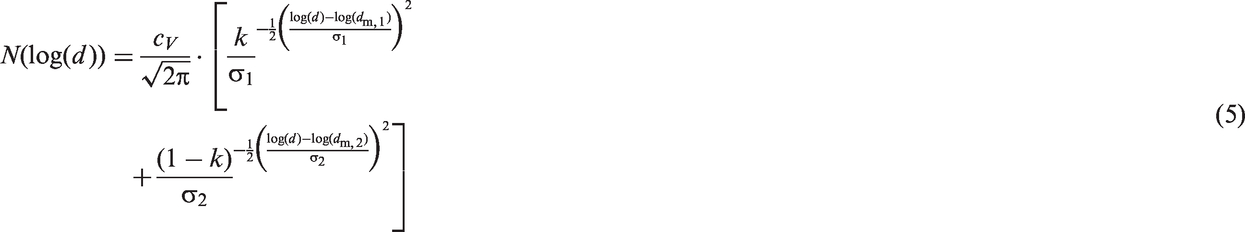
The last aspect to be examined in this subsection is the change of the scattering coefficient caused by the influence of the casein micelles. Another sample series with raw milk was produced. Here the samples were homogenized in time steps of 0 min, 2 min, 4 min, 6 min, 8 min, 12 min, and 25 min. After each homogenization step, one part of the sample was mixed with EDTA. We compared the scattering coefficients of all the samples with and without EDTA. In Figure 6 the results for the samples after the homogenization steps of 0 min, 4 min, 8 min, and 25 min are given exemplarily. The spectral behavior almost remains the same and the absolute value of the scattering coefficient influenced by the mixing of EDTA decreases by less than 10% for low homogenization and up to 25% for high homogenization. Because EDTA destroys the calcium phosphate binding, more molecular casein proteins will be in the milk after the treatment. In the presence of more molecular casein proteins, larger interfaces in the emulsion are possible, this means that the particle diameter of the fat droplets and therewith the scattering coefficient can be reduced because of the EDTA treatment. Generally, the affect of the casein micelles on Scattering coefficient 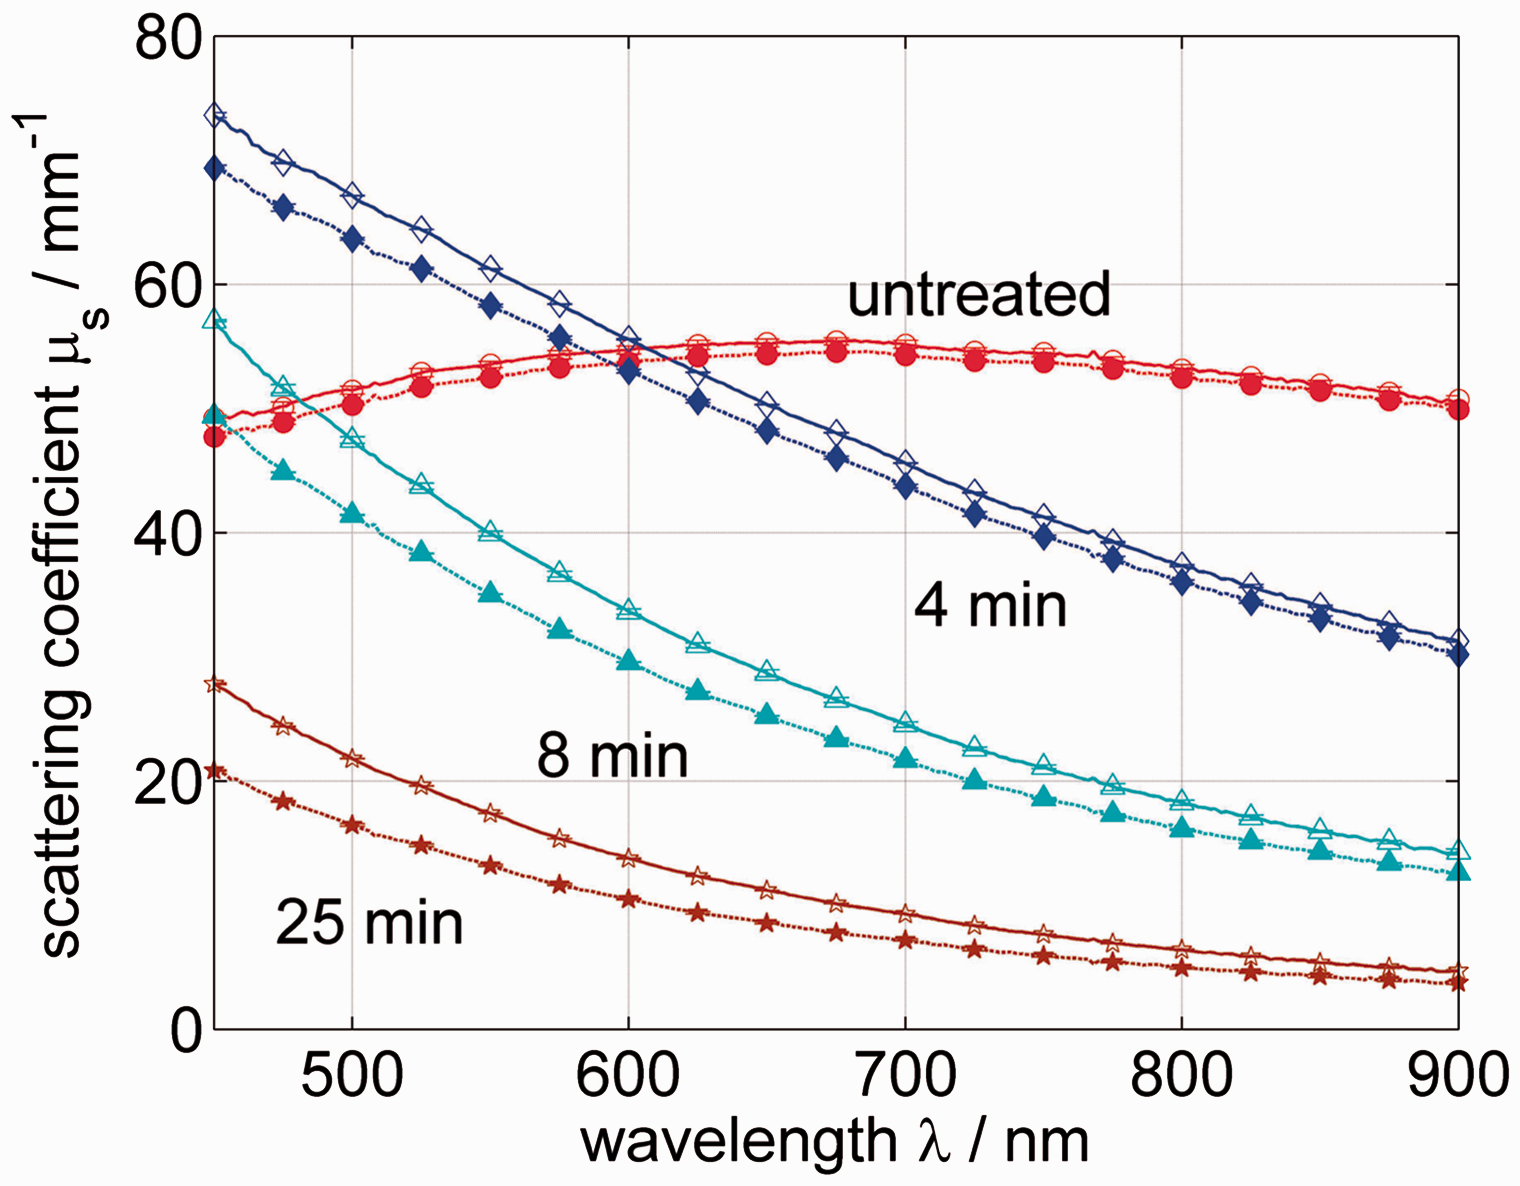
Reduced Scattering Coefficient
To determine the reduced scattering coefficient, the integrating sphere setup was used. With an appropriate cuvette (thickness, 4 mm), raw milk was measured undiluted. We used the same series of raw milk as shown above with homogenization steps of 0, 2, 4, 6, 8, 12, and 25 min. The samples were also mixed with EDTA to destroy the casein micelles. The results for the reduced scattering coefficient as well as the associated fitted curves are shown in Figure 7a. The fit results are given in Table 3. To quantify the change in Reduced scattering coefficient Fit results of 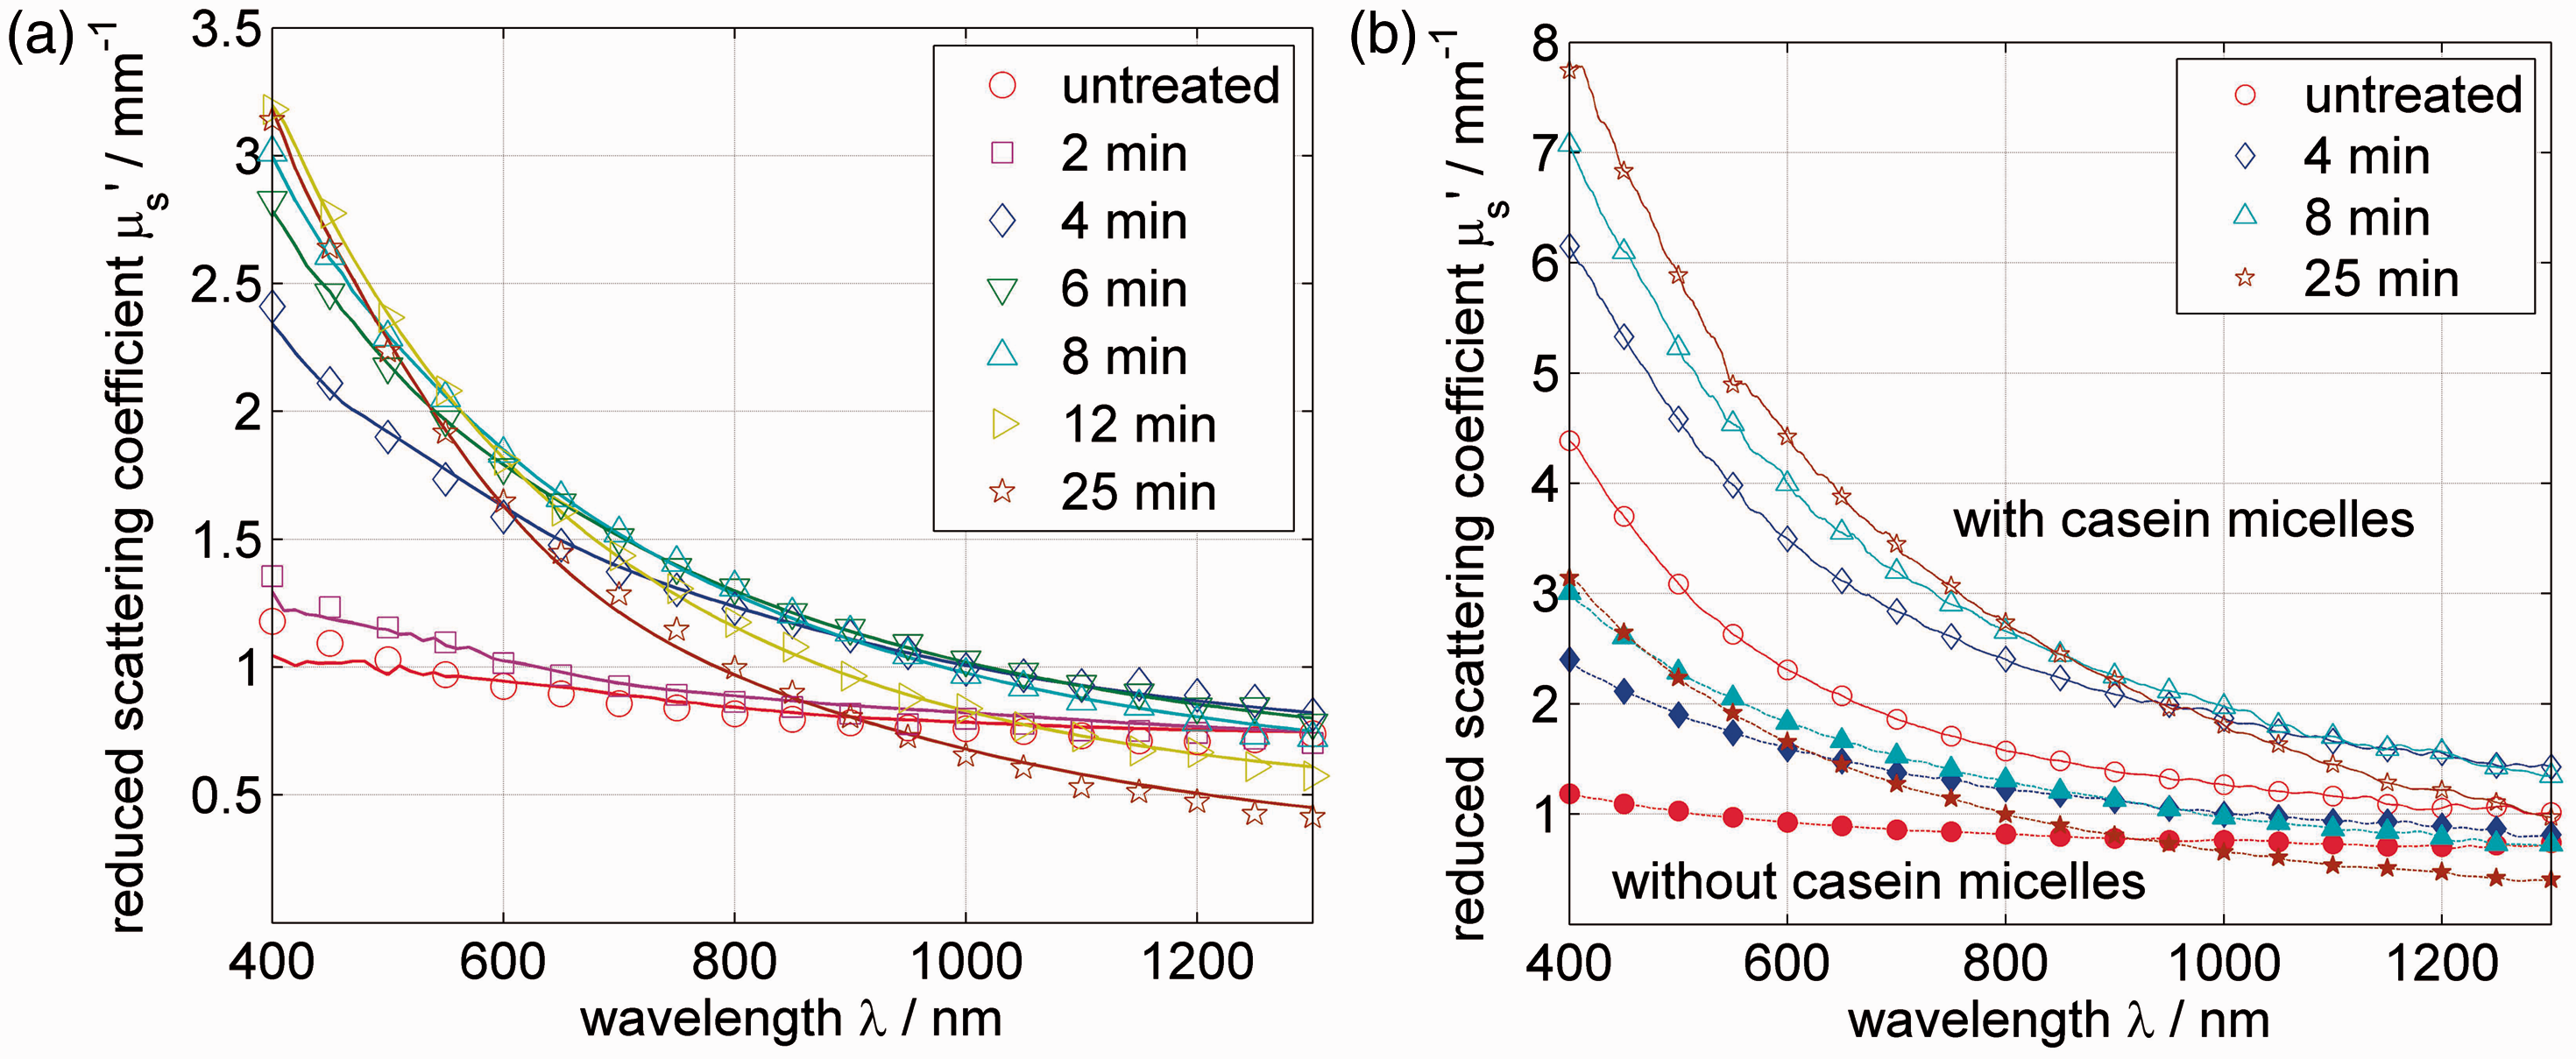
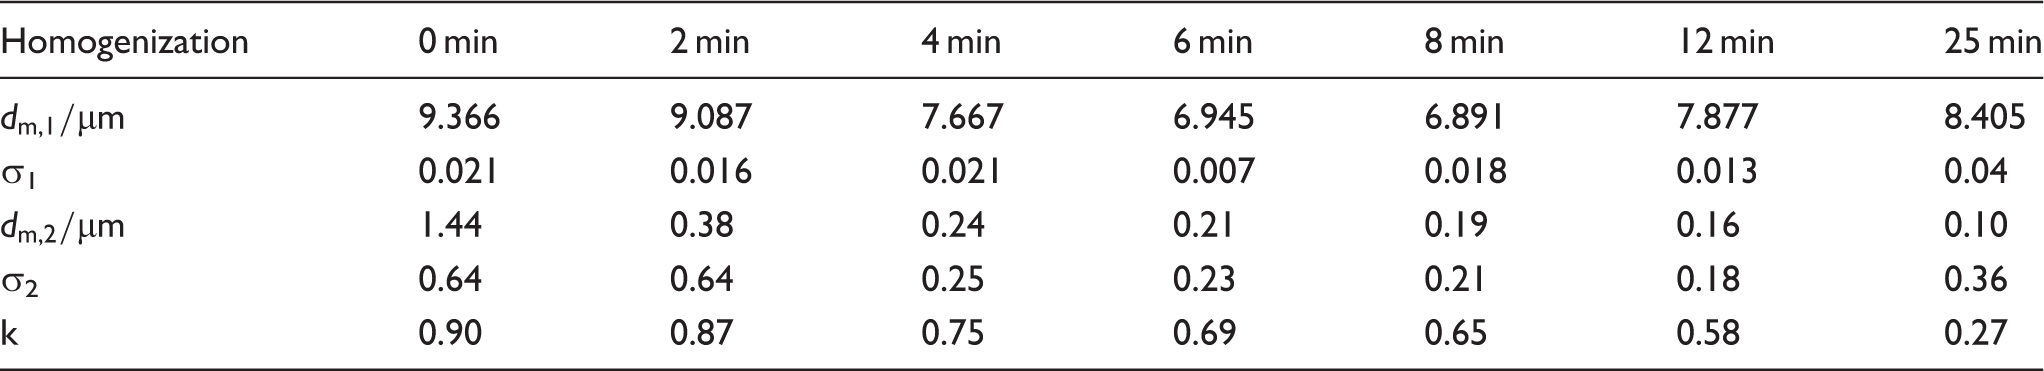
The mean diameters of the peak of larger particles in the size distribution stayed relatively constant about 8 µm and the peak of smaller particles shifts to smaller sizes from 1.44 µm to 0.10 µm, but the weighting factor shifted from 0.90 to 0.27, so the main volume of scatterers was getting smaller. The systematics of these results agree mainly with them of the PSD measurement of the other homogenization sample series though the absolute values cannot be compared because different raw milk samples were used. Although again a lot of fit parameters are used, the confidence intervals of all parameters stay below 5%. Obviously the mean diameter of the larger fat droplets is rather high. Unfortunately, we cannot compare the results with size measurements done on this specific sample. At this point we cannot exclude the possibility that dependent scattering occurs, because this is a measurement in which raw milk was measured undiluted with all scatterers (fat and casein) in it. It is likely that the scattering coefficient in the small wavelength regime is influenced by dependent scattering of the small scatterers like the casein micelles. However, the results of the smaller mean diameter peak during the homogenization seems to be questionable.
To gain awareness of the influence of the casein micelles, we compare the raw milk samples mixed with EDTA and without EDTA after the same homogenization steps. The comparison of the measurement series is shown in Figure 7b, where the results for only four homogenization steps of 0 min, 4 min, 8 min, and 25 min are shown for better readability. The change in the reduced scattering coefficient is between 50% (longer wavelengths) and up to 200% (short wavelengths) for the samples with and without EDTA. This differs from the results of the scattering coefficient. The difference between
Absorption Coefficient
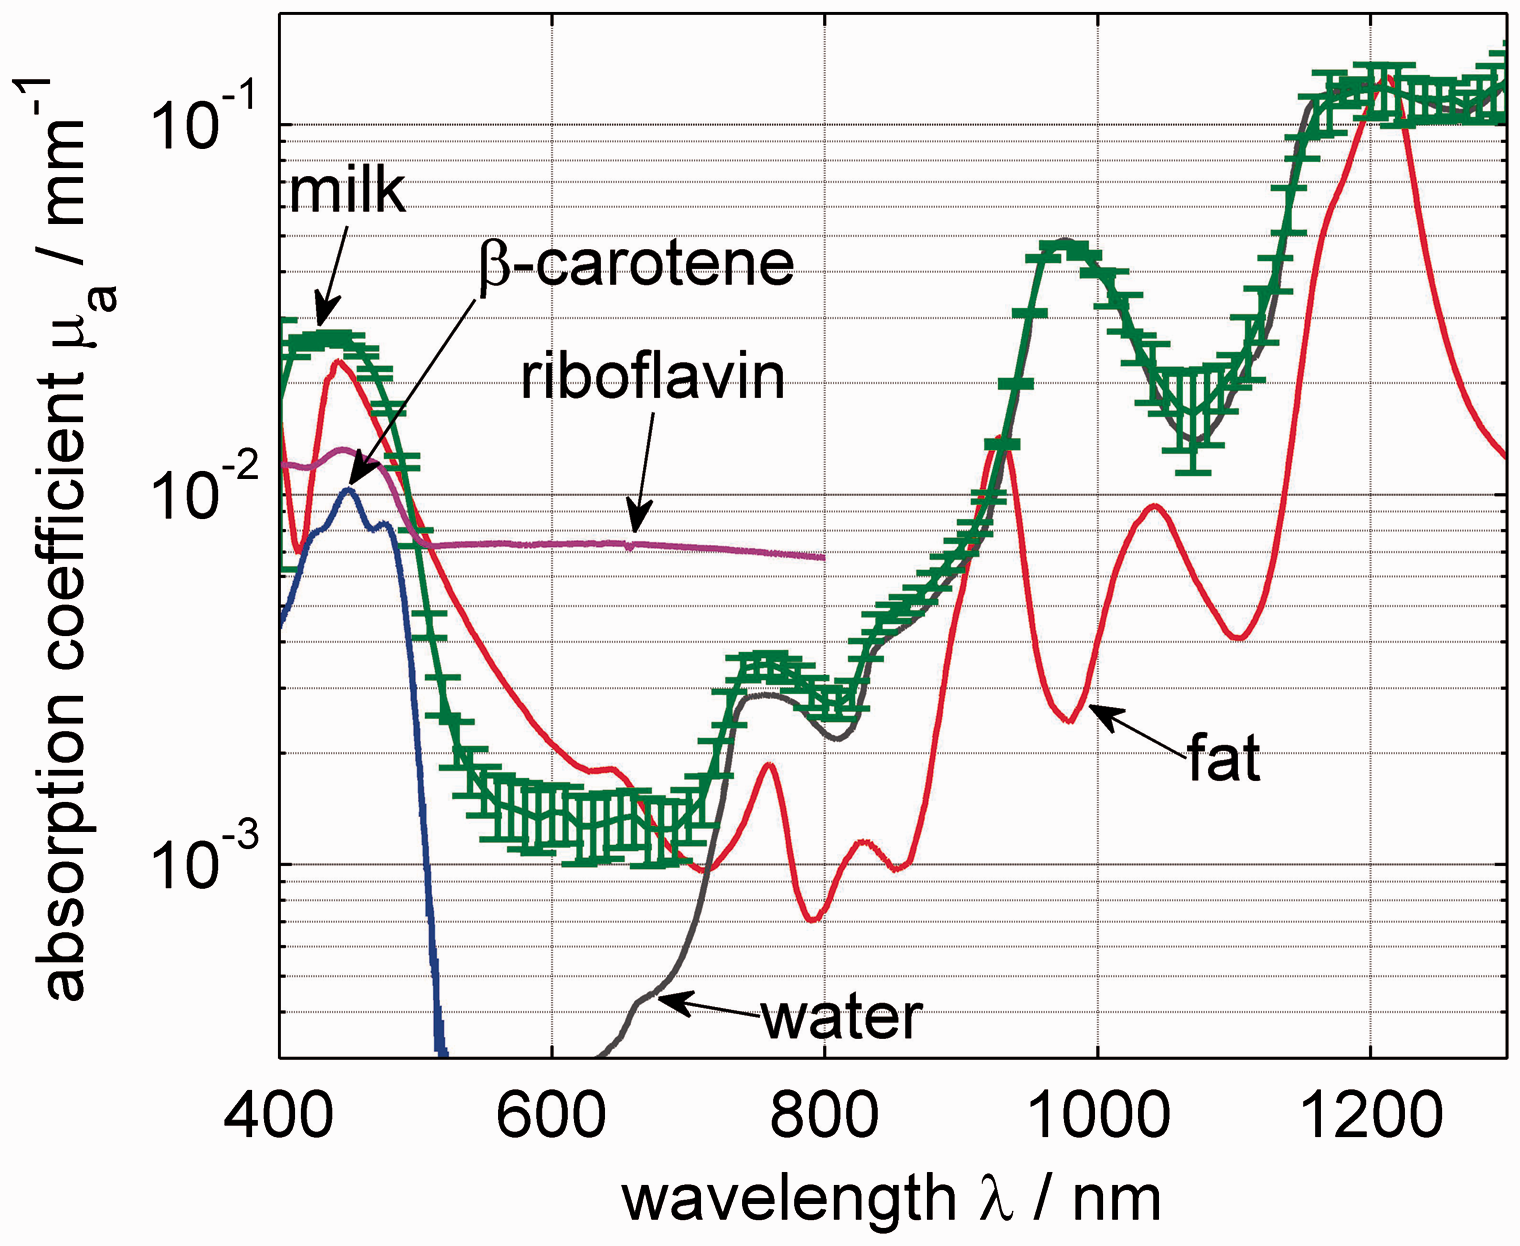
The absorption coefficient of a commercial milk sample with 1.5% fat was determined exemplarily using the integrating sphere setup. The spectrum is shown in Figure 8. In addition, the absorption coefficients of water,
44
fat, β-carotene,
45
and riboflavin
46
are given. The fat absorption is a combination of measurement results from soybean oil, palm oil, and lard. These three different kinds of fat differ barely in absorption, so a combination of them is shown. Regarding the fat absorption in the NIR wavelength regime, there are two characteristic peaks in the spectrum at 930 nm and 1200 nm. At wavelengths below 600 nm, the fat absorption increases as well. For the absorption coefficient of milk, it can be found that in the wavelengths above 800 nm the water absorption dominates. The shape of the absorption coefficient below 700 nm differs from the absorption coefficient of fat and water. At first sight, the absorption below 500 nm seems to be similar to the fat absorption, but this might be due to dissolved organic substances. In this range, a lot of organic substances exhibit high absorption coefficients such as riboflavin, hemoglobin, and β-carotene, the concentration of which are strongly affected by the health or food of the cow. The main effect is expected from the absorption of the β-carotene, which is dissolved in the fat droplets, and from riboflavin, which is dissolved in the milk serum. This means that the absolute absorption in this wavelength range does not only depend on the fat concentration, but also on the concentration of the organic substances, which varies for different cows.
Conclusion
In this work we determined geometrical and optical properties of the ingredients of milk, which are responsible for its turbidity. Examinations of the particle sizes, the RIs, the scattering as well as the reduced scattering coefficient and the absorption coefficient for different raw milk samples and after different treatments of the raw milk were presented. The turbidity measurements were performed using a collimated transmission and an integrating sphere setup.
The size distributions of the fat droplets of raw milk were measured with a Mastersizer. The size distribution can be described with a log-normal distribution. This distribution can be used for raw milk (monomodal) and during a homogenization process (bimodal). The PSD of the fat droplets in milk from different cows at different times during the milking process showed that the fat concentration differs immensely during the milking process. The fat concentration at the beginning of the milking process was much lower as at the end of the milking process. Unexpectedly, the mean diameter of the fat droplets stayed almost constant for each cow and varies just about 1 µm for the different cows. The PSD of the casein micelles was determined with a Zetasizer which provided a mean diameter of 189 nm and by fitting Mie theory to the measured data of the scattering and the reduced scattering coefficient which yielded to a mean diameter of 211 nm with a broad width of 0.201.
Refractive index dispersions of milk fat and casein micelles were determined with the Cauchy dispersion. For both scatterers, only values of single wavelengths could be found in the literature. Our result of the milk fat agrees with the published values.20,21,41 For the casein micelles, the published value of 1.57 at 600 nm 42 could not be supported.
The scattering coefficients of different raw milk samples, raw milk during the homogenization process, and raw milk after EDTA treatments were determined. We could show how the spectral shape of the scattering coefficient changes for the different samples. Mie theory was fitted to the measured data. The resulting fit parameters of the PSD showed the same changes as the results of the size measurements of the Mastersizer. This was valid for the raw milk samples of different cows as well as for the raw milk samples during the homogenization process, although the results for the volume concentration could not be verified. We could show that the influence of the casein micelles on the scattering coefficient is small, because the scattering is dominated by the larger fat droplets.
The change in the reduced scattering coefficient of raw milk samples during a homogenization process was shown. Calculations using Mie theory showed that
The absorption coefficient of milk samples was measured and compared to the absorption coefficients of the mainly present components of milk. The next step is to optimize the signal-to-noise ratio in the NIR regime to determine the fat and water content out of the absorption coefficient. One goal is to examine the wavelength regime around the fat absorption peak at 930 nm, because detectors suitable for this wavelength regime are based on silicon and thus are cheaper than those based on InGaAs for the NIR regime. Initial calculations showed that a determination of the fat content by regarding the first and second derivative at this wavelength regime is possible.
In our work, we showed that the influence of a lot of different parameters in milk can be detected through scattering measurements. To build an optical sensor based on these fundamental examinations to determine the absolute contents of fat and protein without the need for calibration or statistical classification, further investigations are necessary. One challenge will be the determination of all parameters at a time with one setup. Our goal is to perform the measurements with raw and undiluted milk, therefore the possible effect of dependent scattering has to be examined further.
Footnotes
Acknowledgments
The authors thank Andrea Böhmler for the raw milk samples and Wolfgang Weirather from ZSW, Germany for his help with the Mastersizer and Zetasizer measurements.
Conflict of Interest
The authors report there are no conflicts of interest.
Funding
The authors acknowledge the financial support from the Central Innovation Program for SMEs (ZIM) of the Federal Ministry for Economic Affairs and Energy, Germany.