
Abstract
Ethylene (C2H4) was detected using quartz-enhanced photoacoustic spectroscopy (QEPAS) at 10.5 µm with a continuous wave, distributed-feedback quantum cascade laser as the light source. The QEPAS sensor was operated at low pressures (≤200 torr) to eliminate the cross-talk spectral interference between C2H4 and CO2, a major interfering species in practical applications. The sensor was calibrated to show a good linear response to C2H4 concentration and the Allan deviation analysis demonstrated a minimum detection limit of 8 ppb at an integration time of 90 s. Although no spectral overlap between C2H4 and CO2 was confirmed at the pressure ≤200 torr by the direct absorption measurement using a 28-m multipass cell, we observed the apparent influence of the CO2 addition to the C2H4/N2 mixture on the photoacoustic signal of C2H4. An energy transfer model involving the vibration–vibration (VV) and vibration–translation (VT) transitions in the C2H4–CO2–N2 system was constructed to interpret the experimental data. Additionally, the vibrational relaxation times of C2H4 were obtained based on the QEPAS technique and the energy transfer model, which were in good agreement with the previous studies.
Keywords
Introduction
Ethylene (C2H4) is treated as a major pollutant produced from automobile exhaust and industrial emissions, 1 a biomarker in people’s exhaled breath to identify relevant disease, 2 and a plant hormone affecting the growth, ripening, and decay of plants. 3 In past years, various spectroscopic methods including cavity ring-down spectroscopy (CRDS),4,5 multipass absorption,6–8 photoacoustic spectroscopy (PAS),9–12 and quartz-enhanced photoacoustic spectroscopy (QEPAS)13–15 were utilized for the C2H4 detection with different sensitivities.
Among these trace gas sensing techniques, PAS is often carried out by means of a broadband microphone for the acoustic wave detection. In this process, the target molecules at the ground state are excited by absorbing the optical radiation, followed by the vibration–translation (VT) relaxation to convert the excitation energy to the translational molecular motion. The VT relaxation process causes local heating and thermal expansion that are the key steps in determining the generation of acoustic waves. Quartz-enhanced photoacoustic spectroscopy, a novel PAS technique, has advantages of high Q-factor, compact acoustic cell (a few mm3), immunity to ambient noise, and low fabrication cost.16–21 Different from the traditional PAS using a photoacoustic resonant cell with a Q-factor around 40–200, the QEPAS sensor detects the acoustic wave using a quartz tuning fork (QTF) with a Q-factor around 10 000. The QTF acts as a resonant acoustic transducer that converts the photoacoustic wave into the electrical signal via the piezoelectric effect. The ambient acoustic waves with much longer wavelengths tend to apply a force in the same direction upon the two prongs of the QTF without exciting its piezo-electrically active mode.
We recently reported a QEPAS-based C2H4 sensor to achieve a minimum detection limit (MDL) of 50 ppb at the detecting pressure of 500 torr. 15 In that work, a distributed feedback (DFB) quantum cascade laser (QCL) was used to exploit the strongest absorption line of C2H4 at 10.53 µm in the v7 fundamental band. However, CO2 serves to be a possible interference for the C2H4 detection at the atmospheric pressure because these two species have a spectral overlap near the diagnostic wavelength. Normally a low gas pressure can be selected to eliminate the cross-talk spectral interference between the interfering species. However, in QEPAS detection, the standard QTF available commercially has a resonant frequency f0 = 32.768 kHz, which may exceed the VT relaxation rate of certain gas molecules at relatively low pressures.22,23 The lag between VT relaxation rate and high f0 of the QTF leads to a significant attenuation of the observed photoacoustic signal.24–26 Note that the custom-designed QTF with a lower resonant frequency provides a possibility to reduce the attenuation effect. 27 Hence, the variation of ambient species may affect the photoacoustic response by changing the original energy transfer processes even though this species has no spectral overlap with the target analyte.
In this work, we reported the development of a QEPAS-based C2H4 sensor working at low pressure to eliminate the spectral interference from other species by exploiting the C2H4 spectra near 10.5 µm. The sensor sensitivity and long-term stability were evaluated and presented in this paper. We also investigated the influence of the CO2 molecular relaxation dynamics on the photoacoustic detection of C2H4 using the QEPAS sensor system. The observed distinct photoacoustic spectra of C2H4 with varied CO2 concentrations were well interpreted by a simplified molecular energy transfer model.
Experimental Setup
A 10.5 µm continuous wave (CW), DFB-QCL (Alpes Lasers) with integrated thermoelectric cooling (TEC) was utilized as the light source. The schematic of the C2H4 QEPAS setup is depicted in Figure 1. The QCL was controlled at 37℃ by a commercial laser driver (ILX Lightwave, LDC 3736) and tuned across the absorption feature of C2H4 centered at ∼949.3 cm−1 to obtain an output power of ∼16 mW. The laser beam was directed into an acoustic detection module (ADM) enclosing a QTF and two micro-resonator (mR) tubes (L: 4.3 mm, ID: 0.9 mm) by two plano–convex lenses, L1 (f = 20 mm) and L2 (f = 40 mm). A slightly wedged pinhole with a diameter of 400 µm was placed at the focal point of L1 to improve the beam quality. Two wedged ZnSe windows were mounted on the custom-designed ADM to allow for optical transmission.
Schematic of the QEPAS setup integrated with a multipass gas cell. FM1 and FM2, flip mirrors; L1, L2 and L3, plano–convex lens; M1, focusing mirror; ADM, acoustic detection module; QTF, quartz tuning fork; mR, micro-resonator; DAQ, data acquisition; MGC, multipass gas cell; NV, needle valve.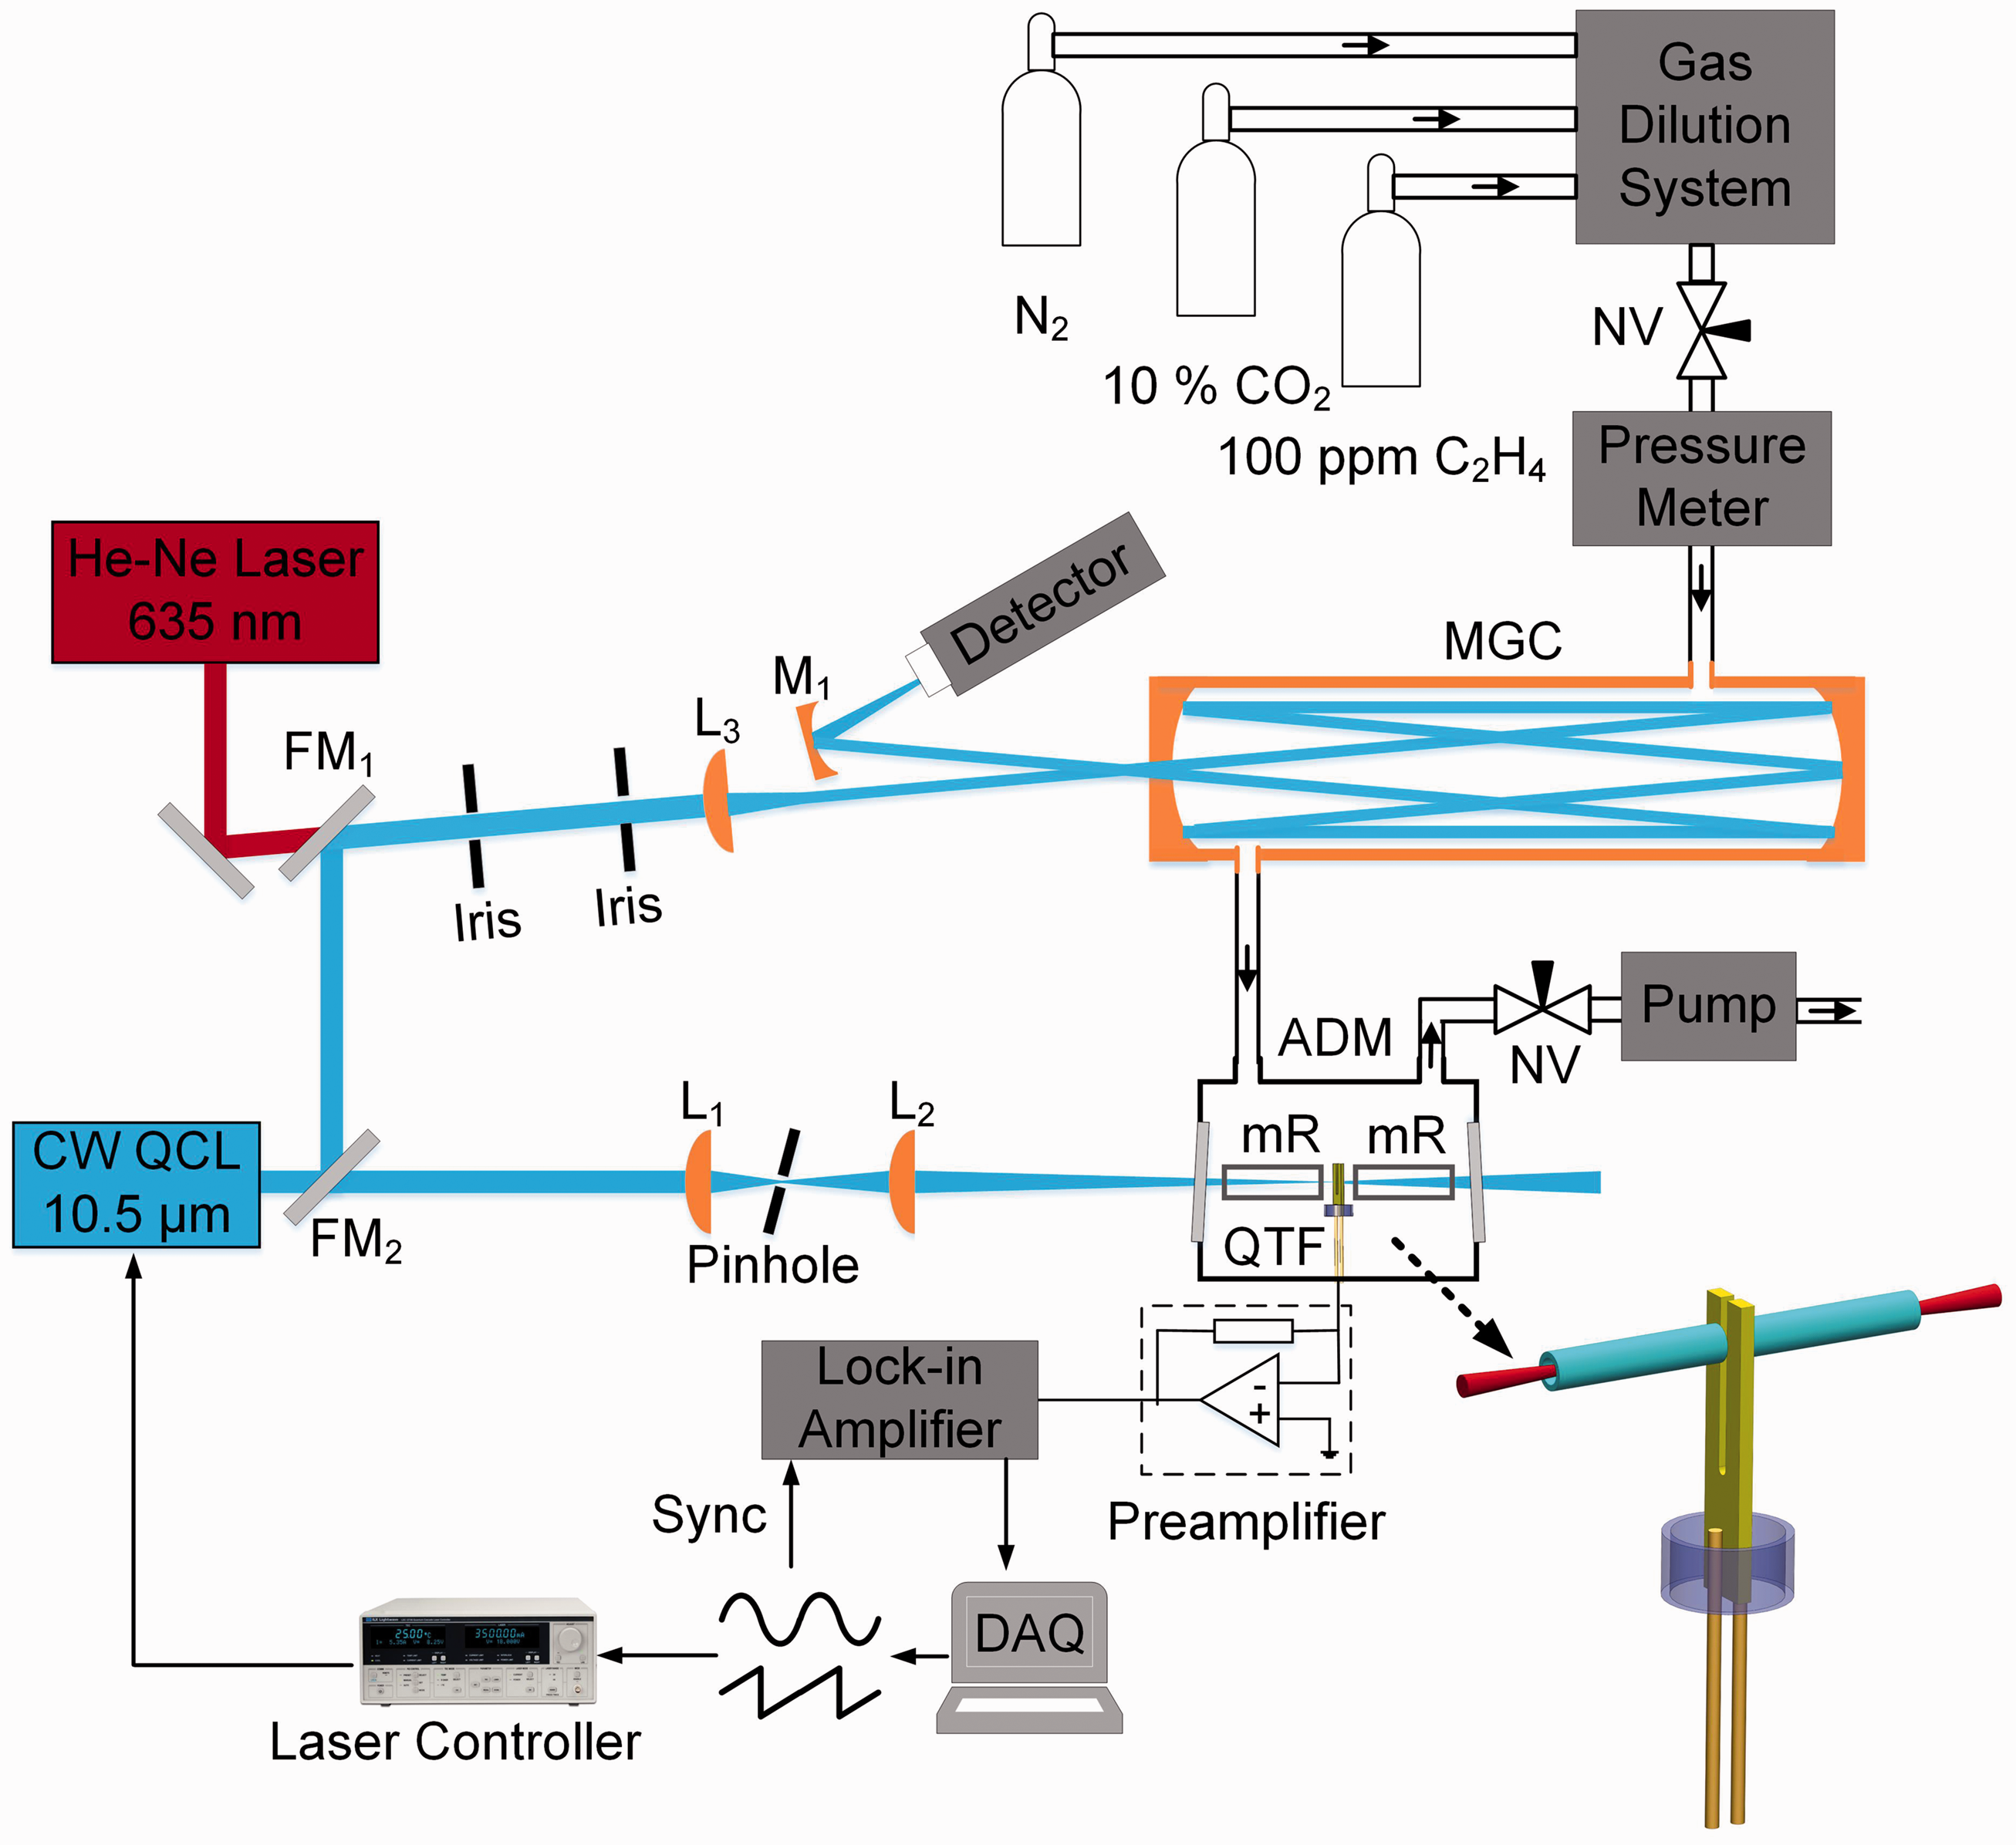
The injection current of the QCL was sinusoidally modulated at half of the QTF resonant frequency (f0) for performing wavelength modulation spectroscopy. The absorption line of C2H4 was crossed twice during each modulation period giving rise to acoustic waves at f0 that excited the piezo-electrically active mode of the QTF. The piezo-electrical signal generated by the QTF was amplified by a transimpedance preamplifier with a 10 MΩ feedback resistor and a 30× voltage amplifier, and then demodulated by a lock-in amplifier (Signal Recovery) to obtain the second harmonic (2f ) signal.
Besides the QEPAS sensor system, a Herriot multipass gas cell (MGC) (Aerodyne Research) was added to perform the simultaneous direct absorption measurement of the C2H4/CO2 spectra. A visible He–Ne laser (635 nm) was aligned collinearly with the QCL beam using two flip mirrors (FM1 and FM2) to assist the MGC alignment. We employed a mode matching lens L3 (f = 200 mm) to effectively couple the laser radiation into the MGC and achieved an optical path length of 28 m in total. The laser radiation exited from the MGC was collected by a focusing mirror M1 onto a photovoltaic detector (PVM-10.6, VIGO System S.A.).
The MGC and ADM were connected in series to ensure the same gas mixture to flow through both sensor systems. The gas mixtures with different concentrations were generated by diluting 100 ppm C2H4/N2 and 10% CO2/N2 with the pure N2 (99.999%) using a commercial gas dilution system ( Jinwei Electronics). The generated mixtures were estimated to have 1% uncertainty of the concentration. The gas pressure inside the ADM and MGC was monitored by a pressure transducer (MKS Instruments, 722B) and controlled by adjusting two needle valves (Swagelok) and a rotary-vane vacuum pump.
Experimental Results
C2H4 and CO2 Spectra Near 10.53 μm
According to the HITRAN database, 28 there is a possible interfering line of CO2 at 949.48 cm−1 (ν3–ν1 band) next to the target C2H4 line centered at 949.34 cm−1. The possible spectral interference between C2H4 and CO2 was first investigated by performing the direct absorption measurement of C2H4–CO2–N2 mixtures using the MGC at three pressures of 50, 100, and 200 torr.
The QCL was wavelength-scanned to cover both C2H4 and CO2 absorption lines at a scanning frequency of 1 Hz. Figure 2 presents the measured absorption spectra of C2H4–CO2–N2 mixtures at varied concentrations and pressures along with the corresponding absorption lines listed in the HITRAN database.
28
In Figure 2a, the measured absorption spectra correspond to 14 ppm C2H4 with the CO2 concentrations varying between 0 and 8% at the pressure of 50 torr. Similarly, the absorption spectra of 9 ppm C2H4 with the varied CO2 concentrations at the pressure of 100 torr and 200 torr were plotted in Figure 2b and c, respectively. At each pressure, the CO2 absorption at 949.48 cm−1 changes accordingly with the varied concentrations of CO2 in the mixtures, while the strongest absorption peak of C2H4 at 949.34 cm−1 remains unchanged. Hence, the variation of CO2 concentration in the range of 0–8% causes no spectral interference with the target C2H4 line centered at 949.34 cm−1 within the current pressure range.
Measured C2H4–CO2 spectra at different pressures: (a) 14 ppm C2H4, 50 torr, (b) 9 ppm C2H4, 100 torr, and (c) 9 ppm C2H4, 200 torr. The corresponding C2H4/CO2 lines from HITRAN database were illustrated at the bottom panels.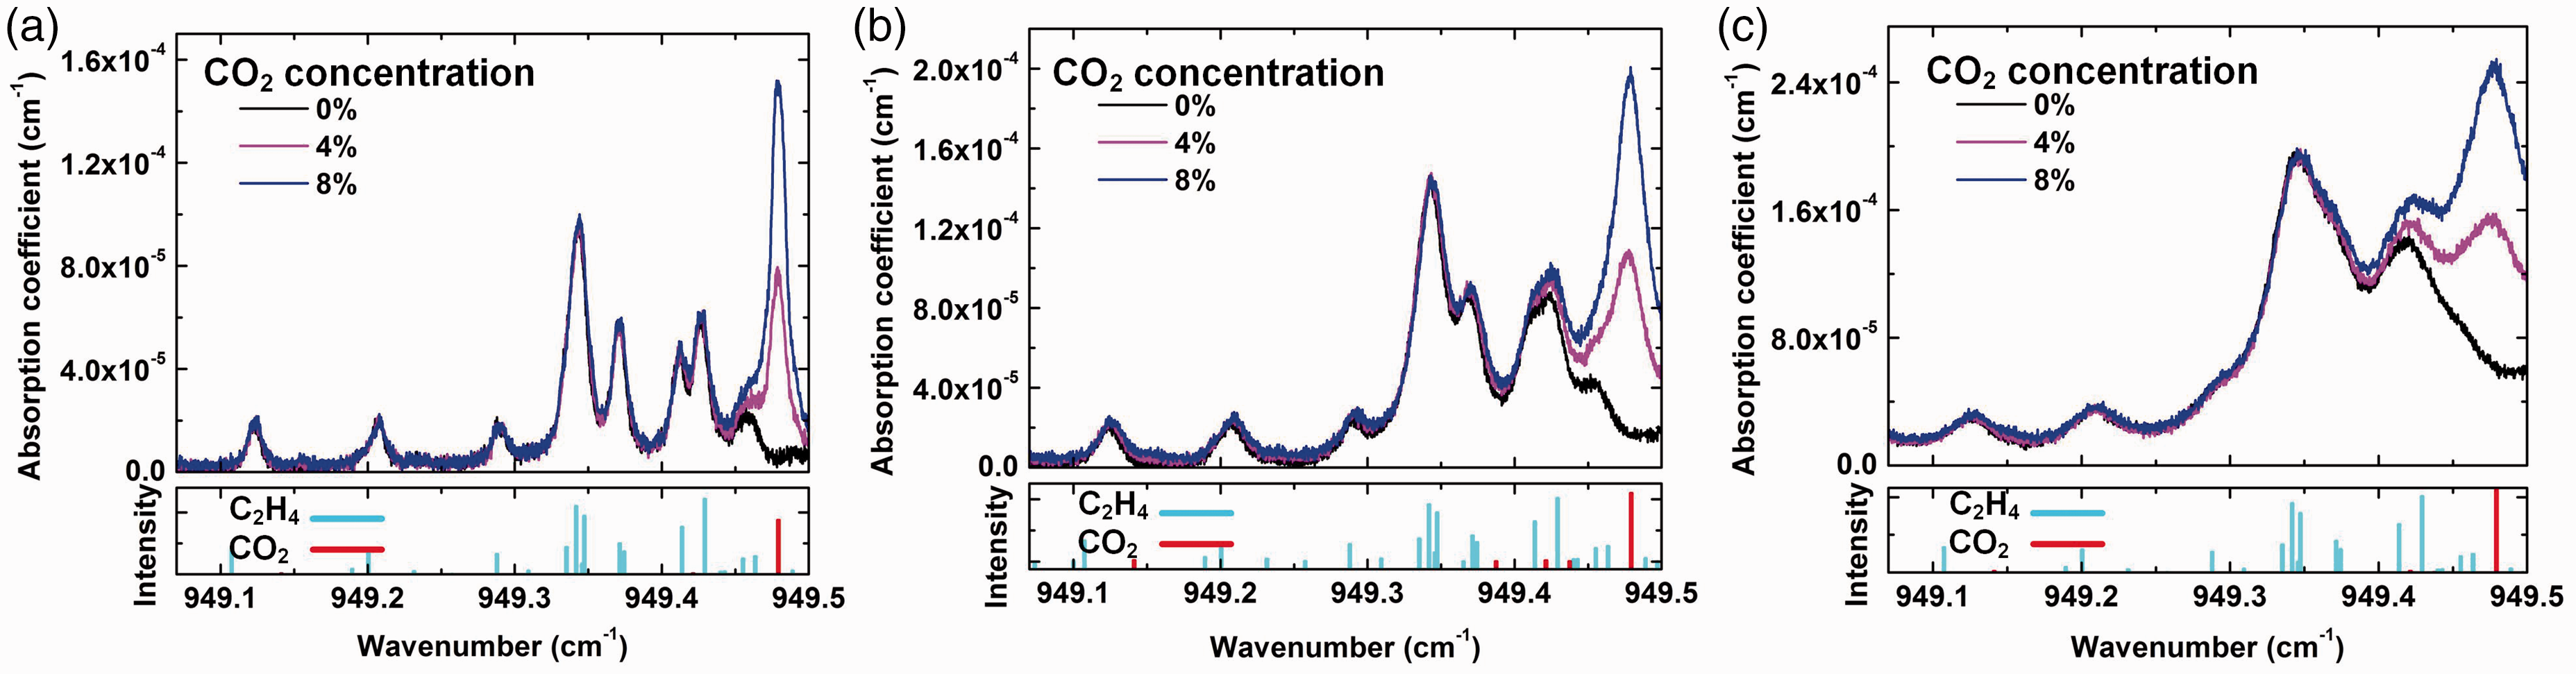
The QEPAS spectra of 20 ppm C2H4/N2 and 5% CO2/N2 mixtures were measured separately at 200 torr (see Figure 1 in the Supplemental Material). The QEPAS method and measurement procedures in detail can be found in our previous work. 15 Over the spectral range under investigation, there exist five strong C2H4 peaks located at 949.08 cm−1, 949.18 cm−1, 949.34 cm−1, 949.42 cm−1, and 949.53 cm−1, while the only CO2 absorption peak was observed at 949.48 cm−1. The separate measurements of QEPAS 2f spectra of CO2 and C2H4 confirm no spectral overlap between the target C2H4 peak at 949.34 cm−1 and CO2 when the gas pressure is lower than 200 torr.
Quartz-Enhanced Photoacoustic Spectroscopy Sensor Performance
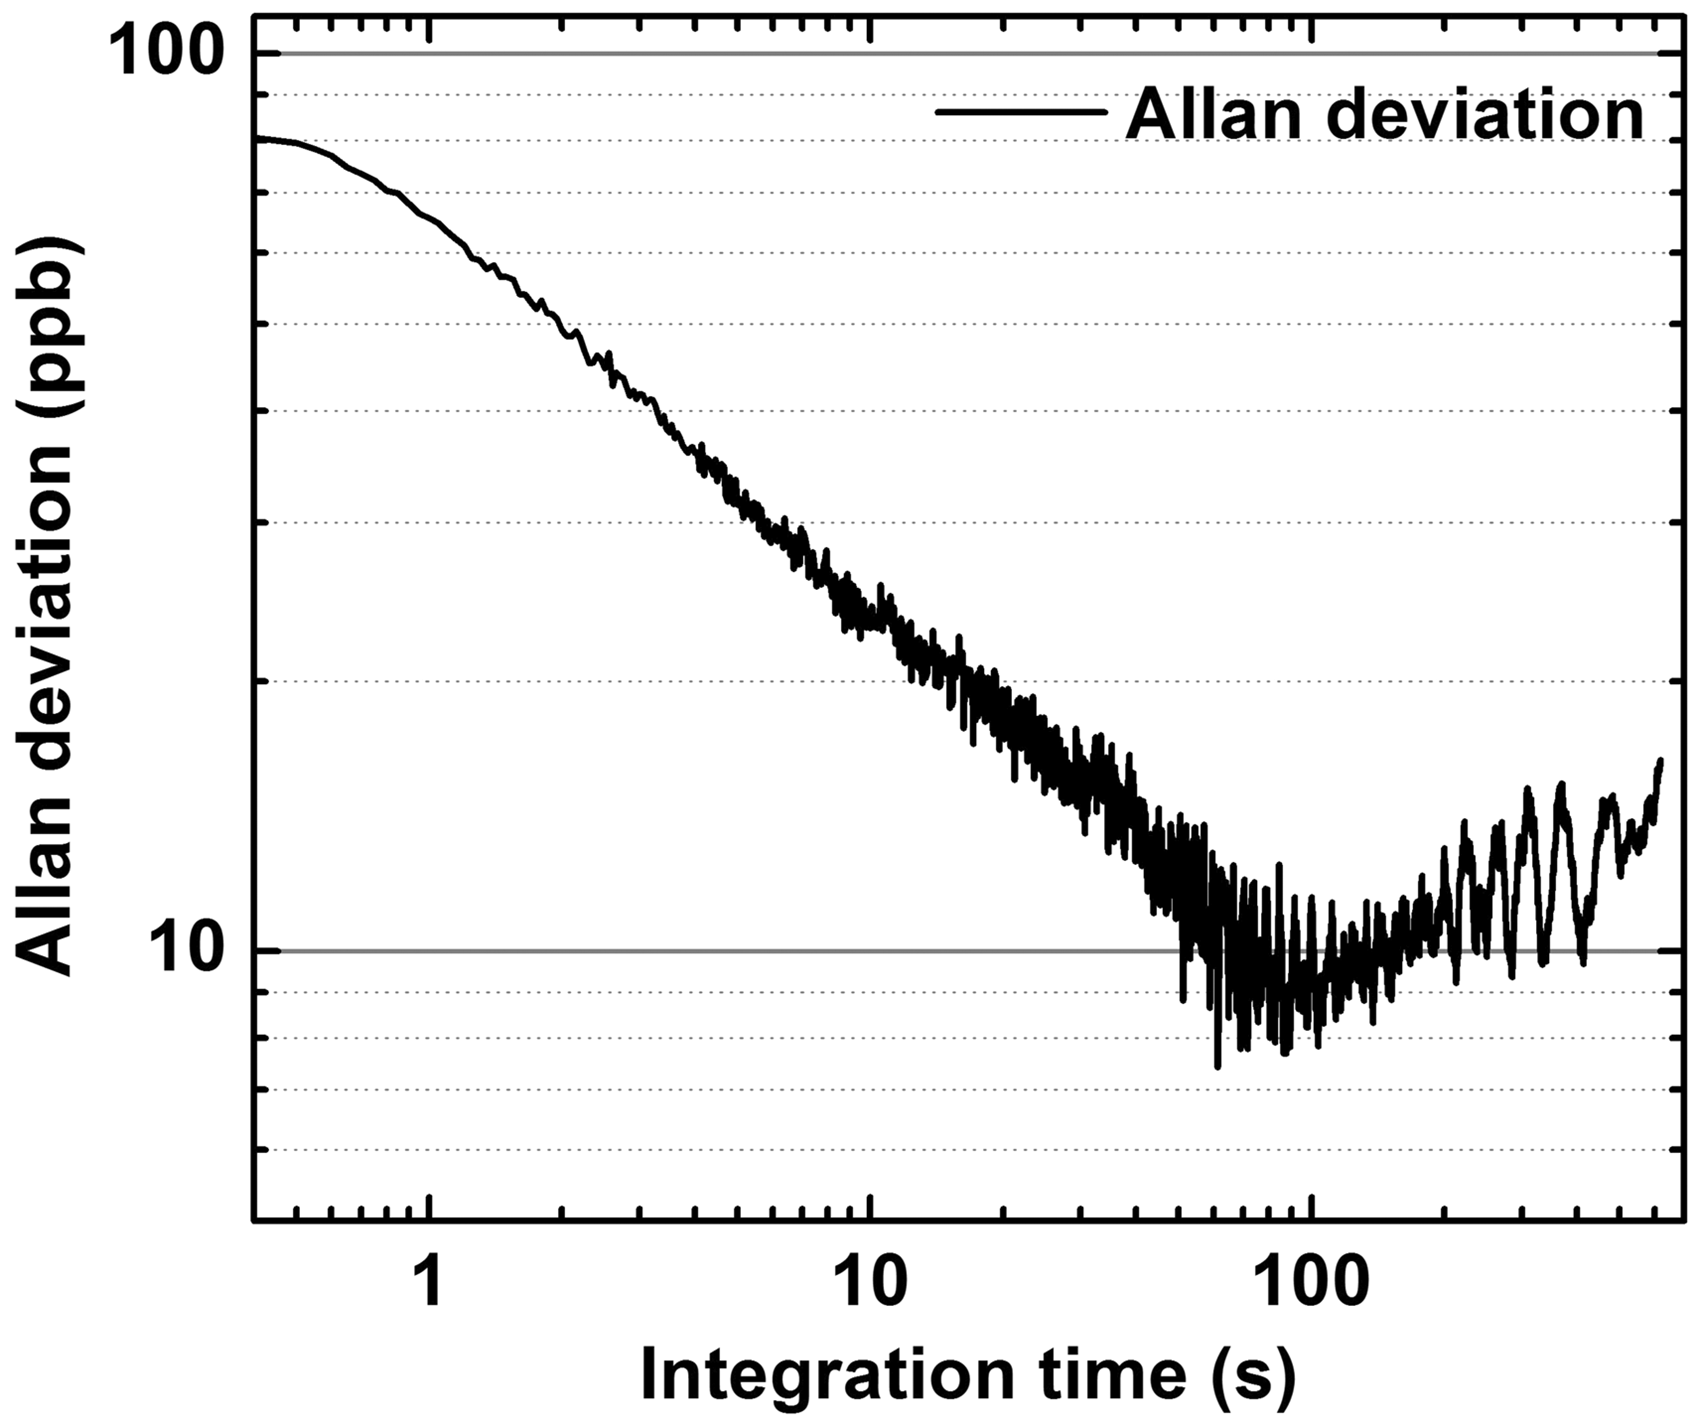
The QEPAS C2H4 sensor was calibrated using a series of C2H4 mixtures of known concentration at 100 torr. The measured 2f signals at different C2H4 concentrations are illustrated in Figure 3a and the corresponding 2f peak amplitudes are plotted in Figure 3b as a function of C2H4 concentration (5–55 ppm). A linear fit to the experimental data yields an R-square value of 0.998, indicating a good linear response of the sensor. In order to evaluate the precision and stability of the sensor system, an Allan deviation analysis was conducted by measuring pure N2 for 1 h with the result illustrated in Figure 4. The sensor achieves a MDL of 69 ppb of C2H4 at the integration time of 0.05 s. The turning point of the Allan deviation curve is approximately 8 ppb at an integration time of 90 s, corresponding to a normalized noise equivalent absorption (NNEA) coefficient of 1.79 × 10⁻⁸ cm−1W/Hz1/2.
(a) Representative QEPAS 2f signals measured for varied C2H4 concentrations at 100 torr. (b) Measured 2f peak amplitude as a function of C2H4 concentration with the best linear fit. Allan deviation plot of the QEPAS C2H4 sensor.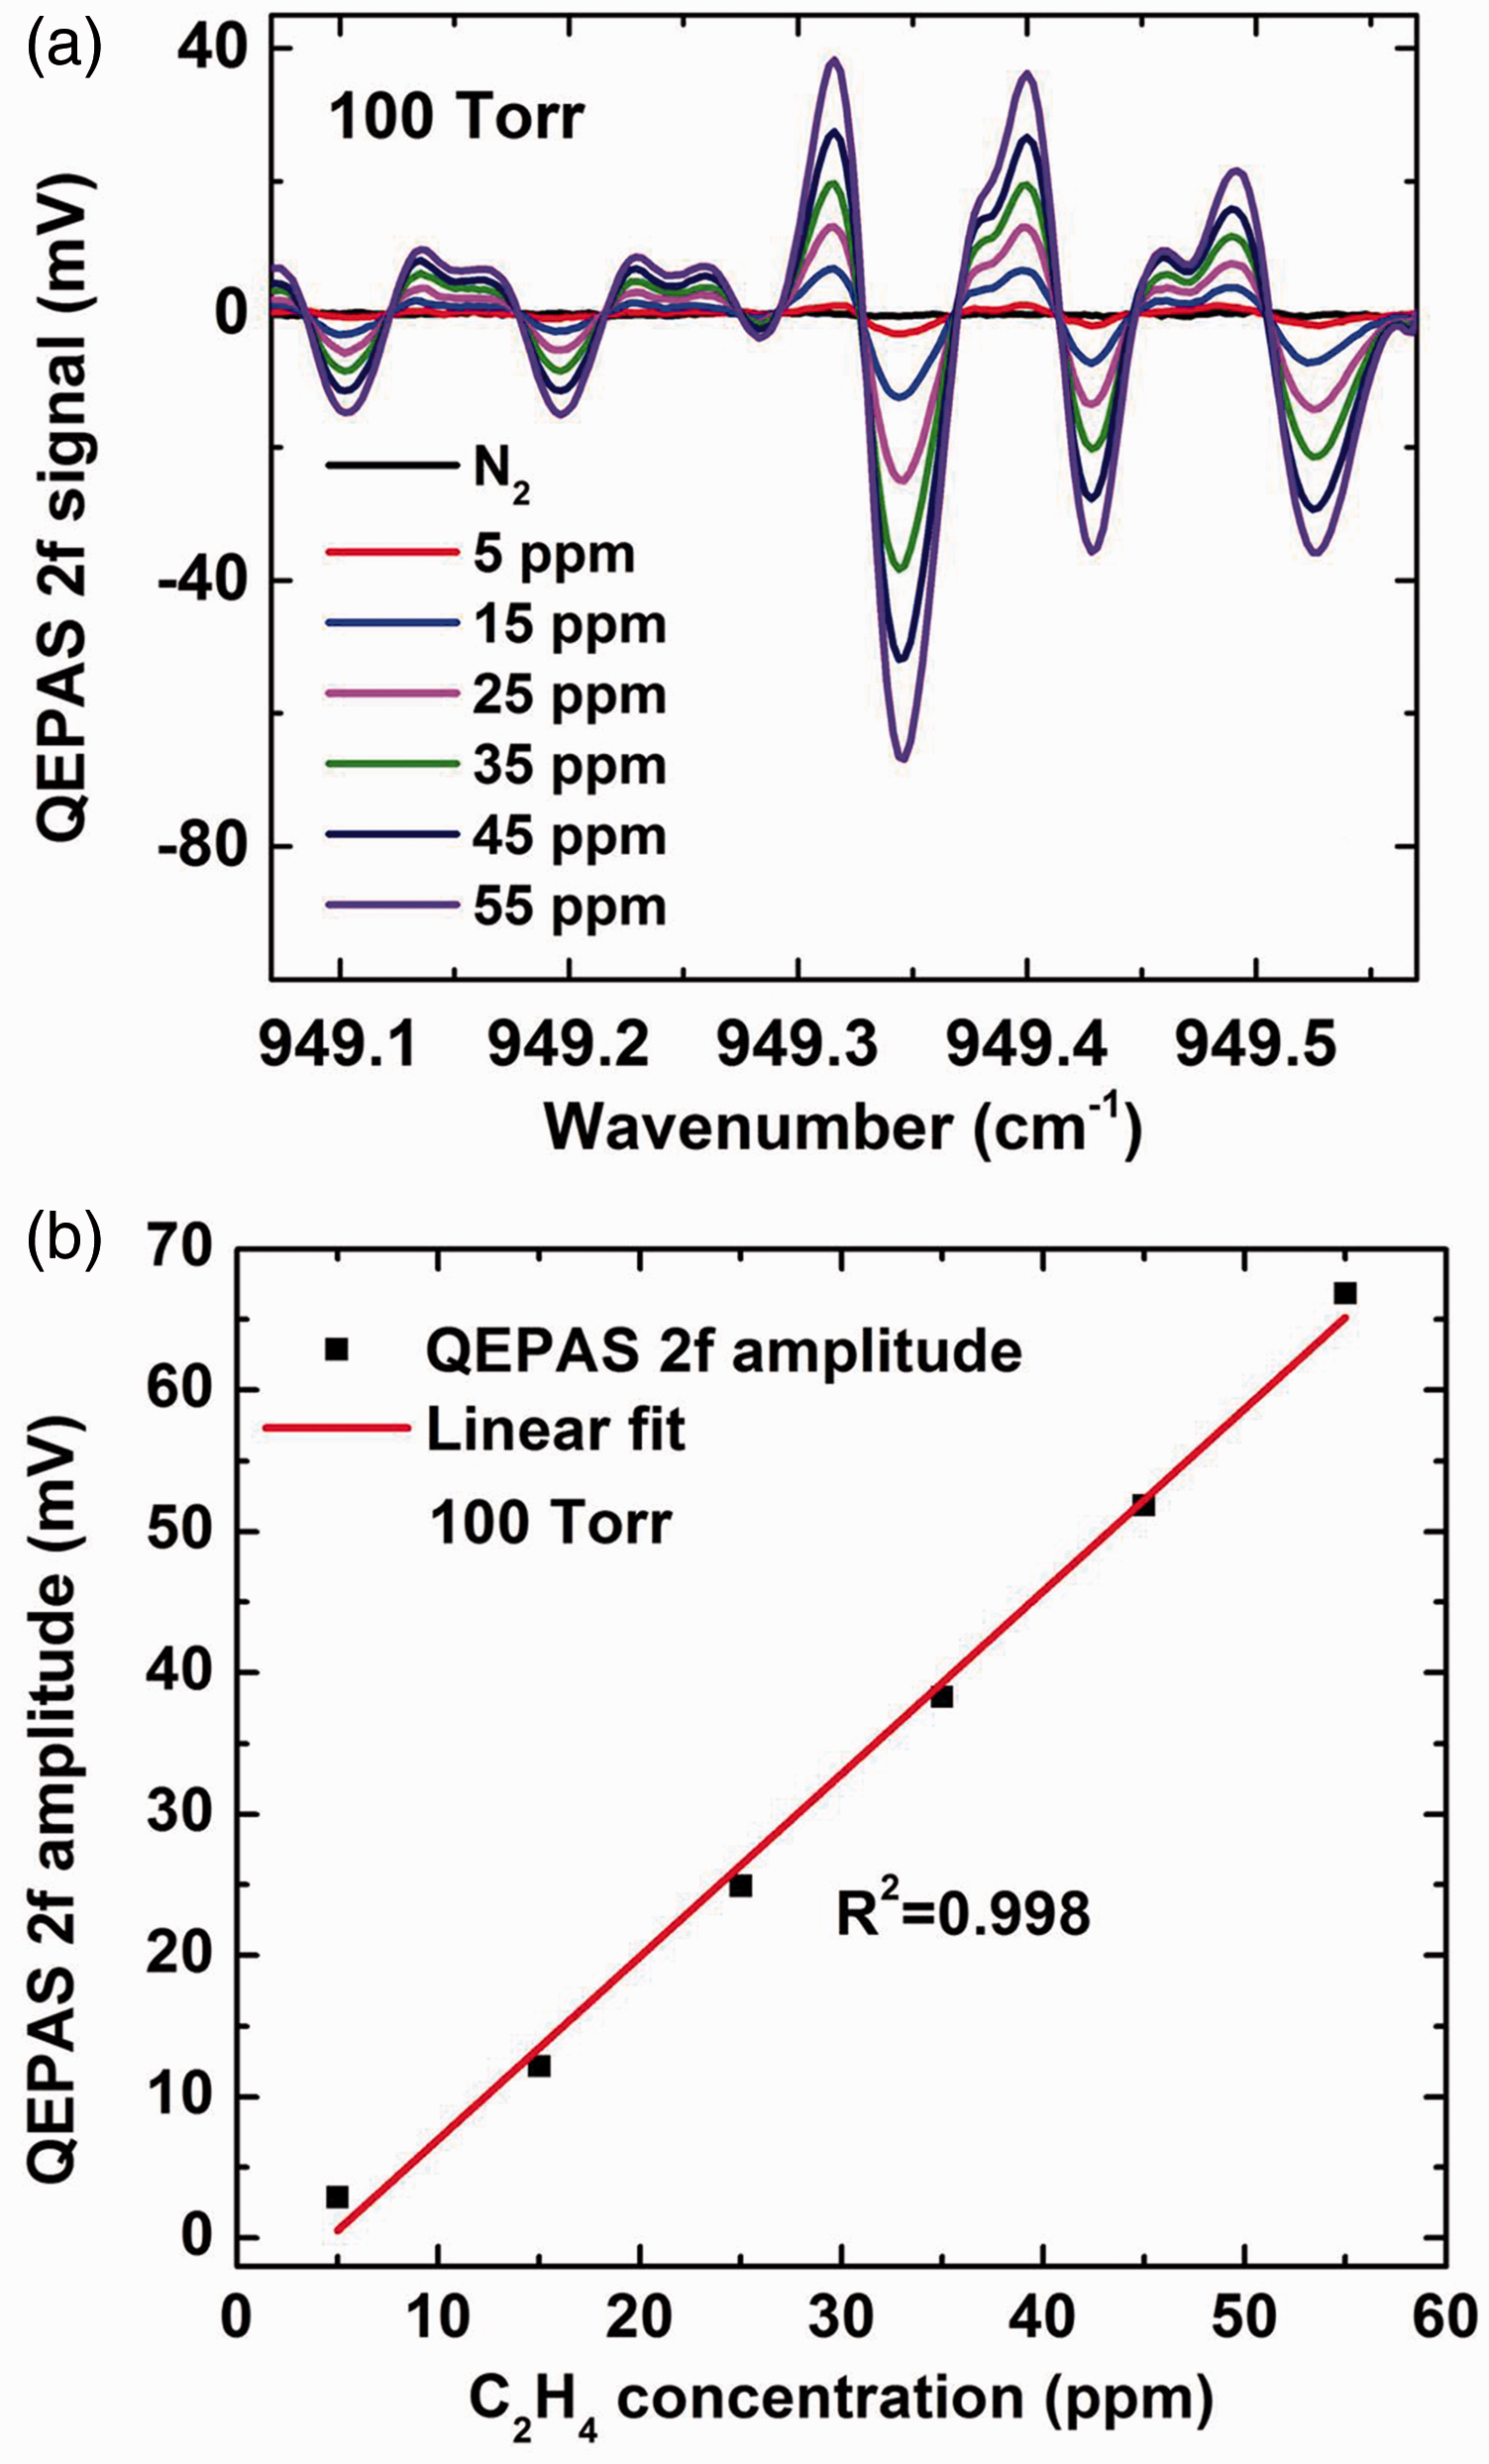
In order to investigate the influence of CO2 vibrational relaxation dynamics on the C2H4 detection, we performed QEPAS measurements of C2H4–CO2–N2 mixtures at different pressures. The CO2 concentration was varied between 0 and 8% at each pressure. Note that the addition of CO2 into C2H4/N2 mixtures may change the in-phase and quadrature components of the measured QEPAS 2f signal by changing the relaxation time of excited C2H4 molecules. Hence, the detection phase of the lock-in amplifier must be adjusted each time when a new CO2 concentration was analyzed. In this work, we recorded the amplitude of the 2f signal which was insensitive to the variation of the detection phase. The experimental results shown in Figure 5 reveal the evident influence of the CO2 addition on the measured C2H4 QEPAS signal at three pressures of 50, 100, and 200 torr. At each pressure, the QEPAS 2f signal of C2H4 changes with the varied CO2 concentrations while the C2H4 concentration was fixed.
Measured QEPAS 2f spectra of C2H4–CO2–N2 at different pressures: (a) 14 ppm C2H4, 50 torr, (b) 9 ppm C2H4, 100 torr, and (c) 9 ppm C2H4, 200 torr. The CO2 concentration was varied between 0 and 8% at all three pressures.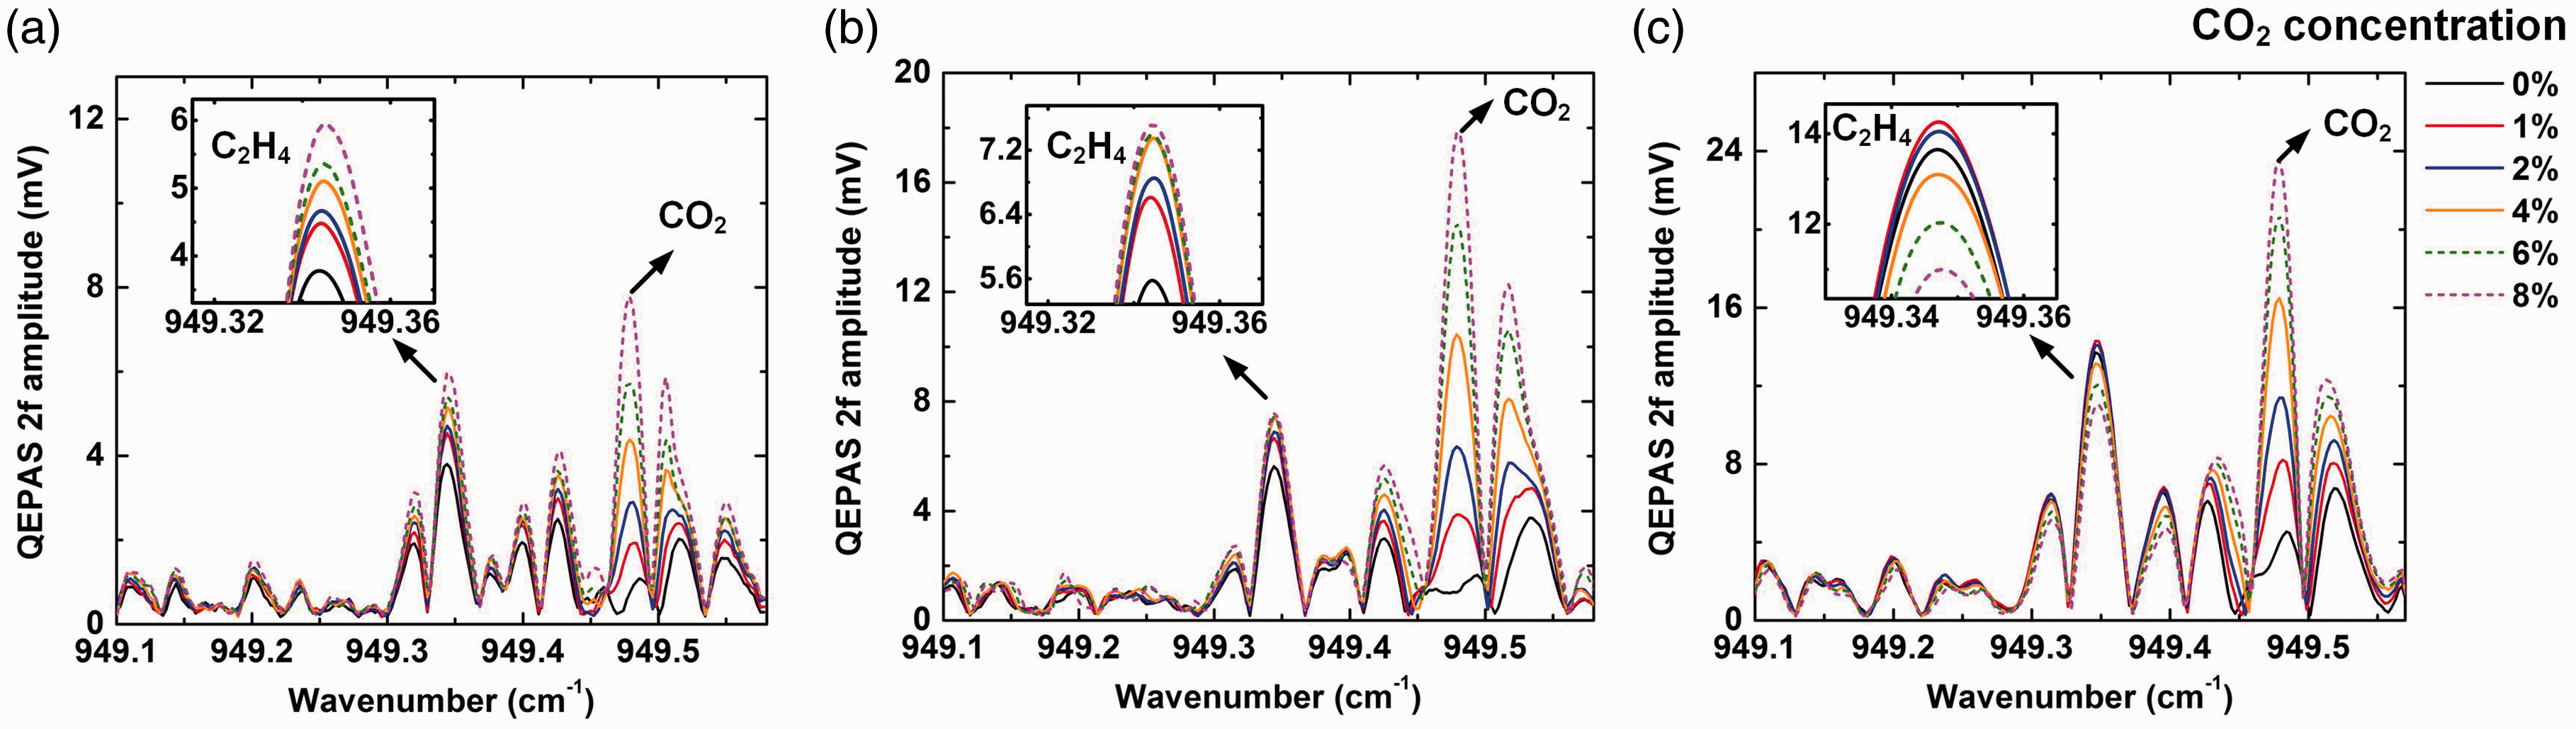
The measured 2f peak amplitudes of CO2 at 949.48 cm−1 and C2H4 at 949.34 cm−1 are plotted in Figure 6. The 2f peak amplitude of CO2 changes linearly with the CO2 concentration at all three pressures as depicted in Figure 6a. In comparison, the C2H4 QEPAS signal increases monotonously with the CO2 concentration at 50 torr as illustrated in Figure 6b. At a higher pressure of 100 torr, the QEPAS signal of C2H4 increases with the CO2 concentration but reaches a plateau level when the CO2 concentration is >4%. However, at 200 torr, the QEPAS C2H4 signal reaches a peak value at the concentration of 1% and then drops with the increased CO2 concentration.
(a) Linear response of CO2 QEPAS 2f amplitude at 949.48 cm−1 to CO2 concentration; (b) variation of C2H4 QEPAS 2f peak amplitude at 949.34 cm−1 at different CO2 concentrations.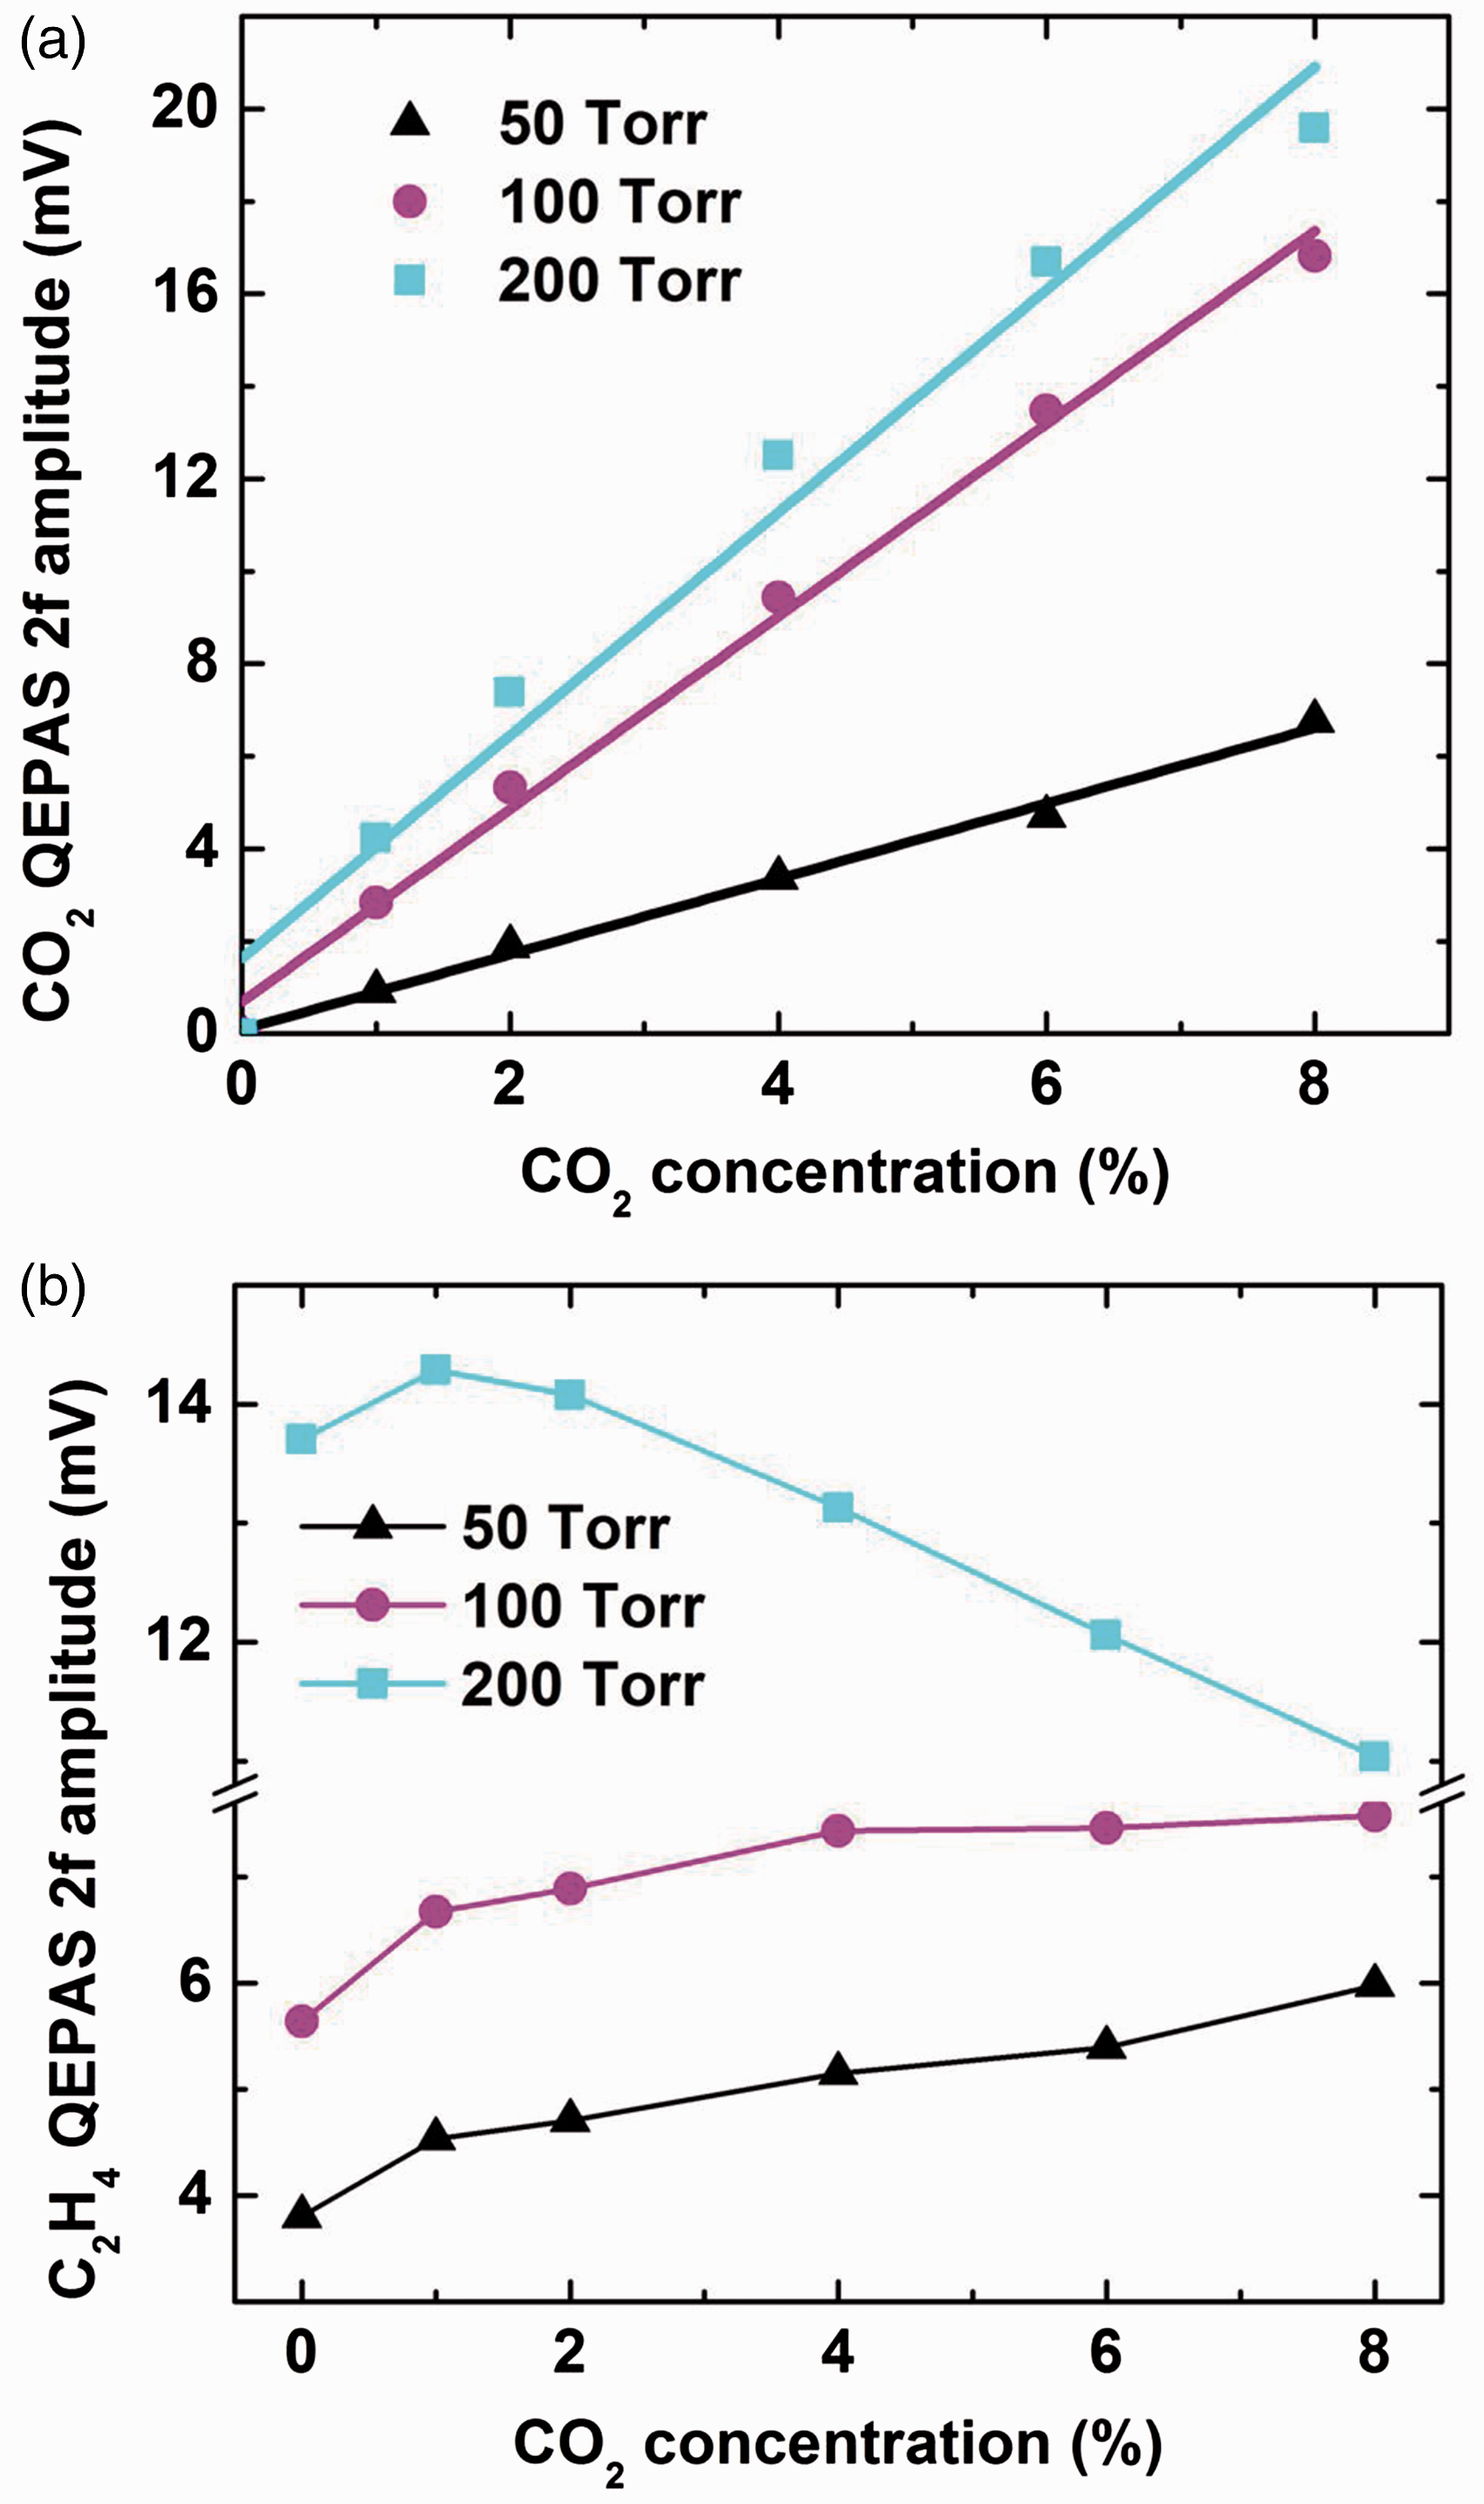
Discussion
The experimental results indicate that the addition of CO2 into the C2H4/N2 mixture significantly affects the QEPAS spectra of C2H4 and such influence is also pressure dependent. Note that the added CO2 molecules with a relatively slow VT relaxation rate participate in the vibrational relaxation of the excited C2H4. Near the target C2H4 line at 949.34 cm−1, the associated vibrational states of the C2H4–CO2–N2 system include the v2 state of CO2 centered at 667.4 cm−1 and four vibrational states of C2H4 at 1026.5 cm−1 (ν4), 949.3 cm−1 (ν7), 940.6 cm−1 (ν8), and 826.0 cm−1 (ν10), respectively.
28
The energy transfer processes involved in the current C2H4–CO2–N2 system can be simplified and are summarized in Figure 7.29,30
The multi-level energy transfer model for the C2H4–CO2–N2 gas system. Dashed line, VV transition; dash-dotted line, VT transition.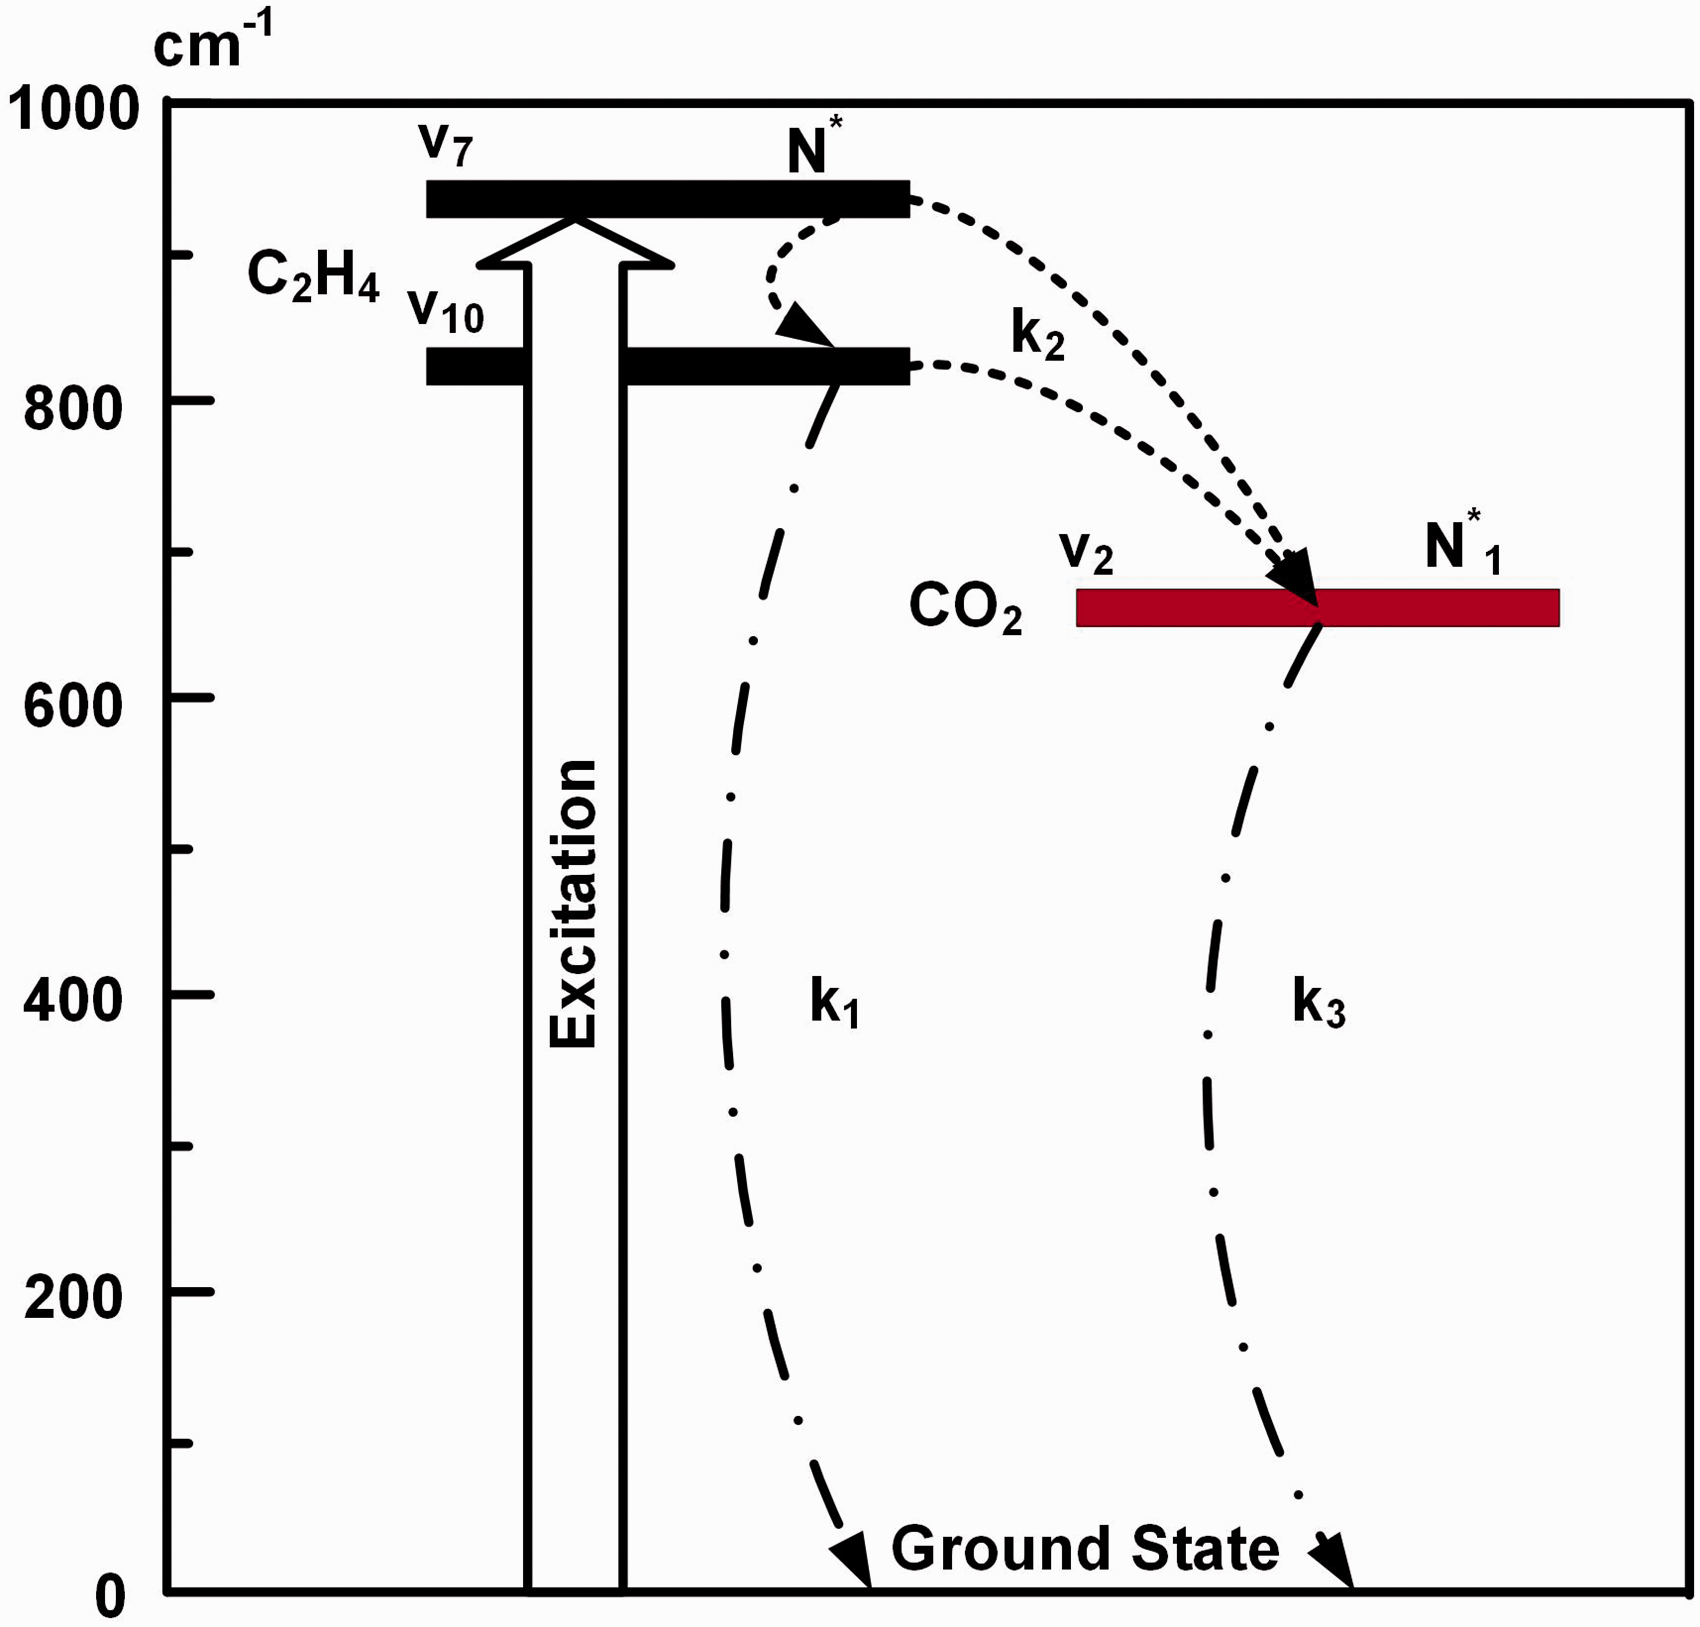
Considering the VV transition is much faster than the VT transition, the VV transitions of (C2H4)ν7–(CO2)ν2 and (C2H4)ν7–(C2H4)ν0–(CO2)ν2 can be assumed to have the same relaxation rate. The overall VV transition is described by the following process:


The QEPAS signal is proportional to the rate of heat produced per unit volume, dH/dt, during the relaxation of the molecular vibrational energy,
34


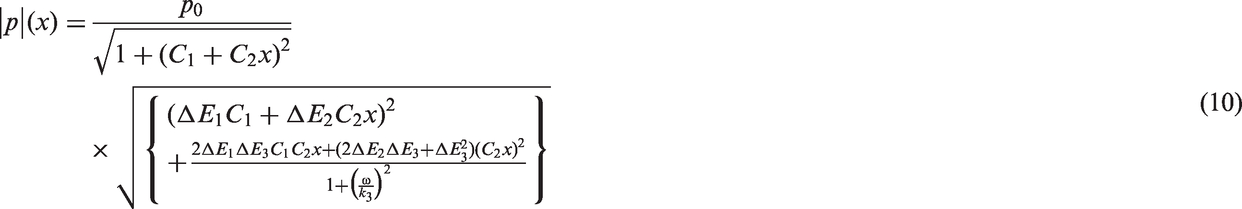
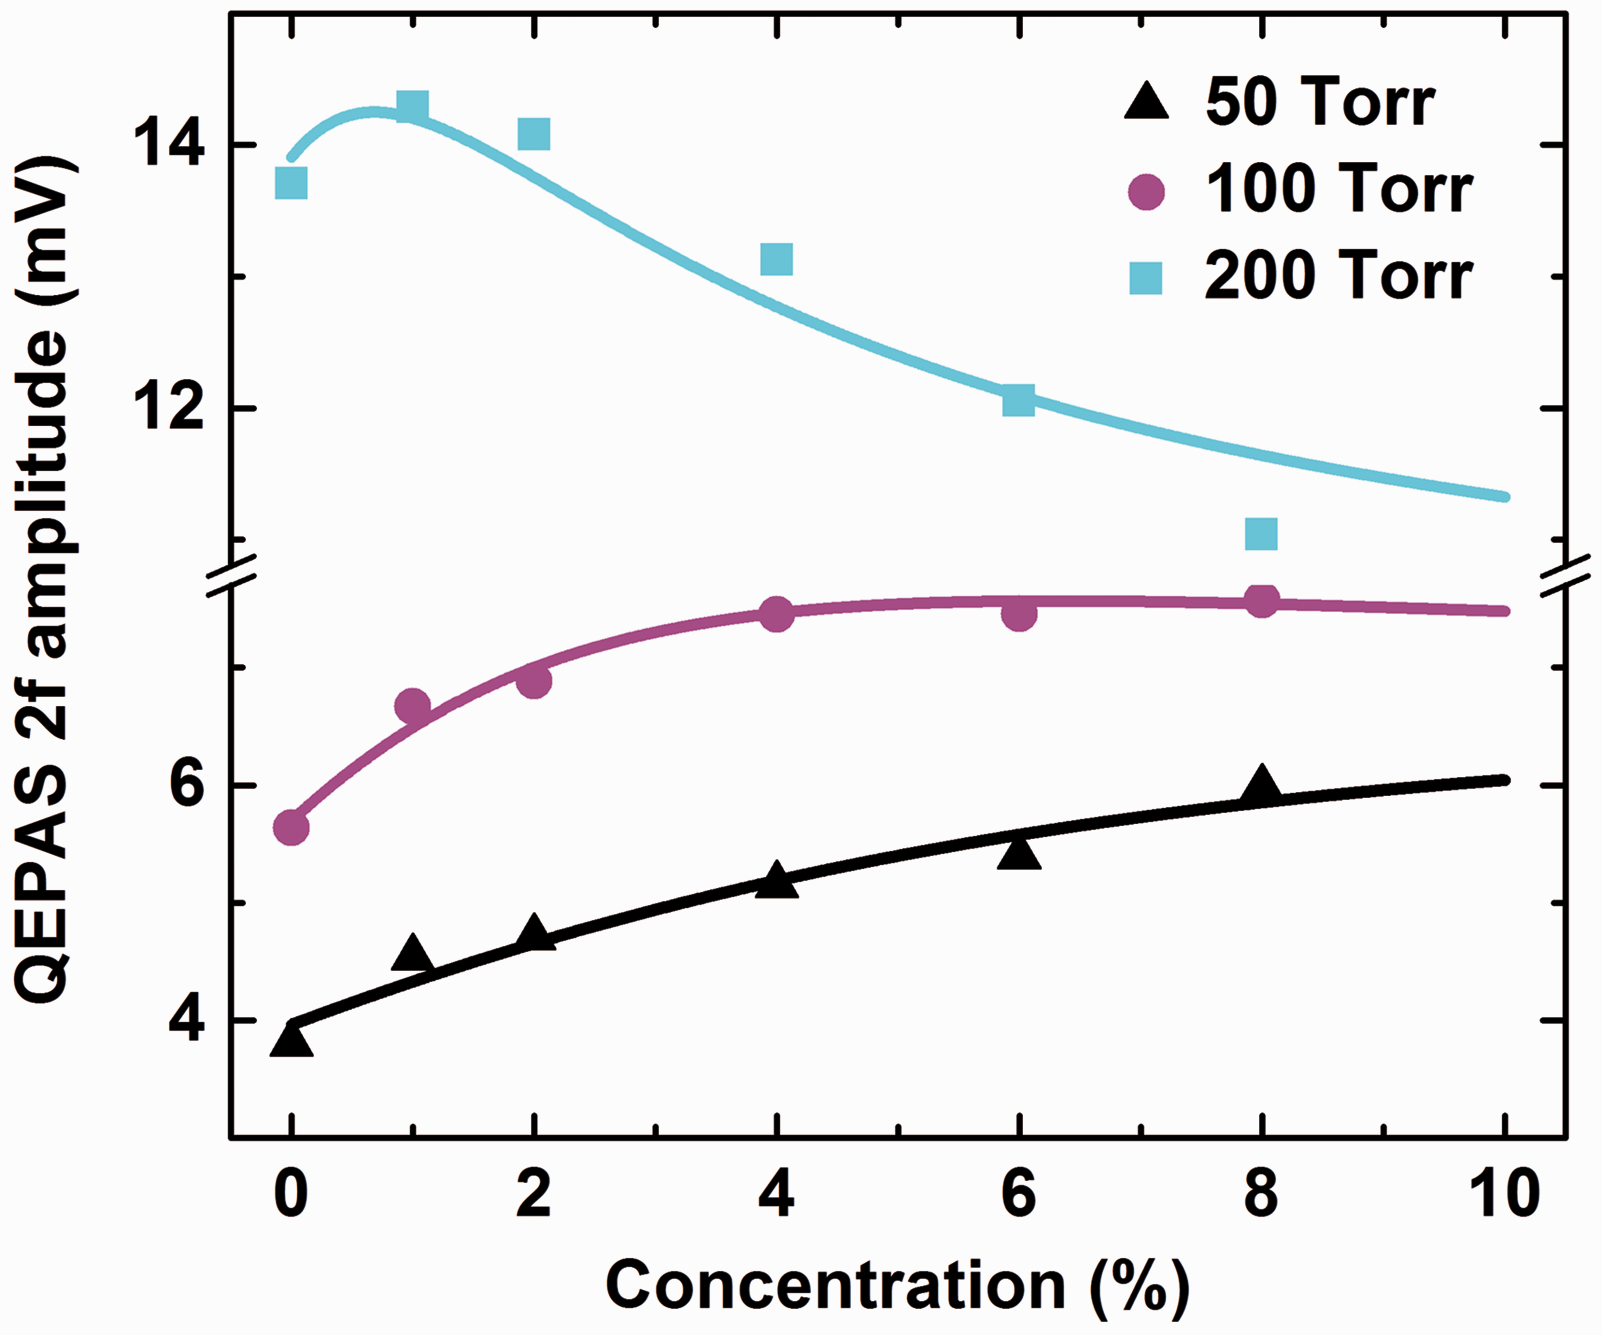
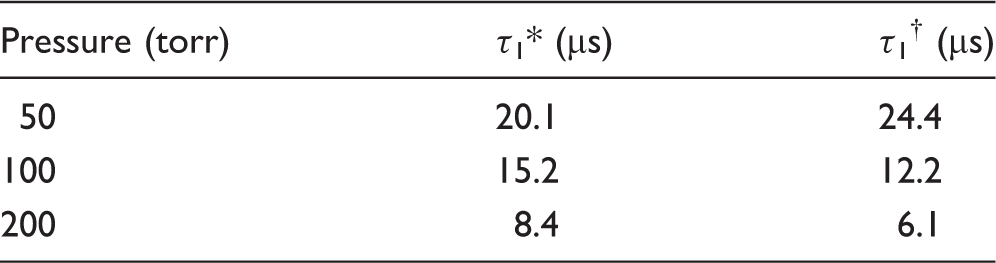
Figure 8 plots the best fit using Eq. 10 to the measured QEPAS signal of C2H4 for varied CO2 concentrations and pressures. The obtained parameters from the best fit lead to realistic values of the VT relaxation time τ1. The fitting results are summarized in Table 1, which are in relatively good agreement with the previously measured values in the literature.
31
As illustrated in Figure 8, the current model accurately predicts the observed dependence of the photoacoustic signal of C2H4 on the CO2 concentration and gas pressure. At 50 torr, C2H4 has a VT relaxation time of ∼20 µs that is comparable with the modulation period (30 µs) of the laser radiation. The added CO2 provides extra energy deactivation processes, the VV transitions of (C2H4)ν7–(CO2)ν2 and (C2H4)ν10–(CO2)ν2, to enhance the QEPAS signal of C2H4. However, such an enhancement caused by the additional VV transitions is mitigated at higher pressures (200 torr) because the energy deactivation starts to be dominated by the VT relaxation of C2H4 at the ν10 state. The excited CO2 at the ν2 state cannot be effectively relaxed due to its much longer VT relaxation time, thus attenuating the photoacoustic signal with the increased CO2 concentration. Hence, the added CO2 changes the energy relaxation process of the C2H4 at the excited state, leading to the varied response of the QEPAS sensor to the CO2 concentration and gas pressure.
Best model fit to the measured QEPAS 2f amplitude of C2H4 for the varied CO2 concentrations. Symbol, experimental data; solid line, best fit using Eq. 10. Summary of the best-fitted τ1 with a comparison to the previous study. VT relaxation time of C2H4 at the ν10 state obtained in this work. VT relaxation time of C2H4 at the ν10 state measured by Yuan and Flynn.
31
Conclusion
We reported the QEPAS-based C2H4 sensor at low pressures by exploiting the strongest absorption line of C2H4 near 10.5 µm using a DFB-QCL. A good linear response to the C2H4 concentration was observed and the long-term stability and precision of the sensor were evaluated to show a MDL of 8 ppb at 90 s integration time. Then we performed the QEPAS and direct absorption measurements of C2H4 in the C2H4–CO2–N2 mixtures at varied CO2 concentrations and pressures. The added CO2 influences the photoacoustic detection of C2H4 at different pressures. An energy transfer model for the C2H4–CO2–N2 system was constructed to successfully interpret the experimental data. It was also found that the QEPAS technique can be used to measure the vibrational relaxation time of gas molecules. This work emphasizes the importance of species interference in photoacoustic detection affected by the additional energy deactivation processes even though the target analyte and interfering species have no spectral overlap.
Footnotes
Conflict of Interest
The authors report there are no conflicts of interest.
Funding
This research is supported by the Early Career Scheme (ECS) grant from the Research Grants Council of the Hong Kong SAR, China (24208515).
Supplemental Material
All supplemental material mentioned in the text, consisting of quartz-enhanced photoacoustic spectroscopy 2f spectra, is available in the online version of the journal.
References
Supplementary Material
Please find the following supplemental material available below.
For Open Access articles published under a Creative Commons License, all supplemental material carries the same license as the article it is associated with.
For non-Open Access articles published, all supplemental material carries a non-exclusive license, and permission requests for re-use of supplemental material or any part of supplemental material shall be sent directly to the copyright owner as specified in the copyright notice associated with the article.