
Abstract
The increasing demand for use of polymers at extreme conditions makes important the exploration of their behavior in a wide pressure and temperature range, which remains unknown for polytetrafluoroethylene (PTFE), one of the most common materials. An in situ Raman spectroscopic study of PTFE shows that it is stable within the range of 2–6 GPa at 500 ℃ and up to 12 GPa at 400 ℃. At T > 500 ℃ and P > 3.5 GPa, the graphitization of PTFE is observed, but judging from the preservation of liquid run products, PTFE can be used as a material for sample container up to 600 ℃ at this pressure. The obtained data allow the suggestion that the triple point between liquid, solid, and decomposed (carbonized) PTFE is located between 3 and 4 GPa at about 550 ℃, by analogy with the behavior of polycyclic aromatic hydrocarbons.
Introduction
Polytetrafluoroethylene (PTFE, DuPont Teflon) is one of the widely used fluoropolymer materials due to its unique properties such as chemical inertness and robustness against degradation, high dielectric strength, low coefficient of friction, and others.1,2 The increasing demand for the use of polymers under extreme conditions of high pressures and high temperatures stimulated the recent studies of their high pressure–high temperature (HP-HT) behavior and properties. In particular, the Fourier transform infrared (FT-IR) and Raman spectroscopic study of polyethylene revealed its structural and chemical stability up to 50 GPa and 380 ℃. 3 Note that, as compared to hydrogenated polymers, their fluorinated counterparts such as PTFE are more attractive for use at high temperatures due to their higher melting and decomposition temperatures. In this respect, the temperature stability of PTFE in a wide pressure range (up to 10 GPa) remains relatively unexplored.
Within the moderate pressure region up to several gigapascals, PTFE has been studied extensively using infrared (IR) and Raman spectroscopy; four different crystalline phases were found below 1 GPa and 100 ℃, including a crystalline transition from a helical to planar zigzag structure (high-pressure phase III) near 0.6 GPa4–6 (Figure 1). Within the stability field of phase III a sluggish phase transition in the terpolymer of tetrafluoroethylene–hexafluoropropylene–vinylidene fluoride, containing 56 mol fraction of PTFE (THV 500) at about 4 GPa is suggested on the base of a discontinuous increase in the d-spacing and a slight change in the slope of ν/P curves of Raman modes.
7
The pressure shifts of the vibrational modes of THV 500 are close to linear and average 4 cm−1/GPa up to 4 GPa, with subsequent minor decrease in their compressibility above this pressure. Note that in highly crystalline (95%) PTFE the corresponding modes shift with a higher rate of about 6 cm−1/GPa.
5
Experimental data on PTFE stability of this work compared with the data of Tanaka and Takemura
6
(phases I–III) and the melting curve by Tamayama et al.
8
(solid bold lines). The corrected phase I–III boundary is shown by dotted line. The area of laser-induced graphitization is contoured by solid narrow line.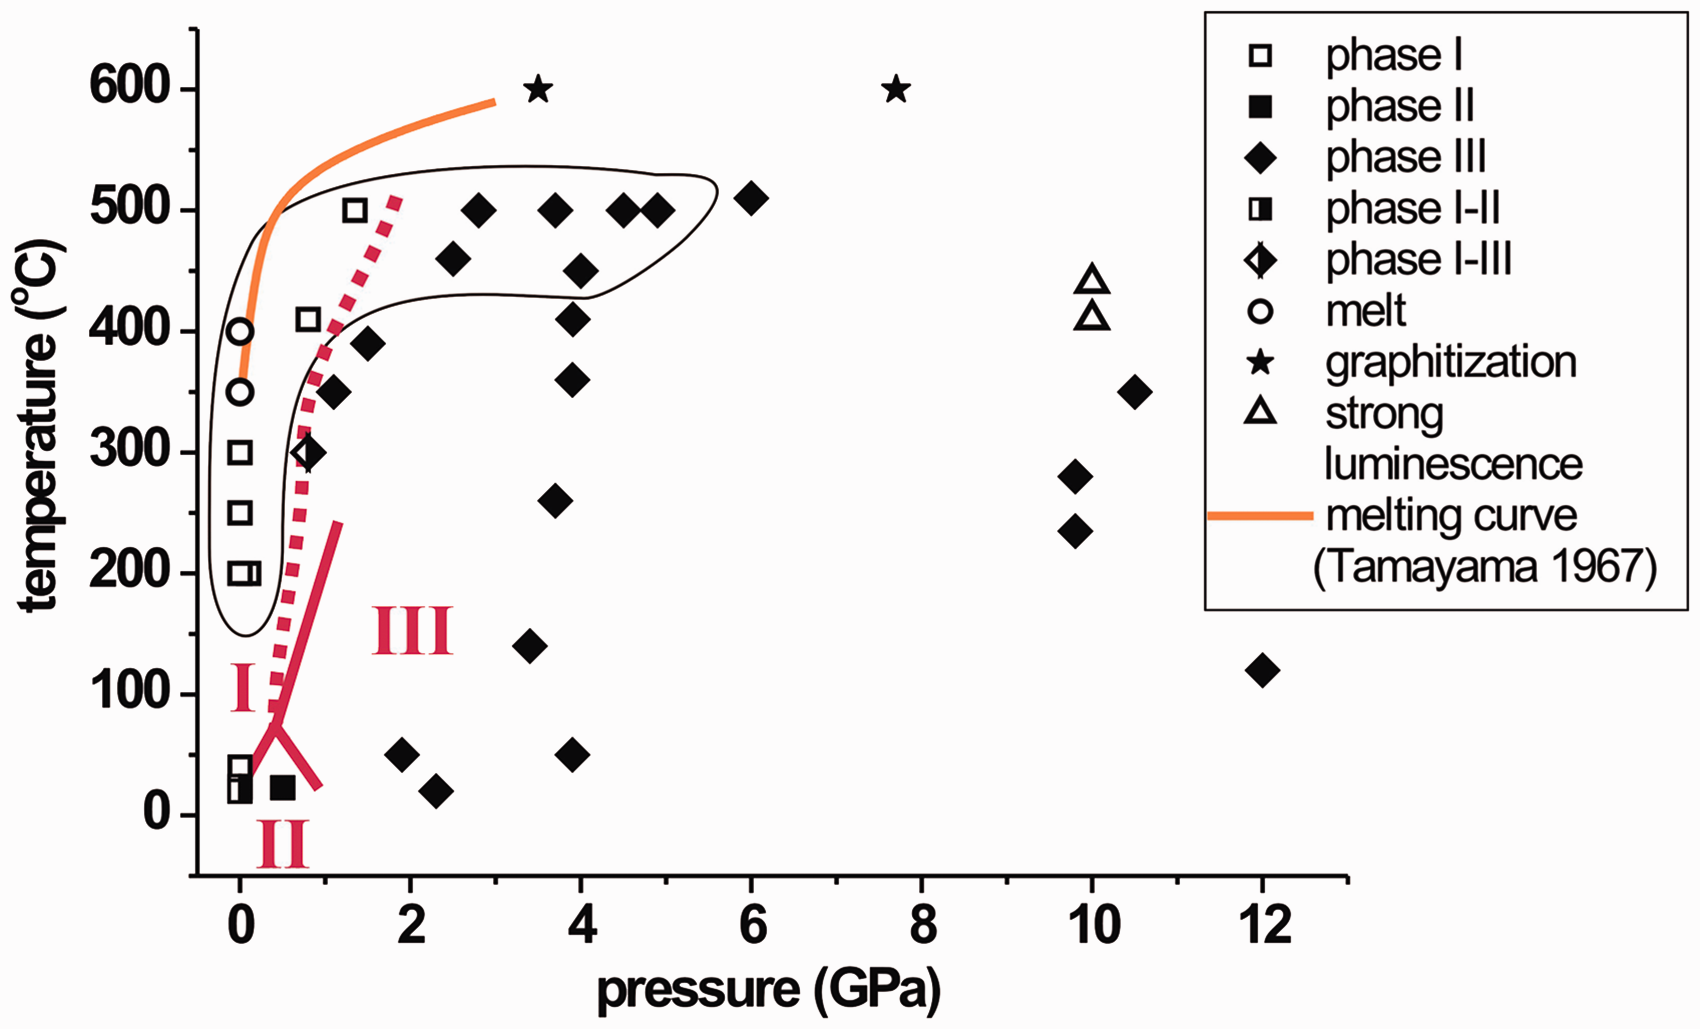
The melting curve of PTFE was studied up to 3 GPa (Figure 1); the melting temperature sharply increases from 280–343 ℃ at atmospheric pressure to 500 ℃ at 0.5 GPa and then smoothly rises up to 590 ℃ between 1 and 3 GPa. 8 Further temperature increase within this moderate pressure range (e.g., to 680 ℃ at 0.18 GPa) leads to PTFE decomposition, involving a chain-breaking (depolymerization) reaction followed by the formation of carbon (carbonization). The carbonization process is shown to be favored by pressure for a wide range of organic compounds.9,10 Moreover, pressure makes possible the solid-phase carbonization, so that the application of high pressures accelerates the graphitization process and significantly reduces the temperature of graphite formation. 9 Therefore, at P > 3 GPa one can expect the development of carbonization (graphitization) in PTFE to proceed without melting and at a lower temperature as compared to 680 ℃ at 0.18 GPa. 8
The aim of this work is to explore the behavior of PTFE in a wider pressure and temperature range, with particular attention to the P-T conditions close to the melting curve, and to find out possible carbonization (graphitization) area, as well as characterize some peculiarities of the behavior of the high-pressure PTFE phase III at high temperature. We present the results of Raman spectroscopic study of PTFE up to 10 GPa and 600 ℃.
Experimental
We used a highly crystalline commercial PTFE sample (DuPont) with Raman spectrum similar to that reported in the references.5,11 A Diacell μScope diamond anvil cell (DAC, EasyLab) with gas membrane and resistive heating was used for in situ measurements of PTFE Raman spectra up to 12 GPa and 500 ℃. The pressure in the DAC working chamber was measured by the shift of SrB4O7: Sm2+ fluorescence line.12,13 For correct temperature estimation we calibrated temperature in the sample chamber using melting points of Sn, NaNO3, and Zn at 1 atm against the temperature of the resistive heater measured by the thermocouple.
In addition, several experiments were performed in Kawai-type 1500 multi-anvil apparatus at 600 ℃ and 3.5–7.7 GPa, where PTFE was used as a sample container for highly volatile organic compounds. We used the tungsten carbide anvils with the truncated edge length of 12.0 mm, semi-sintered zirconia as the pressure medium, and a cylindrical graphite heater. The heater and PTFE capsule were divided by talc insulator. One of these experiments at 7.7 GPa was performed at the SPring-8 synchrotron radiation facility (Hyogo Prefecture, Japan), the detailed cell assembly modification is described in Litasov. 14 The cell assembly was compressed to the selected pressure and then quickly heated to 600 ℃. In the laboratory experiments, the sample was kept at high P-T conditions for several hours; in the synchrotron experiment, the exposure times for collecting diffraction data were 200–600 s.
In situ Raman spectra of PTFE in DAC, as well as those of the container material used in the multi-anvil experiments, were collected on a LabRAM HR800 spectrometer (HORIBA Jobin Yvon) with a 1024-pixel charge-coupled device (CCD) detector using the 514.5 nm argon laser. An Olympus BX41 microscope with backscattering geometry was used with SLMPLN 50× objective (18 mm working distance, 0.35 numerical aperture, 2 µm focal spot size). The spectral resolution was set to ∼3.0 cm−1 at Raman shift of 1300 cm−1. This resolution was achieved by using a grating with 1800 grooves/mm and equivalent 150 µm slits and pinhole. Such resolution provides the accuracy of peak position determination of about 0.5 cm−1. The positions of Raman bands were fitted using Lorentzian model in the Origin 6 program.
Results and Discussion
Spectra Assignments for Polytetrafluoroethylene Phases I–III
Representative Raman spectra of PTFE corresponding to the phases I, II, and III are shown in Figure 2; their main bands are listed in Table 1. The PTFE samples placed in DAC exhibit luminescence even at the initial pressure loading, therefore only the bands within the region of 200–1000 cm−1 were accessible for measurement (Figure 2a). The full spectrum of PTFE measured in air up to 1800 cm−1 is shown in Figure 2b, in comparison with the high-pressure spectra with various luminescence backgrounds.
Raman spectra of PTFE at different P-T conditions in the region of 200–900 cm−1 (a) and 200–1800 cm−1 (b). The pressure-induced luminescence is seen in the three upper spectra in the figure (a), including the spectrum of the released sample, and is most pronounced in the upper spectrum of the figure (b). This band is considered to be associated with fundamental vibration or overtone of transplanar chain conformation.
6
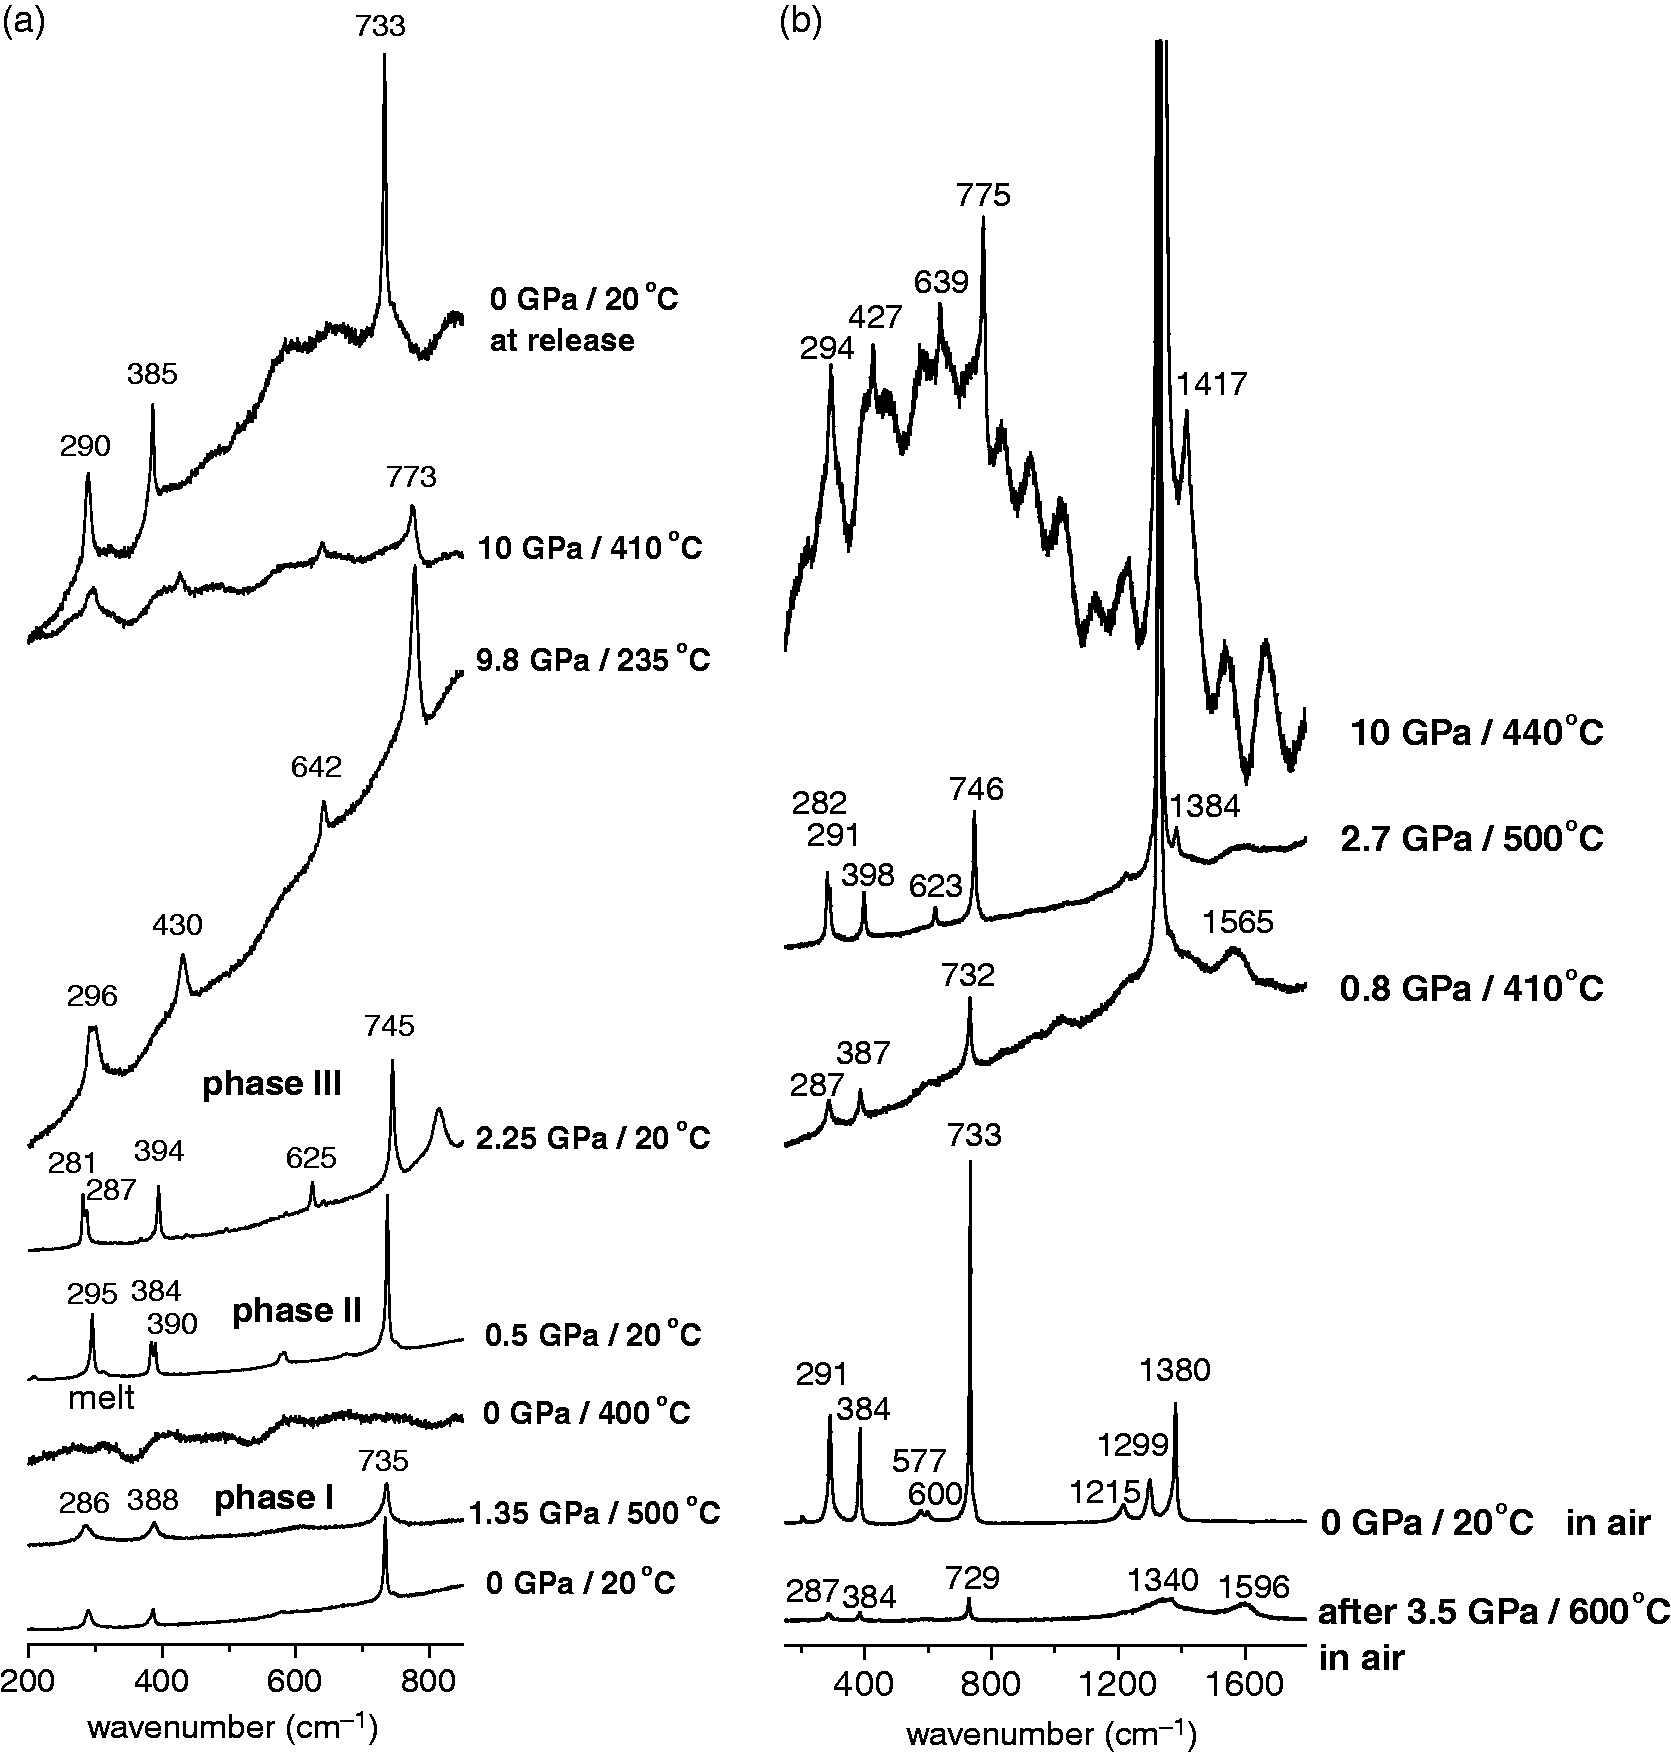
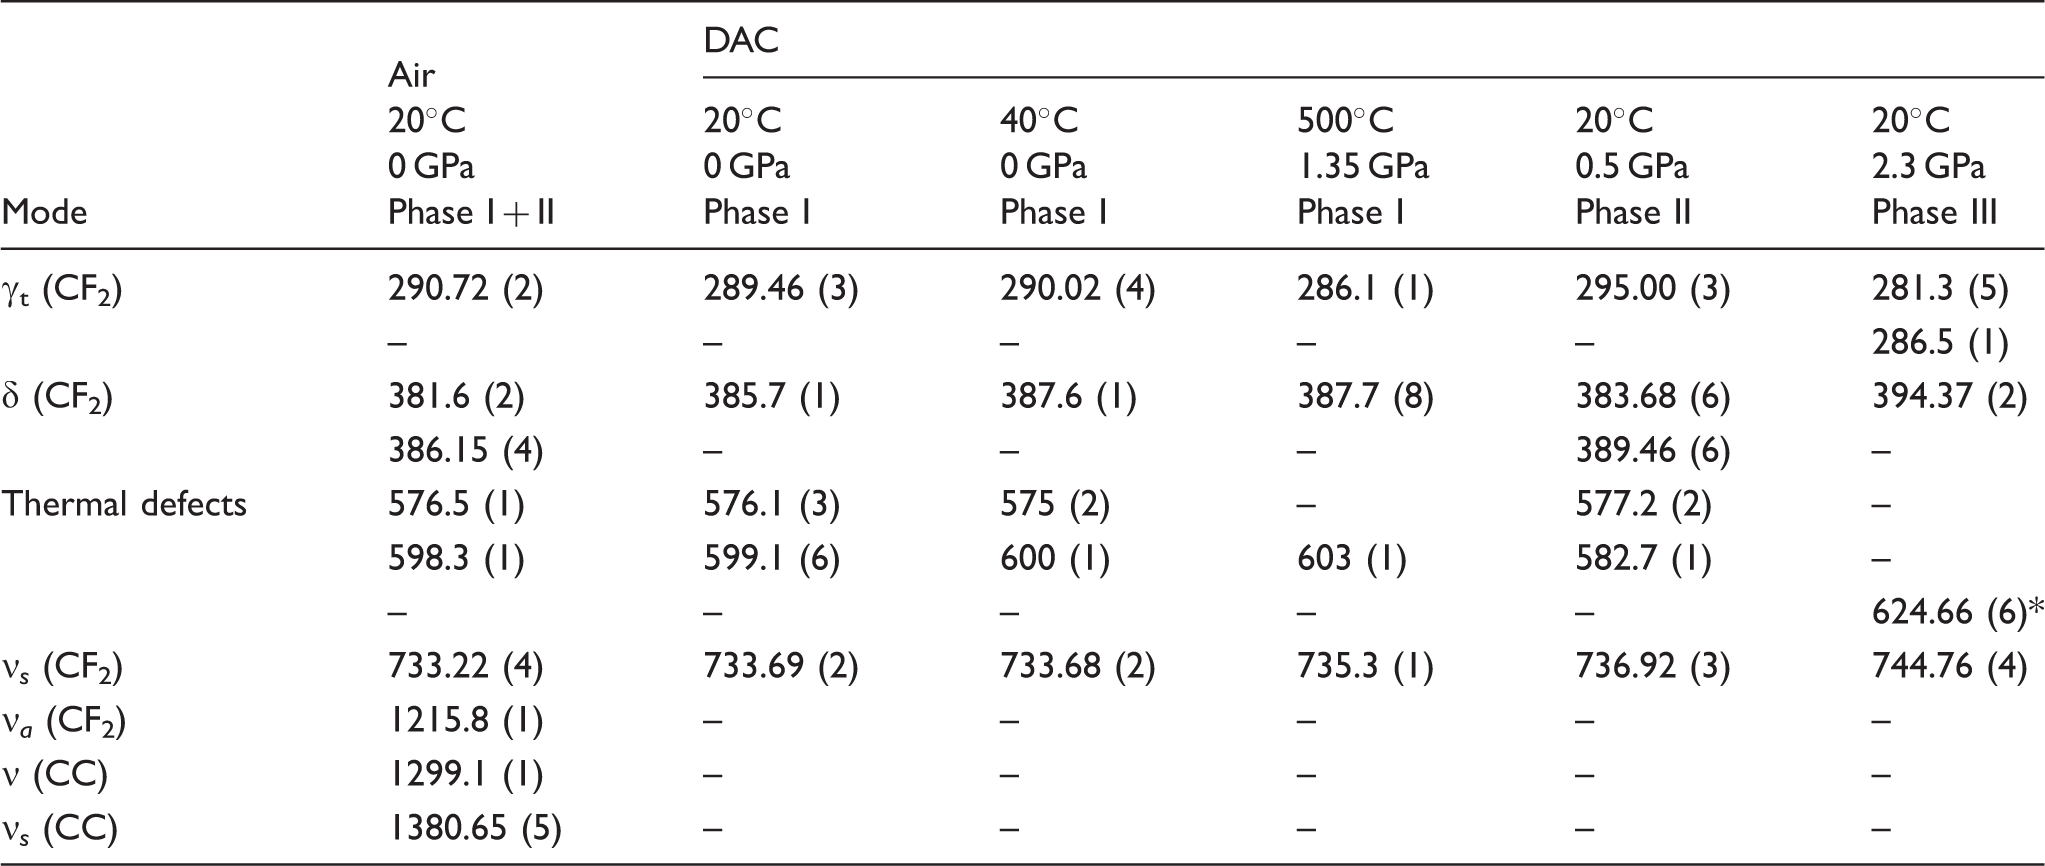
According to the presence of a doublet at 600 cm−1 (Table 1), the full spectrum collected in air is to be assigned to the phase I. 6 However, a strong band at 385 cm−1 exhibits a distinct splitting, characteristic of phase II 5 (Figure 2a), which implies the presence of two phases in the initial sample (Table 1). Actually, at ambient pressure we observed different combinations of weak bands in the region of 600 cm−1, not always matching the assignments based on the relevance of the single bands (600 and 580 cm−1) or their doublet to pure phases I and II. 6 As concerns the spectrum of phase III, the band at 615 cm−1 becomes intense and clearly distinguishable, in agreement with the previous spectral data. 5 In our assignments we considered mainly the shape of intense bands 290 and 385 cm−1; these modes are not split in phase I and exhibit splitting in phase II (385 cm−1) and phase III (290 cm−1) (Table 1). Note that the splitting of CF2 twisting mode 290 cm−1, though it is not predicted by the factor group analysis of the motions of two molecular chains in a monoclinic unit cell, 5 is observed in our spectra up to the highest pressure and temperature studied and is considered to be definitely related to phase III.
P-T Stability and Graphitization of Polytetrafluoroethylene
The summary of our data on the stability of three PTFE phases, based on their spectral features related with different shape of the bands 290 and 385 cm−1, is presented in Figure 1 in comparison with the phase diagram of solid PTFE5,6,15 and its melting curve. 8 The melting of PTFE was observed visually by slow spreading of the sample piece and by the disappearance of Raman lines. The main difference with the previous data is the slope of the phase I–III boundary, shifted to lower pressure at elevated temperature. The uncertainty of this boundary was mentioned earlier in the calorimetric study, where the temperature range of the PTFE I–III transition widened and became less clear with increasing pressure. 8 Starting from about 2.5 GPa, the spectrum of phase III is recorded within the whole temperature and pressure range achieved in DAC experiments (up to 6 GPa/500 ℃ and 12 GPa/400 ℃).
In the vicinity of the melting curve (the area contoured by the narrow line in Figure 1), the laser-induced graphitization of PTFE was observed visually as a black spot growing under the laser beam and by the appearance of a weak spectral feature in the region of graphite line at 1550–1600 cm−1 (spectrum at 0.8 GPa/410 ℃ in Figure 2b). 16 This marks some deterioration of the material robustness and probably needs to be taken into account on its application in such conditions. On the other hand, the authors who studied the melting of PTFE 8 consider it to be quite usable even in a non-crystalline (melted) state.
A proper graphitization (carbonization) of PTFE was only observed after the experiments in multi-anvil apparatus at 600 ℃ and 3.5–7.7 GPa (marked by asterisks in Figure 1). The spectrum of the container material (bottom spectrum in Figure 2b) consists of very weak bands of residual PTFE and broad bands 1340 cm−1 and 1596 cm−1, corresponding to D and G bands characteristic of amorphous carbon.
16
Note that despite a high degree of carbonization, the container integrity was preserved, which is seen from the conservation of the liquid run products (Figure 3).
Photo of the PTFE container with the liquid hydrocarbons inside prior (a) and after (b) the treatment at 600 ℃ and 7.7 GPa.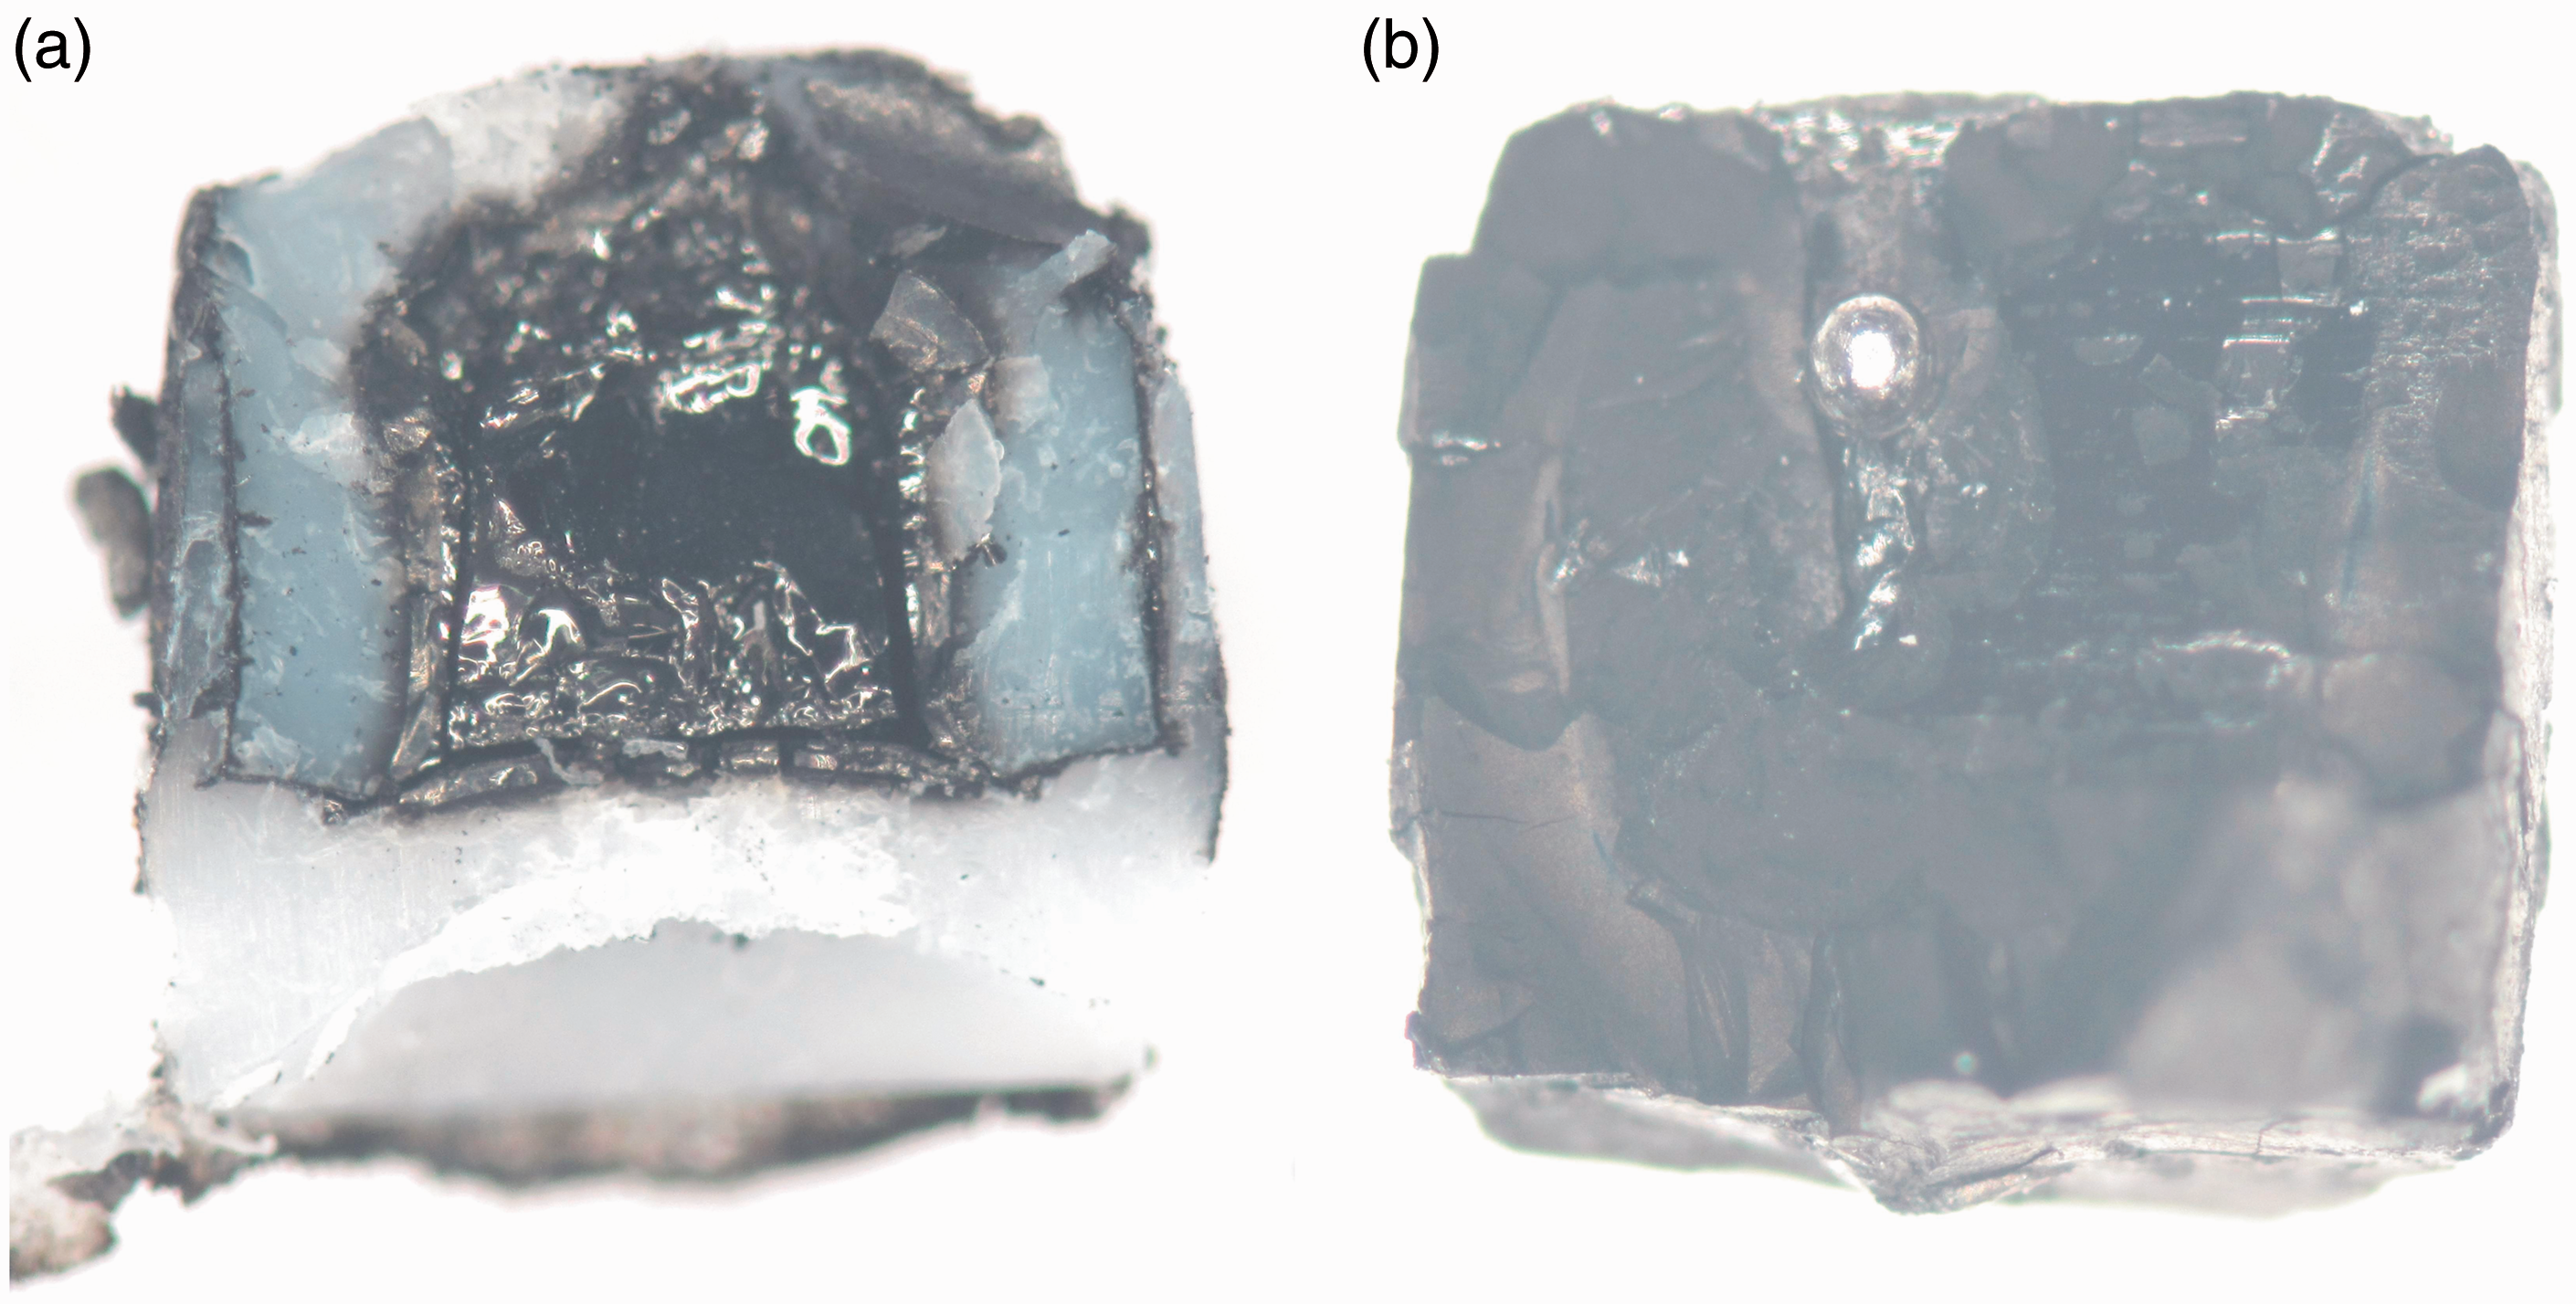
The obtained data show that at P > 3 GPa a solid-phase carbonization of PTFE proceeds at T > 500 ℃. We can therefore suggest the triple point between liquid, solid, and decomposed (carbonized) PTFE is located between 3 and 4 GPa at about 550 ℃, by analogy with the behavior of polycyclic aromatic hydrocarbons. 17
Pressure-Induced Luminescence
With the pressure increase up to 10 GPa, an appreciable growth of luminescence is observed that gradually obscures the Raman spectrum of PTFE (Fig. 2). This effect is especially pronounced at T > 400 ℃ (upper spectrum in Figure 2b) and is similar to that observed in polyethylene. 3 As mentioned earlier, polyethylene was shown to be stable up to 50 GPa and 380 ℃, and that its Raman spectrum could be measured only up to 10 GPa and 300 ℃, whereas FT-IR spectrum was monitored up to the highest pressure studied. A similar discrepancy between Raman and FT-IR measurements at high pressure is also reported for polycyclic aromatic hydrocarbons. 18 In this case, the disappearance of the Raman spectrum starts prior to the pressure at which these compounds appear to amorphize, based on their IR spectra. The luminescence obscuring the Raman spectrum is considered to be associated with increased strength of cross-linking between molecules and increased delocalization of π-electrons. 18 It is possible that luminescence in the spectrum of PTFE can also be related with a certain kind of enhanced inter-chain interaction. It is important that, after the treatment at 10 GPa and T > 400 ℃, the Raman spectrum of PTFE is restored after the sample decompression, though the luminescence is partly preserved (Figure 2a).
Pressure Shift of Raman Modes at High Temperature
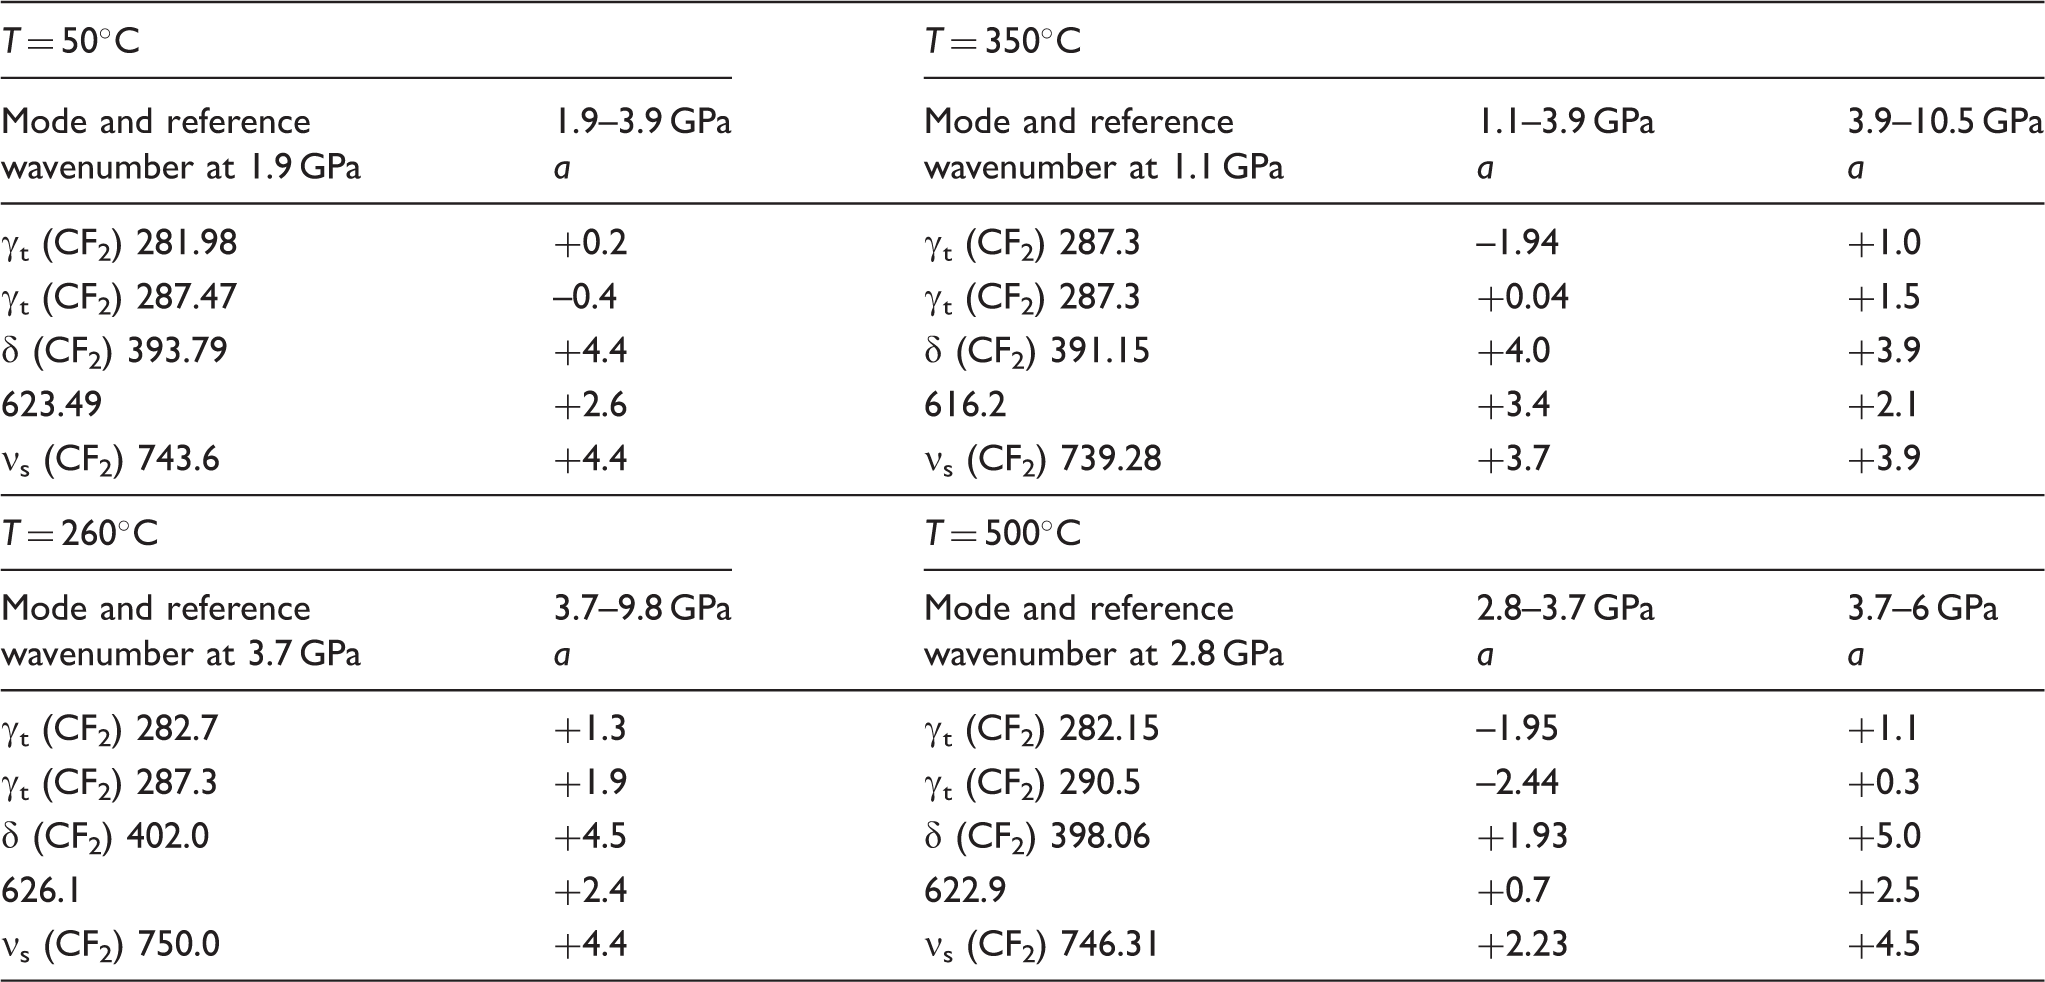
The linear pressure dependence a (cm−1/GPa) for Raman modes of PTFE (phase III) at different temperatures.
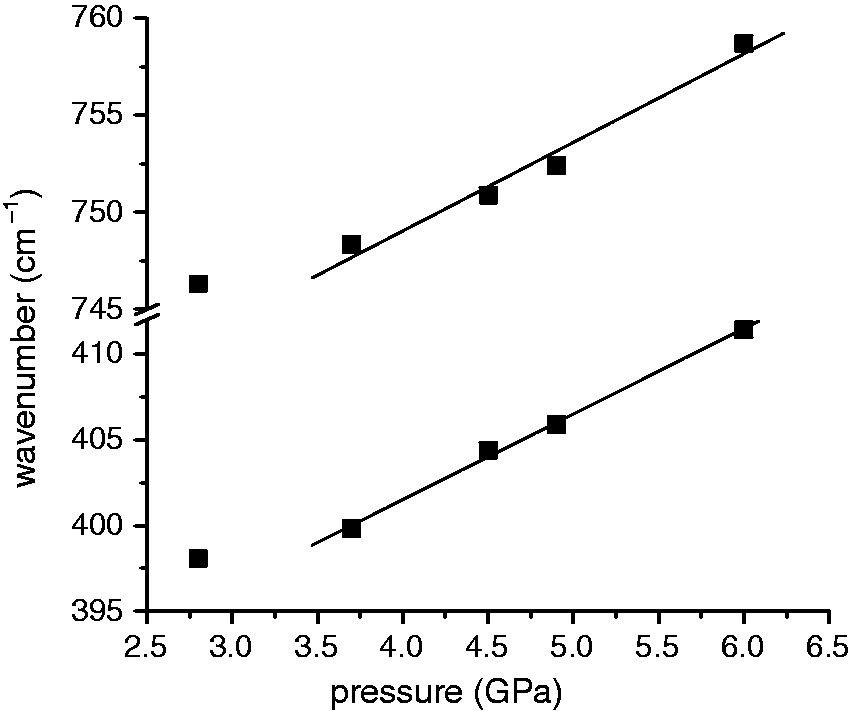
The pressure shift of CF2 bending (385 cm−1) and CF2 stretching (730 cm−1) modes of PTFE phase III at 500 ℃ with the linear fit made for the region of 3.7–6 GPa.
One remark should be made on the relation between the crystallinity and mechanical strength of a polymer material. As mentioned in the work of Rabolt et al., 11 a higher crystallinity implies the increase in bulk density but, at the same time, it “is one of increased brittleness which can then lead to premature structural failure when PTFE is used in a high pressure environment.” On this account, the P-T conditions where the initial PTFE crystallinity can be lowered (up to about 4 GPa at 500 ℃) should not be considered as potential danger zone in the use of PTFE at these conditions.
Conclusion
The HP-HT Raman spectroscopic data on PTFE show that it is stable within the range of 2–6 GPa at 500 ℃ and up to 12 GPa at 400 ℃. On the basis of the obtained data, the boundary between crystalline phases I and III of PTFE is shifted to a lower pressure at an elevated temperature, as compared to the previous data, and lies between 0.9 GPa at 300 ℃ and 1.2 GPa at 400 ℃. With the pressure increase up to 10 GPa and at T > 400 ℃ the Raman spectrum of PTFE is obscured by luminescence. This can be related, by analogy with polycyclic aromatic compounds, with enhanced inter-molecular interaction and apparently does not influence the material stability, since the Raman spectrum of PTFE is restored upon the decompression.
Laser-induced graphitization of PTFE observed in the vicinity of melting curve marks some deterioration of the material robustness. This is in line with the change of its elastic properties towards low-crystalline state at 2.8–3.7 GPa and 500 ℃, evinced by different compressibility of Raman modes compared to the room temperature conditions. On the other hand, even proper graphitization (carbonization) observed at T > 500 ℃ and P > 3.5 GPa allows the use of PTFE as a material for sample container up to 600 ℃, as it can be judged from the preservation of liquid run products at these conditions. The obtained data on the proper carbonization suggest the triple point between liquid, solid, and decomposed (carbonized) PTFE to be located between 3 and 4 GPa at about 550 ℃, by analogy with the behavior of polycyclic aromatic hydrocarbons. 17
On the whole, the presented data reveal the P-T conditions within the upper temperature stability limits of PTFE which are relatively less “safe” in terms of its application, namely the region of 500–600 ℃ at 4–8 GPa associated with carbonization. As regards the HP stability limit of PTFE, it is certainly higher than the pressure of 12 GPa reached in our experiments, similarly to the behavior of related polymers such as polyethylene. 3
Footnotes
Conflict of Interest
The authors report there are no conflicts of interest.
Funding
The work is supported by state assignment project 0330-2016-0004 and by the Ministry of Education and Science of Russian Federation (grant number 14.B25.31.0032).