
Abstract
An approach based on vibrational spectral measurements is described for determining the ionizable group content of ion conducting polymer membrane materials. Aimed at supporting the assessment of membrane stability and wear characteristics, performance is evaluated for attenuated total reflection Fourier transform infrared (ATR FT-IR) spectroscopy, confocal Raman microscopy, and ATR FT-IR microscopy using perfluorinated ionomer membrane standards. One set of ionomer standards contained a sulfonic acid ionizable group and the other a sulfonyl imide group. The average number of backbone tetrafluoroethylene (TFE) units separating the ionizable-group containing side chains was in the range of 7.2–2.1 (sulfonic acid set) and 10.5–4.6 (sulfonyl imide set). A poly(tetrafluoroethylene) (PTFE) sample was included as a blank, representing the limit of zero ionizable group (and maximum TFE) content. Calibration relationships were derived from area-normalized vibrational spectra. For all three methods, calibration models applied to independent spectral measurements of samples predicted the ratio of backbone TFE groups to ionizable groups in the repeat unit (m) with a standard error of ≤ ±0.3. The confocal Raman and ATR FT-IR microscopy techniques achieved ideal blank responses and the lowest prediction errors, down to m ± 0.1 at the 90% confidence level. With its relative simplicity, low sample size requirements, and potential for quantitative micron-scale spatial mapping of the ionizable group content within a membrane, the approach has application to advancing materials development, including exploratory synthesis, durability and wear assessment, and in situ studies of membrane process.
Keywords
Introduction
Polymers containing ionizable functional groups form the basis of materials that support selective ion transport in many practical applications, including water purification, chemical separations, and electric power generation.1–4 Fluorinated ion-containing polymers have played an important role in the development of membrane separators for electrolytic production of Cl2 and H2 and have been adapted for use in polymer electrolyte membrane fuel cells3–7 and chemical sensors.8–10 Although technologically important, fluorinated ionomers are also interesting from the standpoint of their fundamental properties that derive from their structure on the nanoscale (c.f. References4,11–18). In the development of a membrane, oligomers assemble to form nanoscale hydrophobic regions permeated by hydrophilic ion conducting channels rich in the pendant ionizable groups.4,17–20 The hydrophobic framework and interspersed network of ion conducting nanochannels lead to unexpected mass transport phenomena mediated by effects such as surface tension and polymer dynamics.11,12,14–16,21–23 Additionally, the durability and mechanical strength of membranes cast from dilute dispersions can be affected by the nanoscale structure of the oligomers in the solvent. 13
In the characterization of fluorinated ionomers, the equivalent weight (EW), defined as the dry ionomer mass (in grams) per mole of ionizable group in the acid form (for monovalent ionizable groups), is an important figure of merit.7,20 The EW expresses the ionizable group content and is commonly determined by titration.5,7 However, titrimetric analysis is made difficult by the challenges of solubilizing fluorinated ionomers. Furthermore, the quantity of sample required can make titration impractical to implement in routine performance studies that monitor changes in membrane material structure and composition over time. In the present report, a tactic for ionomer EW determination based on vibrational spectroscopic measurements is described. The strategy builds upon methods that relate ionomer EW to spectral band peak ratios24–26 and advances a relatively simple approach that compares the intensities of bands associated with vibrations centered on the polymer side chain ionizable group and regions rich in C–F groups. 26 Performance is shown for the two sets of fluorinated ionomer standards depicted in Scheme 1. Vibrational spectral data, particularly those derived from Raman and infrared (IR) microscopy, provide a means to determine membrane ionizable group content of small membrane samples with an accuracy and precision needed to support advances in materials development for important technologies through exploratory synthesis, assessment of membrane durability and wear, and in situ probing of membrane processes.27,28
Experimental
Samples and Reagents
Samples of 3M ionomer6,29 (25–50 µm thickness) and PTFE (270 µm thickness) were provided by Steve Hamrock and Mike Yandrasits of 3M. Bis-perfluorosulfonyl imide (PFSI) (50–250 µm thickness) ionomer was synthesized as described previously.7,30 The m-values (ratio of backbone TFE groups to ionizable groups in the repeat unit) given in Scheme 1 are averages obtained from titration of bulk samples. The non-integer values reflect the distribution of m, or TFE monomer units separating side chains, within individual regions of oligomers. All samples were stored in the Na+-exchanged form. Just prior to spectral measurements, to ensure samples were free of contaminants and fully Na+ exchanged, membrane was immersed in warm (∼60 ℃) 0.5 M NaCl containing 0.3% H2O2 for approximately 15 min followed by brief rinsing in deionized water. Surface water was removed by patting lightly with a Kimwipe before placing the membrane onto the optical stage for analysis. For confocal Raman and conventional attenuated total reflection Fourier transform infrared (ATR FT-IR) measurements, the membrane was covered by a glass microscope slide to hold it flat against the glass cover slip (Raman) or ZnSe crystal (infrared). The sandwich configuration helped maintain constant membrane hydration during spectral data collection. For the 3M samples, separate sets were prepared for calibration and for use as “unknowns”. Although originating from the same stock material, the sets of calibration samples and “unknowns” were cut and ion-exchanged in separate batches, and in some cases, on different days. The PFSI samples were limited in size and could not be cut into pieces to produce multiple sample sets. Therefore, following collection of PFSI calibration data, a few of the membranes were selected and further spectral measurements were performed independent of the calibration set. A spectral normalization procedure discussed below was effective in compensating for differences in swelling among the samples, especially given the slightly different histories of 3M samples used for calibration and treated as “unknowns”. Solutions were prepared from water dispensed from a Barnstead GenPure UV water purification system (ThermoFisher Scientific) and had a minimum resistivity of 18.0 MΩ·cm. Sodium chloride (Macron Chemicals) and H2O2 (30%; Fisher Chemical) were ACS reagent grade and used as received.
Infrared Spectroscopy
Measurements performed with conventional ATR optics (VeeMaxII, Pike Technology) employed a Bruker Vertex 70 (Bruker Optics) FT-IR spectrometer equipped with a narrow band liquid nitrogen cooled mercury–cadmium–telluride (MCT) detector and a room temperature L-alanine deuterated triglycine sulphate (LaDTGS) detector. The figure legends specify the detector used for recording the data reported. Samples were laid on top of and overfilled the 2.0 cm diameter flat surface of the ZnSe ATR crystal (Pike Technology). The crystal was configured for single reflection measurements at 45°. A purge gas generator (Balston 75-52, Parker-Hannifin Corp.) continuously supplied dry, CO2-free air to the instrument. The IR microscope was a LUMOS (Bruker) system equipped with a wide-band liquid nitrogen cooled MCT detector and germanium µ-sampling ATR crystal. Beam divergence following the microscope objective (8× Cassegrain, 0.6 N.A.) leads to a spread of incidence angles at the Ge/sample interface with an upper bound of 37°. All interferograms were recorded at 4 cm−1 resolution and spectra were computed from the average of 128 (conventional ATR) and 32 (IR microscope) scans.
Raman Spectroscopy
The confocal Raman microscope has been described in detail previously. 31 Raman scattering was excited at 638 nm. A 100×, 1.4 N.A. oil immersion objective (Nikon, Plan APO VC) mounted on an inverted fluorescence microscope frame (Nikon Eclipse TE-200) directed the laser beam through immersion oil and coverslip and brought the focus to a position within the sample equidistant from the coverslip and the membrane/air interface. Scattered light from the sample was collected using the same microscope objective. Collected photons were dispersed by a 0.25 m spectrograph (Chromex 250IS, Bruker) and imaged onto a charged-couple device (CCD) detector (Andor Technology). The diffraction grating, 600 lines/mm blazed at 750 nm, and 50 µm entrance slit provided a spectral resolution of 3 cm−1. The confocal aperture was defined using the entrance slit of the monochromator in the horizontal dimension and by binning three rows of pixels on the CCD camera (78 µm) in the vertical dimension. 32 The tightly focused excitation beam (radius at 1/e2 = 0.6 µm) 31 together with the collection aperture in the image plane define a confocal probe volume within the membranes of ∼5 fL where 90% detection efficiency was within a depth along the z-direction of ± 0.6 µm. 33 Raman spectra were measured with 30 s exposure periods and calculated from the average of 20 exposures. These spectra were processed using a program executed in Matlab (version 8.6; The MathWorks Inc.) that subtracted the dark spectrum offset and subsequently corrected for instrument response 34 by calculating the ratio of the data to a white-light reference spectrum. 35
Data Analysis
Prior to calibration studies, all spectra were baseline corrected by subtraction of a fourth-order polynomial fitted to the non-peak containing regions of the spectrum (OriginPro 8.0; OriginLab Corp.). To compensate for variation in hydration levels and density among a set of samples, the spectral intensities were normalized27,36,37 relative to the total optical signal integrated across the wavenumber range investigated. Values predicted for m (Scheme 1) and its uncertainty (δm) were determined from the regression coefficients derived from linear least squares analysis of the data.38–41 When the regression analysis was performed relative to the ionizable group-to-TFE ratio (1/m), as a final step, propagation of error analysis was performed to transform the uncertainty in 1/m, δ(1/m), to uncertainty in m, where δm = δ(1/m) ×
Background and Theory
In efforts to develop an optical method for EW determination in Nafion,
20
a fluorinated, sulfonate-based ionomer structurally related to those shown in Scheme 1, Qin et al.
26
demonstrated a relationship between the mole fraction of side chain containing segments (S) and the ratio of peak intensities (R) for a set of IR absorption bands dominated by contributions from C–F and S–O vibrational motions as follows:

In Eq. 1, R is defined as the ratio of C–F to side chain end group (e.g., S–O) vibrational band intensities (IC–F/IS–O) for selected spectral peaks, and A’ and B’ are constants proportional to the IR absorption coefficients for the transitions. Additionally, writing S in terms of contributions from the TFE monomer and side chain derived monomer gives:
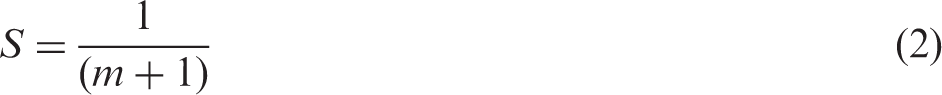
In the experimental work presented, to compensate for variation in hydration levels and density among a set of samples, spectral intensities were normalized27,36,37 relative to the total optical signal integrated across the wavenumber range investigated. Therefore, it was desirable to derive R in Eq. 1 in terms of the side chain end group contribution relative to the total optical signal ((IS–O/ITOTAL) = IS–O’). Approximating the latter relationship by IS–O/(IS–O + IC–F), a new R, represented by R”, can be written as follows:
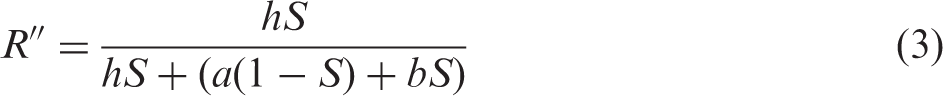
Rearrangement of Eq. 3, with substitution of Eq. 2, gives the following relationship for the area-normalized spectral band intensities in terms of m:
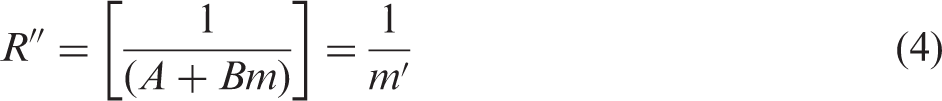
Since 1/m reflects the ionomer side chain end group-to-TFE ratio (Scheme 1), 1/m’ in Eq. 4 is a parameterized side chain end group-to-TFE ratio. In relation to the optical absorption (or Raman scattering) coefficients, the A and B parameters in Eq. 4 are given by A = (1 + b/h) and B = (a/h). An advantage of Eq. 4, discussed below, is that it allows spectral information from a blank sample to be included in the calibration model.
For ATR FT-IR measurements on Nafion ionomer, Qin et al. reported A’ = –2.7 and B’ = 2.9. 26
Results and Discussion
Area-normalized ATR FT-IR spectra for the 3M ionomer samples collected using a conventional ATR accessory are plotted in Fig. 1. The variation in spectral band intensity with changes in sample EW can be explained based on prior vibrational mode assignments for the 3M ionomer.
43
Particularly notable is the increase in the width of the 1202 cm−1 band and development of a shoulder near 1250 cm−1 as the ionomer side chain content increases, or equivalently, the EW decreases. Although sometimes difficult to discern,44,45 fluorinated ionomer features in this region have long been associated with sulfonate group anti-symmetric S–O stretching.43–46 The trend in Fig. 1 is as expected for the series of materials studied and adds strength to the assignment. The bands at 1202 cm−1 and 1147 cm−1 are dominated by C–F stretching vibrations and reflect the ionomer backbone TFE content relative to the side chains. The spectrum of PTFE was omitted from Fig. 1 for clarity, but is shown in Fig. S1 in comparison to the 1100 EW sample. For PTFE, the bands at 1202 cm−1 and 1147 cm−1 contribute the only IR features through the region. For the ionomer samples, the peak intensity at 1202 cm−1 in Fig. 1 remains fairly constant with changes in ionomer EW, possibly because peak intensity loss associated with decreasing backbone TFE relative to the sulfonate content is offset by growth of the ∼1250 cm−1 shoulder ascribed to sulfonate vibrations. However, the 1147 cm−1 peak decreases markedly in the normalized spectra as ionomer EW becomes smaller, consistent with the corresponding decrease in ionomer backbone TFE (i.e., m, Scheme 1) in the ionomer repeat unit. Also consistent is the response in the low energy shoulder near 1130 cm−1 on the 1147 cm−1 band with changing EW. The 1130 cm−1 feature has been assigned to anti-symmetric vibrations of the side chain ether group,
43
and its increase relative to the 1147 cm−1 peak as EW decreases is as expected for a side chain vibration.
Infrared spectra of 3M ionomer recorded with the use of a conventional ATR accessory equipped with a 45° ZnSe crystal. The spectra shown were baseline corrected and normalized to the area in the range of 1024–1324 cm−1. The blue arrows indicate the direction of spectral change in the neighboring region as EW decreases. The inset highlights intensity change in the 1059 cm−1 peak dominated by vibrations of the sulfonate group (see text for additional details). The spectrometer was equipped with a liquid nitrogen cooled MCT detector.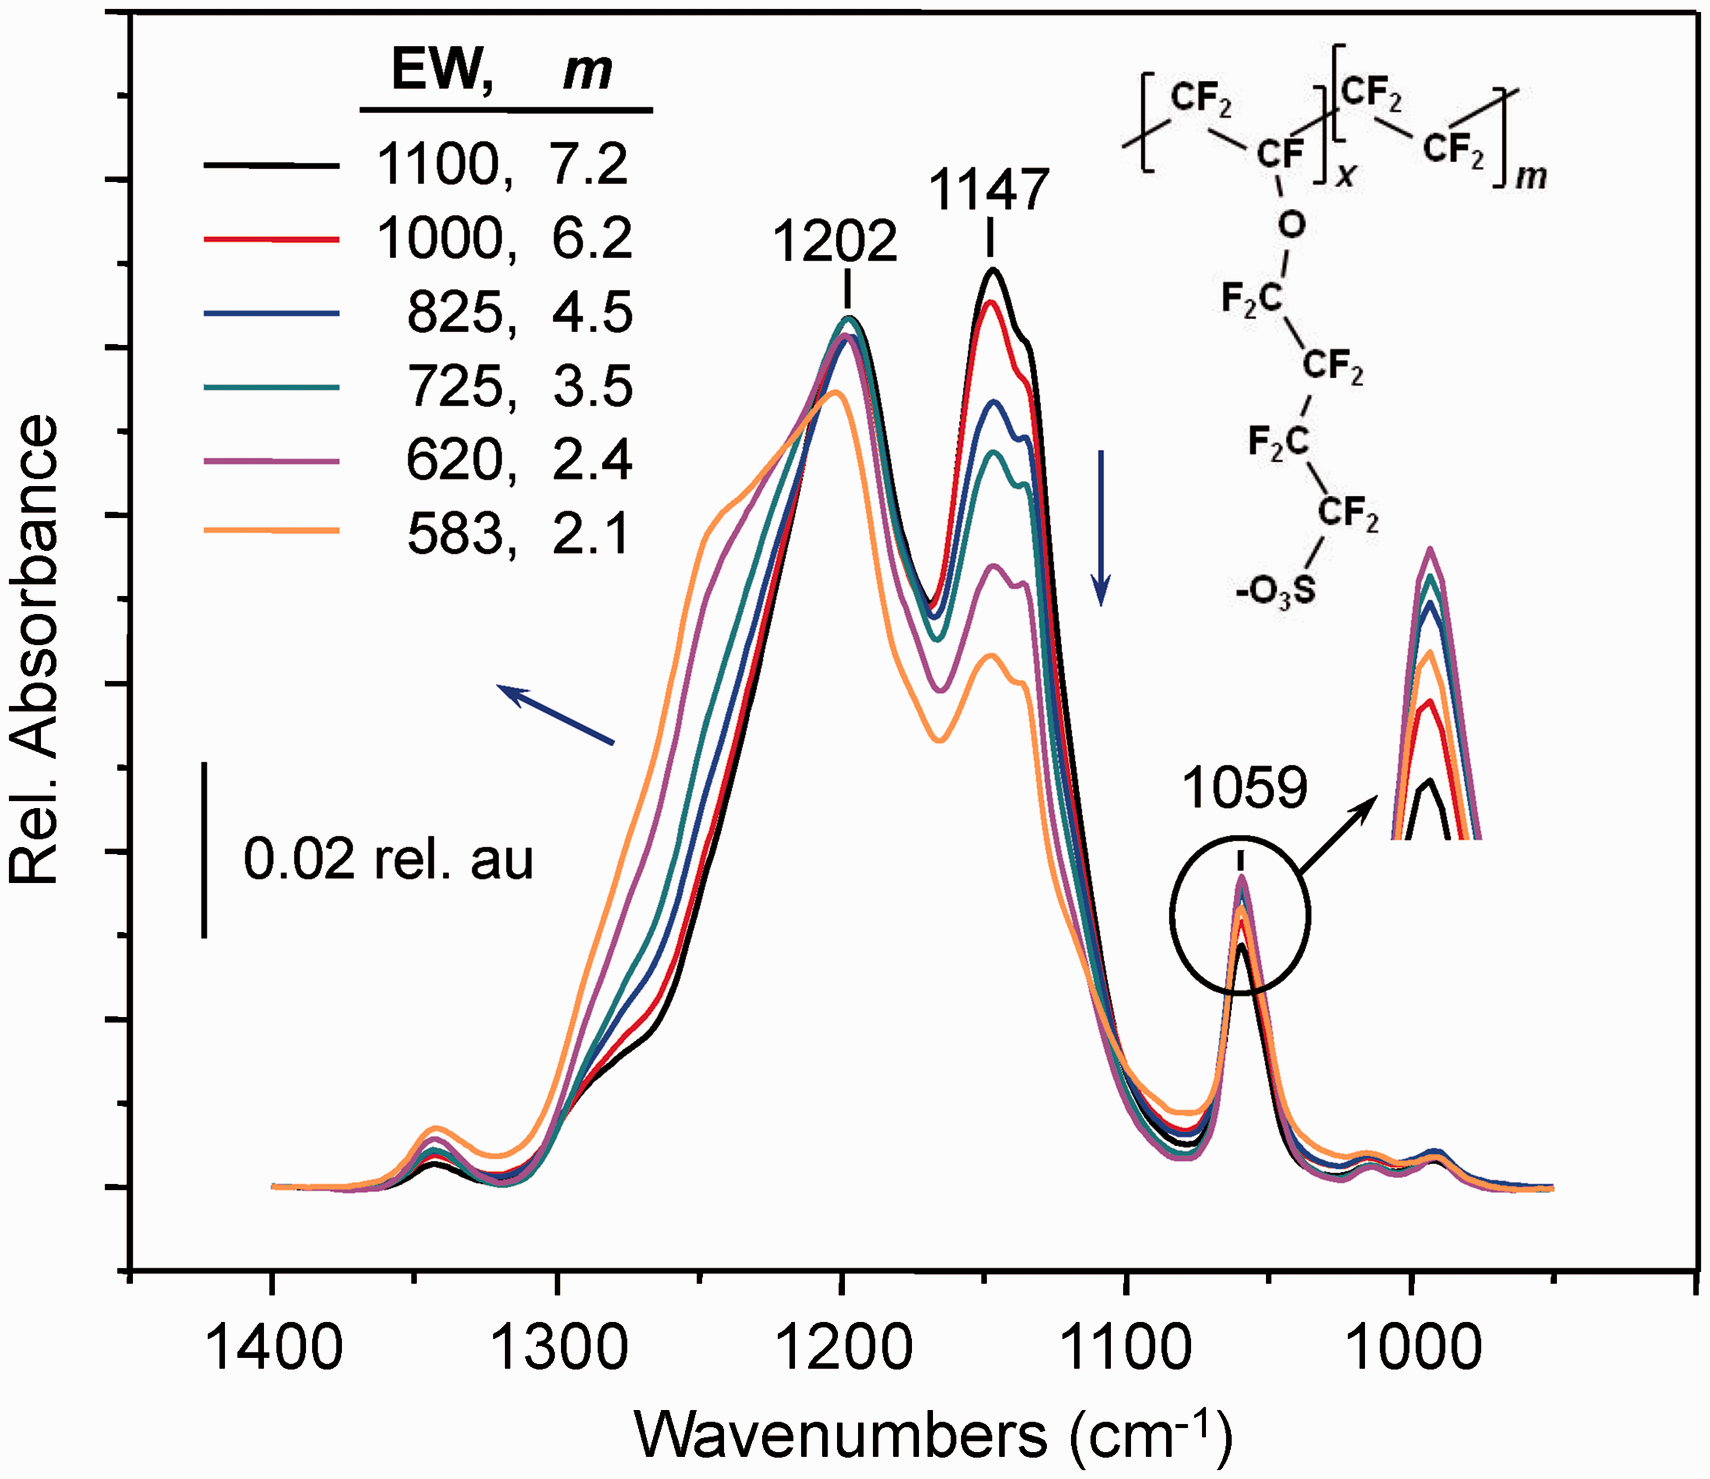
The band at 1059 cm−1 is associated with sulfonate group symmetric S–O stretching 43 and is coupled into the vibration of the ether group in the side chain.47,48 The inset enlarges the region near the peak to enable changes among the samples to be discerned more easily. Except for the 583 EW sample peak, which reaches just below the absorbance maximum of the 620 EW sample, the bands for the other samples display the expected growth in intensity with increasing sulfonate content. A similar trend was observed in separate ATR FT-IR measurements that employed a LaDTGS detector (Fig. S2). The anomalous response for the 583 EW sample is likely due to having a lower density than the others (in contrast to the other membranes, the sample develops the consistency of a gel as it hydrates) together with variation in the pressure applied during conventional ATR FT-IR measurements. 49 In ATR FT-IR microscopy measurements that enable precise, continuous control of the pressure applied between the sample and the ATR crystal during measurements, the feature follows expected trends (vide infra). For both data sets (Figs. 1 and S2), however, the smaller than expected peak intensity near 1059 cm−1 for the 583 EW membrane is compensated by the response between 1400–1100 cm−1. As shown below, spectra of the 583 EW sample are adequate for developing calibration relationships based on peak intensity ratios that include contributions from modes dominated by C–F vibrations.
The spectra in Fig. 1 were used to determine the A’ and B’ constants in the following calibration expression:

To determine A’ and B’ in Eq. 5 from the calibration data in Fig. 1, for each sample (i) in the set, the IC–F/IS–O ratio (Ri) was calculated from the features at 1147 cm−1 (IC–F) and 1059 cm−1 (IS–O). Peak intensities from area-normalized spectra could be used, since the normalization constant is eliminated in the peak ratio. Figure 2 (red points) shows the Ri values derived from the spectra in Fig. 1 plotted versus the associated m (mi) values. The A’ and B’ in Eq. 5 were determined from the slope (Q) and intercept (Ro) values of the least squares fit line to the points. In addition to the spectra in Fig. 1 recorded using the liquid nitrogen cooled MCT detector, Fig. 2 also includes results obtained from spectra recorded using a room temperature LaDTGS detector (Fig. S2). For the two detectors, the sensitivities in the calibration response reflected in the slopes of the least squares fit lines in Fig. 2 are nearly the same.
Calibration relationship for 3M materials derived from the ATR FT-IR spectra in Figs. 1 and S2. The ratio (R) of peak absorbance intensities near 1147 cm−1 (IC–F) and 1060 cm−1 (IS–O) are plotted versus m (Scheme 1 and inset structure). The included lines show the linear least squares fit to each data set. As indicated, spectra were recorded using an MCT (red line and symbols, Q = 0.365, Ro = 1.113 [in Eq. 5: A’ = −2.10, B’ = 2.75]) or LaDTGS (blue line and symbols, Q = 0.392, Ro = 0.766 [in Eq. 5: A’ = −0.95, B’ = 2.55]) detector. See text for further details.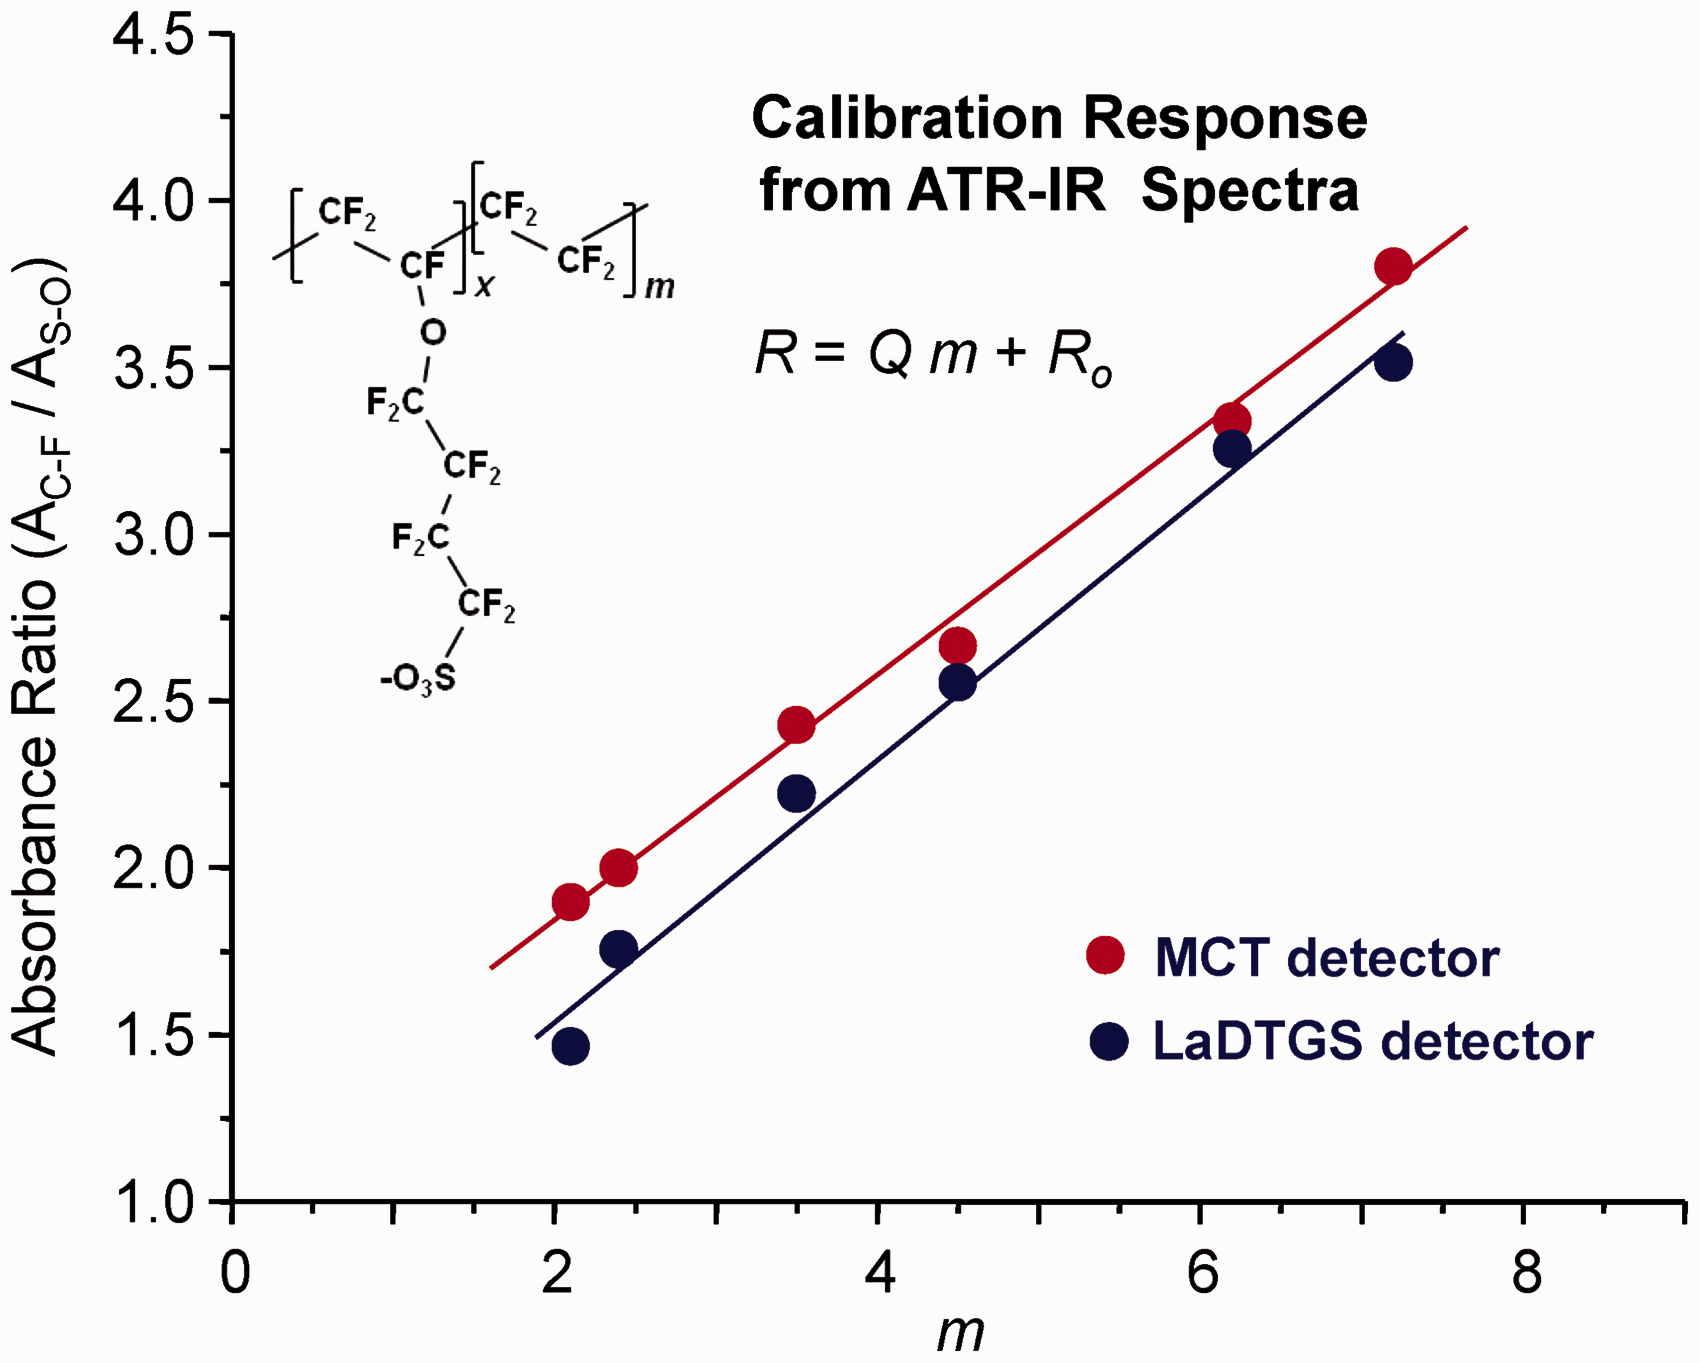
3M ionomer membrane EW predictions from conventional ATR FT-IR spectra.
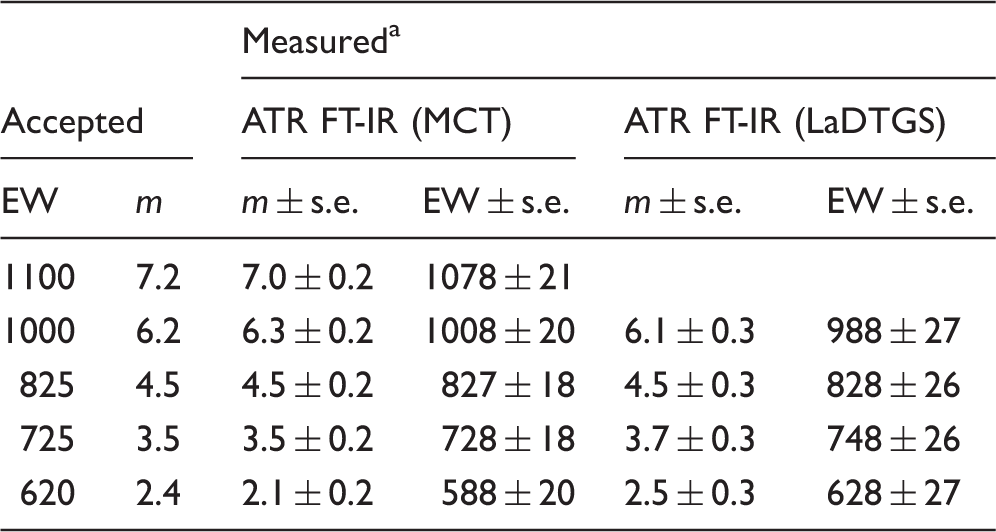
s.e. = standard error of prediction
A similar approach to the analysis of Raman data was explored using spectra from a set of PFSI membranes (Fig. 3). Since the PFSI samples were too small to fill the aperture of the conventional ATR optics used to record the IR spectra in Figs. 1 and S2, confocal Raman microscopy measurements were attempted. In the Raman spectra, bands characteristic of C–F stretching in TFE-rich segments of ionomer are prominent. The area-normalized spectrum of PTFE, plotted on a reduced scale in Fig. 3, has a dominant band at 733 cm−1 and three weaker features in the 1200–1400 cm−1 range. These features, associated with C–F stretching vibrations of the linear PTFE polymer,
50
are evident in the spectra of the ionomer samples. From the overlaid PFSI ionomer spectra in Fig. 3, a drop in intensity at 733 cm−1 can be discerned as the TFE-to-sulfonyl imide ratio decreases from m = 8.8 to 4.6. Relative to the total Raman scattering across the 1400–500 cm−1 region, the fractional contribution from C–F vibrations decreases monotonically with m. Although smaller, similar spectral intensity changes are also evident in the TFE-associated peaks near 1383 cm−1. In contrast, features of vibrations centered on the sulfonyl imide group,
51
for example at 1137 cm−1 and 1236 cm−1 (Fig. 3, red arrows), display the opposite trend and increase from m = 8.8 to 4.6.
Raman spectra of PTFE (bottom) and PFSI ionomer (above) recorded with a confocal Raman microscope. The spectra were baseline corrected and normalized to the total scattering in the range of 500–1425 cm−1. The red arrows indicate growth in the peaks due to sulfonyl imide chromophore vibrations near 1236 cm−1 and 1137 cm−1 as EW decreases. The blue arrow indicates the corresponding decrease in the 1383 cm−1 feature associated with fluoropolymer backbone vibrations. Insets highlight peak intensity changes near 1383 cm−1 and 733 cm−1. The inset plot shows the relationship between scattering intensity and the parameterized sulfonyl imide-to-TFE ratio (1/m’) for the sulfonyl imide chromophore peaks near 1236 cm−1 and 1137 cm−1 for common A (0.78) and B (0.61) (Eq. 6). Relative to the ionomer spectra, the y-axis of the PTFE spectrum was scaled by one-third for clarity.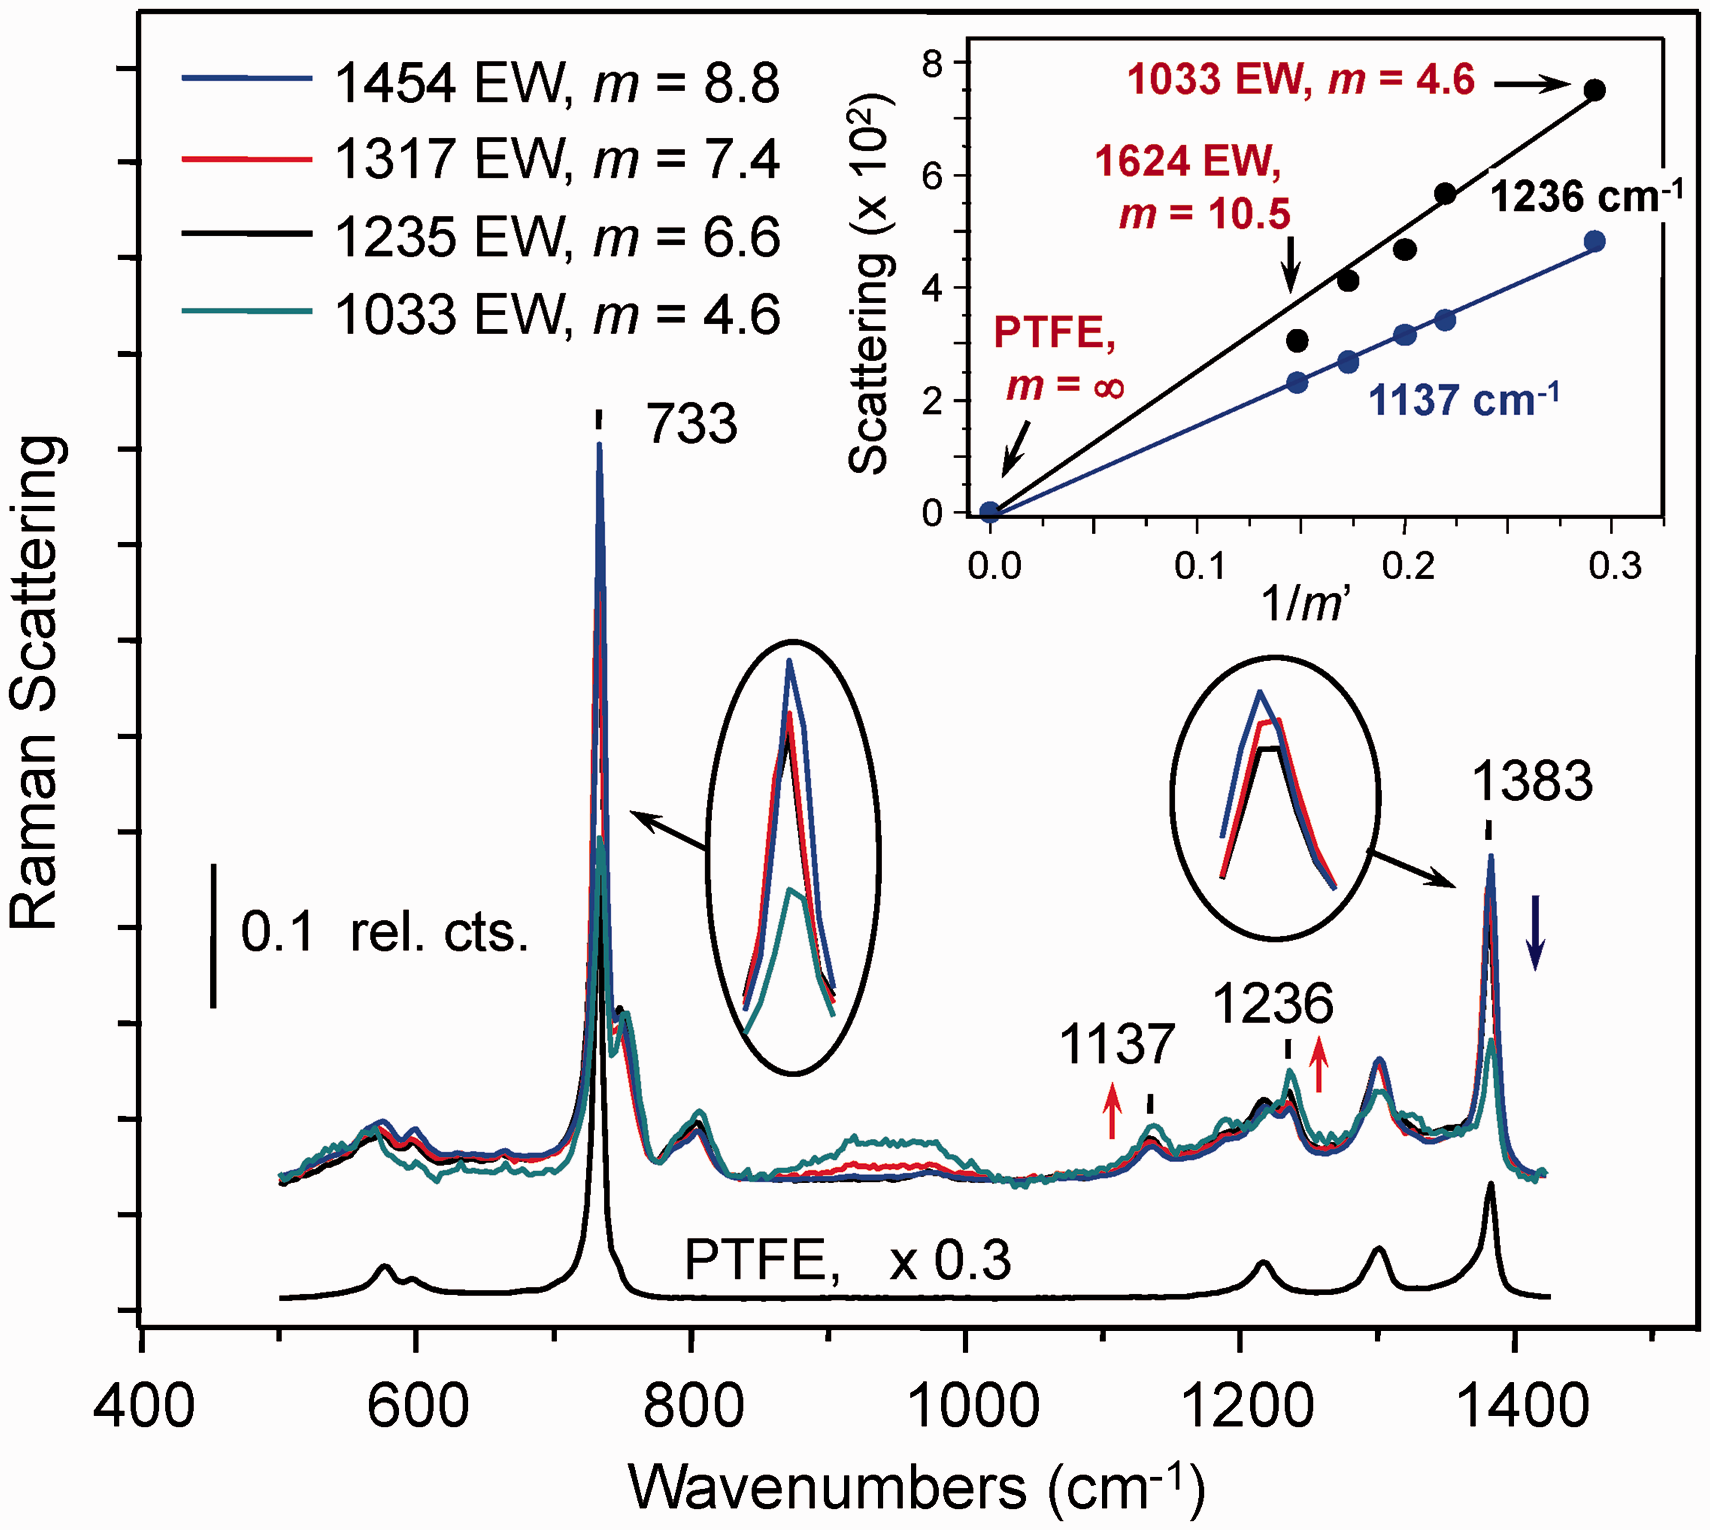

PFSI ionomer membrane EW predictions from confocal Raman spectra.

90% confidence intervals (CI) were evaluated using t = 2.353 appropriate to the (5 – 2) = 3 degrees of freedom available for prediction.
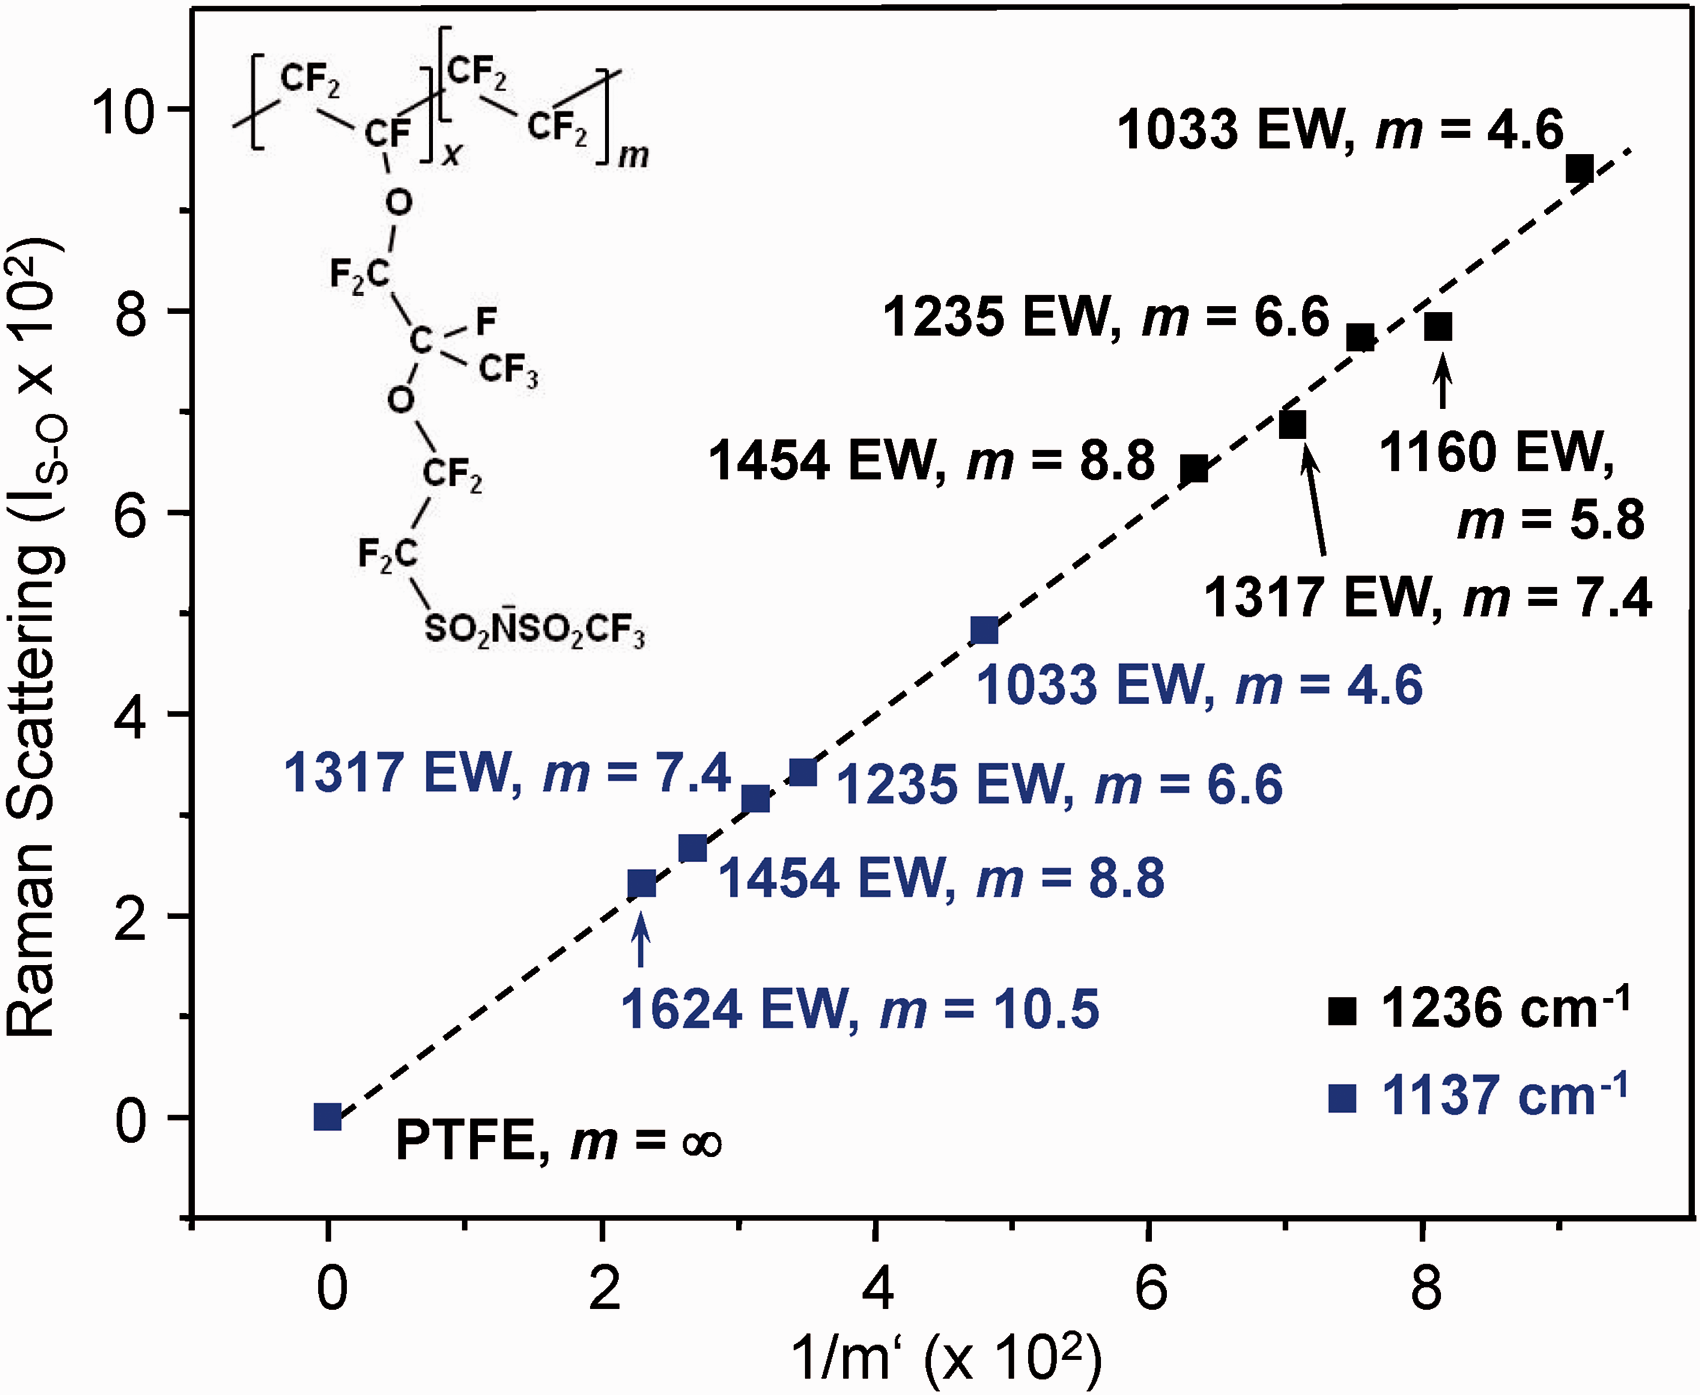
Plot of the area-normalized scattering (IS–O’) from Raman spectra of PFSI samples (Fig. 3) at 1236 cm−1 (black symbols) and 1137 cm−1 (blue symbols) as a function of the parameterized sulfonyl imide-to-TFE ratio (1/mi’). The dashed line intercepts the origin and has unit slope. From Eq. 6, A = 5.59 and B = 1.16 (1236 cm−1 data set) and A = 2.62 and B = 3.97 (1137 cm−1 data set).
Columns 5 and 6 in Table 2 report predictions obtained by applying the calibration relationship developed from the 1137 cm−1 data in Fig. 4 to Raman spectra of samples collected independently of the calibration set. The approach, based on Eq. 6, improved the closeness of the predicted and accepted values and greatly reduced prediction uncertainties relative to the analysis of peak ratios (Table 1). For the latter method, the standard errors are given in Table 1. In contrast, errors evaluated at the 90% confidence level for analyses based on plots of I
The Fig. 3 inset shows the scattering intensity of the 1137 cm−1 and 1236 cm−1 peaks plotted as a function of 1/m’ for common A and B constants. The slopes of the lines in the plot reflect the different scattering cross-sections at the two energies. Results for the high TFE content 1624 EW (m = 10.5) sample are included in the plot to indicate the point where loss in sensitivity toward the sulfonyl imide group becomes significant. A low signal-to-noise (S/N) ratio at 1137 cm−1 for the material and the development of nonlinearity at 1236 cm−1 made it necessary to exclude data for the 1624 EW membrane from the development of calibration relationships.
Raman measurements of the fluorinated samples investigated were somewhat limited by the characteristics of the optical filter used to reject Rayleigh scattered light in the spectrometer. With a cutoff near 500 cm−1, the filter added complication to baseline correction and affected precision in the integration of the dominant Raman band at 733 cm−1, associated with CF2 stretching modes centered on the ionomer backbone.27,50 It is possible that access to the low frequency spectral range may improve detection of spectral variation among the 620 EW and 583 EW 3M samples and enable further reductions in Raman measurement uncertainty. The Rayleigh line filter can be easily replaced with an optical filter that has a spectral cutoff well below 500 cm−1. We anticipate upgrading the filter will improve precision in future quantitative characterizations of fluorinated ionomer materials.
A preliminary investigation of the performance of ATR FT-IR microscopy for ionomer m and EW determinations was also carried out. For 3M materials, spectra recorded with the IR microscope (Fig. S3) showed trends similar to those in Figs. 1 and S2. At 1060 cm−1, the expected intensity gain with increasing membrane ion exchange capacity is observed in the IR microscope spectra across the full data set, including the 583 EW sample. The improved response relative to the conventionally recorded ATR FT-IR spectra likely reflects the ability to control sample-ATR crystal pressure in IR microscope measurements. Figure 5 shows the calibration relationship derived from Eq. 2 and IR microscope spectra of the 3M samples, including a PFTE blank. The linear least squares fit equation for the plot predicted m = 6.3 ± 0.3 (EW = 1008 ± 33), m = 4.5 ± 0.3 (EW = 828 ± 25) and m = 2.2 ± 0.2 (EW = 598 ± 17) from spectra recorded independently of the calibration set for the respective 1000 EW, 825 EW, and 620 EW samples. The uncertainties reported were evaluated at the 90% confidence level for t = 2.015 appropriate to the 7–2 = 5 degrees of freedom available for prediction.
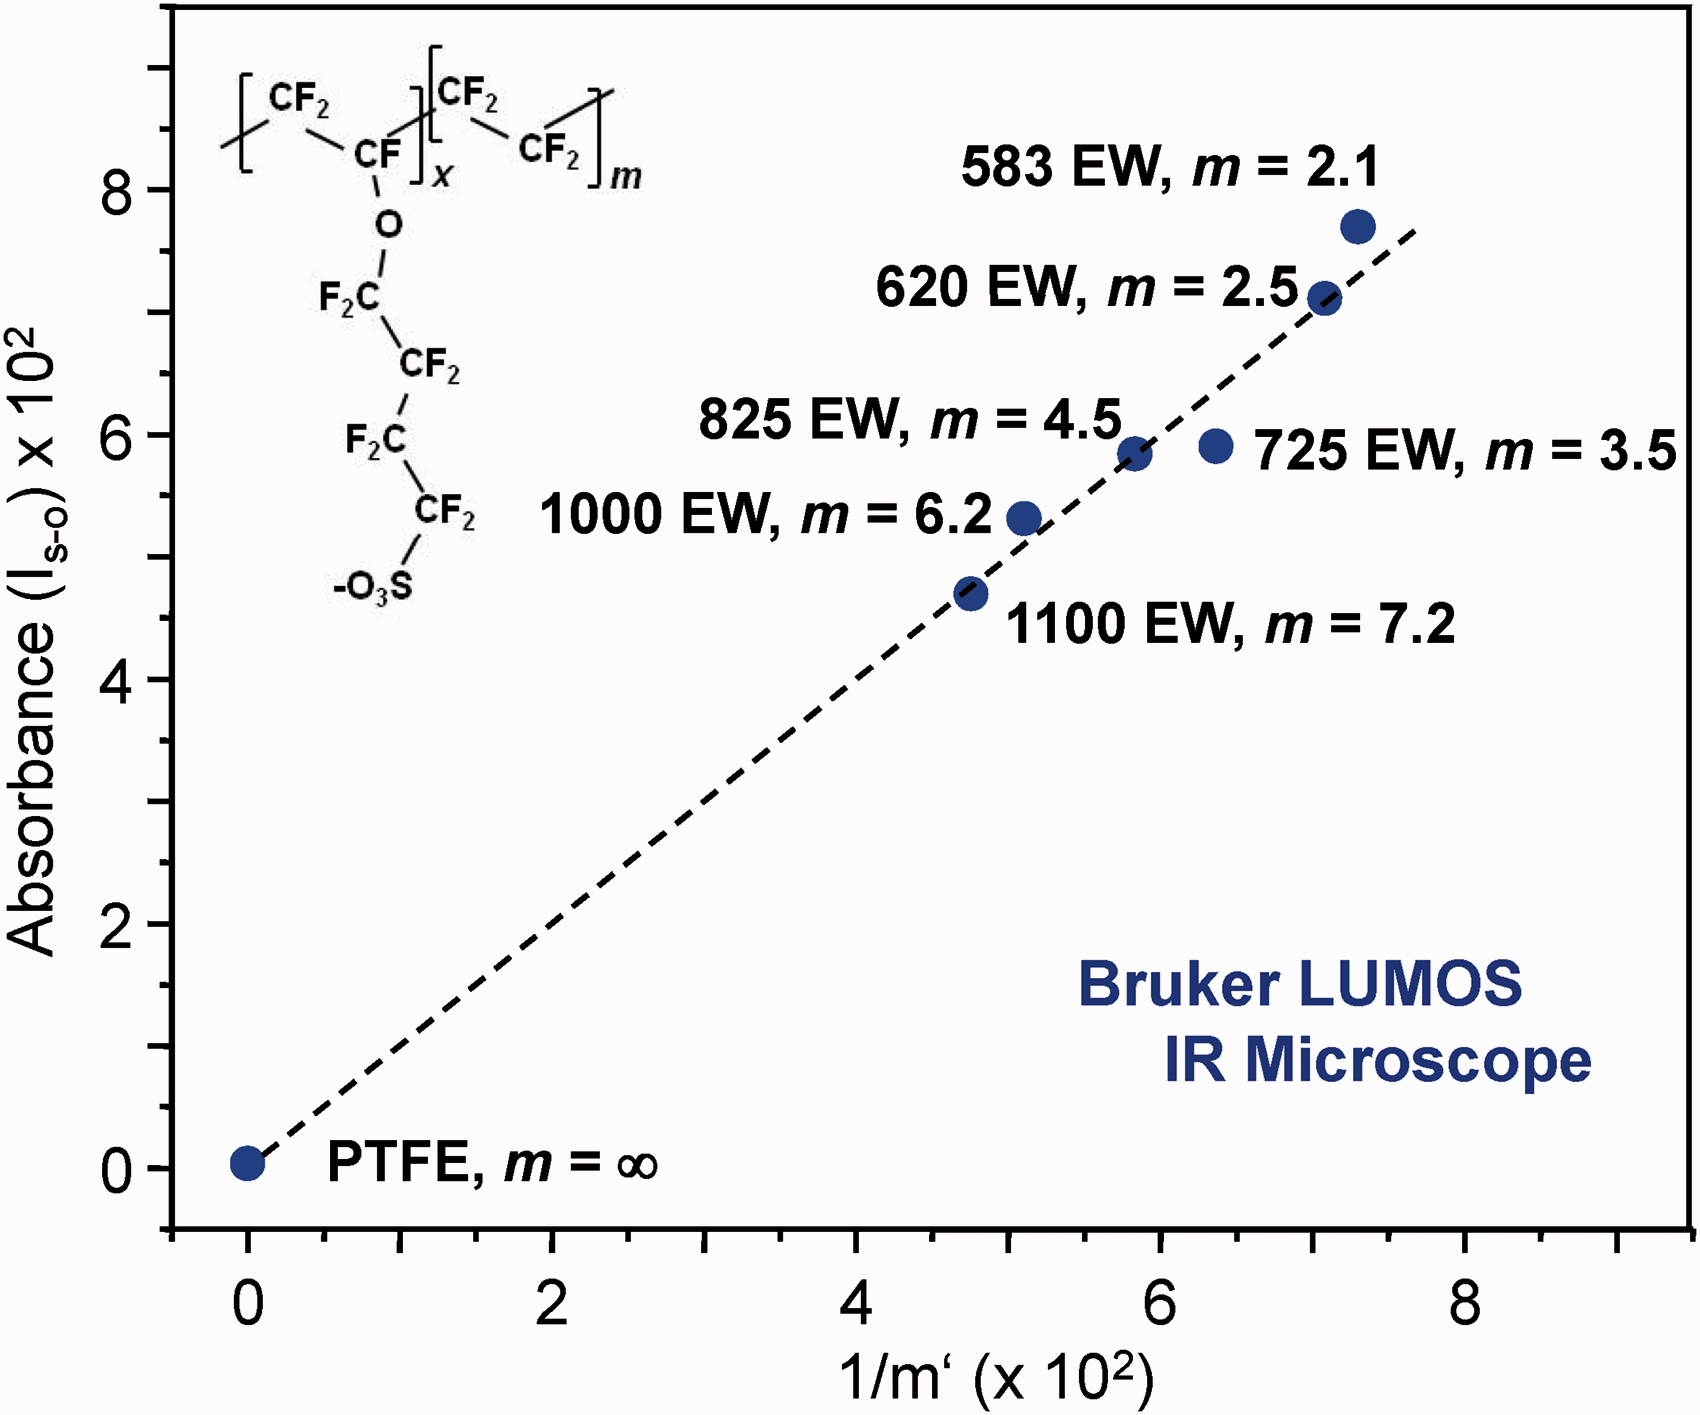
Figure 6 shows IR microscope spectra of PFSI standards. The most effective calibration models could be developed from the pair of features at 1344 cm−1 and 1321 cm−1, associated with respective in-phase and out-of-phase anti-symmetric S=O stretching motion within the sulfonyl imide group.30,51 Evaluating IS–O’ at 1344 cm−1, the equation for the least squares fit line obtained from Eq. 2 led to predictions of m = 6.3 ± 0.3 (EW = 1205 ± 31) and m = 4.3 ± 0.2 (EW = 1005 ± 19), respectively, from independently recorded spectra of the 1235 EW and 1033 EW PFSI samples. Again, the uncertainties were calculated at the 90% confidence level, as described in Table 2 (see footnote b).
Infrared spectra of PFSI ionomer sampled with the Ge ATR probe of a Bruker LUMOS infrared microscope. The spectra shown were baseline corrected and normalized to the area between 1020–1400 cm−1. The inset highlights intensity change in the pair of peaks at 1344 and 1321 cm−1 associated with S=O stretching vibrations of the sulfonyl imide group.
30
The spectrum of the 1317 EW (m = 7.4) sample was omitted from the full plot for clarity, but is included (bright green) in the enlargement of the 1344–1321 cm−1 region on the inset.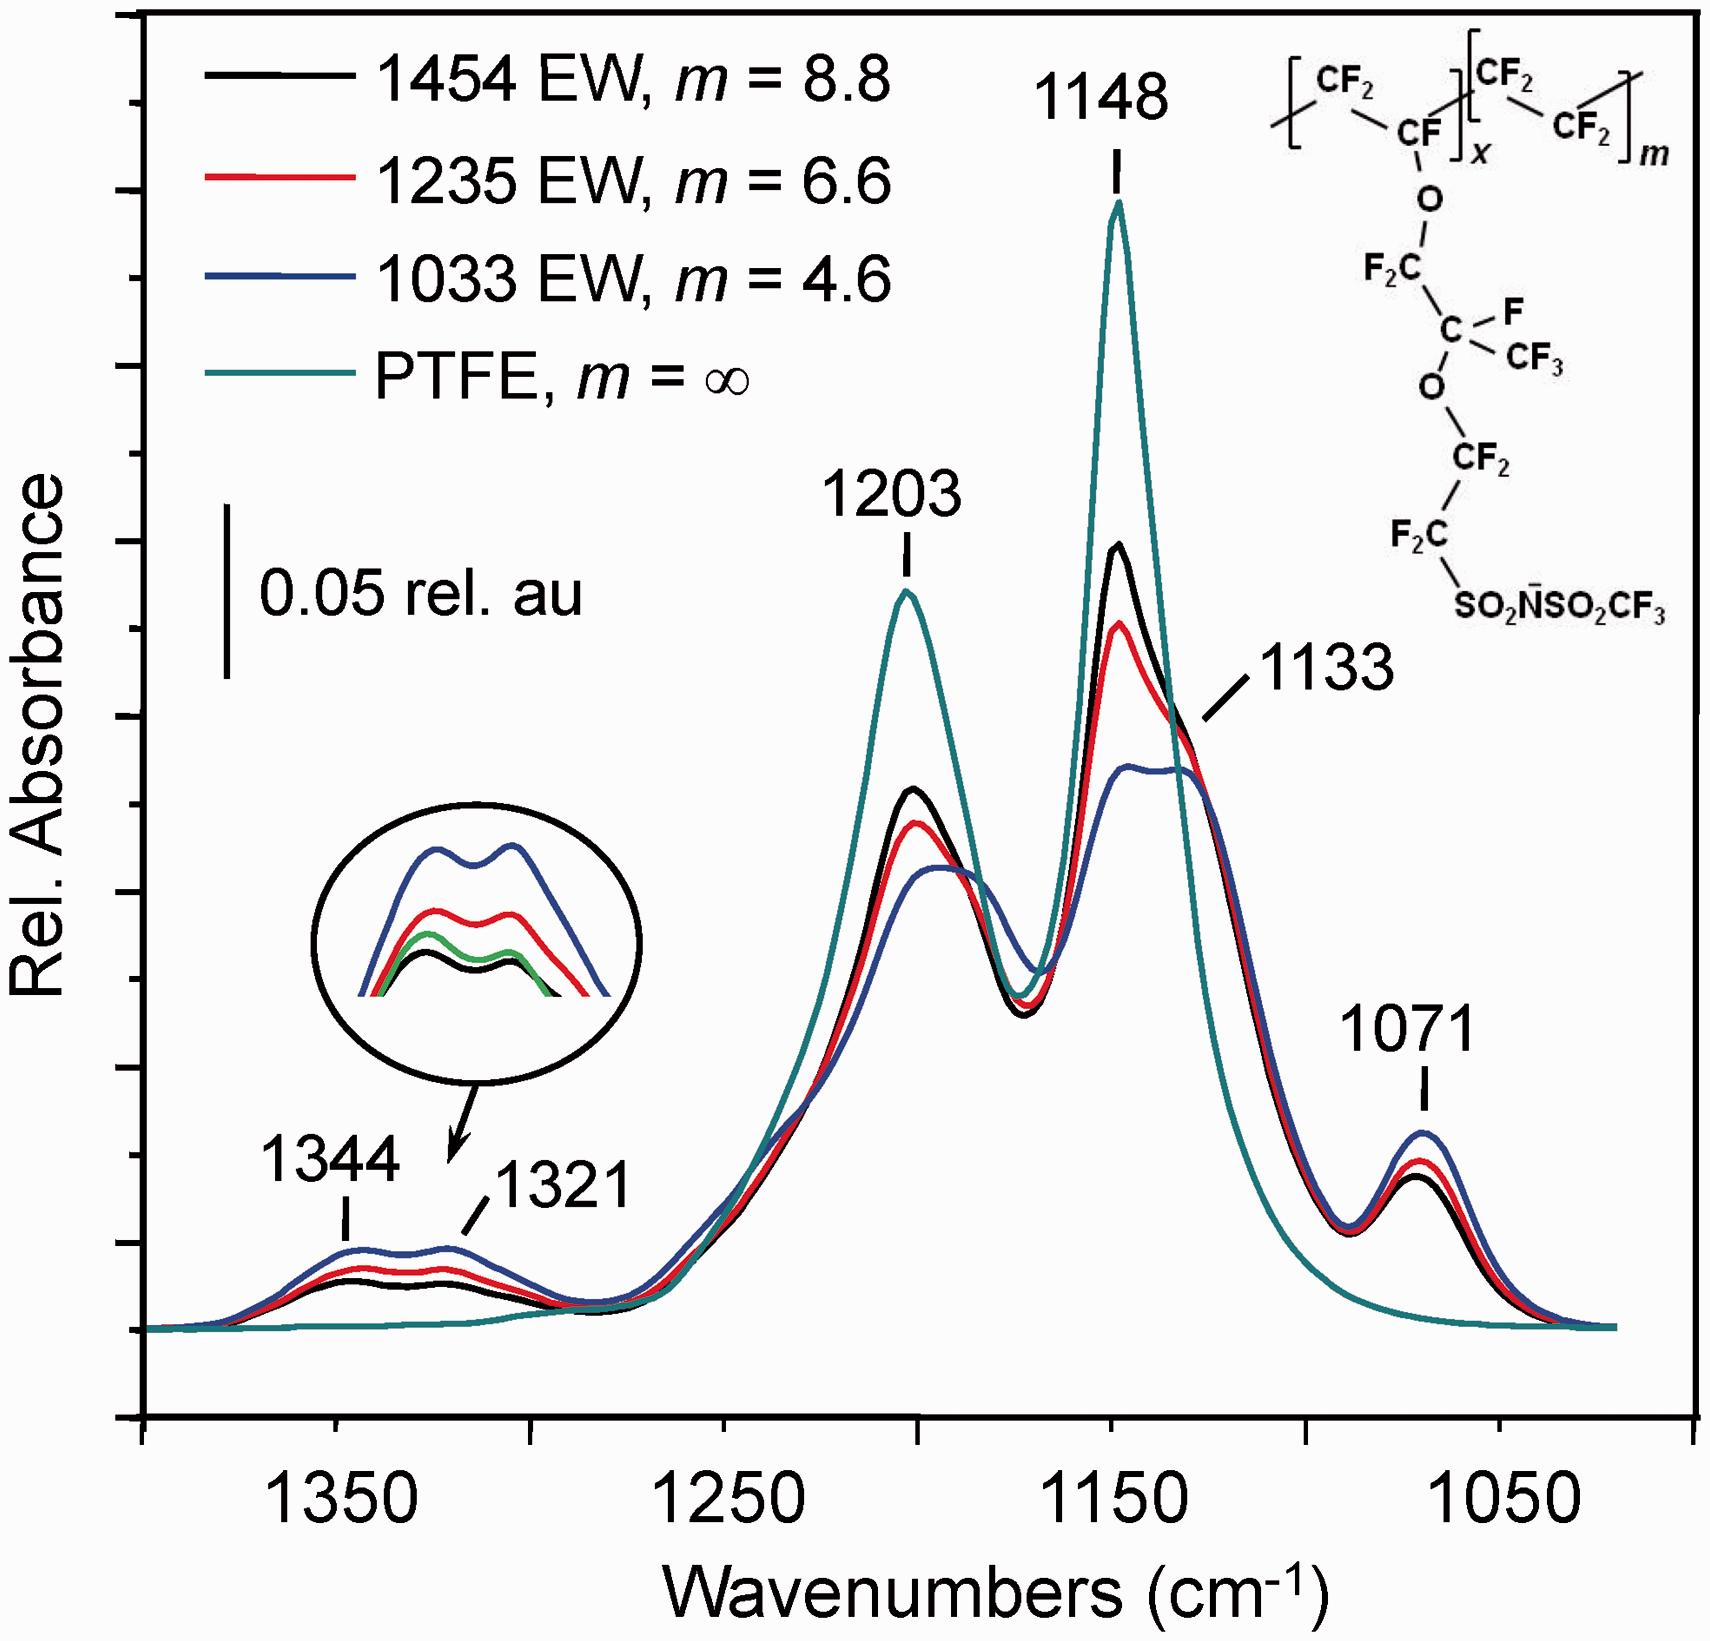
In future studies, further exploration of quantitative IR microscopy applications will be emphasized. In principle, the small sample requirements together with the high S/N ratio and precision control of sample-ATR crystal pressure afforded by the instrumentation make IR microscopy attractive for quantitative characterization and mapping of ionomer membrane structure and properties. An issue that should be understood better concerns differences in band shape that can be present in ATR FT-IR spectra recorded with conventional versus IR microscope techniques. We expect the differences evident in Figs. 1 and S3 can be traced to varying effects of optical dispersion in measurements with ZnSe versus Ge ATR crystals and the large spread of incidence angles at the Ge/sample interface resulting from the high numerical aperture of the microscope objective. Studies that scrutinize effects of IR beam divergence and material optical properties on spectral band shapes are needed to gain further insights and would have value in broader applications of IR microscope measurements to membranes and thin films. 57
Conclusion
In summary, the results presented advance noninvasive strategies for determining ionomer ionizable group content and provide an incentive for further investigation of these materials. The confocal Raman and ATR FT-IR microscopy techniques adapted outperformed the conventional ATR FT-IR method in achieving low prediction errors. The results likely reflect the precision control over sampling volume afforded by the microscope techniques. The latter have the added advantages of small sample requirements and the ability to probe spatially within membranes. More generally, aside from membrane ionizable group content, there is the possibility for determining other properties from vibrational spectral data (e.g., membrane mechanical strength
13
), especially when the sample number and range available for calibration are sufficiently large to allow for the use of multivariate calibration methods.41,58–61 Among the benefits, the reported approaches have potential to add direction to synthetic efforts 6,7 and expand options for quantitation when a more conventional titrimetric approach is not possible, such as in in situ studies of membrane systems.27,28
Ionomer materials employed. For all samples, x = 1.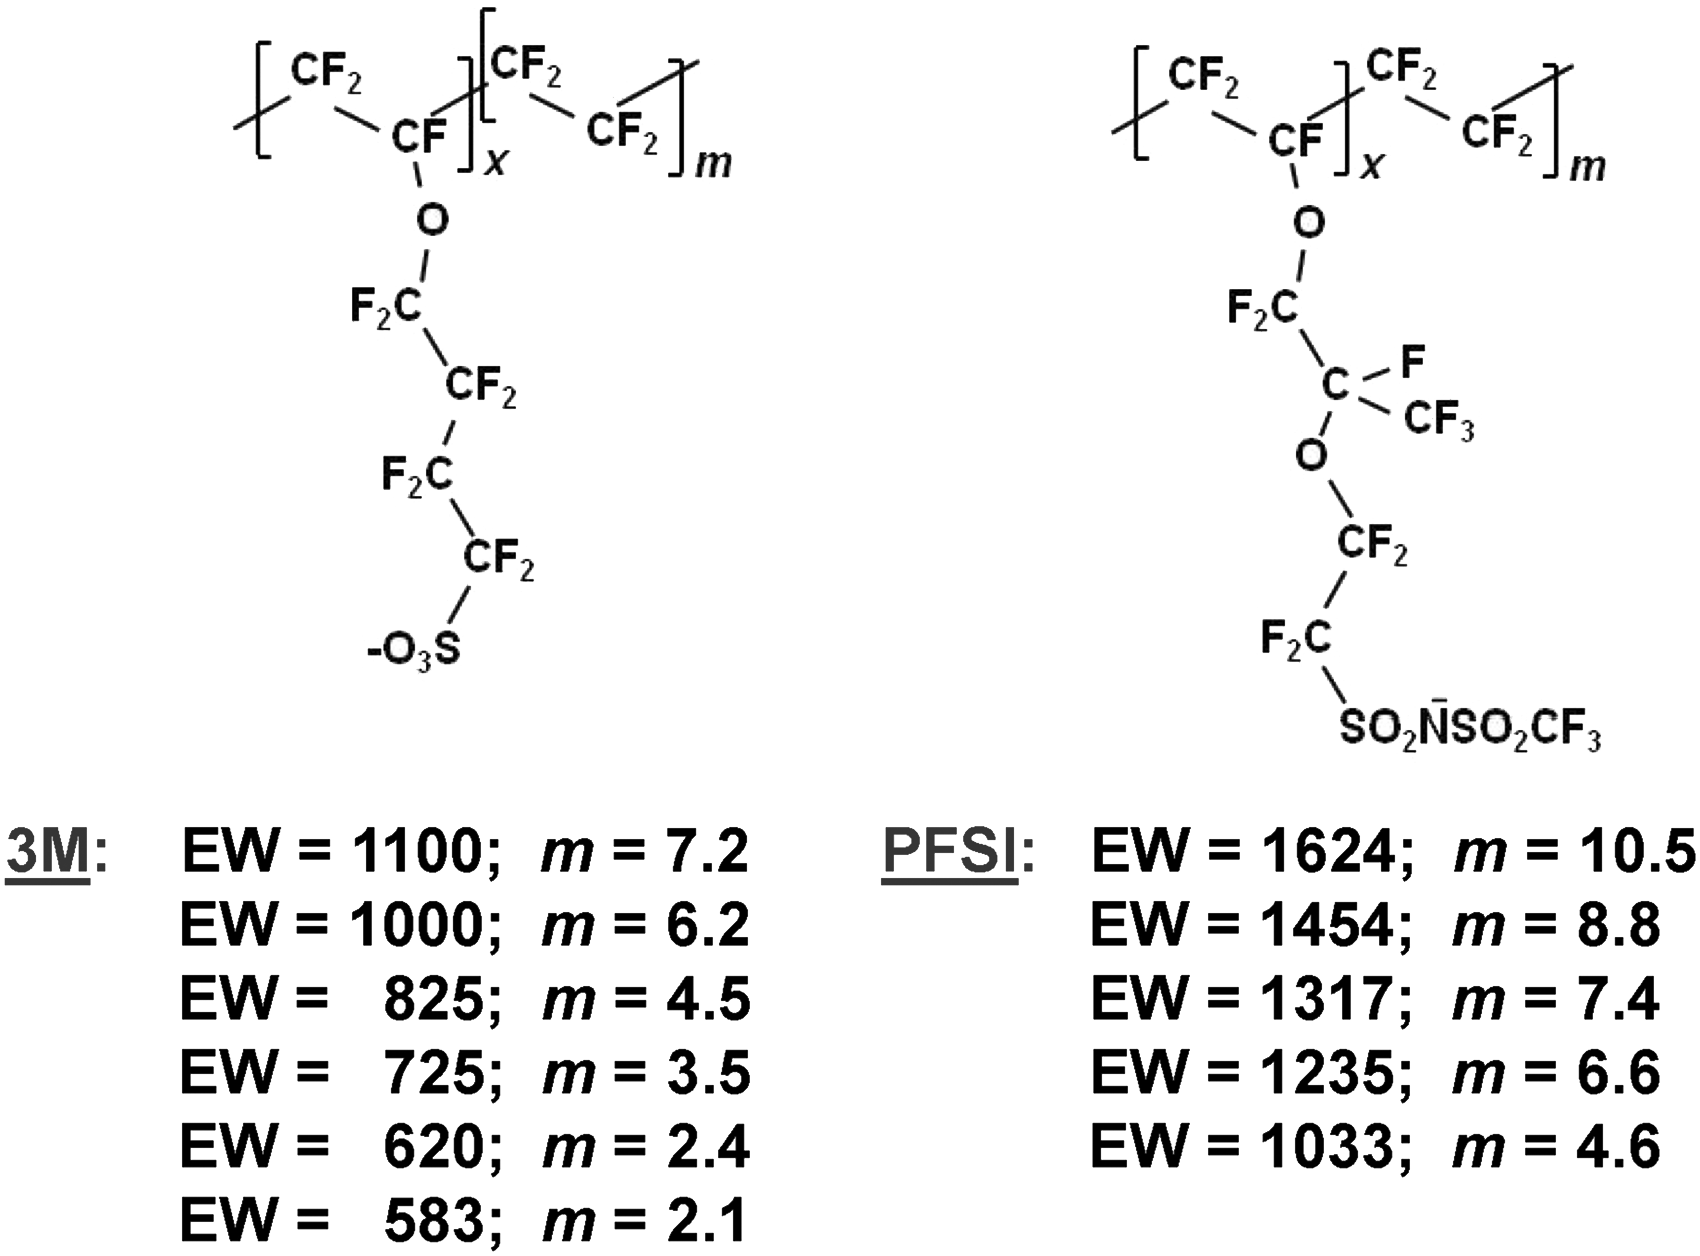
Footnotes
Acknowledgments
The authors are thankful to Tom Tague (Bruker) for enabling experiments on the LUMOS infrared microscope and John Kalivas (Idaho State University) for helpful discussions concerning calibration and evaluation of uncertainties. The suggestion of a reviewer that brought to light the importance of considering fluoropolymer crystalline structure is also gratefully acknowledged.
Conflict of Interest
The authors declare that there is no conflict of interest.
Funding
This work was supported in part by the U.S. Department of Energy under Grant DE-FG03-93ER14333. C.K. gratefully acknowledges support from the Texas Tech University faculty development leave program.
Supplemental Material
Supplemental material mentioned in the text, including poly(tetrafluoroethylene) ATR FT-IR spectra, ATR FT-IR spectra of 3M samples recorded with an LaDTGS detector, and infrared microscope spectra of 3M ionomer materials, is available in the online edition of the journal.
References
Supplementary Material
Please find the following supplemental material available below.
For Open Access articles published under a Creative Commons License, all supplemental material carries the same license as the article it is associated with.
For non-Open Access articles published, all supplemental material carries a non-exclusive license, and permission requests for re-use of supplemental material or any part of supplemental material shall be sent directly to the copyright owner as specified in the copyright notice associated with the article.