
Abstract
Paper aging and degradation are growing concerns for those who are responsible for the conservation of documents, archives, and libraries. In this study, the paper aging was investigated using laser-induced fluorescence spectroscopy (LIFS), where the fluorescence properties of 47 paper samples with different ages were explored. The paper exhibits fluorescence in the blue-green spectral region with two peaks at about 448 nm and 480 nm under the excitation of 405 nm laser. Both fluorescence peaks changed in absolute intensities and thus the ratio of peak intensities was also influenced with the increasing ages. By applying principal component analysis (PCA) and k-means clustering algorithm, all 47 paper samples were classified into nine groups based on the differences in paper age. Then the first-derivative fluorescence spectral curves were proposed to figure out the relationship between the spectral characteristic and the paper age, and two quantitative models were established based on the changes of first-derivative spectral peak at 443 nm, where one is an exponential fitting curve with an R-squared value of 0.99 and another is a linear fitting curve with an R-squared value of 0.88. The results demonstrated that the combination of fluorescence spectroscopy and PCA can be used for the classification of paper samples with different ages. Moreover, the first-derivative fluorescence spectral curves can be used to quantitatively evaluate the age-related changes of paper samples.
Keywords
Introduction
Papermaking, one of the four great inventions in ancient China, has greatly helped the spread of literature and literacy all over the world. Paper was invented in the early second century BC and has been widely used for writing from ancient times up to now. Originally, paper was made by beating wet hemp to a pulp, and later, tree bark, bamboo, and other plant fibers were commonly used. Therefore, paper is a complicated composite material consisting of plant cellulose and other ingredients (such as fillers, gelatin, and pigments). As the main composition of paper, plant cellulose can be extracted from the plants and wood pulp by using mechanical or chemical methods. It is well-known that the paper will experience a color change from white or faint yellow to brownish-yellow with prolonged conservation expiration, especially for the ancient papers, which is the so-called paper aging or paper degradation. Studies have shown that paper aging is mostly caused by the oxidation of cellulose and the latter developing chromophores (i.e., “aldehydic” chromophores). 1 The cellulose oxidation is a complex process where the oxidizing reaction occurs by the intervention of active oxygen species under the condition of radiation, resulting in the mechanical weakening and paper yellowing. From the optical properties of paper, the cellulose oxidation can cause the formation of a broad absorption band in the ultraviolet visible (UV–Vis) region, Conte et al. employed UV–Vis reflectance spectroscopy to compare the spectral difference of ancient and artificially aged modern papers, demonstrating that the abundance of oxidized functional groups are acting as chromophores and responsible for paper aging. 2 Paper aging is an inevitable process; thus, the preservation of important documents and the protection of ancient documents have been some of the biggest challenges. Nowadays, paper aging has become an interesting research area.
Paper aging influences the mechanical, physical, and chemical properties of paper structure, such as strength, whiteness, and brightness. Based on the intrinsic age-based changes, some techniques have already been utilized to study paper aging. Mechanical testing was the most commonly used method and has exhibited noteworthy performance in the highly sensitive monitoring of paper structure changes. 3 However, mechanical testing is a destructive method and this method requires a fairly large number of paper samples. In recent years, some microdestructive and nondestructive methods have successfully applied to determine the paper degradation, including atomic force microscopy (AFM), 4 enzymatic biosensor, 5 chemiluminescence, 6 attenuated total reflectance Fourier transform infrared (ATR FT-IR) spectroscopy,7,8 UV–Vis reflectance spectroscopy,2,9–11 Raman spectroscopy, 12 hyperspectral imaging, 13 and fluorescence spectroscopy.14,15 Nevertheless, most of these studies about paper aging have only analyzed the characteristics of pure cellulose obtained from the artificially aged papers, while less attention have been paid to the naturally aged modern papers or ancient papers. In addition, few studies have been pursued to study the classification of papers with different ages and the quantitative estimation of paper age-related changes.
Laser-induced fluorescence spectroscopy (LIFS) is a non-invasive method to selectively study the molecular structure of the investigated sample, giving the relation between excitation wavelength and obtained emission spectrum. Due to its simplicity, strong operability, remarkably high sensitivity, and reliability, LIFS has already been an attractive analytical tool applied to various research fields, such as medical diagnostics, food analysis, and agricultural monitoring.16–20 In this work, we have employed LIFS to nondestructively study the optical characteristics of paper structure related to paper aging. When paper begins its degradation process, the oxidation reaction of cellulose makes paper become yellow. If irradiated with UV light, a wavelength shift in the emission spectra and its intensity variations can be clearly observed and detected quantitatively. Fluorescence spectroscopy was implemented to discriminate the paper samples of different ages by incorporating principal component analysis (PCA). Based on the first two principal components (PC1 and PC2), after applying k-means clustering algorithm, all 47 paper samples were classified into nine groups according to the disparity in age. Eventually, the first-derivative fluorescence spectral curves were employed to estimate the age-related changes by establishing a correlation model between the derivative fluorescence spectra and the age of paper samples, where one exponential decaying model and one linear model were established, respectively.
Materials and Methods
Paper Samples
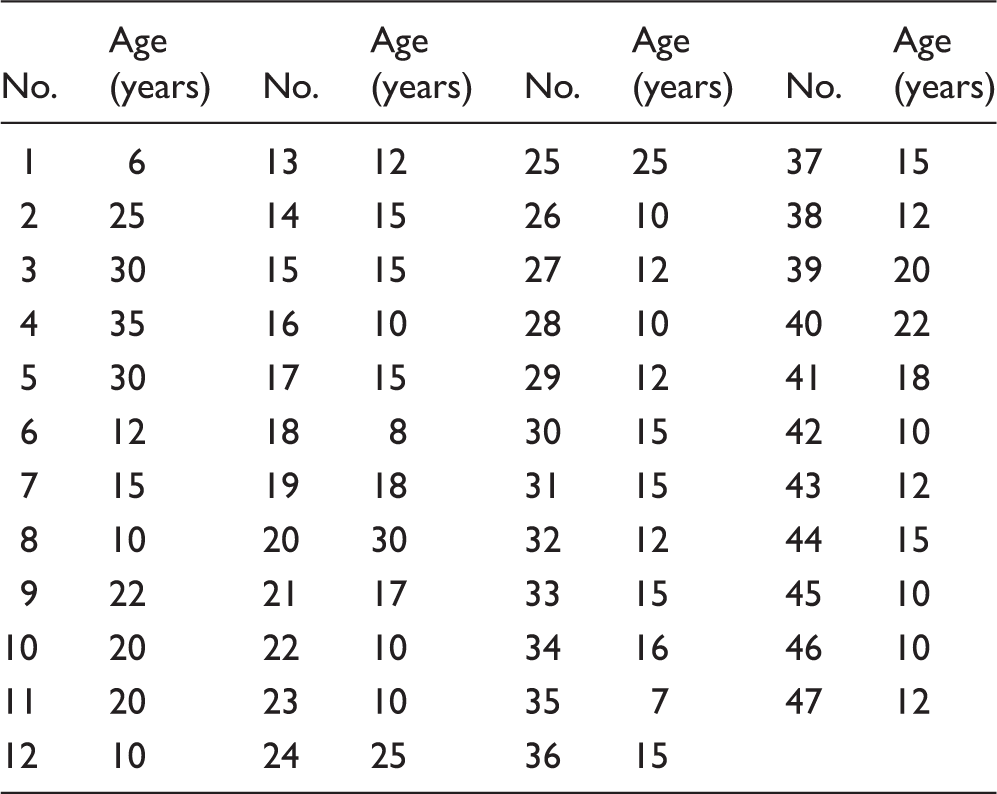
Paper samples used for fluorescence measurement.
Experimental
A schematic drawing of the experimental set-up used for measurements of LIF spectra is shown in Fig. 1. A diode laser with an emission wavelength of 405 nm and an output power of 50 mW was used as an excitation source. The laser was focused on the surface of paper sample, which was placed on a metal plate to minimize the interference of matrix effect. In order to avoid the directly reflected light from the paper sample, which can seriously bury the fluorescence signals, a 45° angle was arranged for the collection of scattering light from samples. The scattered excitation light was further eliminated by using a high-pass filter with a cut-off wavelength of 420 nm, and then the induced fluorescence was focused into the port of a multimode optical fiber with a core diameter of 600 µm. Finally, a portable spectrometer (USB4000, Ocean Optics, USA) was used to acquire the fluorescence signals by transforming the optical signals to electrical signals through the built-in charge-coupled device (CCD), then the data were stored for further analysis. Before measurements, the set-up was calibrated with regard to intensity using a standard lamp (IES 1000, Labsphere, USA) and regarding wavelength using a low-pressure mercury lamp.
Schematic drawing of the experimental set-up used for measurements of LIF spectra.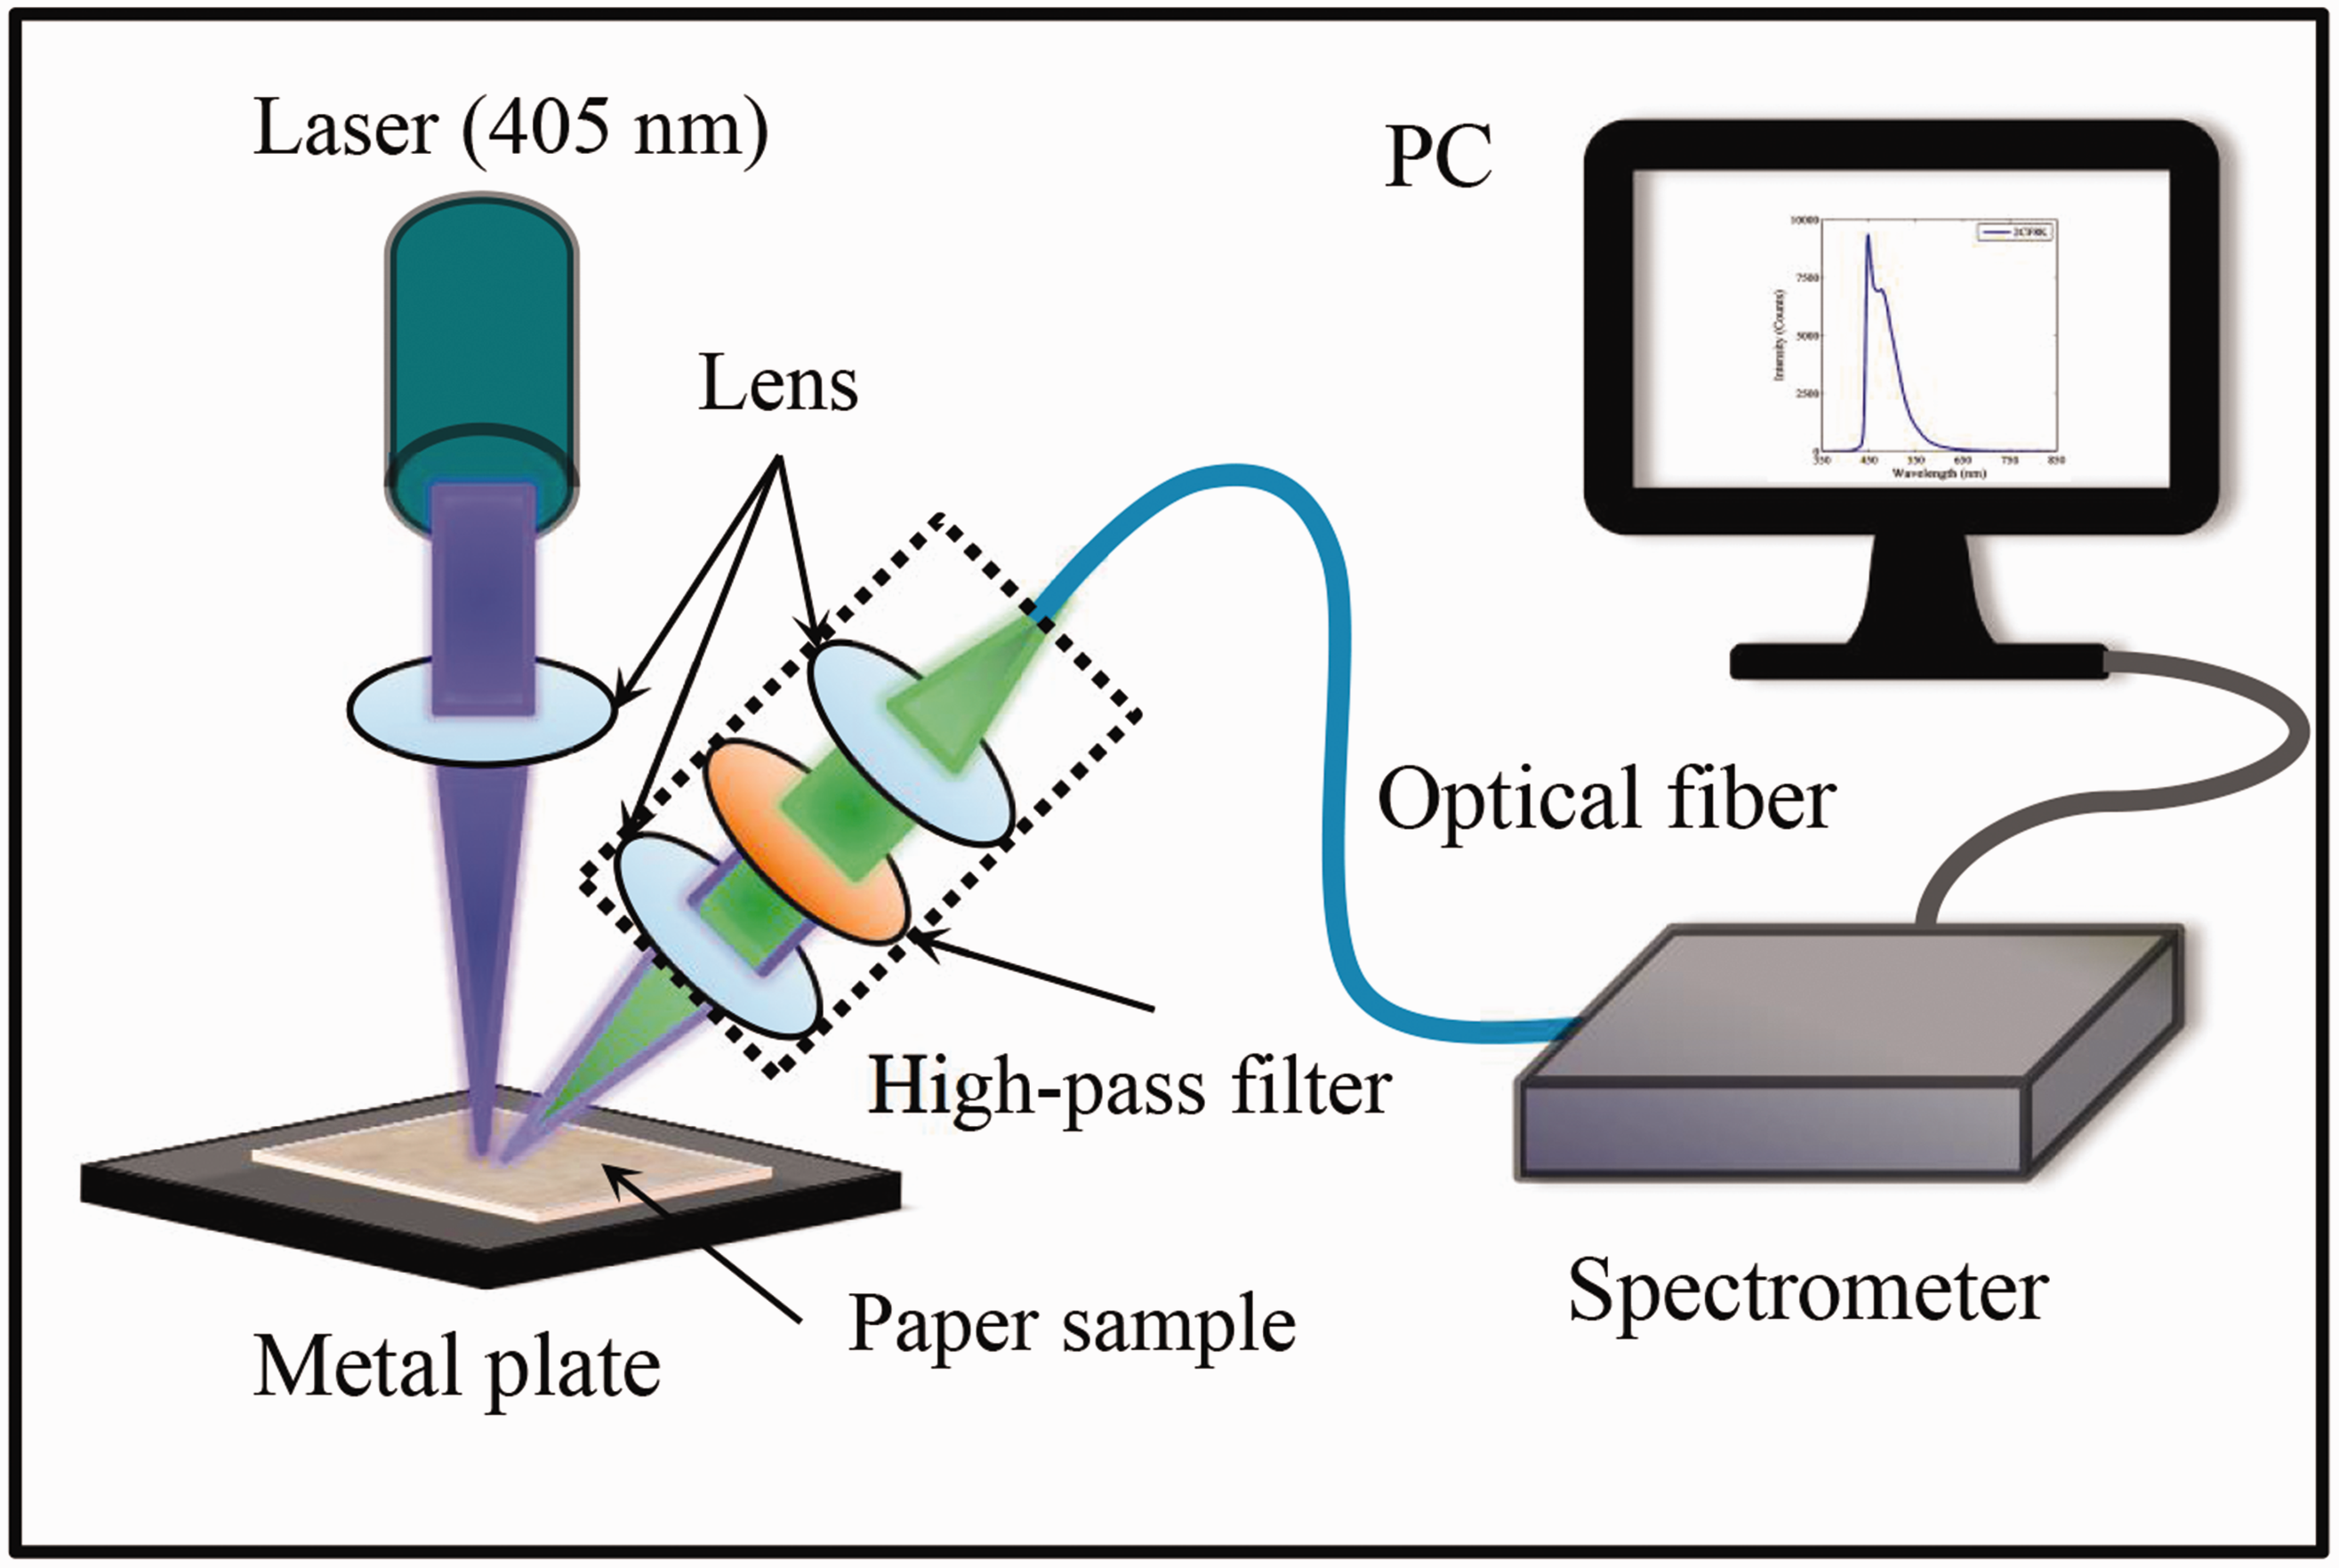
Data Analysis
Principal component analysis is a projection method to reduce the dimensions of the original spectral data matrix with the minimal loss of information by decomposing the data matrix into a structure part and a noise part, which has been widely used for spectral information extraction. In this work, we have used PCA to process the massive amount of fluorescence spectral data, and the details are given below.
Before applying PCA, some pre-processing methods were utilized to optimize the spectral data. First, baseline correction was used to eliminate the baseline drift caused by instrumental noise, optical distance, and measurement environment, which was achieved by fitting the baseline to a polynomial and then subtracting it. 21 Subsequently, the Savitzky–Golay (S-G) smoothing method was employed to remove high-frequency noise from the spectra and improve the signal-to-noise (S/N) ratio, which was based on the principal of the least-square fitting method and realized by fitting successive subsets of adjacent data points with a low-degree polynomial. 22
Considering the recorded fluorescence spectra of N samples, each spectrum has M spectral bands for one measurement, the whole data set can form an N row, M column matrix, which is denoted by XNM. By performing PCA, the data matrix is given by

After that, the k-means clustering algorithm, which uses iterative techniques to group the data set into clusters with the similar characteristics, was adopted for cluster analysis of samples. When combining PCA and k-means clustering, by plotting PC1 against PC2 in a two-dimensional (2D) score plot, the discrimination between different samples can be achieved by recognizing different clusters.
Results and Discussion
Four types of typical paper sample are shown in Fig. 2. As can be seen clearly, the color changes from grayish-white to brownish-yellow, corresponding to the age changes of paper samples from six years to 30 years, which demonstrates that paper color is highly related to the degree of paper aging.
Photographs of four typical paper samples with different ages of 6, 15, 20, and 30 years, respectively.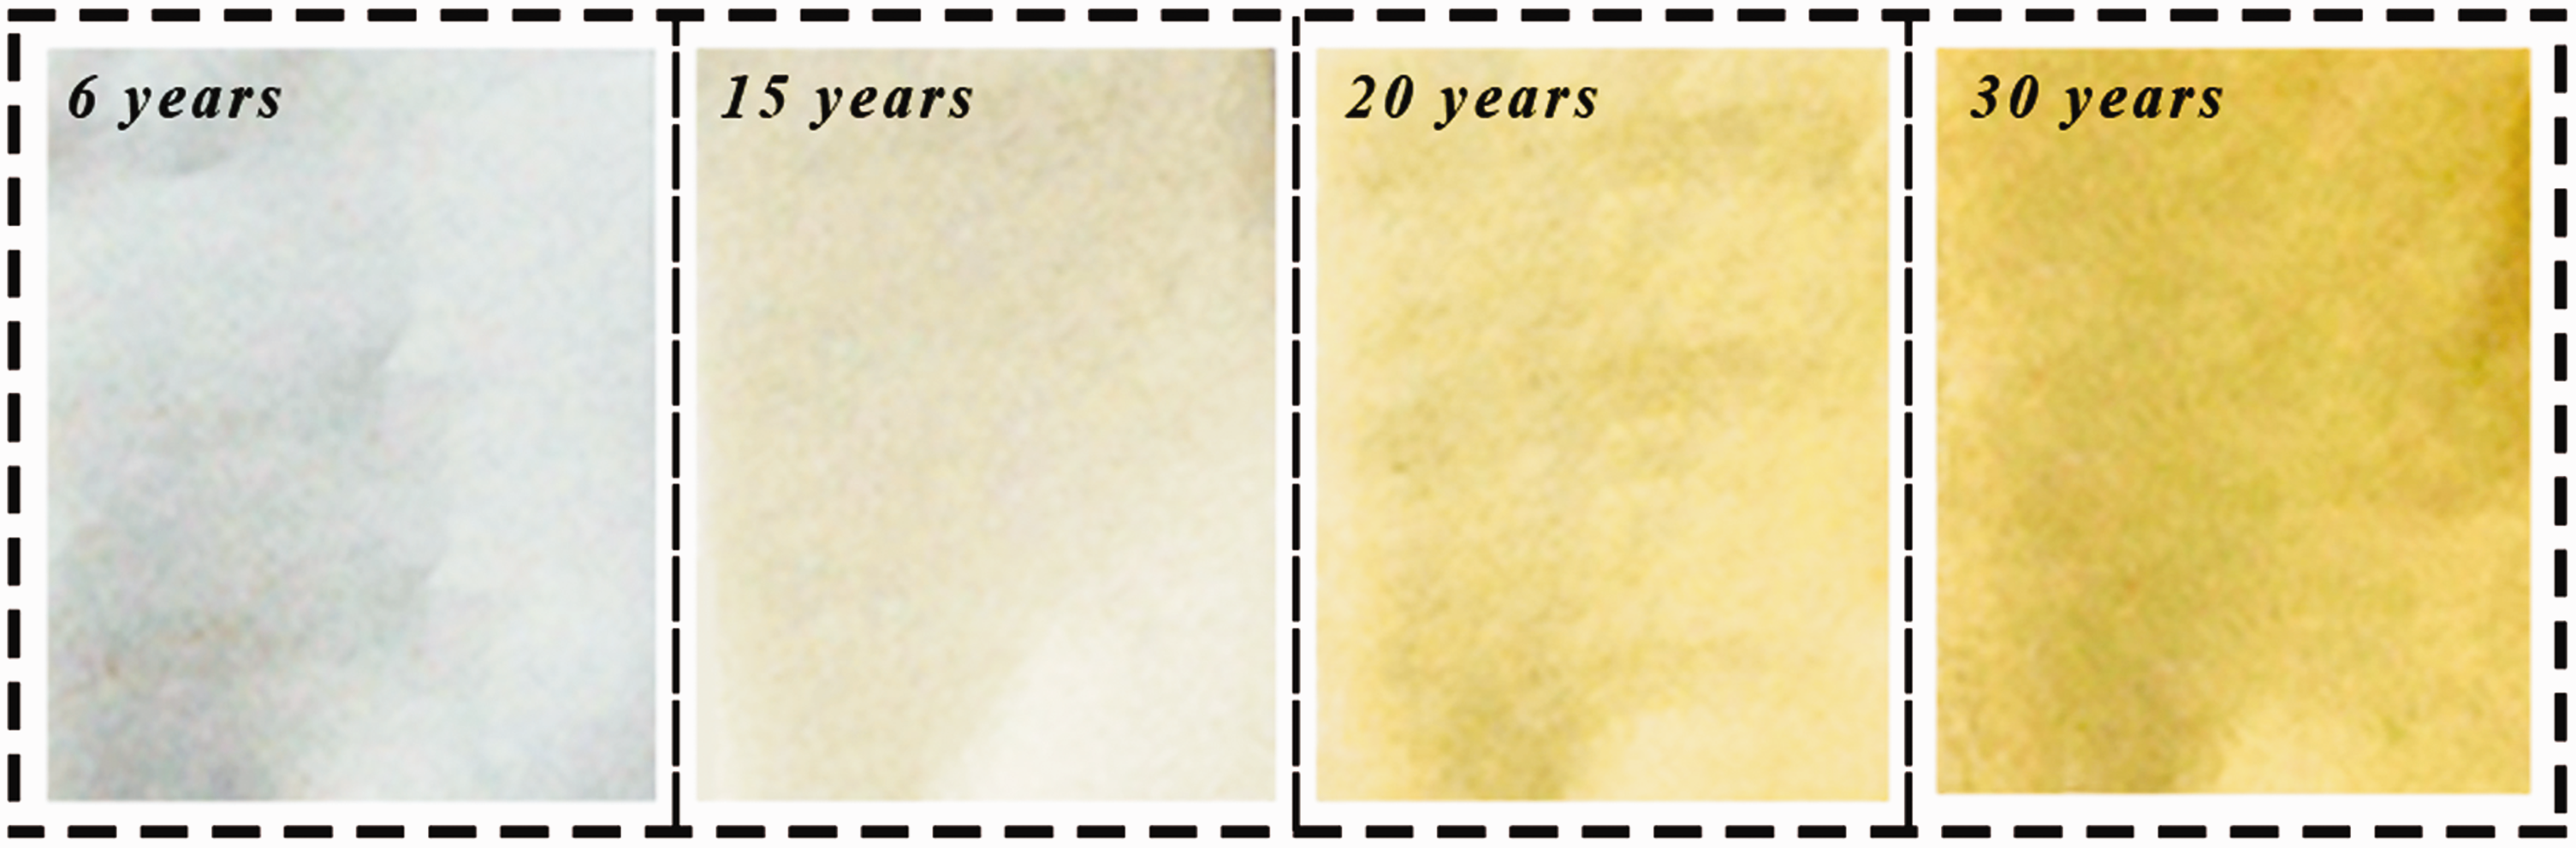
The LIFS experiments were performed in a dark laboratory environment to minimize the interference of ambient light. During the measurements of fluorescence spectra, the phenomenon of photobleaching needs to be considered, since the presence of photobleaching will bring about a reducing fluorescence intensity. 24 In order to eliminate the effect of photobleaching and the interference of random noise, three adjacent points in the center of paper were selected for successive fluorescence measurements, and the average of these three fluorescence spectra was recorded as the measured spectra of each sample.
The measured fluorescence spectra obtained from 14 paper samples with different ages, in the case of 6, 7, 8, 10, 12, 15, 16, 17, 18, 20, 22, 25, 30, and 35 years, are shown in Fig. 3. For the paper samples in the age range of 6–17 years (Fig. 3a), when excited with 405 nm UV laser, the paper fluorescence with high intensity can be clearly observed in the blue-green spectral region, with two peaks at about 448 nm and 480 nm. The higher intensity peak at 448 nm should be mostly produced by the brightener (or called fluorescence brightener) which is commonly used to improve the whiteness of paper in the papermaking industry, while the fluorescence peak at 480 nm is principally due to the emission obtained from cellulose compounds.
15
With the increasing ages, these two fluorescence peaks change in absolute intensities and the ratio of peak intensities was also influenced. For the paper samples with the increasing ages in the range of 18–35 years (Fig. 3b), the fluorescence peak at 448 nm is fading away gradually, while the fluorescence peak at 480 nm presents a decrement and has a slight redshift to long wavelength centered at 520 nm. This behavior should be related to the structural changes of papers, especially for the changes occurred in the cellulose compounds at different stages. The results demonstrate that the fluorescence intensities and spectral shapes are relatively sensitive to paper aging, thus the fluorescence spectra can be used as one indicator to study the structural changes of papers in the aging process.
Fluorescence spectra of the paper samples with different ages in the range of (a) 6–17 years and (b) 18–35 years.
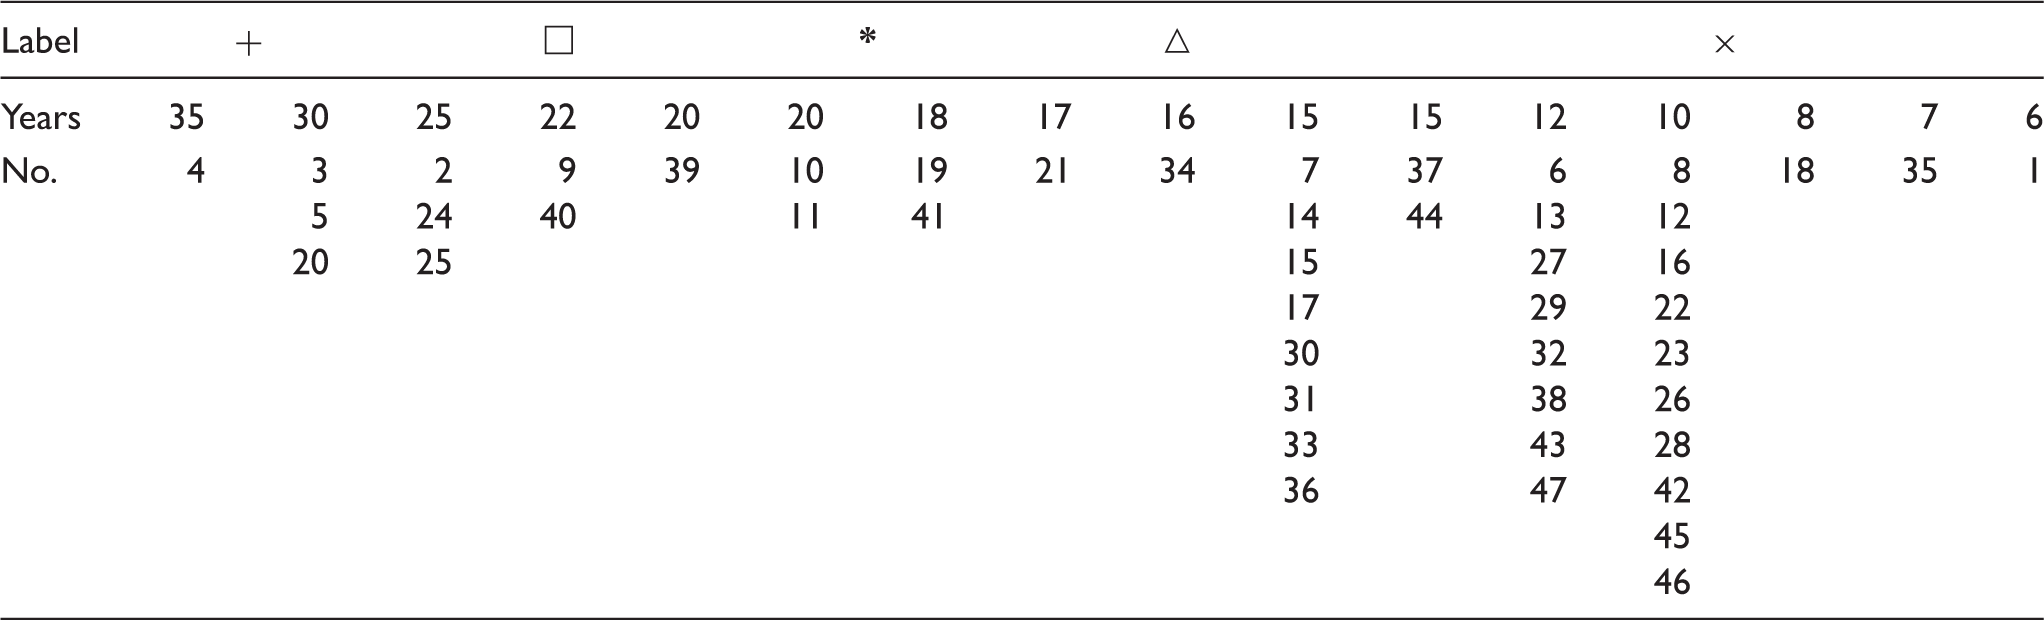
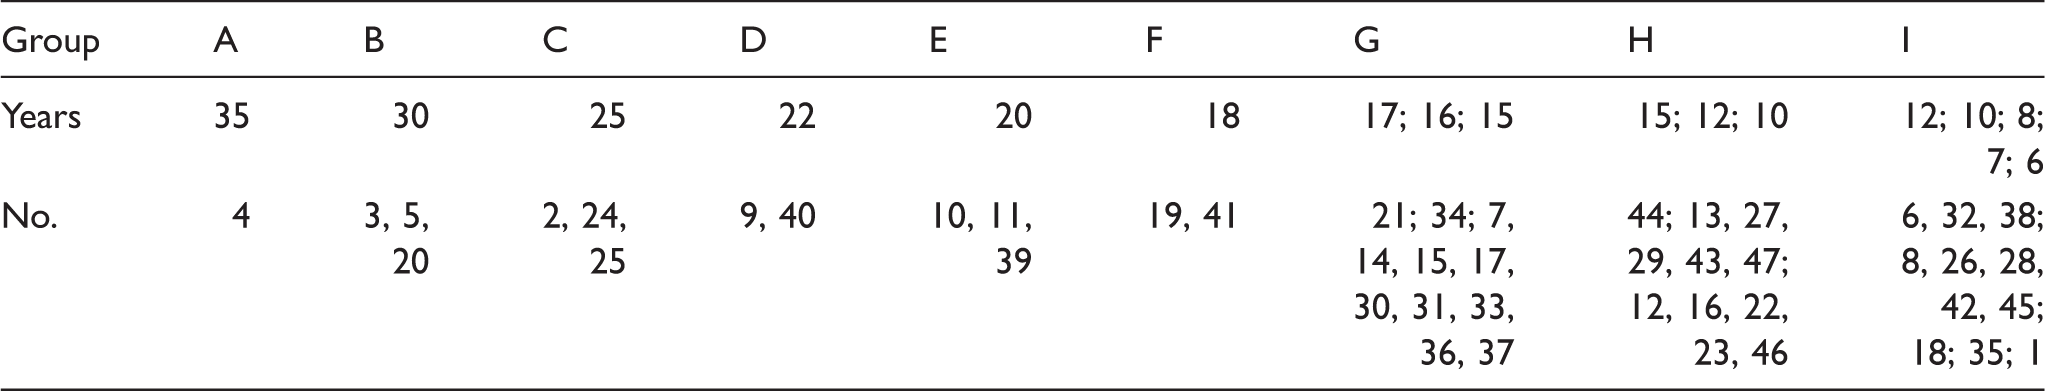
After applying PCA, the first two PCs (PC1 and PC2) with high eigenvalues can represent most of the spectral information. Based on the values of PC1 and PC2, by performing the k-means clustering algorithm, a 2D scatter diagram is plotted and shown in Fig. 4. As can be seen clearly, all 47 paper samples are divided into five categories. The obtained clustering effect is mainly depended on the ages of paper samples, which can be found in Table I. The paper samples, in the rough age range of 30–35 years, 22–25 years, 18–20 years, 15–17 years, and 6–12 years, are marked with the symbols of green plus sign (+), mauve square (□), blue asterisk (*), black triangle (△), and red cross (×), respectively. From the view of PC2, the zero-axis separates the five categories into two parts: the one above zero with the ages in the range of 6–17 years and the other one below zero with the ages in the range of 18–35 years. When observing PC1 along the positive direction, the three clusters of paper samples in the range of 18–35 years have a decreasing age tendency, while the two clusters in the range of 6–17 years have an increasing age tendency.
Principal component analysis based on the fluorescence spectra of all 47 paper samples.
Five categories of 47 paper samples by applying PCA.
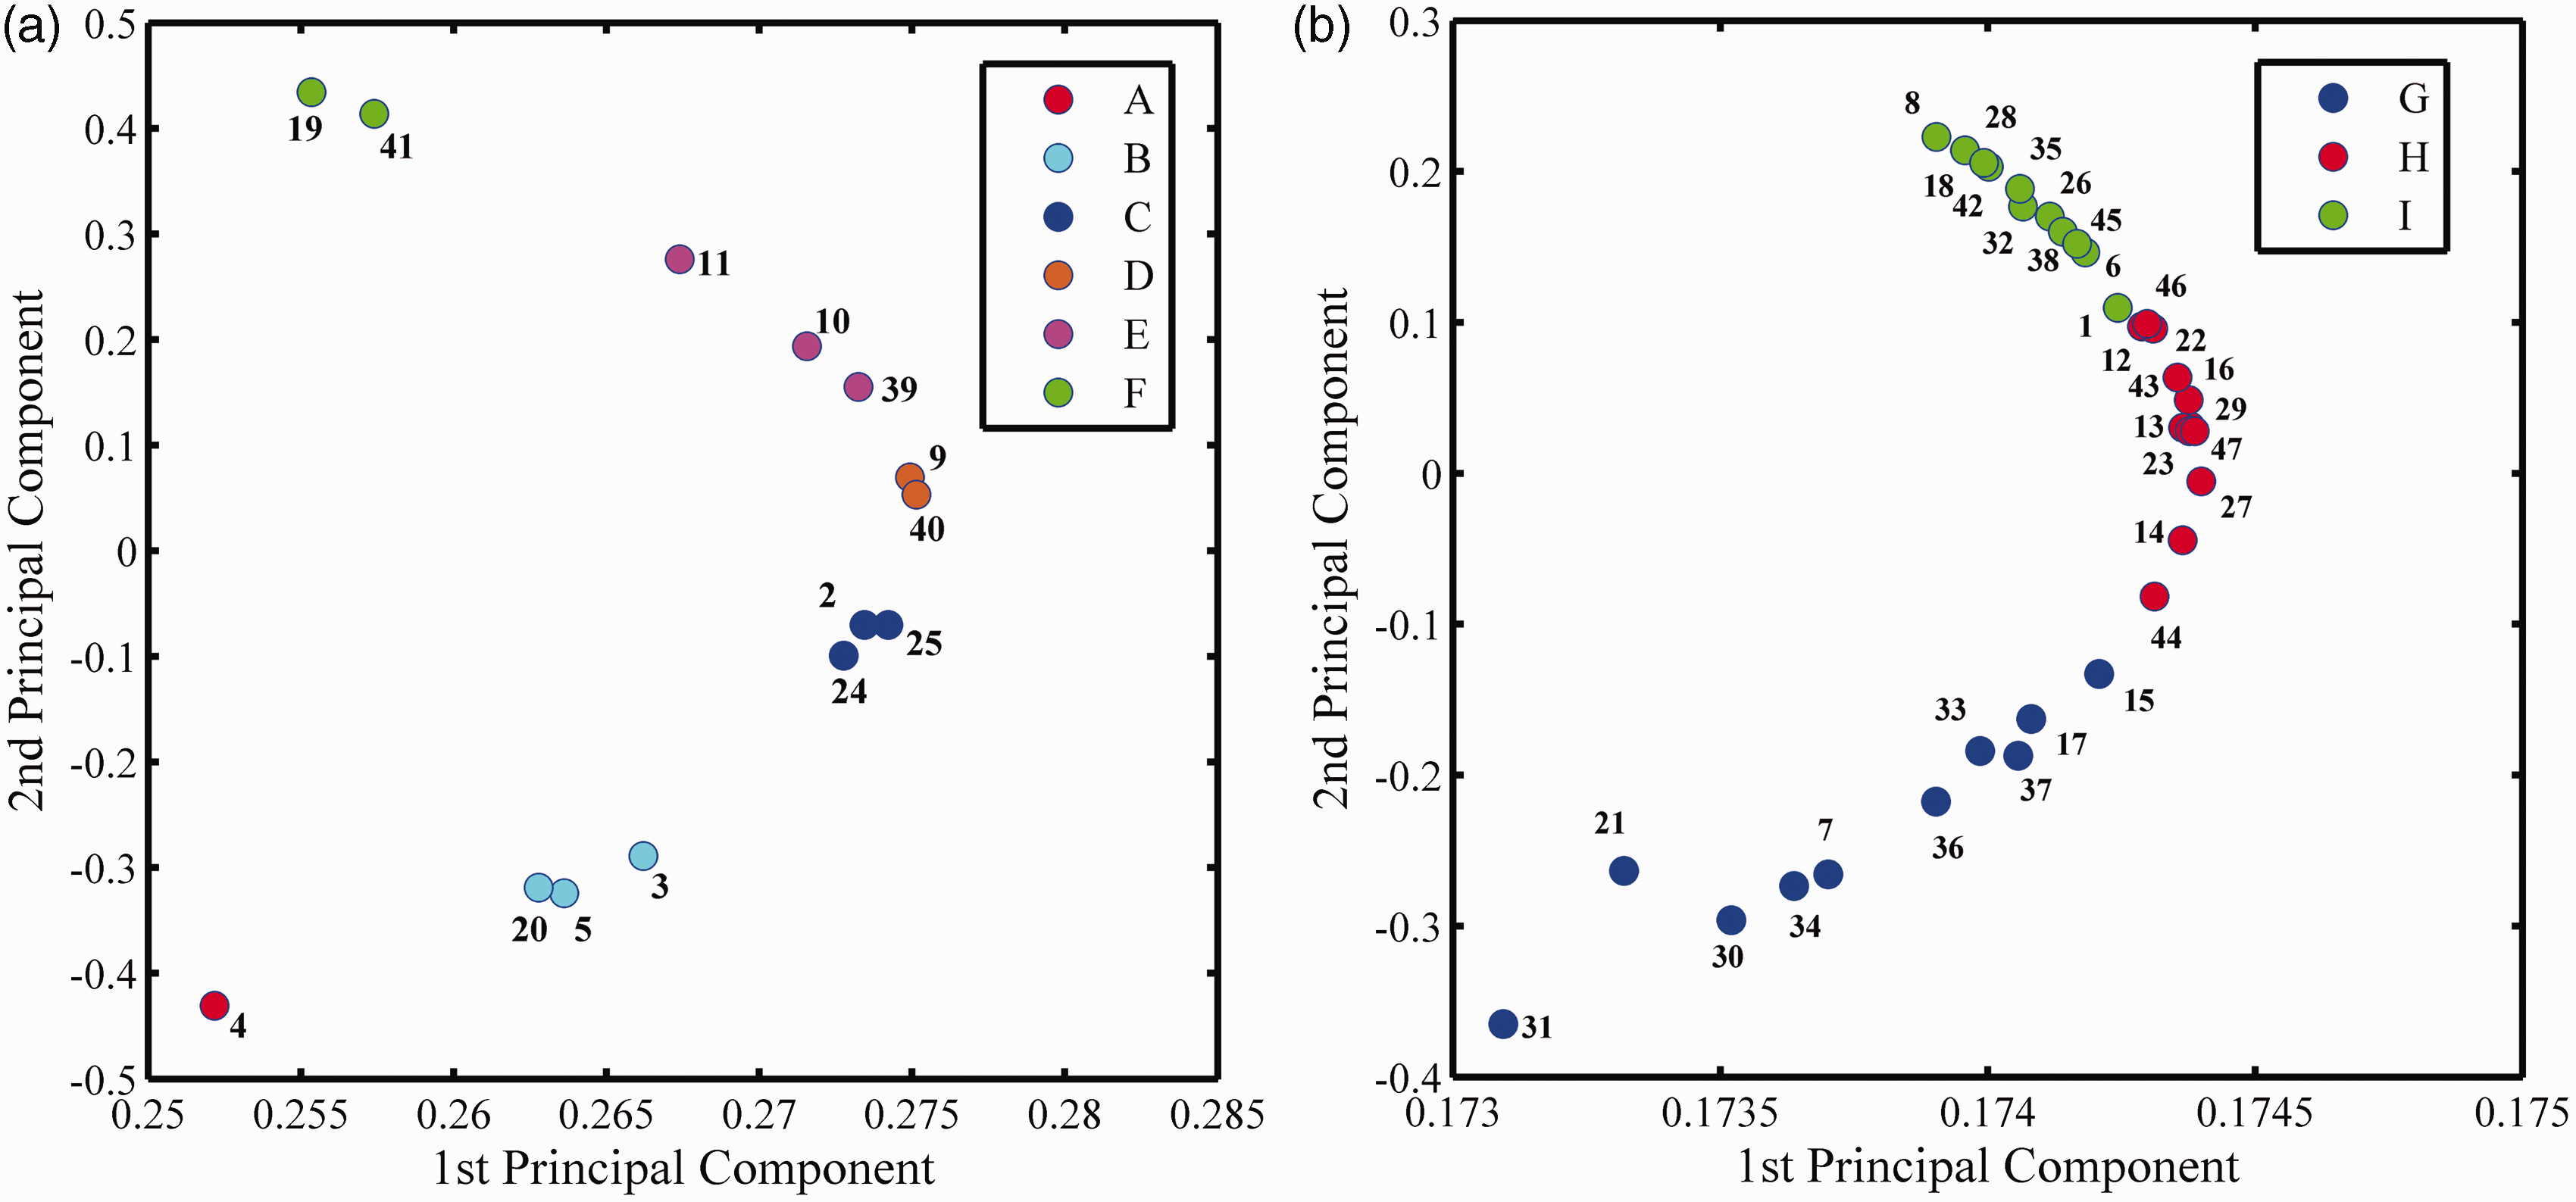
Principal component analysis based on the fluorescence spectra of the 14 paper samples dating back to (a) 18–35 years ago and the 33 paper samples dating back to (b) 6–17 years ago.
Classification of paper samples with different ages using repeated PCA.
The semicolons in the cells are used to separate the paper samples with different ages. The samples of the same age are sorted by the number (No.) of paper samples.
In order to investigate the spectroscopic changes related to paper aging quantitatively, the first-derivative fluorescence spectrum was adopted due to its good resolution of superimposed spectral bands. One typical example of the first-derivative fluorescence spectra is shown in the small inset of Fig. 6a. From the first-derivative spectra, the most significant change lies in the spectral peak at 443 nm. The average of the first-derivative spectral peak at 443 nm for the paper samples with the same age plotted against the paper age is shown in Fig. 6a, where an exponential function can be used to preferably fit the experimental data with a fitted R-squared value of 0.99, which demonstrates that the first-derivative spectral peak at 443 nm is exponentially decaying. Therefore, the exponential model can be used to accurately estimate the paper age, especially for the paper samples aged < 20 years. However, when the paper age is > 20 years, it can be seen from Fig. 6a that the value turns to be relatively stable, thus the age cannot be evaluated accurately. Here, another linear model is specifically established for the estimation of paper samples aged > 20 years; the fitted curve with an R-squared value of 0.88 is shown in Fig. 6b.
The relationship between the first-derivative spectral peak at 443 nm and the years of paper samples.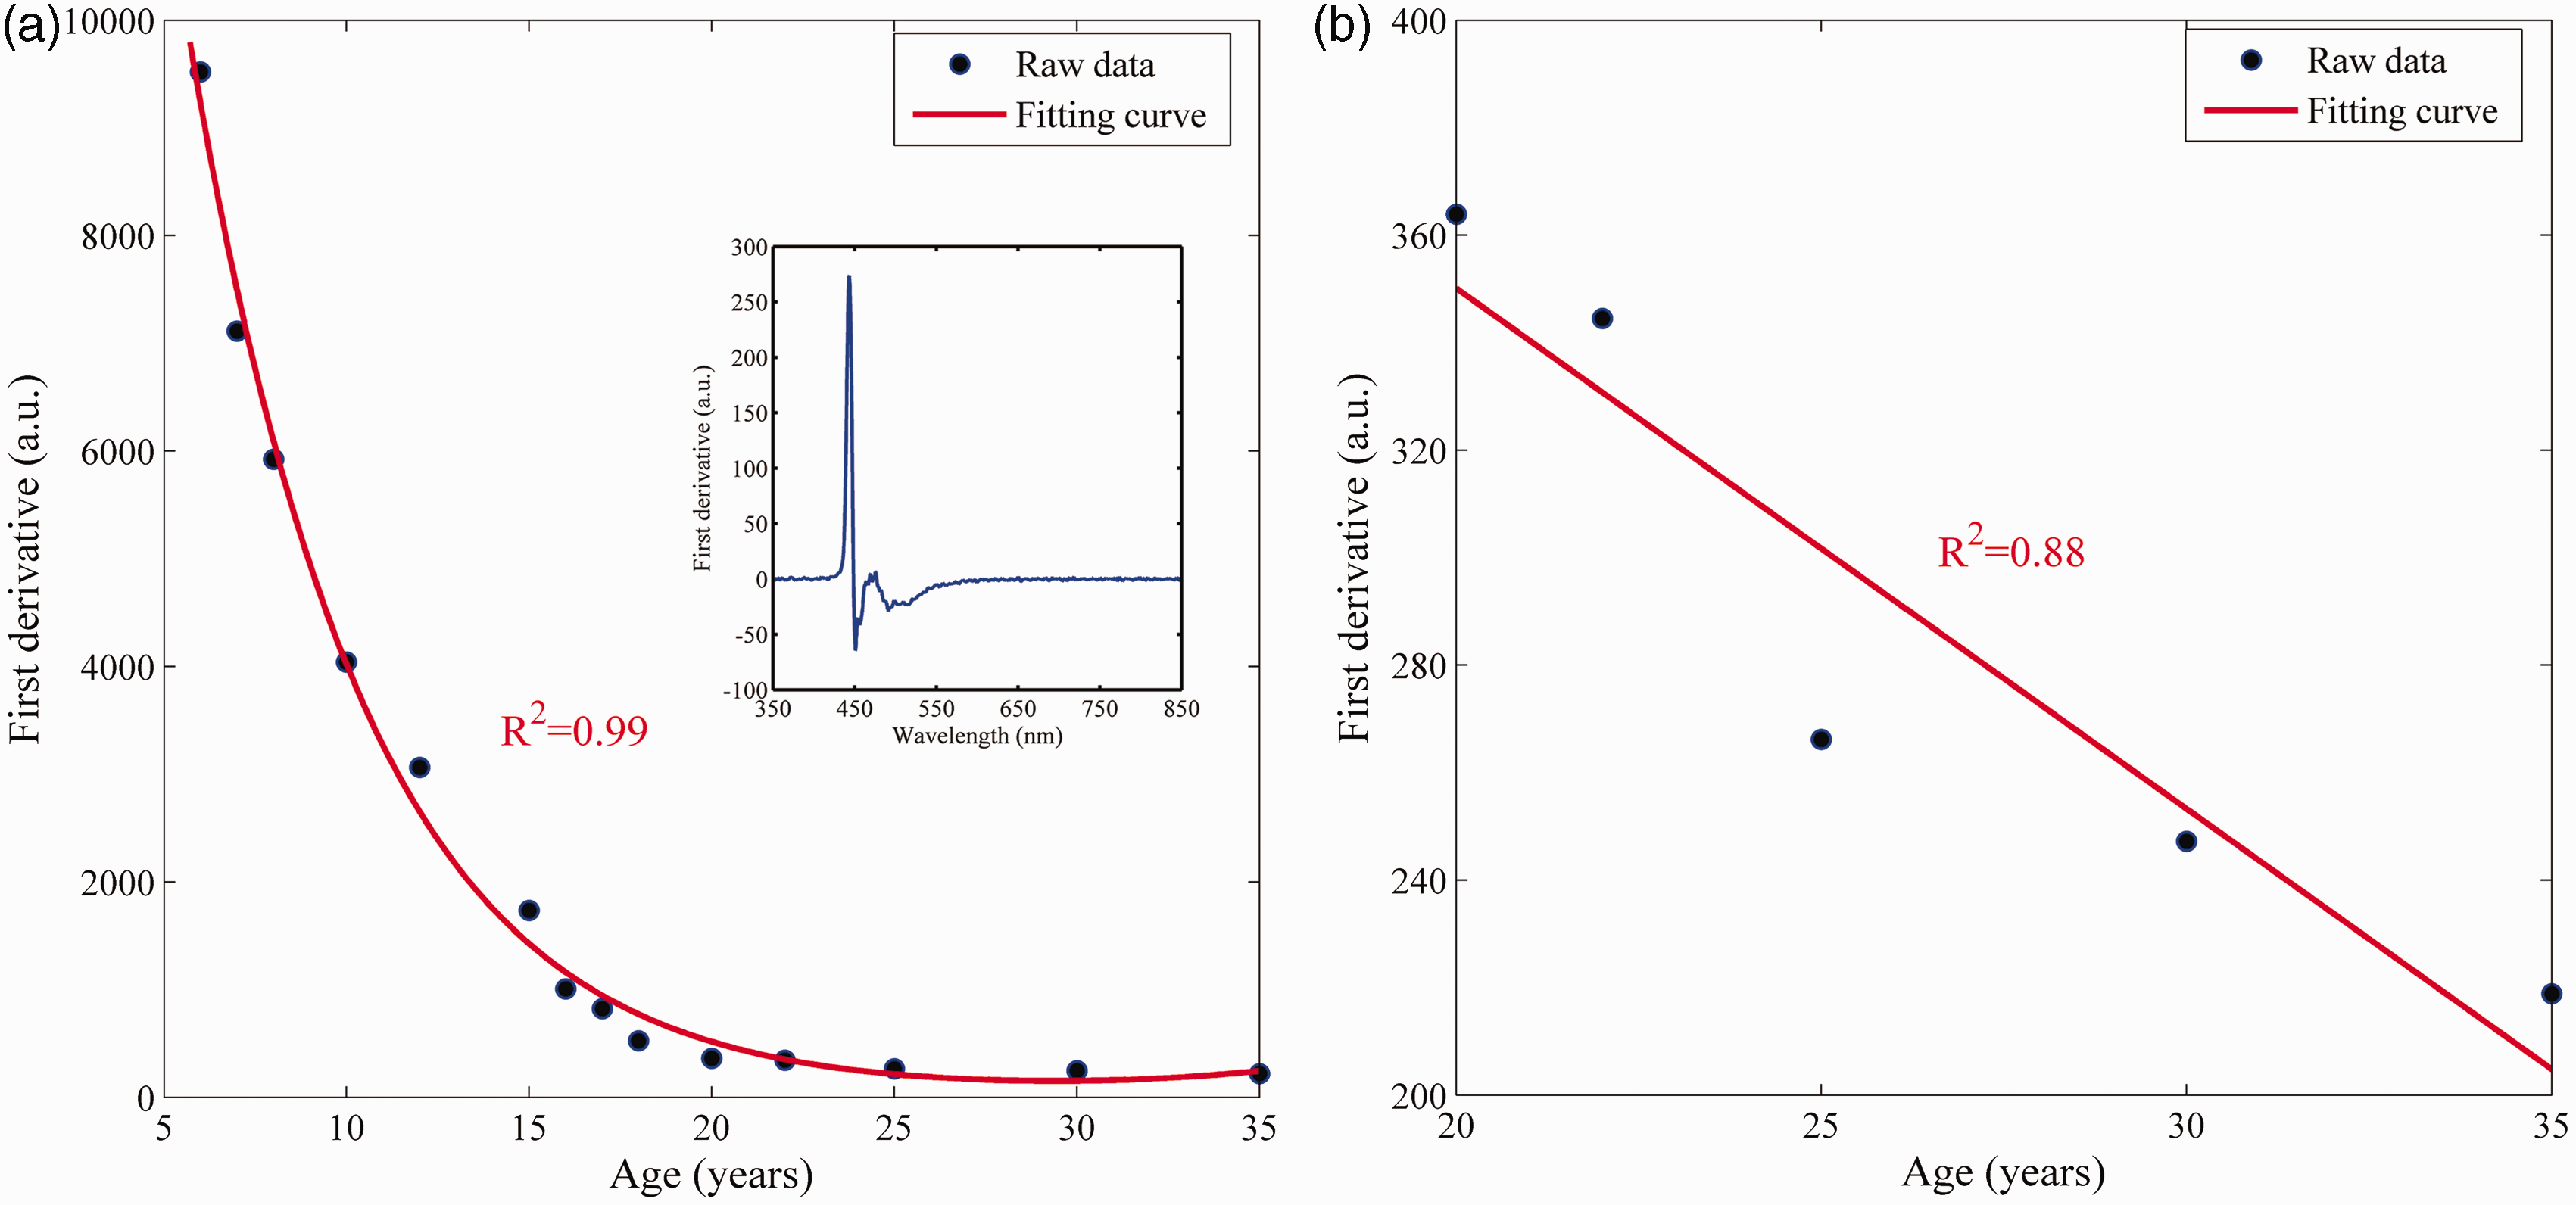
Conclusion
The present work demonstrates that LIFS combined with PCA provides a great potential for the discrimination of paper samples with different ages. Based on the fact that paper aging is relative to the oxidation of cellulose and the latter developing chromophores, the change of fluorescence intensities and spectral shapes is highly sensitive to paper age and the changes of cellulose compounds. According to the PCA results and k-means algorithm, all 47 paper samples can be classified into nine groups based on the age clusters, where the 14 paper samples aged > 18 years can be distinguished accurately into six groups, while the classification of 33 paper samples aged < 18 years is not so satisfactory. In addition, the first-derivative fluorescence spectra were utilized to obtain the quantitative relationship between the fluorescence spectra and the age of paper samples by using the first-derivative spectral value at 443 nm, an exponential decaying model with an R-squared value of 0.99 is established to evaluate the paper age. However, the exponential model is only suitable for the paper samples aged < 20 years. To further realize the estimation of the age of paper samples in the age range of > 20 years, another linear model is established. The experimental results indicate that the fluorescence spectra can be used to estimate the paper age. However, the paper samples used in this work date back 6–35 years ago, leading to the limitation of the established calibration models to estimate the paper age. In the future, we plan to choose more ancient paper samples for the LIFS measurements to obtain a more generalized and accurate calibration model.
Footnotes
Conflict of Interest
The authors report there are no conflicts of interest.
Funding
This work was financially supported by the China Postdoctoral Science Foundation (2017M612399), National Natural Science Foundation of China (31671581), Natural Science Foundation of Henan Province (162300410143), and Science and Technology Project of Henan Province (172102310244).