
Abstract
Due to the influence of self-absorption of major elements, scarce observable spectral lines of trace elements, and relative efficiency correction of experimental system, accurate quantitative analysis with calibration-free laser-induced breakdown spectroscopy (CF-LIBS) is in fact not easy. In order to overcome these difficulties, standard reference line (SRL) combined with one-point calibration (OPC) is used to analyze six elements in three stainless-steel and five heat-resistant steel samples. The Stark broadening and Saha-Boltzmann plot of Fe are used to calculate the electron density and the plasma temperature, respectively. In the present work, we tested the original SRL method, the SRL with the OPC method, and intercept with the OPC method. The final calculation results show that the latter two methods can effectively improve the overall accuracy of quantitative analysis and the detection limits of trace elements.
Keywords
Introduction
Laser-induced breakdown spectroscopy (LIBS) employs a pulsed laser and a focusing lens to generate a plasma. By analyzing the plasma emission spectra, the samples can be qualitatively and quantitatively analyzed. The usual technique for quantitative measurements of plasma composition is the univariate or multivariate regression model. However, they require calibration samples and standards investigated with identical matrices and identical experimental parameters (e.g., laser energy, spot diameter) to establish a calibration curve. Laser-induced breakdown spectroscopy calibration curves are also strongly dependent on the physical and chemical properties of the analytical materials, known as the matrix effect. Calibration-free LIBS (CF-LIBS) takes the matrix into account as part of the analytical problem which analyzes the matrix together with the analyte instead of looking at the matrix as an external disturbing interference. 1 Due to the unique advantages, it has inspired many researchers’ enthusiasm since it was first proposed by Ciucci et al. 2 in 1999. Up to now, CF-LIBS has been widely used for various samples and different research fields, e.g., all kinds of alloys2–5 and their oxides,6–9 aqueous solution, 10 and soils and rocks.11–14 In practice, CF-LIBS quantitative analysis still faces many difficulties. This is mainly because laser-induced plasma does not fully meet the basic assumptions of CF-LIBS requirements. 1
Several research groups have devoted their efforts to modify or improve the CF-LIBS algorithm from the experimental or theoretical aspects. Tognoni et al. 3 used the Saha–Boltzmann plot to replace the Boltzmann plot to calculate the plasma temperature when the plasma is assumed as an ideal homogeneous source. Since more spectral lines are used for calculations, the temperature obtained by the Saha-Boltzmann plot is expected to be more accurate. Bulajic et al. 5 proposed a self-absorption correction algorithm based on the curve of growth (COG) from which the quantitative results show a significant improvement with respect to those obtained without self-absorption correction. However, this method is complicated and time-consuming. Taking this into account, Sun et al. 4 proposed a simplified procedure for correcting self-absorption effects in calibration-free analysis which they named internal reference for self-absorption correction (IRSAC). The IRSAC procedure greatly reduces analytical time, but the choice of an internal reference line is strongly dependent on the operator’s experience. The spectral lines of different species are affected differently by self-absorption, which leads to inconsistent plasma temperatures in the use of IRSAC. Based on IRSAC, Dong et al. 15 proposed an internal reference-external standard with iteration correction (IRESIC) method to obtain a more accurate plasma temperature. This needs one standard sample to simulate the accurate plasma temperature of the unknown samples using a genetic algorithm (GA). In recent years, several hybrid approaches which need standard samples have been put forward. For example, Cavalcanti et al. 16 presented one-point calibration (OPC) CF-LIBS, which improved the accuracy of quantitative analysis by modifying the relative efficiency correction factor and theoretical parameters.
In view of the significant potential of CF-LIBS in the field of in situ and online analytics, improving its accuracy is still an important task. It is hard to construct a reasonable Boltzmann plot for trace elements because their spectral lines are commonly scarce or hardly observable. In our previous work, 17 a standard reference line (SRL) method was presented and applied to a stainless-steel sample. It does not seek to construct the Boltzmann plot of trace elements like classic CF-LIBS. Therefore, the detection limit of trace elements is improved. However, the selection of the SRL for the main element is still a difficulty. In the present work, we attempted to solve this problem and improve the accuracy of CF-LIBS by combining SRL with OPC.
Experimental
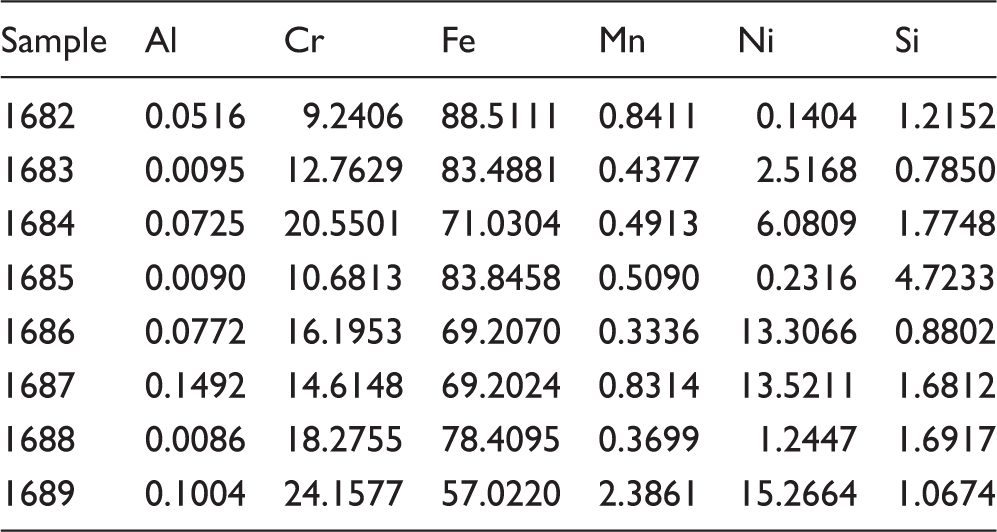
The relative abundance of six elements in eight steel samples.
Results and Discussion
Standard Reference Line
The SRL method has been reported in detail in the previous work
17
and here we are simply reviewing the basic idea of the method. Since the Stark effect is the dominant mechanism of spectral line broadening compared with Doppler broadening or collisional broadening, it can be used to calculate the electron density.18–21 The experimental samples are three stainless-steel and five heat-resistant steels in which the major element is iron (Fe). Due to the rich lines of Fe, it is selected for calculating the electron density and plasma temperature. In this work, w = 0.014 nm for Fe(I) 381.584nm
22
is chosen for analysis. Under the assumption of local thermodynamic equilibrium (LTE), the Saha–Boltzmann plot
23
can give a more reliable plasma temperature relative to the Boltzmann plot. In order to determine the plasma temperature with minimal relative errors and partially overcome the effects of self-absorption, a pre-selection procedure presented by Aydin et al.
24
is employed. For the spectral lines of Fe(I) and Fe(II), > 400 lines are chosen to constitute a spectral database
25
for which the minimum accuracy of transition probability is B+ ( The mean and standard deviations (error bar) of plasma temperature (T) and electron density (Ne) for eight steel samples.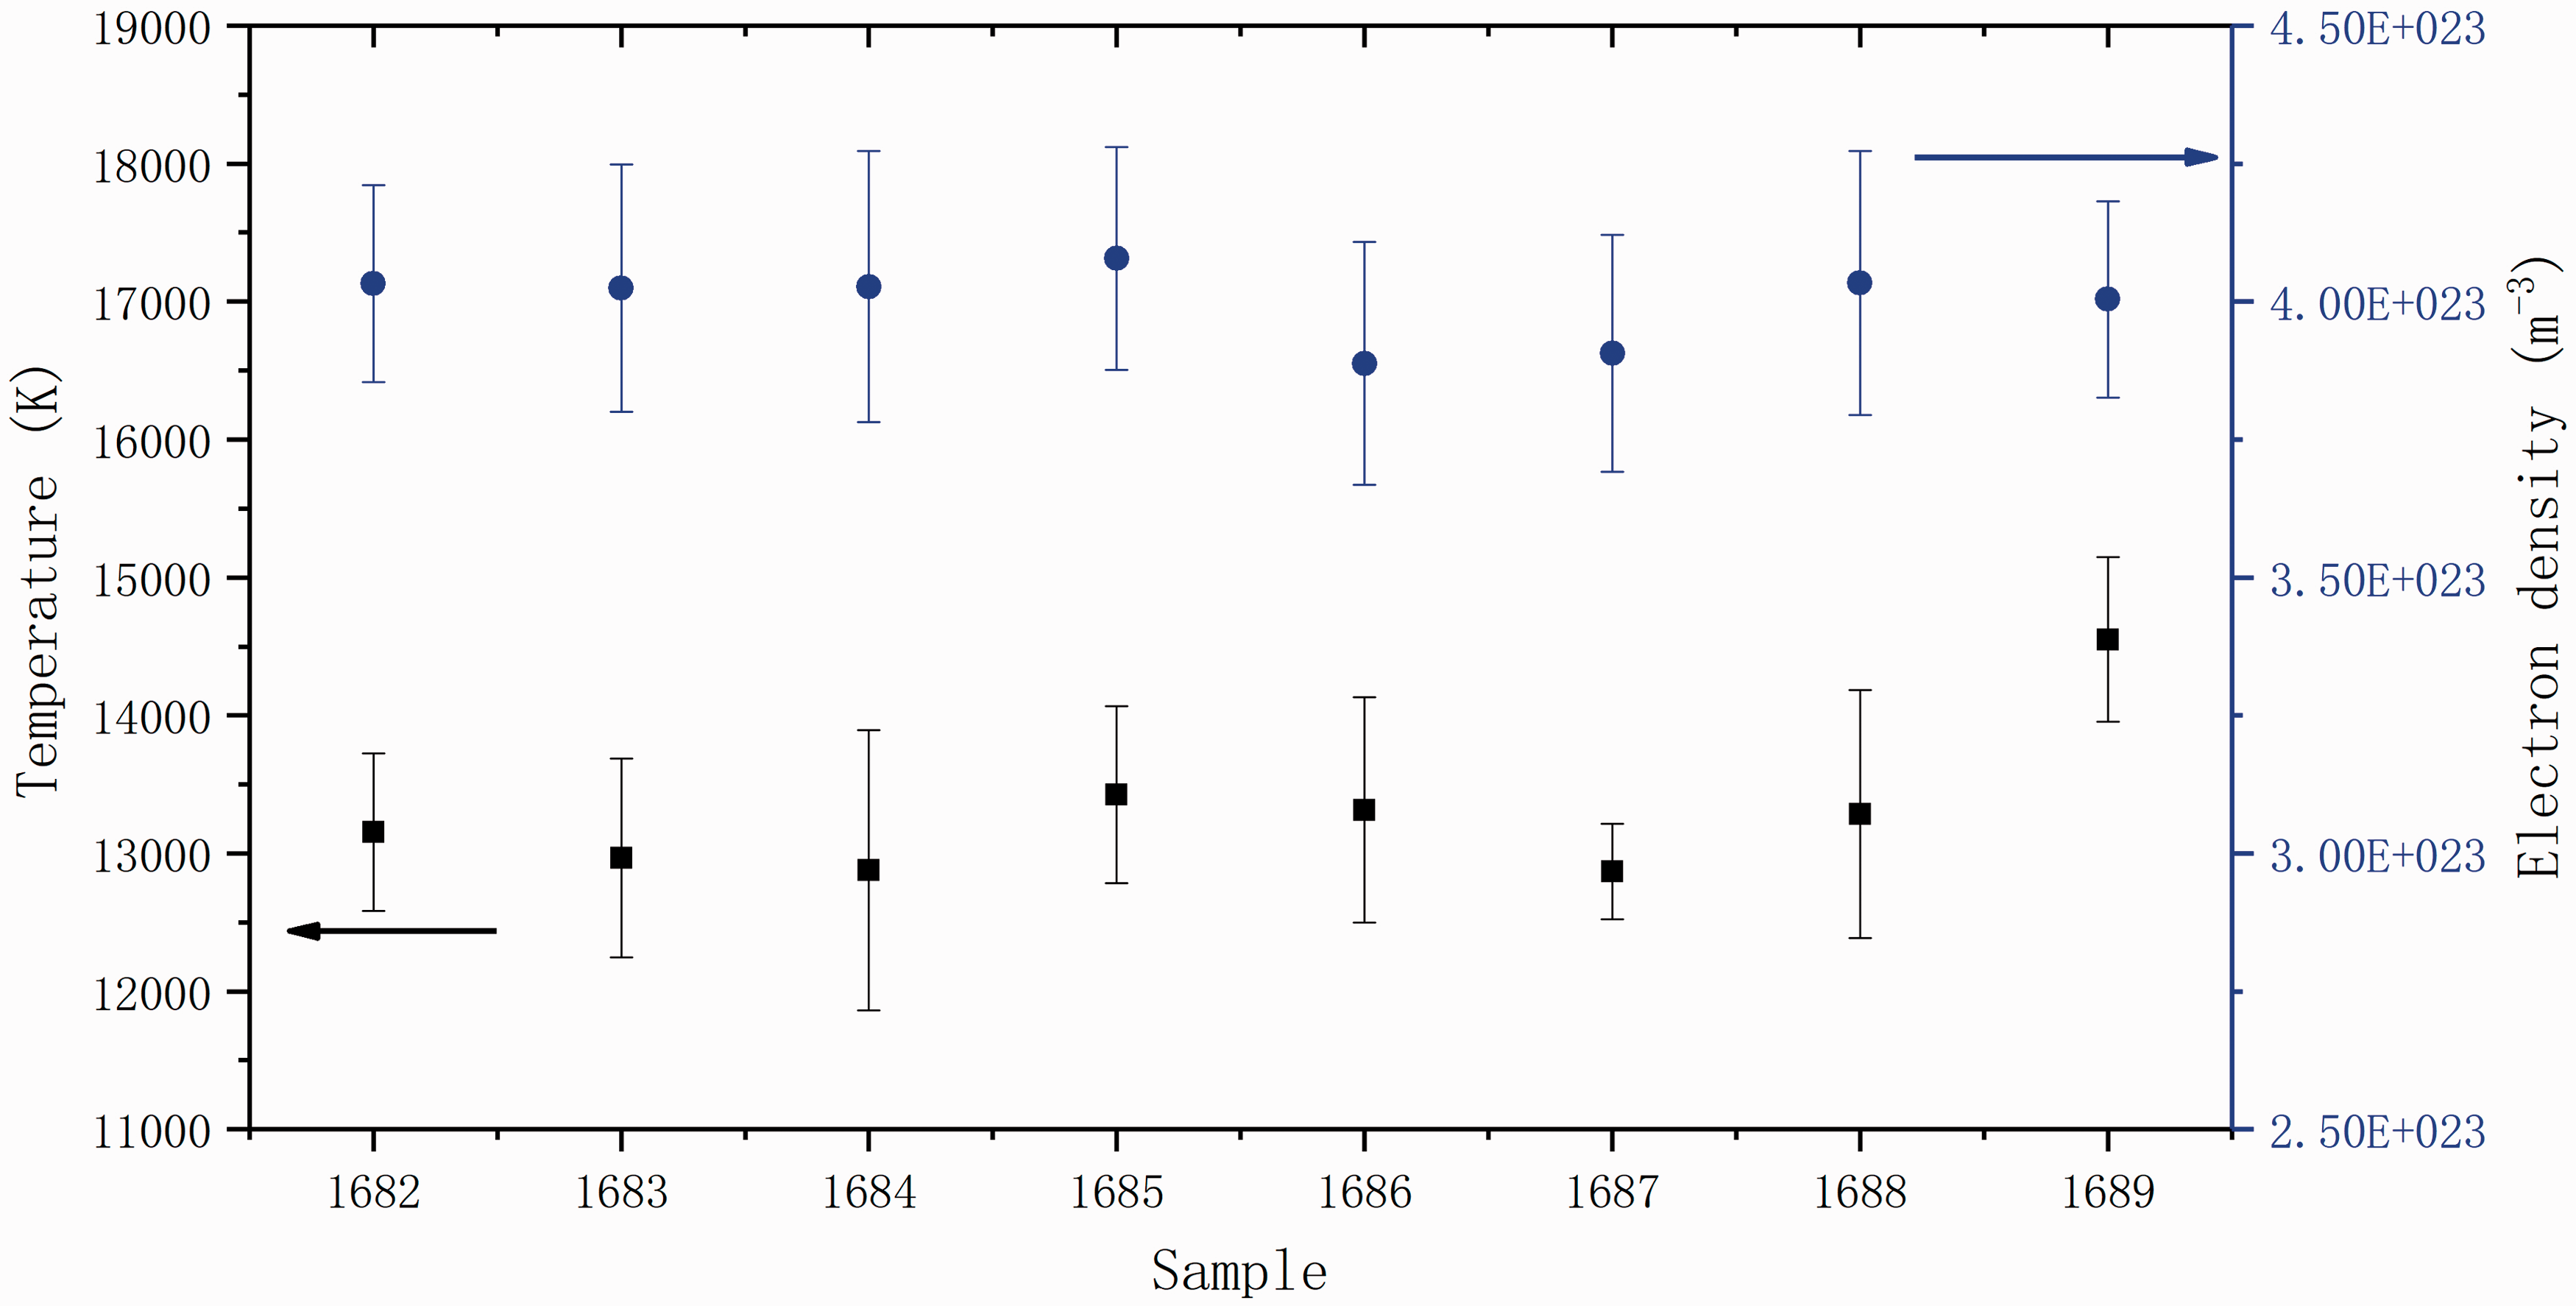
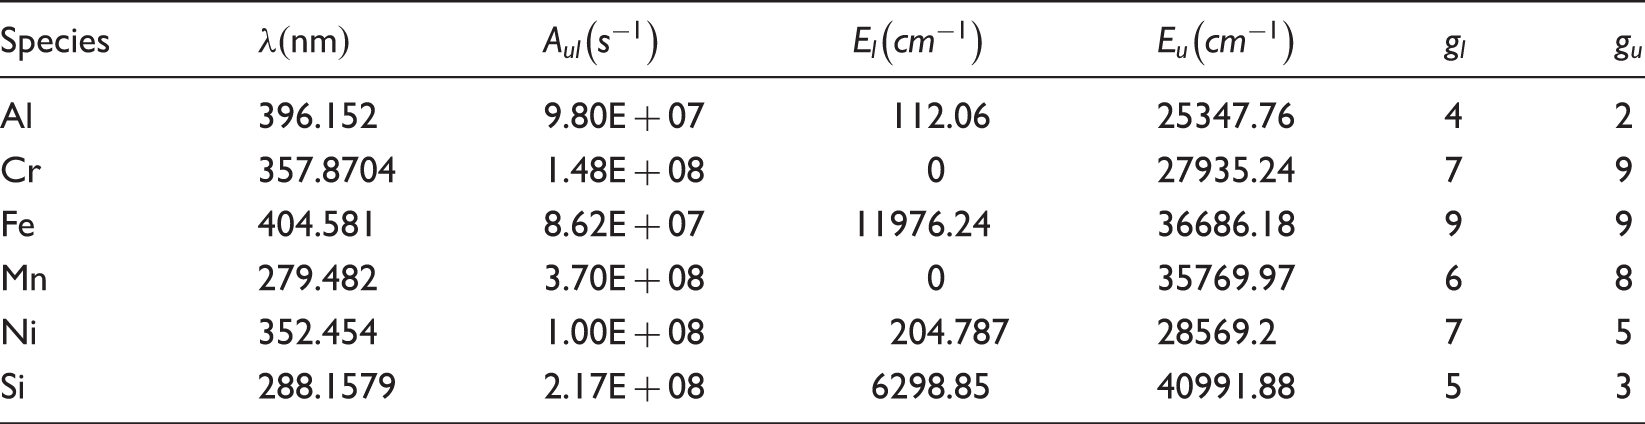
The lines which are chosen as the SRL and their related parameters.
Tognoniet et al.
1
introduced a measure of the overall accuracy of the CF-LIBS results. The C and V are the calculated concentration by CF-LIBS and the verified concentration, respectively. The distance (dist) between two vectors represents the sum of absolute errors and can be expressed as:
The mean and standard deviations of dist from SRL for eight steel samples are shown in Fig. 2. It shows that the results obtained using the SRL method are very poor. On the one hand, Fe is the major element and Fe(I) 404.581 nm has a clear self-absorption which led to the underestimation of CFe. On the other hand, inaccuracy of relative efficiency corrections also plays a crucial role. Even if the intensity calibration has been performed using a Deuterium-Halogen calibration light source (Ocean Optics, DH-3plus-CAL), the accuracy of the relative efficiency correction coefficient is still not high. There may be two reasons. First, the true intensity of the standard light source is not consistent with the recorded intensity. Second, the fiber is directly docked to the light source without considering the transmission efficiency of air and a converging lens.
The mean and standard deviations (error bar) of dist from SRL for eight steel samples.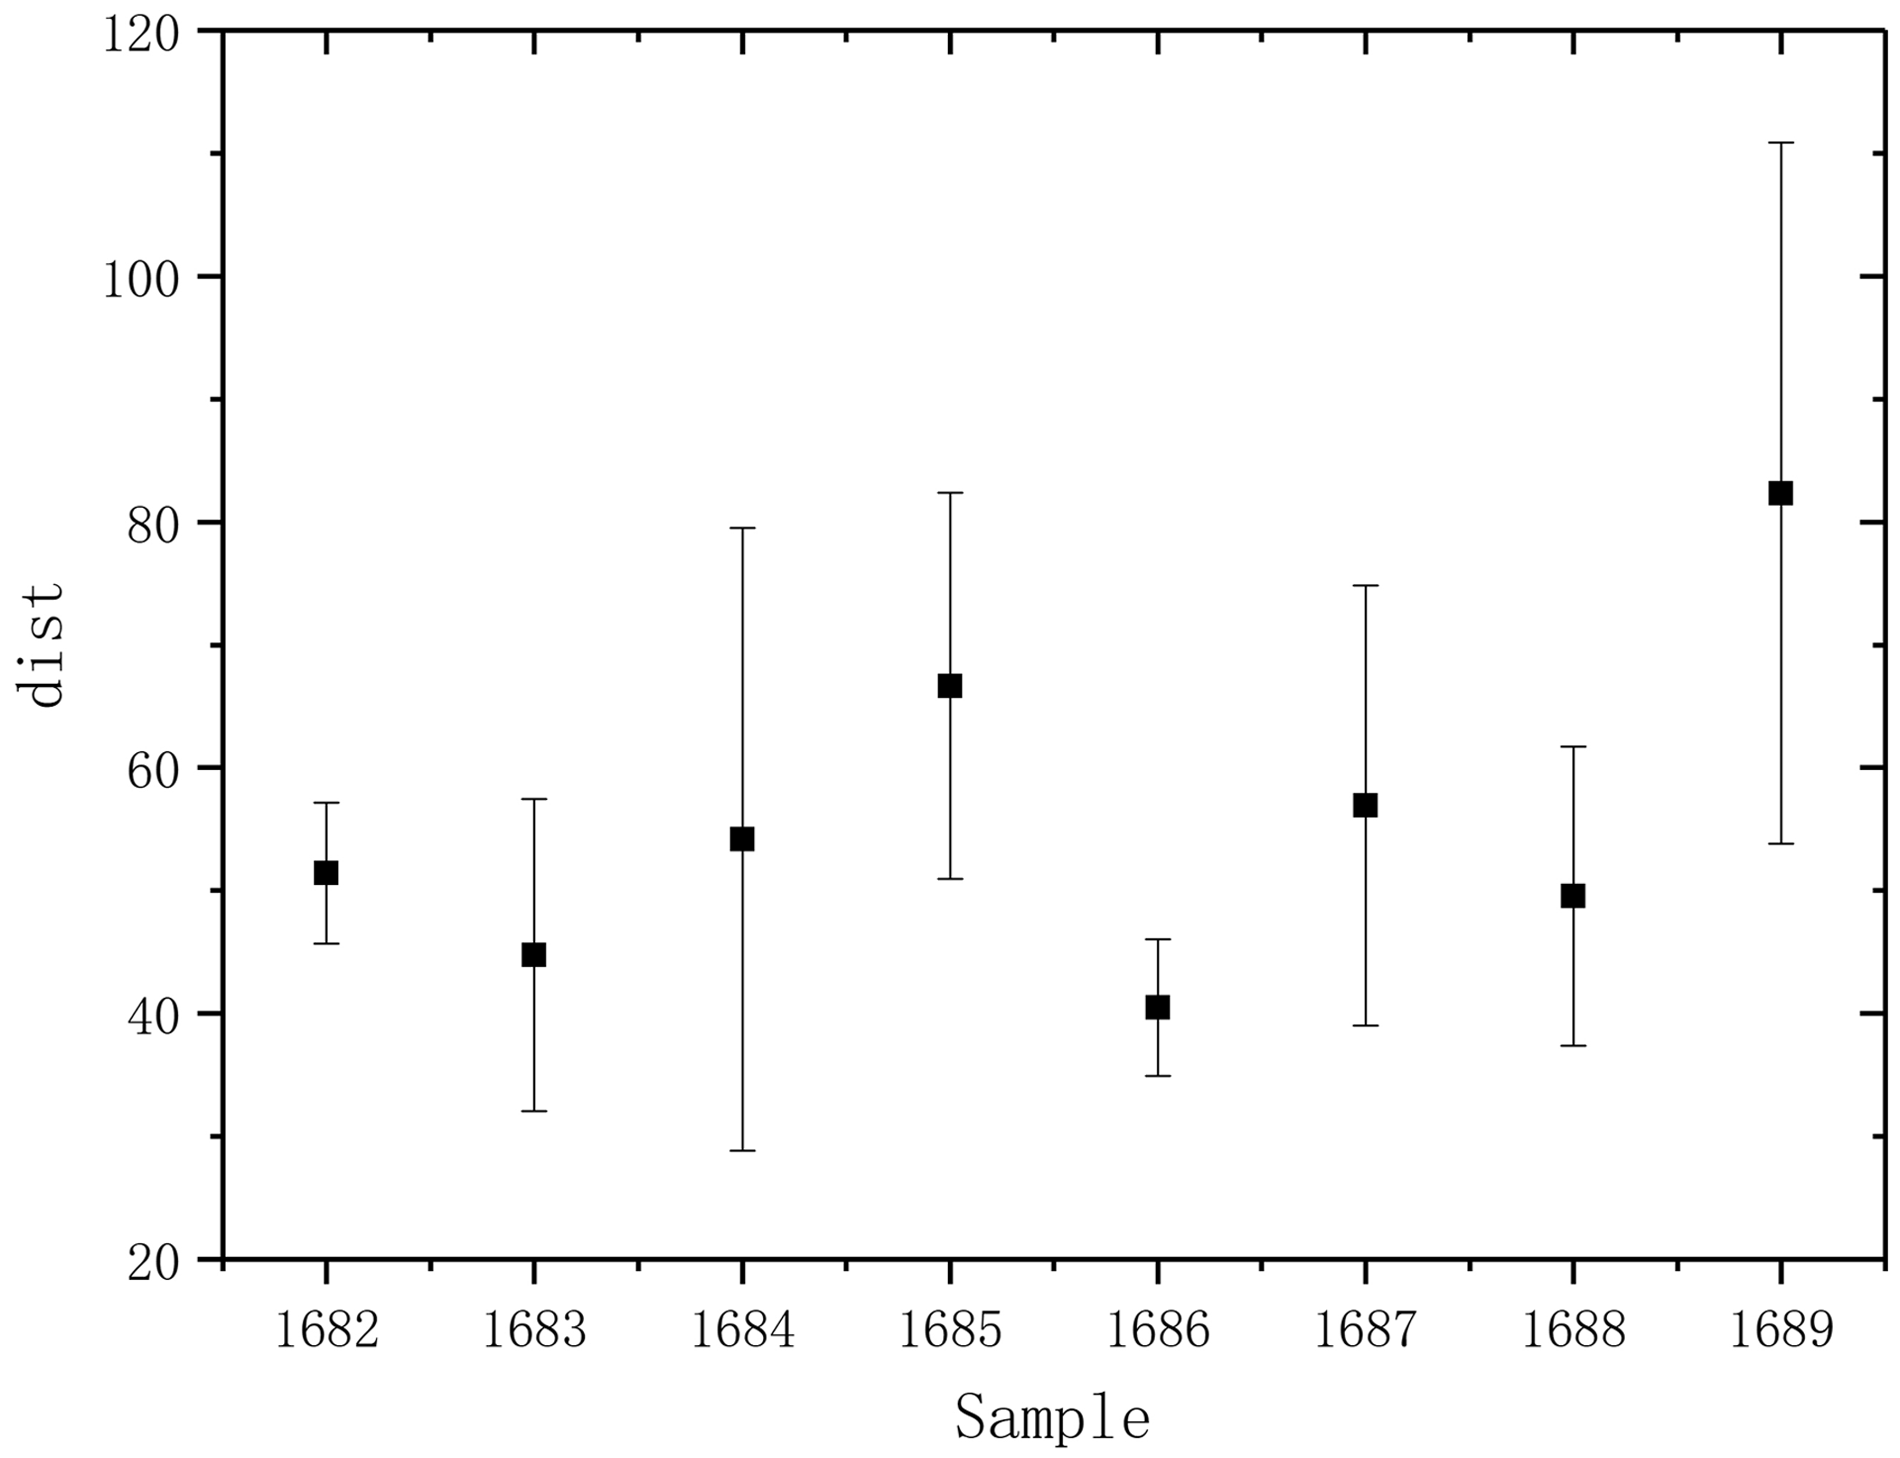
Standard Reference Line with One-Point Calibration
In the previous work,
17
we re-selected a SRL in order to overcome self-absorption of the main element line. Like IRSAC, the choice of this line is difficult. Further, if the main element concentration is different, then the SRL should also be different. To correct self-absorption and spectral efficiency coefficient, the OPC method presented by Cavalcanti et al.
16
is employed. We define the correction factors obtained from the standard intensity light source and OPC as cf and 
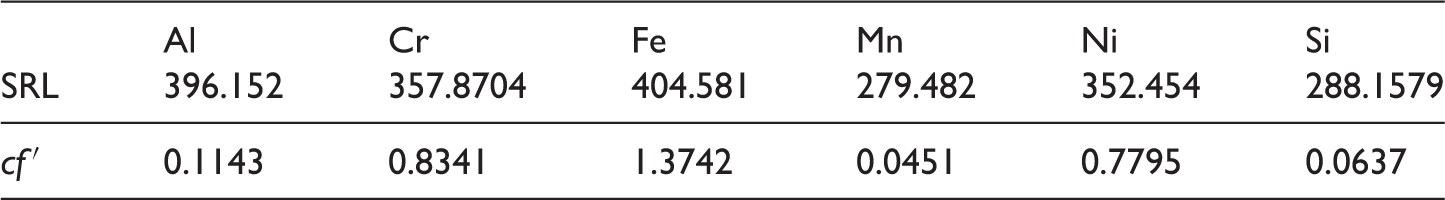
The correction factor of SRL.
The mean and standard deviations of dist from SRL with OPC and VFe for eight steel samples are shown in Fig. 3. One can see that the accuracy has been significantly improved compared to the original SRL results and all the means of dist are < 10. The closer the sample to the calibration sample, the better the calculated result. Although this trend is not obvious, it still can be seen. This is due to The mean and standard deviations (error bar) of dist from SRL with OPC and VFe for eight steel samples.
Standard Reference Line or Intercept with One-Point Calibration
The correction factor of SRL or interceptor.
The mean and standard deviations of dist from SRL or intercept with OPC for eight steel samples are shown in Fig. 4. One can see that all the means are < 9. By comparing Figs. 3 and 4, the mean of dist from samples 1682 and 1689 is less than the value obtained by SRL with OPC, but other samples showed opposite results. Overall, the accuracy of the two methods is not so different. Calculating CFe by intercept does not make the calculation results more accurate. The change of self-absorption coefficient of Fe(I) 404.581 nm is not significant relative to the change of VFe in all samples, as shown in Fig. 3. It also demonstrates that the plasma temperature, which is obtained by the pre-selection procedure, is accurate. To further improve the accuracy of CF-LIBS quantitative analysis, it is possible to carry out further work from two aspects of closed equation and stoichiometry ablation.
The mean and standard deviations (error bar) of dist from SRL or intercept with OPC for eight steel samples.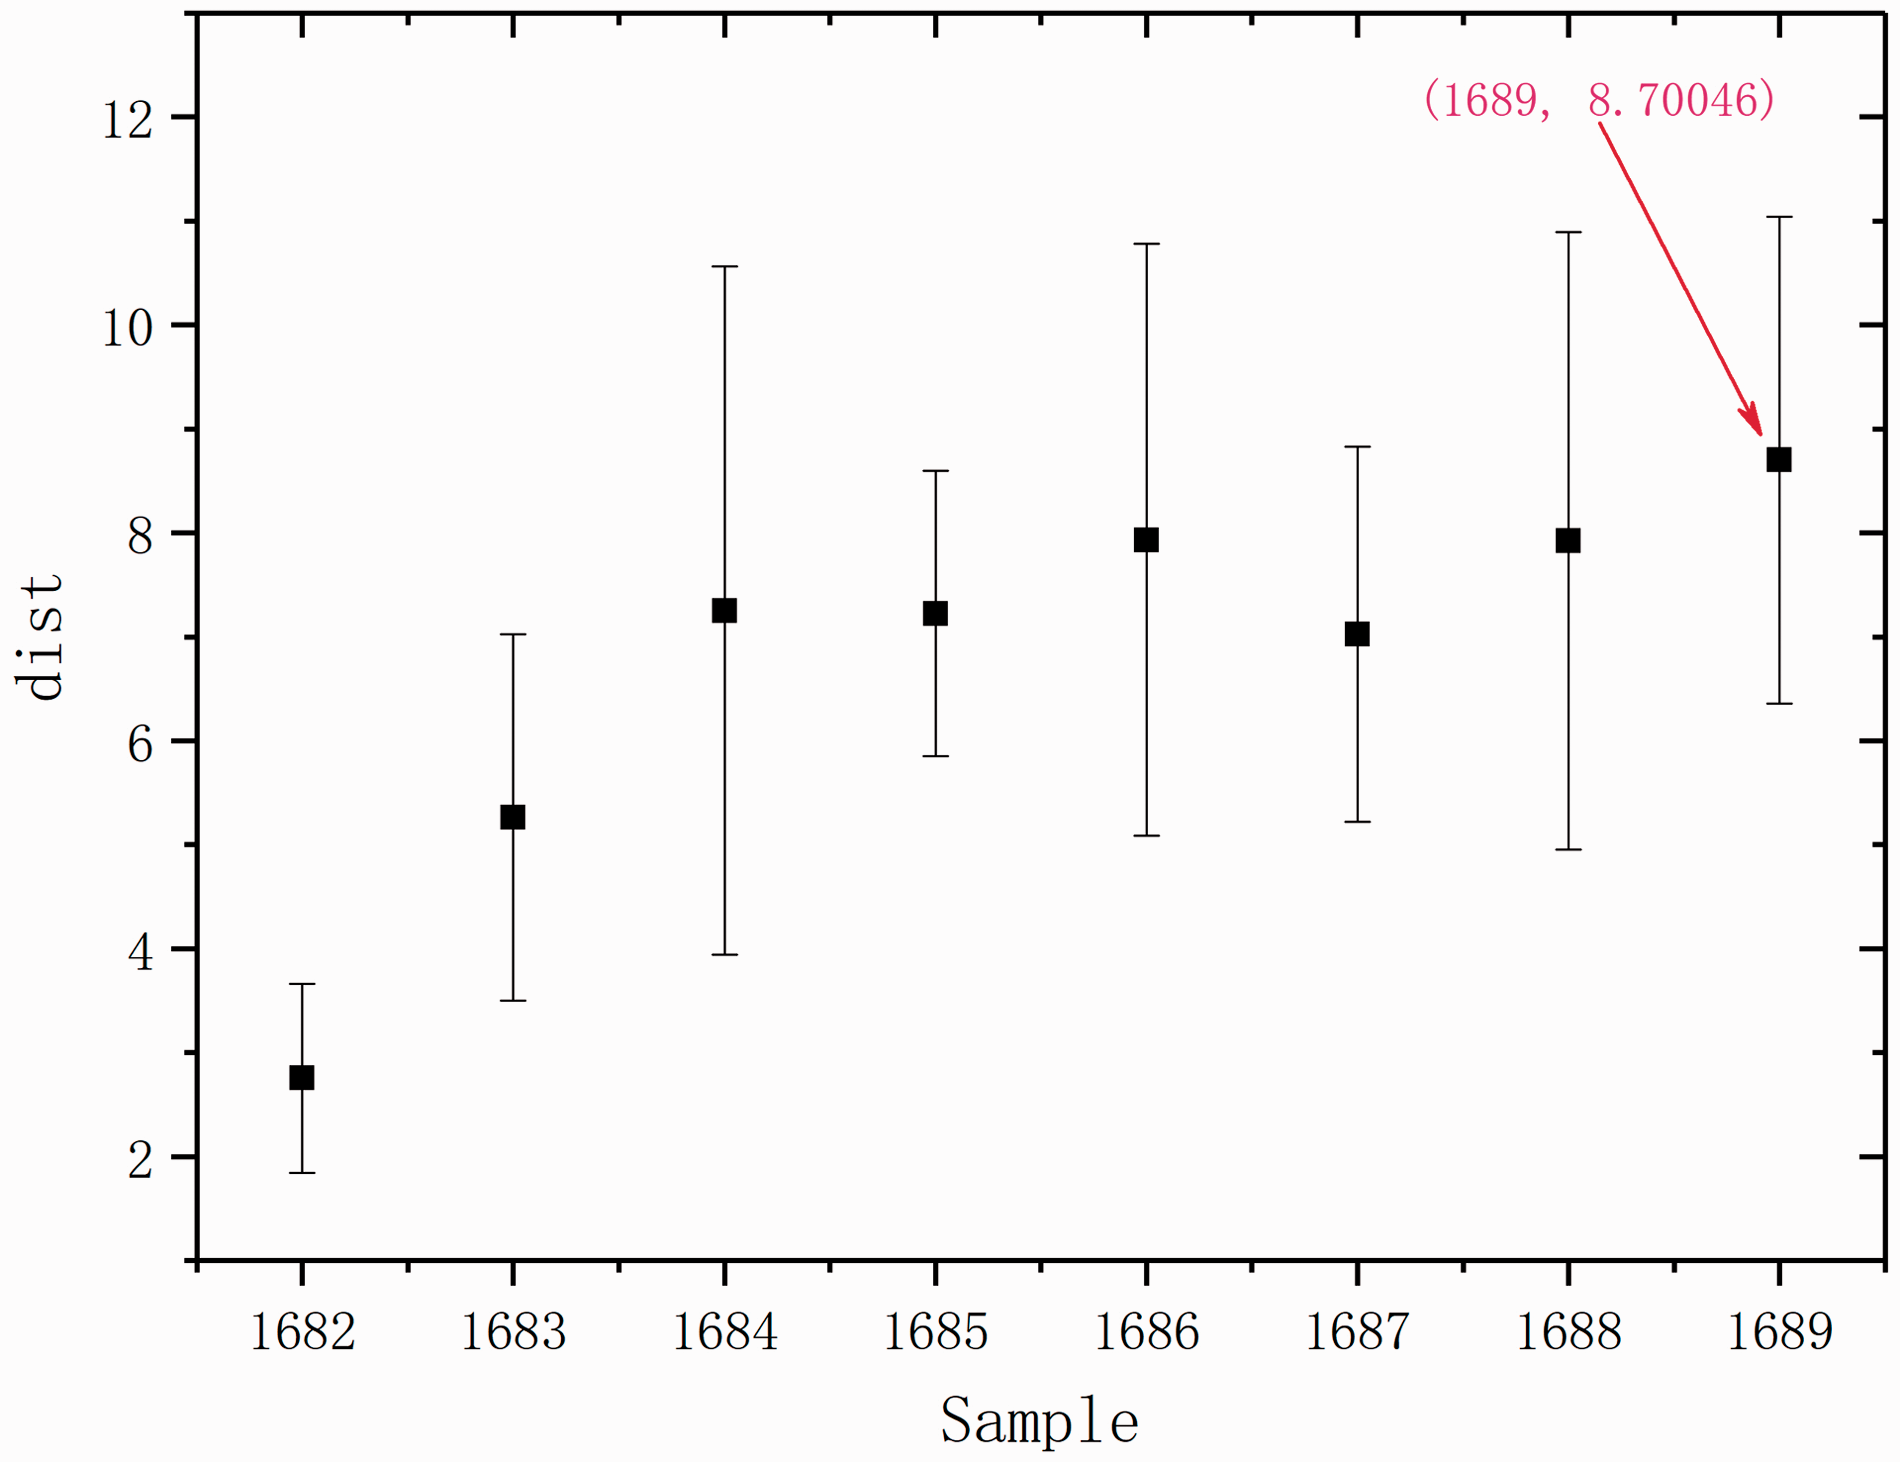
Conclusion
The main factors that limit the accuracy of CF-LIBS include the rare lines of trace elements, self-absorption of major element lines, and relative efficiency correction of the experiment system. The spectrum of major elements is used to calculate the electron density and plasma temperature, taking advantage of its strong signal and rich spectral lines. For three stainless-steel and five heat-resistant steel samples, the plasma temperature and electron density are relatively stable. Because of self-absorption and relative efficiency corrections, the results obtained by the original SRL method are very poor. In order to overcome the effects, the OPC method is used in the present work. Meanwhile, in order to verify the accuracy of the plasma temperature obtained by the pre-selection procedure, the Fe concentration from the intercept of the Saha–Boltzmann plot is also calculated. The calculated results show that the plasma temperature calculated by the pre-selection procedure is accurate. The sum of absolute errors from the latter two methods with OPC shows a distinct decrease relative to the original SRL method, but the difference between them is not obvious. The two methods allow us to use trace elements’ single spectra to calculate the concentration, without the need to construct their Boltzmann plot.
Supplemental Material
Supplemental material for Standard Reference Line Combined with One-Point Calibration-Free Laser-Induced Breakdown Spectroscopy (CF-LIBS) to Quantitatively Analyze Stainless and Heat Resistant Steel
Supplemental material for Standard Reference Line Combined with One-Point Calibration-Free Laser-Induced Breakdown Spectroscopy (CF-LIBS) to Quantitatively Analyze Stainless and Heat Resistant Steel by Hongbo Fu, Huadong Wang, Junwei Jia, Zhibo Ni and Fengzhong Dong in Applied Spectroscopy
Footnotes
Conflict of Interest
The authors report there are no conflicts of interest.
Funding
This work has been supported by the Young Scientists Fund of the National Natural Science Foundation of China (Grant no. 61505223).
Supplemental Material
All supplemental material mentioned in the text is available in the online version of the journal.
References
Supplementary Material
Please find the following supplemental material available below.
For Open Access articles published under a Creative Commons License, all supplemental material carries the same license as the article it is associated with.
For non-Open Access articles published, all supplemental material carries a non-exclusive license, and permission requests for re-use of supplemental material or any part of supplemental material shall be sent directly to the copyright owner as specified in the copyright notice associated with the article.